
아시아 태평양 피트니스 앱 시장, 제품별( 케어 관리 앱, 생명 징후 모니터링 앱, 건강 및 웰빙 앱, 여성 건강 앱, 약물 관리 앱, 컨설팅 앱 등), 유형(연결된 앱 및 내장 장치 앱), 애플리케이션(트레이닝, 추적, 피트니스 게임 등), 치료 영역(심혈관, 피부과 및 피부암, 안과, 당뇨병, 호흡기, 청각학 수면 장애, 영양 등), 운영 체제(iOS, Android, Windows), 구매 방식(구독 기반 및 비구독 기반), 최종 사용자(공급자, 홈 헬스케어, 기타), 유통 채널(직접 입찰 및 제3자 유통업체). 국가(일본, 호주, 인도, 한국, 싱가포르, 호주, 태국, 인도네시아, 필리핀, 홍콩, 기타 아시아 태평양 지역 - 산업 동향 및 예측 2021~2028
 시장 분석 및 통찰력: 아시아 태평양 피트니스 앱 시장
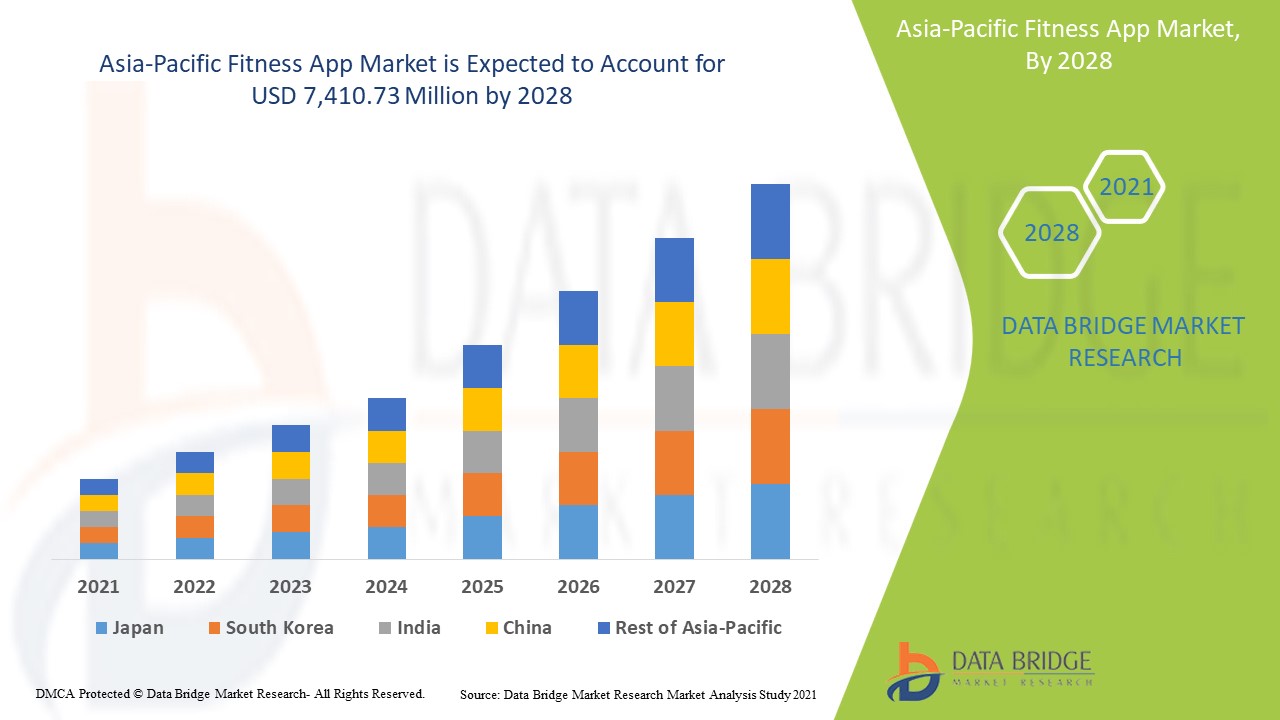
아시아 태평양 피트니스 앱 시장은 2021년부터 2028년까지의 예측 기간 동안 시장 성장을 이룰 것으로 예상됩니다. Data Bridge Market Research는 시장이 2021년부터 2028년까지의 예측 기간 동안 28.8%의 CAGR로 성장하고 있으며 2028년까지 7,410.73백만 달러에 도달할 것으로 예상된다고 분석했습니다. 만성 질환의 증가, 노령 인구, 질병의 조기 발견 및 치료에 대한 인식 증가는 예측 기간 동안 시장 수요를 견인할 주요 요인입니다.
피트니스 앱은 노트북, 휴대전화, 태블릿 등 스마트 기기에 다운로드할 수 있는 애플리케이션으로 정의됩니다. 안드로이드와 iPhone 운영 체제(iOS)를 포함한 두 가지 플랫폼에서 사용할 수 있습니다. 온라인 공중 보건 리소스(Health Works Collective)에 따르면, 태블릿과 모바일 기기에서 97,000개 이상의 피트니스 및 건강 앱을 사용할 수 있습니다. 게다가, 스마트폰 사용자의 약 52%가 기기를 통해 건강 관련 정보를 얻고, 약 15%의 사용자가 건강 앱을 설치한 18~29세입니다. 케어 관리 앱, 생체 신호 모니터링 앱, 건강 및 웰빙 앱, 여성 건강 앱, 약물 관리 앱, 컨설팅 앱 등 여러 유형의 피트니스 앱이 있습니다.
피트니스 앱 시장 보고서는 시장 점유율, 새로운 개발 및 제품 파이프라인 분석, 국내 및 지역 시장 참여자의 영향, 새로운 수익 창출, 시장 규정의 변화, 제품 승인, 전략적 의사 결정, 제품 출시, 지리적 확장 및 시장의 기술 혁신 측면에서의 분석 기회에 대한 세부 정보를 제공합니다. 분석 및 시장 시나리오를 이해하려면 분석가 브리핑을 위해 저희에게 연락하세요. 저희 팀은 원하는 목표를 달성하기 위한 수익 영향 솔루션을 만드는 데 도움을 드릴 것입니다.
 아시아 태평양 피트니스 앱 시장 범위 및 시장 규모
아시아 태평양 피트니스 앱 시장은 제품, 유형, 애플리케이션, 치료 영역, 운영 체제, 구매 방식, 최종 사용자, 유통 채널을 기준으로 8개의 주요 세그먼트로 분류됩니다.
- 제품 기준으로 아시아 태평양 피트니스 앱 시장은 케어 관리 앱, 생체 신호 모니터링 앱, 건강 및 웰빙 앱, 여성 건강 앱, 약물 관리 앱, 컨설팅 앱 등으로 세분화됩니다. 2021년에는 피트니스와 건강에 대한 인식이 높아지고 질병 유병률이 증가함에 따라 건강 및 웰빙 앱이 시장을 지배할 것으로 예상됩니다.
- 아시아 태평양 피트니스 앱 시장은 유형별로 커넥티드 앱과 내장 기기로 구분됩니다. 2021년에는 커넥티드 앱 세그먼트가 고령화 인구 증가와 기술 침투로 인해 시장을 지배할 것으로 예상됩니다.
- 응용 프로그램을 기준으로, 아시아 태평양 피트니스 앱 시장은 트레이닝, 추적, 피트니스 게임 등으로 세분화됩니다. 2021년에는 추적 세그먼트가 시장을 지배할 것으로 예상되는데, 정기적인 알림이 동기를 부여하고 일일 활동을 추적하는 것이 편리하기 때문입니다.
- 치료 영역을 기준으로 아시아 태평양 피트니스 앱 시장은 심혈관, 피부과 및 피부암, 안과, 당뇨병, 호흡기, 청각학, 수면 장애, 영양 및 기타로 세분화됩니다. 2021년에는 피트니스와 비만에 대한 인식이 높아짐에 따라 영양이 시장을 지배할 것으로 예상됩니다.
- 운영 체제 기준으로 아시아 태평양 피트니스 앱 시장은 iOS, 안드로이드, 윈도우로 구분됩니다. 2021년에는 다른 기술에 비해 IOS 사용자가 증가하고 iPhone에서 소비자가 보여주는 신뢰성이 상승함에 따라 IOS 세그먼트가 시장을 지배할 것으로 예상됩니다.
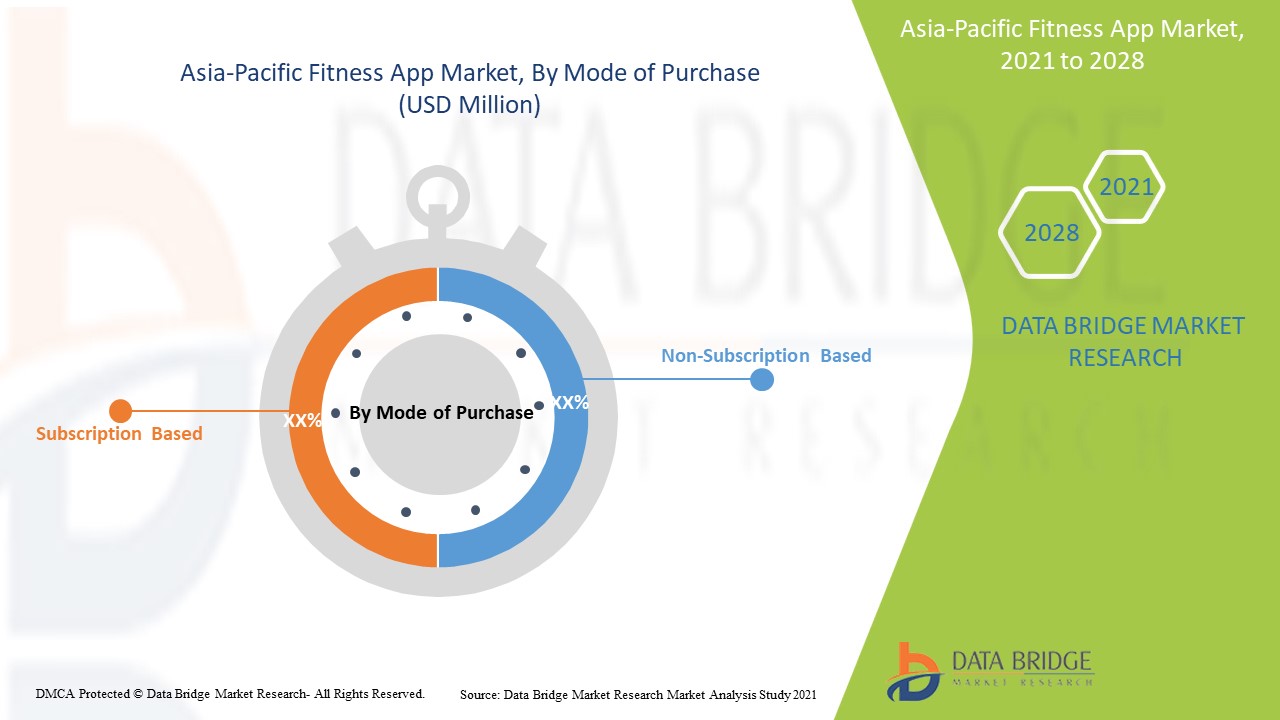
- 구매 방식을 기준으로 아시아 태평양 피트니스 앱 시장은 구독 기반 및 비구독 기반으로 세분화됩니다. 2021년에는 구독 기반 세그먼트가 비구독 기반 애플리케이션에 비해 더 많은 기능을 제공하고 구독 앱에서 데이터가 더 신뢰할 수 있기 때문에 시장을 지배할 것으로 예상됩니다.
- 최종 사용자를 기준으로 아시아 태평양 피트니스 앱 시장은 공급자, 홈 헬스케어 및 기타로 세분화됩니다. 2021년에는 전 세계적으로 헬스케어 센터 수가 증가함에 따라 공급자 부문이 시장을 지배할 것으로 예상됩니다.
- 유통 채널을 기준으로 아시아 태평양 피트니스 앱 시장은 제3자 유통업체와 직접 입찰로 세분화됩니다. 2021년에는 제3자 유통업체 부문이 전체 판매 유지로 인해 아시아 태평양 피트니스 앱 시장을 지배할 것으로 예상됩니다.
피트니스 앱 시장 국가 수준 분석
피트니스 앱 시장을 분석하고, 제품, 유형, 애플리케이션, 치료 영역, 운영 체제, 구매 방식, 최종 사용자 및 유통 채널에 대한 시장 규모 정보를 제공합니다.
피트니스 앱 시장 보고서에서 다루는 국가는 일본, 인도, 호주, 태국, 홍콩, 그리고 아시아 태평양의 나머지 지역입니다. 아시아 태평양 지역의 중국은 혁신적인 R&D와 신제품 출시 및 승인으로 인해 2021년에서 2028년까지 예측 기간 동안 가장 높은 성장률을 기록할 것으로 예상됩니다.
보고서의 국가 섹션은 또한 개별 시장 영향 요인과 국내 시장의 현재 및 미래 트렌드에 영향을 미치는 규제 변화를 제공합니다. 신규 판매, 교체 판매, 국가 인구 통계, 규제 조치 및 수출입 관세와 같은 데이터 포인트는 개별 국가의 시장 시나리오를 예측하는 데 사용되는 주요 포인터 중 일부입니다. 또한 아시아 태평양 브랜드의 존재 및 가용성과 지역 및 국내 브랜드와의 대규모 또는 희소한 경쟁으로 인해 직면한 과제, 판매 채널의 영향이 국가 데이터에 대한 예측 분석을 제공하는 동안 고려됩니다.
노령 인구의 증가와 비만 증가로 인해 피트니스 앱 제품 시장이 성장하고 있습니다.
피트니스 앱 시장은 또한 약물 판매, 진보의 영향, 기술, 피트니스 앱 시장에 대한 지원과 함께 규제 시나리오의 변화와 함께 모든 국가의 피트니스 앱 제품 산업 성장에 대한 자세한 시장 분석을 제공합니다. 데이터는 2010년부터 2019년까지의 과거 기간에 대해 제공됩니다.
경쟁 환경 및 피트니스 앱 시장 점유율 분석
피트니스 앱 시장 경쟁 구도는 경쟁자별 세부 정보를 제공합니다. 포함된 세부 정보는 회사 개요, 회사 재무, 창출된 수익, 시장 잠재력, 연구 개발 투자, 새로운 시장 이니셔티브, 생산 현장 및 시설, 회사의 강점과 약점, 제품 출시, 제품 시험 파이프라인, 제품 승인, 특허, 제품 폭과 범위, 애플리케이션 지배력, 기술 수명선 곡선입니다. 위에 제공된 데이터 포인트는 피트니스 앱 시장과 관련된 회사의 초점에만 관련이 있습니다.
피트니스 앱 시장 보고서에서 다루는 국가는 미국, 캐나다, 멕시코, 독일, 프랑스, 영국, 벨기에, 이탈리아, 스페인, 러시아, 터키, 네덜란드, 스위스, 기타 유럽, 일본, 중국, 한국, 인도, 호주, 싱가포르, 태국, 말레이시아, 인도네시아, 필리핀, 기타 아시아 태평양 지역, 브라질, 아르헨티나, 기타 남미 지역, 남아프리카 공화국, 사우디 아라비아, UAE, 이집트, 이스라엘, 기타 중동 및 아프리카 지역입니다.
전 세계 여러 회사가 다양한 제품 출시와 계약을 체결하면서 피트니스 앱 시장도 활성화되고 있습니다.
예를 들어,
- 2020년 8월, 8월에 Fitbit LLC는 Fitbit Sense를 출시했습니다. 이 신제품은 스마트워치에 혁신적인 센서와 소프트웨어 기술을 도입하여 스트레스를 관리하는 데 도움이 되며, 고급 심박수 추적 기술도 함께 제공합니다. 이를 통해 회사는 고급 제품을 통해 매출을 늘리고 시장에서 입지를 굳건히 할 수 있었습니다.
- 2020년 11월, Fitbit LLC는 기존 건강 기능을 확장하고 Fitbit Sense와 Fitbit Versa 3에 새로운 편의 기능을 제공하는 OS 5.1 소프트웨어 업데이트의 출시를 발표했습니다. 이 업데이트는 사용자의 웰빙을 관리하기 위해 SpO2를 추적하는 더 많은 방법을 제공했습니다. 이를 통해 회사는 혁신과 개발을 통해 성장할 수 있으며, 이는 회사의 제품 포트폴리오를 강화합니다.
협업, 제품 출시, 사업 확장, 수상 및 인정, 합작 투자 및 시장 참여자의 기타 전략은 피트니스 앱 시장에서 회사 시장을 강화하고 있으며, 이를 통해 기업이 피트니스 앱에 대한 제공 사항을 개선하는 데에도 도움이 됩니다.
SKU-
세계 최초의 시장 정보 클라우드 보고서에 온라인으로 접속하세요

- 대화형 데이터 분석 대시보드
- 높은 성장 잠재력 기회를 위한 회사 분석 대시보드
- 사용자 정의 및 질의를 위한 리서치 분석가 액세스
- 대화형 대시보드를 통한 경쟁자 분석
- 최신 뉴스, 업데이트 및 추세 분석
- 포괄적인 경쟁자 추적을 위한 벤치마크 분석의 힘 활용
목차
1 INTRODUCTION
1.1 OBJECTIVES OF THE STUDY
1.2 MARKET DEFINITION
1.3 OVERVIEW OF THE ASIA PACIFIC FITNESS APP MARKET
1.4 LIMITATIONS
1.5 MARKETS COVERED
2 ASIA PACIFIC FITNESS APP MARKET: SEGMENTATION
2.1 MARKETS COVERED
2.2 GEOGRAPHICAL SCOPE
2.3 YEARS CONSIDERED FOR THE STUDY
2.4 CURRENCY AND PRICING
2.5 DBMR TRIPOD DATA VALIDATION MODEL
2.6 PRIMARY INTERVIEWS WITH KEY OPINION LEADERS
2.7 MULTIVARIATE MODELLING
2.8 PRODUCT LIFELINE CURVE
2.9 DBMR MARKET POSITION GRID
2.1 VENDOR SHARE ANALYSIS
2.11 MARKET DISTRIBUTION CHANNEL COVERAGE GRID
2.12 SECONDARY SOURCES
2.13 ASSUMPTIONS
3 EXECUTIVE SUMMARY
4 PREMIUM INSIGHTS
4.1 PESTEL ANALYSIS
4.2 PORTER'S 5 FORCES
5 MARKET OVERVIEW
5.1 DRIVERS
5.1.1 GROWING POPULARITY OF THE INTERNET OF THINGS, AND CONNECTED DEVICES
5.1.2 RISING AWARENESS AND PREFERENCE FOR HOME HEALTHCARE
5.1.3 INCREASE IN THE NUMBER OF LIFESTYLE DISORDERS
5.1.4 INCREASING ADOPTION OF FITNESS GEARS
5.1.5 INCREASED TECHNOLOGICAL ADVANCEMENT
5.2 RESTRAINTS
5.2.1 HIGH COST OF DEVELOPMENT OF FITNESS APPS
5.2.2 TECHNICAL ISSUES IN THE FITNESS APPS
5.3 OPPORTUNITIES
5.3.1 RISING HEALTHCARE EXPENDITURE, AND DISPOSABLE INCOME
5.3.2 GROWING PENETRATION OF E-COMMERCE PLATFORMS, INTERNET, AND SMARTPHONES
5.3.3 MULTIPLE APPLICATION COVERAGE
5.4 CHALLENGES
5.4.1 HIGH COST ASSOCIATED WITH SMART WEARABLE TECHNOLOGIES, AND DEVICES
5.4.2 PATIENT INFORMATION PRIVACY POLICIES
6 IMPACT OF COVID-19 ON THE ASIA PACIFIC FITNESS APP MARKET
6.1 IMPACT ON PRICE
6.2 IMPACT ON DEMAND
6.3 IMPACT ON SUPPLY CHAIN
6.4 KEY INITIATIVES BY MARKET PLAYER DURING COVID-19
6.5 CONCLUSION:
7 ASIA PACIFIC FITNESS APP MARKET, BY PRODUCT
7.1 OVERVIEW
7.2 HEALTH AND WELLNESS APPS
7.3 WOMEN HEALTH APPS
7.4 CONSULTANCY APPS
7.5 MEDICATION MANAGEMENT APPS
7.6 CARE MANAGEMENT APPS
7.7 VITAL SIGNS MONITORING APPS
7.8 OTHERS
8 ASIA PACIFIC FITNESS APP MARKET, BY TYPE
8.1 OVERVIEW
8.2 CONNECTED APPS
8.2.1 BLOOD GLUCOSE METERS
8.2.2 PULSE OXIMETERS
8.2.3 MULTIPARAMETER TRACKERS
8.2.4 ECG MONITORS
8.2.5 BLOOD PRESSURE MONITORS
8.2.6 SLEEP APNEA MONITORS
8.2.7 PEAK FLOW METERS
8.2.8 NEUROLOGICAL MONITORING DEVICES
8.2.9 OTHERS
8.3 IN-BUILT DEVICES APPS
9 ASIA PACIFIC FITNESS APP MARKET, BY APPLICATION
9.1 OVERVIEW
9.2 TRACKING
9.2.1 ACTIVITY TRACKING
9.2.2 PERSONAL HEALTH RECORD APPS
9.2.3 CALORIE MONITORS
9.2.4 SLEEP MONITORING APPS
9.2.5 REMOTE MONITORING APPS
9.2.6 BLOOD PRESSURE MONITORS
9.2.7 BLOOD GLUCOSE METERS
9.2.8 CHRONIC DISEASE MANAGEMENT APPS
9.2.9 ECG MONITORS
9.2.10 PULSE OXIMETERS
9.2.11 OTHERS
9.3 TRAINING
9.4 FITNESS GAMES
9.5 OTHERS
10 ASIA PACIFIC FITNESS APP MARKET, BY THERAPEUTIC AREA
10.1 OVERVIEW
10.2 NUTRITION
10.3 SLEEP DISORDERS
10.4 DIABETES
10.5 RESPIRATORY
10.6 CARDIOVASCULAR
10.7 OPHTHALMOLOGY
10.8 AUDIOLOGY
10.9 DERMATOLOGY & SKIN CANCER
10.1 OTHERS
11 ASIA PACIFIC FITNESS APP MARKET, BY OPERATING SYSTEM
11.1 OVERVIEW
11.2 IOS
11.3 ANDROID
11.4 WINDOWS
12 ASIA PACIFIC FITNESS APP MARKET, BY MODE OF PURCHASE
12.1 OVERVIEW
12.2 SUBSCRIPTION BASED
12.3 NON-SUBSCRIPTION BASED
13 ASIA PACIFIC FITNESS APP MARKET, BY END USER
13.1 OVERVIEW
13.2 PROVIDERS
13.2.1 HOSPITALS
13.2.2 DIAGNOSTIC CENTERS
13.2.3 CLINICS
13.2.4 OTHERS
13.3 HOME HEALTHCARE
13.4 OTHERS
14 ASIA PACIFIC FITNESS APP MARKET, BY DISTRIBUTION CHANNEL
14.1 OVERVIEW
14.2 THIRD PARTY DISTRIBUTORS
14.3 DIRECT TENDER
15 ASIA PACIFIC FITNESS APP MARKET, BY REGION
15.1 ASIA-PACIFIC
15.1.1 CHINA
15.1.2 JAPAN
15.1.3 INDIA
15.1.4 SOUTH KOREA
15.1.5 AUSTRALIA
15.1.6 INDONESIA
15.1.7 PHILIPPINES
15.1.8 THAILAND
15.1.9 MALAYSIA
15.1.10 SINGAPORE
15.1.11 REST OF ASIA-PACIFIC
16 ASIA PACIFIC FITNESS APP MARKET: COMPANY LANDSCAPE
16.1 COMPANY SHARE ANALYSIS: ASIA PACIFIC
17 SWOT ANALYSIS
18 COMPANY PROFILE
18.1 FITBIT LLC
18.1.1 COMPANY SNAPSHOT
18.1.2 COMPANY SHARE ANALYSIS
18.1.3 PRODUCT PORTFOLIO
18.1.4 RECENT DEVELOPMENTS
18.2 CALM
18.2.1 COMPANY SNAPSHOT
18.2.2 COMPANY SHARE ANALYSIS
18.2.3 PRODUCT PORTFOLIO
18.3 HEADSPACE INC.
18.3.1 COMPANY SNAPSHOT
18.3.2 COMPANY SHARE ANALYSIS
18.3.3 PRODUCT PORTFOLIO
18.4 MYFITNESSPAL, INC.
18.4.1 COMPANY SNAPSHOT
18.4.2 COMPANY SHARE ANALYSIS
18.4.3 PRODUCT PORTFOLIO
18.4.4 RECENT DEVELOPMENT
18.5 STRAVA
18.5.1 COMPANY SNAPSHOT
18.5.2 COMPANY SHARE ANALYSIS
18.5.3 PRODUCT PORTFOLIO
18.6 ALLTRAILS, LLC
18.6.1 COMPANY SNAPSHOT
18.6.2 PRODUCT PORTFOLIO
18.6.3 RECENT DEVELOPMENTS
18.7 ASICS DIGITAL, INC. ( A SUBSIDIARY OF ASICS CORPORATION)
18.7.1 COMPANY SNAPSHOT
18.7.2 REVENUE ANALYSIS
18.7.3 PRODUCT PORTFOLIO
18.8 AZUMIO
18.8.1 COMPANY SNAPSHOT
18.8.2 PRODUCT PORTFOLIO
18.9 FIRSTHAND TECHNOLOGY INC.
18.9.1 COMPANY SNAPSHOT
18.9.2 PRODUCT PORTFOLIO
18.1 FITNESS22 LTD
18.10.1 COMPANY SNAPSHOT
18.10.2 PRODUCT PORTFOLIO
18.11 FITNOTES
18.11.1 COMPANY SNAPSHOT
18.11.2 PRODUCT PORTFOLIO
18.11.3 RECENT DEVELOPMENT
18.12 FREELETICS GMBH
18.12.1 COMPANY SNAPSHOT
18.12.2 PRODUCT PORTFOLIO
18.12.3 RECENT DEVELOPMENTS
18.13 GOOGLE
18.13.1 COMPANY SNAPSHOT
18.13.2 REVENUE ANALYSIS
18.13.3 PRODUCT PORTFOLIO
18.14 JEFIT, INC.
18.14.1 COMPANY SNAPSHOT
18.14.2 PRODUCT PORTFOLIO
18.15 KOMOOT
18.15.1 COMPANY SNAPSHOT
18.15.2 PRODUCT PORTFOLIO
18.15.3 RECENT DEVELOPMENTS
18.15.4 RECENT DEVELOPMENTS
18.15.4.1 PRODUCT UPDATE
18.16 LEAP FITNESS GROUP
18.16.1 COMPANY SNAPSHOT
18.16.2 PRODUCT PORTFOLIO
18.17 LIFESUM AB
18.17.1 COMPANY SNAPSHOT
18.17.2 PRODUCT PORTFOLIO
18.17.3 RECENT DEVELOPMENT
18.18 RUNTASTIC GMBH ( A SUBSIDIARY OF ADIDAS AG)
18.18.1 COMPANY SNAPSHOT
18.18.2 REVENUE ANALYSIS
18.18.3 PRODUCT PORTFOLIO
18.18.4 RECENT DEVELOPMENT
18.18.4.1 AWARENESS PROGRAMME
18.18.4.2 EVENT
18.19 STRONG FITNESS PTE LTD.
18.19.1 COMPANY SNAPSHOT
18.19.2 PRODUCT PORTFOLIO
18.2 YAZIO
18.20.1 COMPANY SNAPSHOT
18.20.2 PRODUCT PORTFOLIO
19 QUESTIONNAIRE
20 RELATED REPORTS
표 목록
TABLE 1 FITNESS AND HEALTH APP GROWTH, BY NUMBER OF DOWNLOADS (BETWEEN Q1 AND Q2 OF 2020)
TABLE 2 FITNESS AND HEALTH APP GROWTH, BY DAILY ACTIVE USERS (BETWEEN Q1 AND Q2 OF 2020)
TABLE 3 ASIA PACIFIC FITNESS APP MARKET, BY PRODUCT, 2019-2028 (USD MILLION)
TABLE 4 ASIA PACIFIC HEALTH AND WELLNESS APPS IN FITNESS APP MARKET, BY REGION, 2019-2028 (USD MILLION)
TABLE 5 ASIA PACIFIC WOMEN HEALTH APPS IN FITNESS APP MARKET, BY REGION, 2019-2028 (USD MILLION)
TABLE 6 ASIA PACIFIC CONSULTANCY APPS IN FITNESS APP MARKET, BY REGION, 2019-2028 (USD MILLION)
TABLE 7 ASIA PACIFIC MEDICATION MANAGEMENT APPS IN FITNESS APP MARKET, BY REGION, 2019-2028 (USD MILLION)
TABLE 8 ASIA PACIFIC CARE MANAGEMENT APPS IN FITNESS APP MARKET, BY REGION, 2019-2028 (USD MILLION)
TABLE 9 ASIA PACIFIC VITAL SIGNS MONITORING APPS IN FITNESS APP MARKET, BY REGION, 2019-2028 (USD MILLION)
TABLE 10 ASIA PACIFIC OTHERS IN FITNESS APP MARKET, BY REGION, 2019-2028 (USD MILLION)
TABLE 11 ASIA PACIFIC FITNESS APP MARKET, BY TYPE, 2019-2028 (USD MILLION)
TABLE 12 ASIA PACIFIC CONNECTED APPS IN FITNESS APP MARKET, BY REGION, 2019-2028 (USD MILLION)
TABLE 13 ASIA PACIFIC CONNECTED APPS IN FITNESS APP MARKET, BY TYPE, 2019-2028 (USD MILLION)
TABLE 14 ASIA PACIFIC IN-BUILT DEVICES APPS IN FITNESS APP MARKET, BY REGION, 2019-2028 (USD MILLION)
TABLE 15 ASIA PACIFIC FITNESS APP MARKET, BY APPLICATION, 2019-2028 (USD MILLION)
TABLE 16 ASIA PACIFIC TRACKING IN FITNESS APP MARKET, BY REGION, 2019-2028 (USD MILLION)
TABLE 17 ASIA PACIFIC TRACKING IN FITNESS APP MARKET, BY APPLICATION, 2019-2028 (USD MILLION)
TABLE 18 ASIA PACIFIC TRAINING IN FITNESS APP MARKET, BY REGION, 2019-2028 (USD MILLION)
TABLE 19 ASIA PACIFIC FITNESS GAMES IN FITNESS APP MARKET, BY REGION, 2019-2028 (USD MILLION)
TABLE 20 ASIA PACIFIC OTHERS IN FITNESS APP MARKET, BY REGION, 2019-2028 (USD MILLION)
TABLE 21 ASIA PACIFIC FITNESS APP MARKET, BY THERAPEUTIC AREA, 2019-2028 (USD MILLION)
TABLE 22 ASIA PACIFIC NUTRITION IN FITNESS APP MARKET, BY REGION, 2019-2028 (USD MILLION)
TABLE 23 ASIA PACIFIC SLEEP DISORDERS IN FITNESS APP MARKET, BY REGION, 2019-2028 (USD MILLION)
TABLE 24 ASIA PACIFIC DIABETES IN FITNESS APP MARKET, BY REGION, 2019-2028 (USD MILLION)
TABLE 25 ASIA PACIFIC RESPIRATORY IN FITNESS APP MARKET, BY REGION, 2019-2028 (USD MILLION)
TABLE 26 ASIA PACIFIC CARDIOVASCULAR IN FITNESS APP MARKET, BY REGION, 2019-2028 (USD MILLION)
TABLE 27 ASIA PACIFIC OPHTHALMOLOGY IN FITNESS APP MARKET, BY REGION, 2019-2028 (USD MILLION)
TABLE 28 ASIA PACIFIC AUDIOLOGY IN FITNESS APP MARKET, BY REGION, 2019-2028 (USD MILLION)
TABLE 29 ASIA PACIFIC DERMATOLOGY & SKIN CANCER IN FITNESS APP MARKET, BY REGION, 2019-2028 (USD MILLION)
TABLE 30 ASIA PACIFIC OTHERS IN FITNESS APP MARKET, BY REGION, 2019-2028 (USD MILLION)
TABLE 31 ASIA PACIFIC FITNESS APP MARKET, BY OPERATING SYSTEM, 2019-2028 (USD MILLION)
TABLE 32 ASIA PACIFIC IOS IN FITNESS APP MARKET, BY REGION, 2019-2028 (USD MILLION)
TABLE 33 ASIA PACIFIC ANDROID IN FITNESS APP MARKET, BY REGION, 2019-2028 (USD MILLION)
TABLE 34 ASIA PACIFIC WINDOWS IN FITNESS APP MARKET, BY REGION, 2019-2028 (USD MILLION)
TABLE 35 ASIA PACIFIC FITNESS APP MARKET, BY MODE OF PURCHASE, 2019-2028 (USD MILLION)
TABLE 36 ASIA PACIFIC SUBSCRIPTION BASED IN FITNESS APP MARKET, BY REGION, 2019-2028 (USD MILLION)
TABLE 37 ASIA PACIFIC NON-SUBSCRIPTION BASED IN FITNESS APP MARKET, BY REGION, 2019-2028 (USD MILLION)
TABLE 38 ASIA PACIFIC FITNESS APP MARKET, BY END USER, 2019-2028 (USD MILLION)
TABLE 39 ASIA PACIFIC PROVIDERS IN FITNESS APP MARKET, BY REGION, 2019-2028 (USD MILLION)
TABLE 40 ASIA PACIFIC PROVIDERS IN FITNESS APP MARKET, BY END USER, 2019-2028 (USD MILLION)
TABLE 41 ASIA PACIFIC HOME HEALTHCARE IN FITNESS APP MARKET, BY REGION, 2019-2028 (USD MILLION)
TABLE 42 ASIA PACIFIC OTHERS IN FITNESS APP MARKET, BY REGION, 2019-2028 (USD MILLION)
TABLE 43 ASIA PACIFIC FITNESS APP MARKET, BY DISTRIBUTION CHANNEL, 2019-2028 (USD MILLION)
TABLE 44 ASIA PACIFIC THIRD PARTY DISTRIBUTORS IN FITNESS APP MARKET, BY REGION, 2019-2028 (USD MILLION)
TABLE 45 ASIA PACIFIC DIRECT TENDER IN FITNESS APP MARKET, BY REGION, 2019-2028 (USD MILLION)
TABLE 46 ASIA-PACIFIC FITNESS APP MARKET, BY COUNTRY, 2019-2028 (USD MILLION)
TABLE 47 ASIA-PACIFIC FITNESS APP MARKET, BY PRODUCT, 2019-2028 (USD MILLION)
TABLE 48 ASIA-PACIFIC FITNESS APP MARKET, BY TYPE, 2019-2028 (USD MILLION)
TABLE 49 ASIA-PACIFIC CONNECTED APPS IN FITNESS APP MARKET, BY TYPE, 2019-2028 (USD MILLION)
TABLE 50 ASIA-PACIFIC FITNESS APP MARKET, BY APPLICATION, 2019-2028 (USD MILLION)
TABLE 51 ASIA-PACIFIC TRACKING IN FITNESS APP MARKET, BY APPLICATION , 2019-2028 (USD MILLION)
TABLE 52 ASIA-PACIFIC FITNESS APP MARKET, BY THERAPEUTIC AREA , 2019-2028 (USD MILLION)
TABLE 53 ASIA-PACIFIC FITNESS APP MARKET, BY OPERATING SYSTEM , 2019-2028 (USD MILLION)
TABLE 54 ASIA-PACIFIC FITNESS APP MARKET, BY MODE OF PURCHASE, 2019-2028 (USD MILLION)
TABLE 55 ASIA-PACIFIC FITNESS APP MARKET, BY END USER , 2019-2028 (USD MILLION)
TABLE 56 ASIA-PACIFIC PROVIDERS IN FITNESS APP MARKET, BY END USER , 2019-2028 (USD MILLION)
TABLE 57 ASIA-PACIFIC FITNESS APP MARKET, BY DISTRIBUTION CHANNEL, 2019-2028 (USD MILLION)
TABLE 58 CHINA FITNESS APP MARKET, BY PRODUCT, 2019-2028 (USD MILLION)
TABLE 59 CHINA FITNESS APP MARKET, BY TYPE, 2019-2028 (USD MILLION)
TABLE 60 CHINA CONNECTED APPS IN FITNESS APP MARKET, BY TYPE, 2019-2028 (USD MILLION)
TABLE 61 CHINA FITNESS APP MARKET, BY APPLICATION, 2019-2028 (USD MILLION)
TABLE 62 CHINA TRACKING IN FITNESS APP MARKET, BY APPLICATION , 2019-2028 (USD MILLION)
TABLE 63 CHINA FITNESS APP MARKET, BY THERAPEUTIC AREA , 2019-2028 (USD MILLION)
TABLE 64 CHINA FITNESS APP MARKET, BY OPERATING SYSTEM , 2019-2028 (USD MILLION)
TABLE 65 CHINA FITNESS APP MARKET, BY MODE OF PURCHASE 2019-2028 (USD MILLION)
TABLE 66 CHINA FITNESS APP MARKET, BY END USER , 2019-2028 (USD MILLION)
TABLE 67 CHINA PROVIDERS IN FITNESS APP MARKET, BY END USER , 2019-2028 (USD MILLION)
TABLE 68 CHINA FITNESS APP MARKET, BY DISTRIBUTION CHANNEL, 2019-2028 (USD MILLION)
TABLE 69 JAPAN FITNESS APP MARKET, BY PRODUCT, 2019-2028 (USD MILLION)
TABLE 70 JAPAN FITNESS APP MARKET, BY TYPE, 2019-2028 (USD MILLION)
TABLE 71 JAPAN CONNECTED APPS IN FITNESS APP MARKET, BY TYPE, 2019-2028 (USD MILLION)
TABLE 72 JAPAN FITNESS APP MARKET, BY APPLICATION, 2019-2028 (USD MILLION)
TABLE 73 JAPAN TRACKING IN FITNESS APP MARKET, BY APPLICATION , 2019-2028 (USD MILLION)
TABLE 74 JAPAN FITNESS APP MARKET, BY THERAPEUTIC AREA , 2019-2028 (USD MILLION)
TABLE 75 JAPAN FITNESS APP MARKET, BY OPERATING SYSTEM , 2019-2028 (USD MILLION)
TABLE 76 JAPAN FITNESS APP MARKET, BY MODE OF PURCHASE, 2019-2028 (USD MILLION)
TABLE 77 JAPAN FITNESS APP MARKET, BY END USER , 2019-2028 (USD MILLION)
TABLE 78 JAPAN PROVIDERS IN FITNESS APP MARKET, BY END USER , 2019-2028 (USD MILLION)
TABLE 79 JAPAN FITNESS APP MARKET, BY DISTRIBUTION CHANNEL, 2019-2028 (USD MILLION)
TABLE 80 INDIA FITNESS APP MARKET, BY PRODUCT, 2019-2028 (USD MILLION)
TABLE 81 INDIA FITNESS APP MARKET, BY TYPE, 2019-2028 (USD MILLION)
TABLE 82 INDIA CONNECTED APPS IN FITNESS APP MARKET, BY TYPE, 2019-2028 (USD MILLION)
TABLE 83 INDIA FITNESS APP MARKET, BY APPLICATION, 2019-2028 (USD MILLION)
TABLE 84 INDIA TRACKING IN FITNESS APP MARKET, BY APPLICATION , 2019-2028 (USD MILLION)
TABLE 85 INDIA FITNESS APP MARKET, BY THERAPEUTIC AREA , 2019-2028 (USD MILLION)
TABLE 86 INDIA FITNESS APP MARKET, BY OPERATING SYSTEM , 2019-2028 (USD MILLION)
TABLE 87 INDIA FITNESS APP MARKET, BY MODE OF PURCHASE 2019-2028 (USD MILLION)
TABLE 88 INDIA FITNESS APP MARKET, BY END USER , 2019-2028 (USD MILLION)
TABLE 89 INDIA PROVIDERS IN FITNESS APP MARKET, BY END USER , 2019-2028 (USD MILLION)
TABLE 90 INDIA FITNESS APP MARKET, BY DISTRIBUTION CHANNEL, 2019-2028 (USD MILLION)
TABLE 91 SOUTH KOREA FITNESS APP MARKET, BY PRODUCT, 2019-2028 (USD MILLION)
TABLE 92 SOUTH KOREA FITNESS APP MARKET, BY TYPE, 2019-2028 (USD MILLION)
TABLE 93 SOUTH KOREA CONNECTED APPS IN FITNESS APP MARKET, BY TYPE, 2019-2028 (USD MILLION)
TABLE 94 SOUTH KOREA FITNESS APP MARKET, BY APPLICATION, 2019-2028 (USD MILLION)
TABLE 95 SOUTH KOREA TRACKING IN FITNESS APP MARKET, BY APPLICATION , 2019-2028 (USD MILLION)
TABLE 96 SOUTH KOREA FITNESS APP MARKET, BY THERAPEUTIC AREA , 2019-2028 (USD MILLION)
TABLE 97 SOUTH KOREA FITNESS APP MARKET, BY OPERATING SYSTEM , 2019-2028 (USD MILLION)
TABLE 98 SOUTH KOREA FITNESS APP MARKET, BY MODE OF PURCHASE 2019-2028 (USD MILLION)
TABLE 99 SOUTH KOREA FITNESS APP MARKET, BY END USER , 2019-2028 (USD MILLION)
TABLE 100 SOUTH KOREA PROVIDERS IN FITNESS APP MARKET, BY END USER , 2019-2028 (USD MILLION)
TABLE 101 SOUTH KOREA FITNESS APP MARKET, BY DISTRIBUTION CHANNEL, 2019-2028 (USD MILLION)
TABLE 102 AUSTRALIA FITNESS APP MARKET, BY PRODUCT, 2019-2028 (USD MILLION)
TABLE 103 AUSTRALIA FITNESS APP MARKET, BY TYPE, 2019-2028 (USD MILLION)
TABLE 104 AUSTRALIA CONNECTED APPS IN FITNESS APP MARKET, BY TYPE, 2019-2028 (USD MILLION)
TABLE 105 AUSTRALIA FITNESS APP MARKET, BY APPLICATION, 2019-2028 (USD MILLION)
TABLE 106 AUSTRALIA TRACKING IN FITNESS APP MARKET, BY APPLICATION , 2019-2028 (USD MILLION)
TABLE 107 AUSTRALIA FITNESS APP MARKET, BY THERAPEUTIC AREA , 2019-2028 (USD MILLION)
TABLE 108 AUSTRALIA FITNESS APP MARKET, BY OPERATING SYSTEM , 2019-2028 (USD MILLION)
TABLE 109 AUSTRALIA FITNESS APP MARKET, BY MODE OF PURCHASE 2019-2028 (USD MILLION)
TABLE 110 AUSTRALIA FITNESS APP MARKET, BY END USER , 2019-2028 (USD MILLION)
TABLE 111 AUSTRALIA PROVIDERS IN FITNESS APP MARKET, BY END USER , 2019-2028 (USD MILLION)
TABLE 112 AUSTRALIA FITNESS APP MARKET, BY DISTRIBUTION CHANNEL, 2019-2028 (USD MILLION)
TABLE 113 INDONESIA FITNESS APP MARKET, BY PRODUCT, 2019-2028 (USD MILLION)
TABLE 114 INDONESIA FITNESS APP MARKET, BY TYPE, 2019-2028 (USD MILLION)
TABLE 115 INDONESIA CONNECTED APPS IN FITNESS APP MARKET, BY TYPE, 2019-2028 (USD MILLION)
TABLE 116 INDONESIA FITNESS APP MARKET, BY APPLICATION, 2019-2028 (USD MILLION)
TABLE 117 INDONESIA TRACKING IN FITNESS APP MARKET, BY APPLICATION , 2019-2028 (USD MILLION)
TABLE 118 INDONESIA FITNESS APP MARKET, BY THERAPEUTIC AREA , 2019-2028 (USD MILLION)
TABLE 119 INDONESIA FITNESS APP MARKET, BY OPERATING SYSTEM , 2019-2028 (USD MILLION)
TABLE 120 INDONESIA FITNESS APP MARKET, BY MODE OF PURCHASE 2019-2028 (USD MILLION)
TABLE 121 INDONESIA FITNESS APP MARKET, BY END USER , 2019-2028 (USD MILLION)
TABLE 122 INDONESIA PROVIDERS IN FITNESS APP MARKET, BY END USER , 2019-2028 (USD MILLION)
TABLE 123 INDONESIA FITNESS APP MARKET, BY DISTRIBUTION CHANNEL, 2019-2028 (USD MILLION)
TABLE 124 PHILIPPINES FITNESS APP MARKET, BY PRODUCT, 2019-2028 (USD MILLION)
TABLE 125 PHILIPPINES FITNESS APP MARKET, BY TYPE, 2019-2028 (USD MILLION)
TABLE 126 PHILIPPINES CONNECTED APPS IN FITNESS APP MARKET, BY TYPE, 2019-2028 (USD MILLION)
TABLE 127 PHILIPPINES FITNESS APP MARKET, BY APPLICATION, 2019-2028 (USD MILLION)
TABLE 128 PHILIPPINES TRACKING IN FITNESS APP MARKET, BY APPLICATION , 2019-2028 (USD MILLION)
TABLE 129 PHILIPPINES FITNESS APP MARKET, BY THERAPEUTIC AREA , 2019-2028 (USD MILLION)
TABLE 130 PHILIPPINES FITNESS APP MARKET, BY OPERATING SYSTEM , 2019-2028 (USD MILLION)
TABLE 131 PHILIPPINES FITNESS APP MARKET, BY MODE OF PURCHASE 2019-2028 (USD MILLION)
TABLE 132 PHILIPPINES FITNESS APP MARKET, BY END USER , 2019-2028 (USD MILLION)
TABLE 133 PHILIPPINES PROVIDERS IN FITNESS APP MARKET, BY END USER , 2019-2028 (USD MILLION)
TABLE 134 PHILIPPINES FITNESS APP MARKET, BY DISTRIBUTION CHANNEL, 2019-2028 (USD MILLION)
TABLE 135 THAILAND FITNESS APP MARKET, BY PRODUCT, 2019-2028 (USD MILLION)
TABLE 136 THAILAND FITNESS APP MARKET, BY TYPE, 2019-2028 (USD MILLION)
TABLE 137 THAILAND CONNECTED APPS IN FITNESS APP MARKET BY TYPE, 2019-2028 (USD MILLION)
TABLE 138 THAILAND FITNESS APP MARKET, BY APPLICATION, 2019-2028 (USD MILLION)
TABLE 139 THAILAND TRACKING IN FITNESS APP MARKET, BY APPLICATION , 2019-2028 (USD MILLION)
TABLE 140 THAILAND FITNESS APP MARKET, BY THERAPEUTIC AREA , 2019-2028 (USD MILLION)
TABLE 141 THAILAND FITNESS APP MARKET, BY OPERATING SYSTEM , 2019-2028 (USD MILLION)
TABLE 142 THAILAND FITNESS APP MARKET, BY MODE OF PURCHASE 2019-2028 (USD MILLION)
TABLE 143 THAILAND FITNESS APP MARKET, BY END USER , 2019-2028 (USD MILLION)
TABLE 144 THAILAND PROVIDERS IN FITNESS APP MARKET, BY END USER , 2019-2028 (USD MILLION)
TABLE 145 THAILAND FITNESS APP MARKET, BY DISTRIBUTION CHANNEL, 2019-2028 (USD MILLION)
TABLE 146 MALAYSIA FITNESS APP MARKET, BY PRODUCT, 2019-2028 (USD MILLION)
TABLE 147 MALAYSIA FITNESS APP MARKET, BY TYPE, 2019-2028 (USD MILLION)
TABLE 148 MALAYSIA CONNECTED APPS IN FITNESS APP MARKET, BY TYPE, 2019-2028 (USD MILLION)
TABLE 149 MALAYSIA FITNESS APP MARKET, BY APPLICATION, 2019-2028 (USD MILLION)
TABLE 150 MALAYSIA TRACKING IN FITNESS APP MARKET, BY APPLICATION , 2019-2028 (USD MILLION)
TABLE 151 MALAYSIA FITNESS APP MARKET, BY THERAPEUTIC AREA , 2019-2028 (USD MILLION)
TABLE 152 MALAYSIA FITNESS APP MARKET, BY OPERATING SYSTEM , 2019-2028 (USD MILLION)
TABLE 153 MALAYSIA FITNESS APP MARKET, BY MODE OF PURCHASE 2019-2028 (USD MILLION)
TABLE 154 MALAYSIA FITNESS APP MARKET, BY END USER , 2019-2028 (USD MILLION)
TABLE 155 MALAYSIA PROVIDERS IN FITNESS APP MARKET, BY END USER , 2019-2028 (USD MILLION)
TABLE 156 MALAYSIA FITNESS APP MARKET, BY DISTRIBUTION CHANNEL, 2019-2028 (USD MILLION)
TABLE 157 SINGAPORE FITNESS APP MARKET, BY PRODUCT, 2019-2028 (USD MILLION)
TABLE 158 SINGAPORE FITNESS APP MARKET, BY TYPE, 2019-2028 (USD MILLION)
TABLE 159 SINGAPORE CONNECTED APPS IN FITNESS APP MARKET, BY TYPE, 2019-2028 (USD MILLION)
TABLE 160 SINGAPORE FITNESS APP MARKET, BY APPLICATION, 2019-2028 (USD MILLION)
TABLE 161 SINGAPORE TRACKING IN FITNESS APP MARKET, BY APPLICATION , 2019-2028 (USD MILLION)
TABLE 162 SINGAPORE FITNESS APP MARKET, BY THERAPEUTIC AREA , 2019-2028 (USD MILLION)
TABLE 163 SINGAPORE FITNESS APP MARKET, BY OPERATING SYSTEM , 2019-2028 (USD MILLION)
TABLE 164 SINGAPORE FITNESS APP MARKET, BY MODE OF PURCHASE 2019-2028 (USD MILLION)
TABLE 165 SINGAPORE FITNESS APP MARKET, BY END USER , 2019-2028 (USD MILLION)
TABLE 166 SINGAPORE PROVIDERS IN FITNESS APP MARKET, BY END USER , 2019-2028 (USD MILLION)
TABLE 167 SINGAPORE FITNESS APP MARKET, BY DISTRIBUTION CHANNEL, 2019-2028 (USD MILLION)
TABLE 168 REST OF ASIA-PACIFIC FITNESS APP MARKET, BY PRODUCT, 2019-2028 (USD MILLION)
그림 목록
FIGURE 1 ASIA PACIFIC FITNESS APP MARKET: SEGMENTATION
FIGURE 2 ASIA PACIFIC FITNESS APP MARKET: DATA TRIANGULATION
FIGURE 3 ASIA PACIFIC FITNESS APP MARKET: DROC ANALYSIS
FIGURE 4 ASIA PACIFIC FITNESS APP MARKET: ASIA PACIFIC VS REGIONAL ANALYSIS
FIGURE 5 ASIA PACIFIC FITNESS APP MARKET: COMPANY RESEARCH ANALYSIS
FIGURE 6 ASIA PACIFIC FITNESS APP MARKET: INTERVIEW DEMOGRAPHICS
FIGURE 7 ASIA PACIFIC FITNESS APP MARKET: DBMR MARKET POSITION GRID
FIGURE 8 ASIA PACIFIC FITNESS APP MARKET: VENDOR SHARE ANALYSIS
FIGURE 9 ASIA PACIFIC FITNESS APP MARKET: MARKET DISTRIBUTION CHANNEL COVERAGE GRID
FIGURE 10 ASIA PACIFIC FITNESS APP MARKET: SEGMENTATION
FIGURE 11 THE GROWING POPULARITY OF THE INTERNET OF THINGS, AND CONNECTED DEVICES IS EXPECTED TO DRIVE THE ASIA PACIFIC FITNESS APP MARKET IN THE FORECAST PERIOD OF 2021 TO 2028
FIGURE 12 HEALTH AND WELLNESS APPS SEGMENT IS EXPECTED TO ACCOUNT FOR THE LARGEST SHARE OF THE ASIA PACIFIC FITNESS APP MARKET IN 2021 & 2028
FIGURE 13 NORTH AMERICA IS EXPECTED TO DOMINATE THE ASIA PACIFIC FITNESS APP MARKET AND, ASIA-PACIFIC IS EXPECTED TO GROW WITH THE HIGHEST CAGR IN THE FORECAST PERIOD OF 2021 TO 2028
FIGURE 14 DRIVERS, RESTRAINT, OPPORTUNITIES, AND CHALLENGE OF ASIA PACIFIC FITNESS APP MARKET
FIGURE 15 PERCENTAGE OF INTERNET USERS IN 2016 AND 2019
FIGURE 16 DEATH CAUSE IN EUROPEAN UNION IN 2016
FIGURE 17 PROJECTED NUMBER OF PEOPLE WITH CHRONIC CONDITIONS (IN MILLION)
FIGURE 18 ASIA PACIFIC FITNESS APP MARKET: BY PRODUCT, 2020
FIGURE 19 ASIA PACIFIC FITNESS APP MARKET: BY PRODUCT, 2021-2028 (USD MILLION)
FIGURE 20 ASIA PACIFIC FITNESS APP MARKET: BY PRODUCT, CAGR (2021-2028)
FIGURE 21 ASIA PACIFIC FITNESS APP MARKET: BY PRODUCT, LIFELINE CURVE
FIGURE 22 ASIA PACIFIC FITNESS APP MARKET: BY TYPE, 2020
FIGURE 23 ASIA PACIFIC FITNESS APP MARKET: BY TYPE, 2021-2028 (USD MILLION)
FIGURE 24 ASIA PACIFIC FITNESS APP MARKET: BY TYPE, CAGR (2021-2028)
FIGURE 25 ASIA PACIFIC FITNESS APP MARKET: BY TYPE, LIFELINE CURVE
FIGURE 26 ASIA PACIFIC FITNESS APP MARKET: BY APPLICATION, 2020
FIGURE 27 ASIA PACIFIC FITNESS APP MARKET: BY APPLICATION, 2021-2028 (USD MILLION)
FIGURE 28 ASIA PACIFIC FITNESS APP MARKET: BY APPLICATION, CAGR (2021-2028)
FIGURE 29 ASIA PACIFIC FITNESS APP MARKET: BY APPLICATION, LIFELINE CURVE
FIGURE 30 ASIA PACIFIC FITNESS APP MARKET: BY THERAPEUTIC AREA, 2020
FIGURE 31 ASIA PACIFIC FITNESS APP MARKET: BY THERAPEUTIC AREA, 2021-2028 (USD MILLION)
FIGURE 32 ASIA PACIFIC FITNESS APP MARKET: BY THERAPEUTIC AREA, CAGR (2021-2028)
FIGURE 33 ASIA PACIFIC FITNESS APP MARKET: BY THERAPEUTIC AREA, LIFELINE CURVE
FIGURE 34 ASIA PACIFIC FITNESS APP MARKET: BY OPERATING SYSTEM, 2020
FIGURE 35 ASIA PACIFIC FITNESS APP MARKET: BY OPERATING SYSTEM, 2021-2028 (USD MILLION)
FIGURE 36 ASIA PACIFIC FITNESS APP MARKET: BY OPERATING SYSTEM, CAGR (2021-2028)
FIGURE 37 ASIA PACIFIC FITNESS APP MARKET: BY OPERATING SYSTEM, LIFELINE CURVE
FIGURE 38 ASIA PACIFIC FITNESS APP MARKET: BY MODE OF PURCHASE, 2020
FIGURE 39 ASIA PACIFIC FITNESS APP MARKET: BY MODE OF PURCHASE, 2021-2028 (USD MILLION)
FIGURE 40 ASIA PACIFIC FITNESS APP MARKET: BY MODE OF PURCHASE, CAGR (2021-2028)
FIGURE 41 ASIA PACIFIC FITNESS APP MARKET: BY MODE OF PURCHASE, LIFELINE CURVE
FIGURE 42 ASIA PACIFIC FITNESS APP MARKET: BY END USER, 2020
FIGURE 43 ASIA PACIFIC FITNESS APP MARKET: BY END USER, 2021-2028 (USD MILLION)
FIGURE 44 ASIA PACIFIC FITNESS APP MARKET: BY END USER, CAGR (2021-2028)
FIGURE 45 ASIA PACIFIC FITNESS APP MARKET: BY END USER, LIFELINE CURVE
FIGURE 46 ASIA PACIFIC FITNESS APP MARKET: BY DISTRIBUTION CHANNEL, 2020
FIGURE 47 ASIA PACIFIC FITNESS APP MARKET: BY DISTRIBUTION CHANNEL, 2021-2028 (USD MILLION)
FIGURE 48 ASIA PACIFIC FITNESS APP MARKET: BY DISTRIBUTION CHANNEL, CAGR (2021-2028)
FIGURE 49 ASIA PACIFIC FITNESS APP MARKET: BY DISTRIBUTION CHANNEL, LIFELINE CURVE
FIGURE 50 ASIA-PACIFIC FITNESS APP MARKET: SNAPSHOT (2020)
FIGURE 51 ASIA-PACIFIC FITNESS APP MARKET: BY COUNTRY (2020)
FIGURE 52 ASIA-PACIFIC FITNESS APP MARKET: BY COUNTRY (2021 & 2028)
FIGURE 53 ASIA-PACIFIC FITNESS APP MARKET: BY COUNTRY (2020 & 2028)
FIGURE 54 ASIA-PACIFIC FITNESS APP MARKET: BY PRODUCT (2021-2028)
FIGURE 55 ASIA PACIFIC FITNESS APP MARKET: COMPANY SHARE 2020 (%)
연구 방법론
데이터 수집 및 기준 연도 분석은 대규모 샘플 크기의 데이터 수집 모듈을 사용하여 수행됩니다. 이 단계에는 다양한 소스와 전략을 통해 시장 정보 또는 관련 데이터를 얻는 것이 포함됩니다. 여기에는 과거에 수집한 모든 데이터를 미리 검토하고 계획하는 것이 포함됩니다. 또한 다양한 정보 소스에서 발견되는 정보 불일치를 검토하는 것도 포함됩니다. 시장 데이터는 시장 통계 및 일관된 모델을 사용하여 분석하고 추정합니다. 또한 시장 점유율 분석 및 주요 추세 분석은 시장 보고서의 주요 성공 요인입니다. 자세한 내용은 분석가에게 전화를 요청하거나 문의 사항을 드롭하세요.
DBMR 연구팀에서 사용하는 주요 연구 방법론은 데이터 마이닝, 시장에 대한 데이터 변수의 영향 분석 및 주요(산업 전문가) 검증을 포함하는 데이터 삼각 측량입니다. 데이터 모델에는 공급업체 포지셔닝 그리드, 시장 타임라인 분석, 시장 개요 및 가이드, 회사 포지셔닝 그리드, 특허 분석, 가격 분석, 회사 시장 점유율 분석, 측정 기준, 글로벌 대 지역 및 공급업체 점유율 분석이 포함됩니다. 연구 방법론에 대해 자세히 알아보려면 문의를 통해 업계 전문가에게 문의하세요.
사용자 정의 가능
Data Bridge Market Research는 고급 형성 연구 분야의 선두 주자입니다. 저희는 기존 및 신규 고객에게 목표에 맞는 데이터와 분석을 제공하는 데 자부심을 느낍니다. 보고서는 추가 국가에 대한 시장 이해(국가 목록 요청), 임상 시험 결과 데이터, 문헌 검토, 재생 시장 및 제품 기반 분석을 포함하도록 사용자 정의할 수 있습니다. 기술 기반 분석에서 시장 포트폴리오 전략에 이르기까지 타겟 경쟁업체의 시장 분석을 분석할 수 있습니다. 귀하가 원하는 형식과 데이터 스타일로 필요한 만큼 많은 경쟁자를 추가할 수 있습니다. 저희 분석가 팀은 또한 원시 엑셀 파일 피벗 테이블(팩트북)로 데이터를 제공하거나 보고서에서 사용 가능한 데이터 세트에서 프레젠테이션을 만드는 데 도움을 줄 수 있습니다.

