

世界の板ガラス市場規模、シェア、トレンド分析レポート
Market Size in USD Billion
CAGR :
% 
 USD
240.52 Billion
USD
422.62 Billion
2024
2032
USD
240.52 Billion
USD
422.62 Billion
2024
2032
| 2025 –2032 | |
| USD 240.52 Billion | |
| USD 422.62 Billion | |
| % | |
|
世界の板ガラス市場区分、タイプ別(フロートガラス、超透明ガラス、透明ガラス、鋳造ガラス、着色ガラス、網入りガラス、特殊板ガラス、模様付きガラスまたはテクスチャ付きガラス、吹き板ガラス、その他)、機能別(UVフィルターガラス、断熱ガラス、安全ガラス、防音ガラス、セルフクリーニングガラス、イオン交換ガラス、その他)、製品別(コーティング付きおよびコーティングなし)、用途別(建築、自動車、航空宇宙、電子機器、太陽エネルギー、家具、その他) - 2032年までの業界動向および予測
板ガラス市場規模
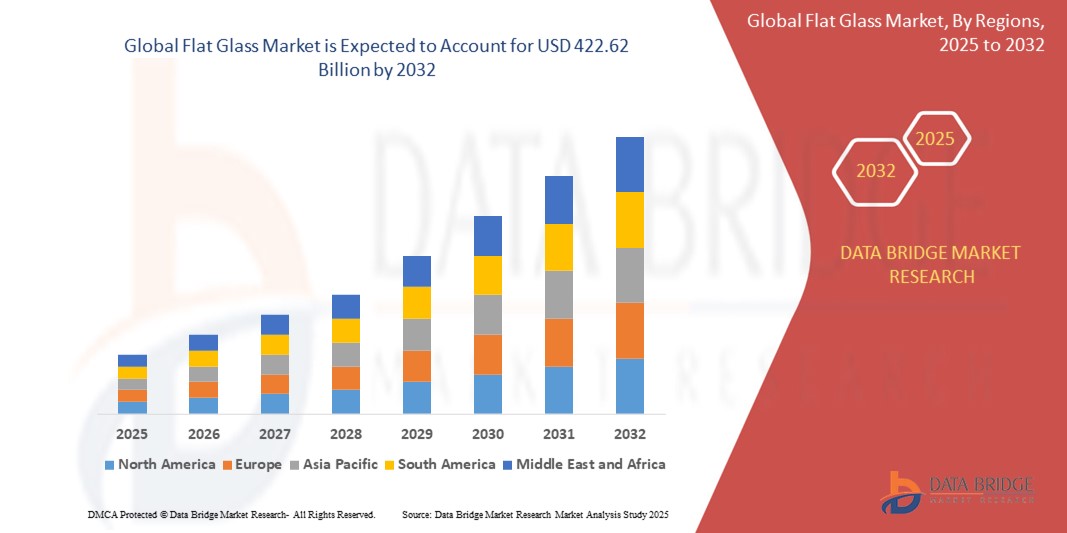
- 世界の板ガラス市場規模は2024年に2,405.2億米ドルと評価され、予測期間中に7.3%のCAGRで成長し、2032年には4,226.2億米ドル に達すると予想されています。
- 市場の成長は、主に建設、自動車、太陽エネルギー部門からの需要の増加によって推進されており、世界的なインフラ開発とエネルギー効率の高い建物への投資の増加が牽引している。
- さらに、グリーンビルディングやスマートシティへの移行により、耐久性、断熱性、太陽光制御機能が向上した高性能板ガラス製品の採用が促進されています。
板ガラス市場分析
- 住宅や商業ビルの断熱性と安全性を高める高度なグレージングシステムの採用が増えているため、市場は大きな勢いを見せています。
- スマートガラス、合わせガラス、コーティングガラスなどの技術革新は、輸送や再生可能エネルギーを含む複数の業界で人気が高まっています。
- アジア太平洋地域は、堅調な建設活動、自動車生産の増加、中国やインドなどの国々での太陽エネルギーイニシアチブの拡大により、2024年に板ガラス市場で最大の収益シェア42.87%を占めました。
- ヨーロッパ地域は、厳格なエネルギー効率規制、急速なインフラ整備、ドイツ、フランス、英国などの国々における持続可能な建築材料の採用増加により、世界の板ガラス市場で最も高い成長率を示すことが予想されています。
- フロートガラスは、その汎用性、コスト効率、そして建設・自動車分野における幅広い用途により、2024年には46.3%という最大の収益シェアで市場を席巻しました。フロートガラスは、均一な厚さ、滑らかな表面、そして合わせガラスや強化ガラスへの加工の容易さから広く好まれており、ドア、窓、ファサードなどへの用途拡大に貢献しています。また、幅広いコーティングや仕上げとの適合性も高く、建築用途や太陽光発電用途における需要をさらに高めています。
レポートの範囲と板ガラス市場のセグメンテーション
|
属性 |
板ガラスの主要市場分析 |
|
対象セグメント |
|
|
対象国 |
北米
ヨーロッパ
アジア太平洋
中東およびアフリカ
南アメリカ
|
|
主要な市場プレーヤー |
|
|
市場機会 |
|
|
付加価値データ情報セット |
データブリッジマーケットリサーチがまとめた市場レポートには、市場価値、成長率、セグメンテーション、地理的範囲、主要プレーヤーなどの市場シナリオに関する洞察に加えて、輸出入分析、生産能力概要、生産消費分析、価格動向分析、気候変動シナリオ、サプライチェーン分析、バリューチェーン分析、原材料/消耗品概要、ベンダー選択基準、PESTLE分析、ポーター分析、規制枠組みも含まれています。 |
板ガラス市場の動向
「省エネ・ソーラーコントロールガラスの採用拡大」
- エネルギー消費量を削減するために、現代の建物ではLow-Eガラスやソーラーコントロールガラスの使用が増えています。
- 政府は環境基準を満たす省エネ建築資材の使用を義務付けている
- 商業ビルや車両における熱制御の改善を目的としたスマートガラスの設置が増加
- 家庭やオフィスにおける HVAC 関連の電力使用量を削減する必要性によって需要が高まっている
- LEEDなどの持続可能性認証は、高度な板ガラスソリューションの使用を奨励しています。
- 例えば、欧州の建物エネルギー性能指令は、すべての新規建設プロジェクトでエネルギー効率の高いガラスの使用を義務付けており、地域全体で太陽光制御とLow-Eガラスの需要の増加を促進しています。
板ガラス市場の動向
ドライバ
「建設業界からの需要急増」
- 都市人口の増加とライフスタイルの向上が新興国の建設を促進
- 商業プロジェクトのファサード、ドア、間仕切り、窓における板ガラスの需要増加
- エネルギー効率の高い建物設計における強化ガラス、ラミネートガラス、断熱ガラスの使用の増加
- 政府のインフラプロジェクトが持続可能で美しい素材の需要を刺激
- 建築家や建設業者は、モダンな外観と断熱性能のために板ガラスを好みます。
- 例えば、インドのスマートシティミッションは、ティア1とティア2の都市の住宅とインフラ開発における近代的なガラス材料の使用を大幅に増加させました。
抑制/挑戦
「原材料とエネルギーコストの変動」
- ソーダ灰や珪砂などの原材料が高価で入手困難
- 板ガラスの生産には、燃料価格の変動の影響を受けやすいエネルギー集約型のプロセスが含まれる。
- 電気代とガス代の上昇により、運営費と物流費が増加
- 価格変動はメーカーの収益性に影響を与え、製品価格の一貫性を失わせる。
- エネルギー危機やサプライチェーンの遅延などの外部ショックによる生産中断リスク
- 例えば、2022年の欧州エネルギー危機の際には、多くのガラスメーカーが持続不可能な電気とガスの価格のために一時的に生産を減らし、地域の供給と価格の安定に影響を与えました。
板ガラス市場の展望
板ガラス市場は、タイプ、機能、製品、用途に基づいて 4 つの主要なセグメントに分割されています。
• タイプ別
種類別に見ると、板ガラス市場は、フロートガラス、超透明ガラス、透明ガラス、鋳造ガラス、着色ガラス、網入りガラス、特殊板ガラス、模様付きガラスまたはテクスチャ付きガラス、吹き板ガラスなどに分類されます。フロートガラスセグメントは、その汎用性、費用対効果、そして建設および自動車部門における広範な用途に牽引され、2024年には46.3%という最大の収益シェアで市場を席巻しました。フロートガラスは、均一な厚さ、滑らかな表面、そして合わせガラスや強化ガラスへの加工の容易さから広く好まれており、ドア、窓、ファサードでの実用性を高めています。幅広いコーティングや仕上げとの適合性により、建築および太陽光発電用途における需要がさらに高まっています。
着色ガラス分野は、エネルギー効率の高いソリューションと美しい建築デザインへの需要の高まりを背景に、2025年から2032年にかけて最も高い成長率を達成すると予想されています。着色ガラスは、太陽熱の低減、グレア抑制、紫外線カットなどの利点があり、商業ビルと住宅の両方に最適です。環境意識の高まりとグリーンビルディング認証への関心の高まりにより、着色ガラスの採用は開発業者や住宅所有者の間で広がりを見せています。
• 機能別
機能別に見ると、板ガラス市場はUVカットガラス、断熱ガラス、安全ガラス、防音ガラス、セルフクリーニングガラス、イオン交換ガラス、その他に分類されます。安全ガラスセグメントは、主に自動車のフロントガラス、商業施設のファサード、住宅の防犯窓などへの幅広い使用により、2024年には最大の市場収益シェアを占めました。強化ガラスや合わせガラスを含む安全ガラスは、耐衝撃性と建築安全規制への適合性が高く評価されています。
セルフクリーニングガラス分野は、現代建築におけるメンテナンスの手間が少ないソリューションへの需要の高まりを背景に、2025年から2032年にかけて最も高い成長率を示すと予想されています。このタイプのガラスは、親水性コーティングと光触媒コーティングを採用しており、有機汚れを分解し、雨水で洗い流すことで手作業による清掃の必要性を軽減します。高層ビルや太陽光発電パネルへの応用により、市場シェアがさらに拡大すると予想されます。
• 製品別
製品別に見ると、市場はコーティングガラスと非コーティングガラスに分類されます。コーティングガラスは、省エネ窓、ソーラーコントロールシステム、スマートグレージング技術への応用拡大に牽引され、2024年には最大の収益シェアを獲得しました。コーティングガラスは、断熱性、太陽光反射率、美観の向上といったメリットがあり、商業施設と住宅の両方で好まれる選択肢となっています。
コーティングされていないセグメントは、インテリアデザイン、家具、透明性と最小限の光の歪みが不可欠なアプリケーションでの使用に支えられ、2025年から2032年にかけて最も高い成長率を示すことが予想されます。
• アプリケーション別
用途別に見ると、板ガラス市場は建築・建設、自動車、航空宇宙、電子機器、太陽光発電、家具、その他に分類されます。急速な都市化、インフラ投資の増加、そしてグリーンビルディングの人気の高まりを背景に、建築・建設分野は2024年に最大の収益シェアを獲得し、市場を席巻しました。板ガラスは、ドア、ファサード、天窓、間仕切り、グレージングシステムに広く使用されています。
太陽光発電分野は、再生可能エネルギー源への世界的な移行と太陽光発電パネルの設置増加を背景に、2025年から2032年にかけて最も高い成長率を達成すると予想されています。板ガラスは、その光透過効率、耐久性、そして保護性能の高さから、太陽光パネルに不可欠な材料です。
板ガラス市場の地域分析
• アジア太平洋地域は、堅調な建設活動、自動車生産の増加、中国やインドなどの国々での太陽光発電イニシアチブの拡大により、2024年には板ガラス市場で最大の収益シェア42.87%を占めました。
• 地域の急速な工業化、インフラ整備の進展、都市部の住宅需要の増加により、商業ビルや住宅ビルにおける板ガラスの消費が大幅に増加しました。
• さらに、再生可能エネルギープロジェクトに対する政府の支援とエネルギー効率の高い建築材料の採用の増加により、Low-Eガラスやソーラーコントロールガラスなどの高度なガラス技術の市場浸透が加速しています。
中国板ガラス市場の洞察
中国の板ガラス市場は、建設および自動車セクターからの旺盛な需要に牽引され、2024年にはアジア太平洋地域最大の収益シェアを占めると予想されています。スマートシティ開発やグリーンビルディングといった中国の野心的なインフラ整備計画は、エネルギー効率の高い板ガラスの需要を刺激しています。さらに、中国は太陽光パネル生産において世界をリードしており、高い透明性と耐久性を備えた板ガラスへの依存度が高いことが、市場の成長をさらに加速させる要因となっています。
日本板ガラス市場インサイト
日本の板ガラス市場は、先進的な技術インフラと持続可能な都市開発への注力に支えられ、2025年から2032年にかけて最も高い成長率を達成すると予想されています。日本はエネルギー効率とグリーンビルディングへの強い関心を背景に、住宅・商業施設の両建築において、低放射率、紫外線カット、断熱ガラスの需要が高まっています。
北米板ガラス市場の洞察
北米の板ガラス市場は、自動車産業と建設産業からの需要増加に支えられ、2025年から2032年にかけて最も高い成長率を記録すると予想されています。この地域の消費者は、断熱性と紫外線カット性を備えた高度なガラスソリューションを求める傾向が高まっています。グリーンビルディング認証への移行と、商業施設と住宅の両方における太陽光発電技術の導入拡大も、板ガラスの普及を後押ししています。
米国板ガラス市場の洞察
米国の板ガラス市場は、省エネ建材に対する規制当局の支援と持続可能な建築に対する消費者意識の高まりを背景に、2024年に北米で最大の収益シェアを獲得しました。自動車業界における軽量・安全ガラスの需要と、太陽光発電パネルの設置増加も相まって、特殊な板ガラスの需要を押し上げています。また、米国では、建物の効率性向上を目的としたスマートガラスやセルフクリーニングガラスの開発に向けた研究開発投資が増加しています。
ヨーロッパ板ガラス市場の洞察
ヨーロッパの板ガラス市場は、厳格な環境規制と持続可能な建設手法への関心の高まりにより、2025年から2032年にかけて最も高い成長率を記録すると予想されています。都市環境における安全ガラスや防音ガラスの需要は高まっています。さらに、板ガラスは、特に太陽光発電用途において、この地域のグリーンエネルギーへの移行を支える上で重要な役割を果たしています。ドイツやフランスなどの国々は、近代建築や交通システムにおけるスマートガラスの導入をリードしています。
ドイツの板ガラス市場の洞察
ドイツの板ガラス市場は、省エネ建築基準の重視とスマートテクノロジーのインフラ統合により、2025年から2032年にかけて最も高い成長率を達成すると予想されています。高性能ガラスの主要生産国であるドイツは、エレクトロクロミックガラスやソーラーコントロールガラスといった革新的な技術に投資しています。政府による環境に優しい建築や再生可能エネルギー発電、特に太陽熱発電と太陽光発電への支援は、市場の需要を押し上げています。
英国の板ガラス市場の洞察
英国の板ガラス市場は、商業用不動産やグリーンビルディングへの投資増加に支えられ、2025年から2032年にかけて最も高い成長率を記録すると予想されています。英国のネットゼロエミッション目標とエネルギー効率政策により、低放射率ガラスや断熱ガラスの採用が増加しています。さらに、自動車業界では、厳しい燃費基準と安全基準を満たすため、軽量で多機能なガラスへの需要が高まっています。
板ガラス市場シェア
板ガラス業界は、主に次のような老舗企業によって牽引されています。
- サンゴバングループ(フランス)
- ショット(ドイツ)
- フェニキア(米国)
- カーディナルガラスインダストリーズ社(米国)
- 台湾ガラス工業株式会社(台湾)
- ガーディアン・インダストリーズ・ホールディングス(米国)
- 日本板硝子株式会社(日本)
- AGC株式会社(日本)
- 淄博ゆる玻璃有限公司(中国)
- キビングループ(中国)
- スウィフトグラス(米国)
- 青島REXI工業有限公司(中国)
- ビトロ(メキシコ)
- 中国硝子ホールディングス株式会社(中国)
- 青島ローレルガラステクノロジー株式会社(中国)
- 特殊ガラス製品(米国)
- 東莞CSGソーラーガラス株式会社(中国)
- セントラル硝子株式会社(日本)
- シセカム(トルコ)
世界の板ガラス市場の最新動向
- 2023年10月、VitroはFirst Solarとの追加契約を締結したことを発表しました。この契約は、北米で製造される太陽光パネル向けのハイテクガラスフロントシートを供給するものです。Vitroは、施設改修に1億8,000万ドルを投資し、契約需要を満たすことを目指しています。これにより、今後10年間で約13億ドルの追加売上を見込んでおり、当初の12億ドルの契約を補完することになります。
- 2023年7月、カーディナルガラスインダストリーズ社は、米国西部におけるカーディナルCT社のカスタムテンパリング事業の統合と拡大を発表しました。カリフォルニア州ディクソンのテンパリング施設の買収後、カーディナルCT社は計画された建物の拡張、フロアレイアウトの改善、新しい設備の設置を完了し、生産能力、効率、生産性の向上を実現しました。
- 2022年9月、ガラスおよびハイテク材料の大手メーカーであるAGCの子会社であるAGC Glass Europe SAは、カーボンフットプリントを大幅に削減したフロートガラス製品群を開発する計画を発表しました。この取り組みでは、透明ガラス(厚さ4mm)の1平方メートルあたりCO2排出量を7kg未満に抑えることを目指しています。
- 2022年6月、サンゴバンは、優れた不透明性と反射特性を備えた高反射ガラス「MIRASTAR REFLECT」を発表しました。光透過率はわずか0.1%、光反射率は55%で、高湿度環境でも優れた耐久性を発揮します。この製品は、鏡面仕上げの壁面設置に最適で、美観と機能性を向上させます。
- 2021年3月、SCHOTT AGは家電製品向けの革新的な強化ガラスソリューションをAppliance & Electronics World Expo 2021(家電・電子世界博覧会2021)で発表しました。この展示は、同社の認知度を高め、新規顧客を獲得し、市場リーチの拡大と製品採用の増加を通じて、将来の収益成長に貢献します。
SKU-
世界初のマーケットインテリジェンスクラウドに関するレポートにオンラインでアクセスする

- インタラクティブなデータ分析ダッシュボード
- 成長の可能性が高い機会のための企業分析ダッシュボード
- カスタマイズとクエリのためのリサーチアナリストアクセス
- インタラクティブなダッシュボードによる競合分析
- 最新ニュース、更新情報、トレンド分析
- 包括的な競合追跡のためのベンチマーク分析のパワーを活用
目次
- INTRODUCTION
- OBJECTIVES OF THE STUDY
- MARKET DEFINITION
- OVERVIEW OF GLOBAL FLAT GLASS MARKET
- LIMITATION
- MARKETS COVERED
- MARKET SEGMENTATION
- MARKETS COVERED
- GEOGRAPHICAL SCOPE
- YEARS CONSIDERED FOR THE STUDY
- CURRENCY AND PRICING
- DBMR TRIPOD DATA VALIDATION MODEL
- FUNCTION LIFE LINE CURVE
- MULTIVARIATE MODELING
- PRIMARY INTERVIEWS WITH KEY OPINION LEADERS
- DBMR MARKET POSITION GRID
- MARKET APPLICATION COVERAGE GRID
- DBMR MARKET CHALLENGE MATRIX
- VENDOR SHARE ANALYSIS
- IMPORT-EXPORT DATA
- SECONDARY SOURCES
- ASSUMPTIONS
- EXECUTIVE SUMMARY
- PREMIUM INSIGHTS
- VALUE CHAIN ANALYSIS OF GLOBAL FLAT GLASS MARKET
- INBOUND LOGISTICS
- OPERATIONS
- OUTBOUND LOGISTIC
- SALES AND MARKETING
- MAINTENANCES AND SERVICES
- MARKET OVERVIEW
- DRIVERS
- GROWING DEMAND FOR FLAT GLASS PRODUCTS IN THE AFTERMARKET AUTOMOTIVE INDUSTRY
- INCREASE IN USE OF FLAT GLASS IN THE PRODUCTION AND INSTALLATION OF SOLAR PANELS
- IMPACT OF LEGISLATION AND REGULATION CONCERNING SAFETY, ENERGY CONSERVATION AND NOISE ATTENUATION
- INCREASING DEMAND FOR TEMPERED PRODUCTS IN THE COMMERCIAL CONSTRUCTION INDUSTRY
- RESTRAINTS
- GROWING DEMAND FOR EVS IN THE DEVELOPED NATIONS
- RISING CASES OF ROAD ACCIDENTS
- EXIT OF MANUFACTURERS FROM THE RESIDENTIAL CONSTRUCTION PROJECTS INCURRED HEAVY LOSSES IN THE PANDEMIC
- INCREASING INPUT PRICE OF RAW MATERIALS
- OPPORTUNITIES
- INCREASING PREFERENCE FOR LOW E-GLASS PRODUCTS
- GROWING PREVALENCE OF ULTRA-THIN GLASS FOR SMARTPHONES
- GROWING USE OF FLAT GLASS IN THE UPCOMING RESTART AND RENOVATION OF PROJECTS IN THE CONSTRUCTION SECTOR AFTER PANDEMIC
- CHALLENGES
- ISSUES REGARDING THE DISPOSAL OF GLASS WASTE RAISING ENVIRONMENTAL CONCERN
- UNFAVOURABLE LAW FOR QUALITY STANDARDS OF FLAT GLASS
- HIGH COST OF TRANSPORTATION OF FLAT GLASS PRODUCTS
- IMPACT OF COVID-19 ON THE GLOBAL FLAT GLASS MARKET
- ANALYSIS ON IMPACT OF COVID-19 ON THE GLOBAL FLAT GLASS MARKET
- AFTERMATH OF COVID-19 AND GOVERNMENT INITIATIVE TO BOOST THE GLOBAL FLAT GLASS MARKET
- STRATEGIC DECISIONS FOR MANUFACTURERS AFTER COVID-19 TO GAIN COMPETITIVE MARKET SHARE
- IMPACT ON PRICE
- IMPACT ON DEMAND
- IMPACT ON SUPPLY CHAIN
- CONCLUSION
- GLOBAL FLAT GLASS MARKET, BY TYPE
- OVERVIEW
- FLOAT GLASS
- EXTRA CLEAR GLASS
- CLEAR GLASS
- CAST GLASS
- TINTED GLASS
- WIRED GLASS
- SPECIAL FLAT GLASS
- PATTERNED GLASS OR TEXTURED GLASS
- BLOWN FLAT GLASS
- OTHERS
- GLOBAL FLAT GLASS MARKET, BY FUNCTION
- OVERVIEW
- UV FILTER GLASS
- HEAT INSULATION GLASS
- SAFETY GLAZING
- SOUNDPROOFED GLAZING
- SELF-CLEANING GLASS
- ION EXCHANGE GLASS
- OTHERS
- GLOBAL FLAT GLASS MARKET, BY PRODUCT
- OVERVIEW
- COATED
- COATED, BY COATING RESIN
- POLYURETHANE
- EPOXY
- ACRYLIC
- ALKYD RESIN
- SILICONE RESIN
- OTHERS
- COATED, BY COATING TECHNOLOGY
- SOLVENT-BASED
- WATER-BASED
- NANO COATINGS
- COATED, BY COATING PROCESS
- PHYSICAL VAPOR DEPOSITION (PVD) (MAGNETRON SPUTTERING)
- SOL-GEL
- CHEMICAL VAPOR DEPOSITION (CVD) (PYROLYTIC)
- PLASMA-ENHANCED (PECVD)
- ATMOSPHERIC PRESSURE (APCVD)
- LOW PRESSURE (LPCVD)
- UNCOATED
- GLOBAL FLAT GLASS MARKET, BY APPLICATION
- OVERVIEW
- BUILDING AND CONSTRUCTION
- BUILDING AND CONSTRUCTION, BY APPLICATION
- RESIDENTIAL
- COMMERCIAL
- INDUSTRIAL
- INSTITUTIONAL
- BUILDING AND CONSTRUCTION, BY TYPE
- FLOAT GLASS
- EXTRA CLEAR GLASS
- CLEAR GLASS
- CAST GLASS
- TINTED GLASS
- WIRED GLASS
- SPECIAL FLAT GLASS
- PATTERNED GLASS OR TEXTURED GLASS
- BLOWN FLAT GLASS
- OTHERS
- AUTOMOTIVE
- AUTOMOTIVE, BY APPLICATION
- OEM
- AFTERMARKET
- AUTOMOTIVE, BY TYPE
- FLOAT GLASS
- EXTRA CLEAR GLASS
- CLEAR GLASS
- CAST GLASS
- TINTED GLASS
- WIRED GLASS
- SPECIAL FLAT GLASS
- PATTERNED GLASS OR TEXTURED GLASS
- BLOWN FLAT GLASS
- OTHERS
- AEROSPACE
- AEROSPACE,, BY TYPE
- FLOAT GLASS
- EXTRA CLEAR GLASS
- CLEAR GLASS
- CAST GLASS
- TINTED GLASS
- WIRED GLASS
- SPECIAL FLAT GLASS
- PATTERNED GLASS OR TEXTURED GLASS
- BLOWN FLAT GLASS
- OTHERS
- ELECTRONIC APPLIANCES
- ELECTRONIC APPLIANCES, BY TYPE
- FLOAT GLASS
- EXTRA CLEAR GLASS
- CLEAR GLASS
- CAST GLASS
- TINTED GLASS
- WIRED GLASS
- SPECIAL FLAT GLASS
- PATTERNED GLASS OR TEXTURED GLASS
- BLOWN FLAT GLASS
- OTHERS
- SOLAR ENERGY
- SOLAR ENERGY, BY APPLICATION
- PHOTOVOLTAIC SOLAR POWER SYSTEM
- CONCENTRATED SOLAR POWER SYSTEM
- SOLAR ENERGY, BY TYPE
- FLOAT GLASS
- EXTRA CLEAR GLASS
- CLEAR GLASS
- CAST GLASS
- TINTED GLASS
- WIRED GLASS
- SPECIAL FLAT GLASS
- PATTERNED GLASS OR TEXTURED GLASS
- BLOWN FLAT GLASS
- OTHERS
- FURNITURE
- FURNITURE, BY TYPE
- FLOAT GLASS
- EXTRA CLEAR GLASS
- CLEAR GLASS
- CAST GLASS
- TINTED GLASS
- WIRED GLASS
- SPECIAL FLAT GLASS
- PATTERNED GLASS OR TEXTURED GLASS
- BLOWN FLAT GLASS
- OTHERS
- OTHERS
- OTHERS, BY TYPE
- FLOAT GLASS
- EXTRA CLEAR GLASS
- CLEAR GLASS
- CAST GLASS
- TINTED GLASS
- WIRED GLASS
- SPECIAL FLAT GLASS
- PATTERNED GLASS OR TEXTURED GLASS
- BLOWN FLAT GLASS
- OTHERS
- GLOBAL FLAT GLASS MARKET, BY REGION
- OVERVIEW
- NORTH AMERICA
- U.S.
- CANADA
- MEXICO
- EUROPE
- GERMANY
- U.K.
- FRANCE
- ITALY
- SPAIN
- NETHERLANDS
- BELGIUM
- RUSSIA
- TURKEY
- SWITZERLAND
- REST OF EUROPE
- ASIA-PACIFIC
- CHINA
- INDIA
- JAPAN
- SOUTH KOREA
- AUSTRALIA AND NEW ZEALAND
- INDONESIA
- SINGAPORE
- MALAYSIA
- THAILAND
- PHILIPPINES
- REST OF ASIA-PACIFIC
- MIDDLE EAST AND AFRICA
- U.A.E.
- SAUDI ARABIA
- SOUTH AFRICA
- EGYPT
- ISRAEL
- REST OF MIDDLE EAST AND AFRICA
- SOUTH AMERICA
- BRAZIL
- ARGENTINA
- REST OF SOUTH AMERICA
- GLOBAL FLAT GLASS MARKET: COMPANY LANDSCAPE
- COMPANY SHARE ANALYSIS: GLOBAL
- COMPANY SHARE ANALYSIS: NORTH AMERICA
- COMPANY SHARE ANALYSIS: EUROPE
- COMPANY SHARE ANALYSIS: ASIA-PACIFIC
- EXPANSIONS
- SWOT ANALYSIS
- COMPANY PROFILES
- GUARDIAN GLASS LLC
- COMPANY SNAPSHOT
- COMPANY SHARE ANALYSIS
- PRODUCT PORTFOLIO
- RECENT UPDATE
- TAIWAN GLASS INDUSTRY CORPORATION
- COMPANY SNAPSHOT
- COMPANY SHARE ANALYSIS
- PRODUCT PORTFOLIO
- RECENT UPDATE
- ZIBO YURU GLASS COMPANYFOUNDED
- COMPANY SNAPSHOT
- COMPANY SHARE ANALYSIS
- PRODUCT PORTFOLIO
- RECENT UPDATE
- SCHOTT AG
- COMPANY SNAPSHOT
- COMPANY SHARE ANALYSIS
- PRODUCT PORTFOLIO
- RECENT UPDATE
- SHENZHEN SUN GLOBAL GLASS CO., LTD
- COMPANY SNAPSHOT
- COMPANY SHARE ANALYSIS
- PRODUCT PORTFOLIO
- RECENT UPDATE
- SAINT-GOBAIN
- COMPANY SNAPSHOT
- REVENUE ANALYSIS
- PRODUCT PORTFOLIO
- RECENT UPDATE
- CHINA LAUREL GLASS TECHNOLOGY CO., LTD
- COMPANY SNAPSHOT
- PRODUCT PORTFOLIO
- RECENT UPDATE
- SWIFT GLASS
- COMPANY SNAPSHOT
- PRODUCT PORTFOLIO
- RECENT UPDATE
- AGC INC.
- COMPANY SNAPSHOT
- REVENUE ANALYSIS
- PRODUCT PORTFOLIO
- RECENT UPDATE
- CARDINAL GLASS INDUSTRIES, INC
- COMPANY SNAPSHOT
- PRODUCT PORTFOLIO
- RECENT UPDATE
- CENTRAL GLASS CO.LTD
- COMPANY SNAPSHOT
- REVENUE ANALYSIS
- PRODUCT PORTFOLIO
- RECENT UPDATE
- CHINA GLASS HOLDINGS LIMITED
- COMPANY SNAPSHOT
- REVENUE ANALYSIS
- PRODUCT PORTFOLIO
- RECENT UPDATE
- DONGGUAN CSG SOLAR GLASS CO., LTD (A SUBSIDIARY OF CSG HOLDING CO.,LTD.)
- COMPANY SNAPSHOT
- REVENUE ANALYSIS
- PRODUCT PORTFOLIO
- RECENT UPDATE
- KIBING GROUP
- COMPANY SNAPSHOT
- PRODUCT PORTFOLIO
- RECENT UPDATE
- NIPPON SHEET GLASS CO., LTD
- COMPANY SNAPSHOT
- REVENUE ANALYSIS
- PRODUCT PORTFOLIO
- RECENT UPDATES
- PHOENICIA
- COMPANY SNAPSHOT
- PRODUCT PORTFOLIO
- RECENT UPDATES
- QINGDAO REXI INDUSTRIES CO.,LTD
- COMPANY SNAPSHOT
- PRODUCT PORTFOLIO
- RECENT UPDATES
- ŞIŞECAM
- COMPANY SNAPSHOT
- REVENUE ANALYSIS
- PRODUCT PORTFOLIO
- RECENT UPDATE
- SPECIALTY GLASS PRODUCTS
- COMPANY SNAPSHOT
- PRODUCT PORTFOLIO
- RECENT UPDATE
- VITRO
- COMPANY SNAPSHOT
- REVENUE ANALYSIS
- PRODUCT PORTFOLIO
- RECENT UPDATE
- QUESTIONNAIRE
- RELATED REPORTS
表のリスト
TABLE 1 IMPORT DATA of Product: 7005 Float glass and surface ground or polished glass, in sheets, whether or not having an absorbent; HS CODE - 7005 (USD THOUSAND)
TABLE 2 EXPORT DATA of Product: 7005 Float glass and surface ground or polished glass, in sheets, whether or not having an absorbent; HS CODE - 7005 (USD THOUSAND)
TABLE 3 Some of the quality standards for the glass installed on WINDOWS, glazed assemblies as well as on doors:
TABLE 4 Global Flat glass Market, By type, 2019-2028 (usd Thousand)
TABLE 5 Global Flat glass Market, By Type, 2019-2028 (THOUSAND SQUARE METER)
TABLE 6 Global Float glass in FLAT GLASS market, BY region, 2019-2028 (USD Thousand)
TABLE 7 Global Float glass in FLAT GLASS market, BY region, 2019-2028 (THOUSAND SQUARE METER)
TABLE 8 Global Extra Clear Glass in FLAT GLASS market, BY region, 2019-2028 (USD Thousand)
TABLE 9 Global Extra Clear Glass in FLAT GLASS market, BY region, 2019-2028 (THOUSAND SQUARE METER)
TABLE 10 Global Clear Glass in FLAT GLASS market, BY region, 2019-2028 (USD Thousand)
TABLE 11 Global Clear Glass in FLAT GLASS market, BY region, 2019-2028 (THOUSAND SQUARE METER)
TABLE 12 Global Cast Glass IN FLAT GLASS market, BY region, 2019-2028 (USD Thousand)
TABLE 13 Global Cast Glass IN FLAT GLASS market, BY region, 2019-2028 (THOUSAND SQUARE METER)
TABLE 14 Global Tinted Glass IN FLAT GLASS market, BY region, 2019-2028 (USD Thousand)
TABLE 15 Global Tinted Glass IN FLAT GLASS market, BY region, 2019-2028 (THOUSAND SQUARE METER)
TABLE 16 Global Wired Glass IN FLAT GLASS market, BY region, 2019-2028 (USD Thousand)
TABLE 17 Global Wired Glass IN FLAT GLASS market, BY region, 2019-2028 (THOUSAND SQUARE METER)
TABLE 18 Global Special Flat Glass IN FLAT GLASS market, BY region, 2019-2028 (USD Thousand)
TABLE 19 Global Special Flat Glass IN FLAT GLASS market, BY region, 2019-2028 (THOUSAND SQUARE METER)
TABLE 20 Global Patterned Glass or Textured Glass IN FLAT GLASS market, BY region, 2019-2028 (USD Thousand)
TABLE 21 Global Patterned Glass or Textured Glass IN FLAT GLASS market, BY region, 2019-2028 (THOUSAND SQUARE METER)
TABLE 22 Global Blown Flat Glass IN FLAT GLASS market, BY region, 2019-2028 (USD Thousand)
TABLE 23 Global Blown Flat Glass IN FLAT GLASS market, BY region, 2019-2028 (THOUSAND SQUARE METER)
TABLE 24 Global Others IN FLAT GLASS market, BY region, 2019-2028 (USD Thousand)
TABLE 25 Global others IN FLAT GLASS market, BY region, 2019-2028 (THOUSAND SQUARE METER)
TABLE 26 Global FLAT GLASS market, BY function, 2019-2028 (USD Thousand)
TABLE 27 Global UV Filter Glass IN FLAT GLASS market, BY region, 2019-2028 (USD Thousand)
TABLE 28 Global Heat Insulation Glass IN FLAT GLASS market, BY region, 2019-2028 (USD Thousand)
TABLE 29 Global Safety Glazing IN FLAT GLASS market, BY region, 2019-2028 (USD Thousand)
TABLE 30 Global Soundproofed Glazing IN FLAT GLASS market, BY region, 2019-2028 (USD Thousand)
TABLE 31 Global Self-Cleaning Glass IN FLAT GLASS market, BY region, 2019-2028 (USD Thousand)
TABLE 32 Global ION Exchange Glass IN FLAT GLASS market, BY region, 2019-2028 (USD Thousand)
TABLE 33 Global Others IN FLAT GLASS market, BY region, 2019-2028 (USD Thousand)
TABLE 34 Global FLAT GLASS market, BY product, 2019-2028 (USD Thousand)
TABLE 35 Global Coated in FLAT GLASS market, BY region, 2019-2028 (USD Thousand)
TABLE 36 Global COATED in flat glass Market, By COATING RESIN, 2019-2028 (USD Thousand)
TABLE 37 Global COATED in flat glass Market, By COATING TECHNOLOGY, 2019-2028 (USD Thousand)
TABLE 38 Global COATED in flat glass Market, By COATING process, 2019-2028 (USD Thousand)
TABLE 39 Global Chemical Vapor Deposition (CVD) (Pyrolytic) in Flat Glass Market, By Process, 2019-2028 (USD Thousand)
TABLE 40 Global Uncoated in FLAT GLASS market, BY region, 2019-2028 (USD Thousand)
TABLE 41 Global FLAT GLASS market, BY application, 2019-2028 (USD Thousand)
TABLE 42 Global Building and Construction IN FLAT GLASS market, BY region, 2019-2028 (USD Thousand)
TABLE 43 Global Building and construction IN FLAT GLASS market, BY application, 2019-2028 (USD Thousand)
TABLE 44 Global Building and Construction IN FLAT GLASS market, BY type, 2019-2028 (USD Thousand)
TABLE 45 Global Automotive IN FLAT GLASS market, BY region, 2019-2028 (USD Thousand)
TABLE 46 Global Automotive IN FLAT GLASS market, BY application, 2019-2028 (USD Thousand)
TABLE 47 Global Automotive IN FLAT GLASS market, BY type, 2019-2028 (USD Thousand)
TABLE 48 Global Aerospace IN FLAT GLASS market, BY region, 2019-2028 (USD Thousand)
TABLE 49 Global Aerospace IN FLAT GLASS market, BY type, 2019-2028 (USD Thousand)
TABLE 50 Global Electronic Appliances IN FLAT GLASS market, BY region, 2019-2028 (USD Thousand)
TABLE 51 Global Electronic Appliances IN FLAT GLASS market, BY type, 2019-2028 (USD Thousand)
TABLE 52 Global Solar Energy IN FLAT GLASS market, BY region, 2019-2028 (USD Thousand)
TABLE 53 Global Solar Energy IN FLAT GLASS market, BY application, 2019-2028 (USD Thousand)
TABLE 54 Global Solar Energy IN FLAT GLASS market, BY type, 2019-2028 (USD Thousand)
TABLE 55 Global Furniture IN FLAT GLASS market, BY region, 2019-2028 (USD Thousand)
TABLE 56 Global Furniture IN FLAT GLASS market, BY type, 2019-2028 (USD Thousand)
TABLE 57 Global Others IN FLAT GLASS market, BY region, 2019-2028 (USD Thousand)
TABLE 58 Global Others IN FLAT GLASS market, BY type, 2019-2028 (USD Thousand)
TABLE 59 GLOBAL Flat glass Market, By region, 2019-2028 (USD Thousand)
TABLE 60 Global Flat glass Market, By region,2019-2028 (Thousand Square Meter)
TABLE 61 North America flat glass Market, BY COUNtry, 2019-2028 (USD Thousand)
TABLE 62 North America flat glass Market, BY COUNtry, 2019-2028 (Thousand Square meter)
TABLE 63 North America Flat Glass Market, By Type, 2019-2028 (USD Thousand)
TABLE 64 North America Flat Glass Market, By Type, 2019-2028 (Thousand Square Meter)
TABLE 65 North America Flat Glass Market, By Function, 2019-2028 (USD Thousand)
TABLE 66 North America Flat Glass Market, BY Product, 2019-2028 (USD Thousand)
TABLE 67 North America Coated In Flat Glass Market, By Coating Resin, 2019-2028 (USD Thousand)
TABLE 68 North America Coating Technology In Flat Glass Market, BY Coating Technology, 2019-2028 (USD Thousand)
TABLE 69 North America Coated In Flat Glass Market, BY Coating Process, 2019-2028 (USD Thousand)
TABLE 70 North America Chemical Vapor Deposition (CVD) (Pyrolytic) in Flat Glass Market, By Process, 2019-2028 (USD Thousand)
TABLE 71 North America Flat Glass Market, BY Application, 2019-2028 (USD Thousand)
TABLE 72 North America Building and Construction In Flat Glass Market, By Application, 2019-2028 (USD Thousand)
TABLE 73 North America Building and Construction In Flat Glass Market, By Type, 2019-2028 (USD Thousand)
TABLE 74 North America Automotive In Flat Glass Market, By Application, 2019-2028 (USD Thousand)
TABLE 75 north America Automotive In Flat Glass Market, By Type, 2019-2028 (USD Thousand)
TABLE 76 North America Aerospace In Flat Glass Market, By Type, 2019-2028 (USD Thousand)
TABLE 77 North America Electronic Appliances In Flat Glass Market, By Type, 2019-2028 (USD Thousand)
TABLE 78 North America Solar Energy In Flat Glass Market, By Application 2019-2028 (USD Thousand)
TABLE 79 North America Solar Energy In Flat Glass Market, By Type, 2019-2028 (USD Thousand)
TABLE 80 North America Furniture In Flat Glass Market, By Type, 2019-2028 (USD Thousand)
TABLE 81 North America Others In Flat Glass Market, By Type, 2019-2028 (USD Thousand)
TABLE 82 U.S. Flat Glass Market, By Type, 2019-2028 (USD Thousand)
TABLE 83 U.S. Flat Glass Market, By Type, 2019-2028 (Thousand Square Meter)
TABLE 84 U.S. Flat Glass Market, By Function, 2019-2028 (USD Thousand)
TABLE 85 U.S. Flat Glass Market,BY Product, 2019-2028 (USD Thousand)
TABLE 86 U.S. Coated In Flat Glass Market, By Coating Resin, 2019-2028 (USD Thousand)
TABLE 87 U.S. Coating Technology In Flat Glass Market, BY Coating Technology, 2019-2028 (USD Thousand)
TABLE 88 U.S. Coated In Flat Glass Market, BY Coating Process, 2019-2028 (USD Thousand)
TABLE 89 U.S. Chemical Vapor Deposition (CVD) (Pyrolytic) in Flat Glass Market, By Process, 2019-2028 (USD Thousand)
TABLE 90 U.S. Flat Glass Market, BY Application, 2019-2028 (USD Thousand)
TABLE 91 U.S. Building and Construction In Flat Glass Market, By Application, 2019-2028 (USD Thousand)
TABLE 92 U.S. Building and Construction In Flat Glass Market, By Type, 2019-2028 (USD Thousand)
TABLE 93 U.S. Automotive In Flat Glass Market, By Application, 2019-2028 (USD Thousand)
TABLE 94 U.S. Automotive In Flat Glass Market, By Type, 2019-2028 (USD Thousand)
TABLE 95 U.S. Aerospace In Flat Glass Market, By Type, 2019-2028 (USD Thousand)
TABLE 96 U.S. Electronic Appliances In Flat Glass Market, By Type, 2019-2028 (USD Thousand)
TABLE 97 U.S. Solar Energy In Flat Glass Market, By Application 2019-2028 (USD Thousand)
TABLE 98 U.S. Solar Energy In Flat Glass Market, By Type, 2019-2028 (USD Thousand)
TABLE 99 U.S. Furniture In Flat Glass Market, By Type, 2019-2028 (USD Thousand)
TABLE 100 U.S. Others In Flat Glass Market, By Type, 2019-2028 (USD Thousand)
TABLE 101 Canada Flat Glass Market, By Type, 2019-2028 (USD Thousand)
TABLE 102 Canada Flat Glass Market, By Type, 2019-2028 (Thousand Square Meter)
TABLE 103 Canada Flat Glass Market, By Function, 2019-2028 (USD Thousand)
TABLE 104 Canada Flat Glass Market,BY Product, 2019-2028 (USD Thousand)
TABLE 105 Canada Coated In Flat Glass Market, By Coating Resin, 2019-2028 (USD Thousand)
TABLE 106 Canada Coating Technology In Flat Glass Market, BY Coating Technology, 2019-2028 (USD Thousand)
TABLE 107 Canada Coated In Flat Glass Market, BY Coating Process, 2019-2028 (USD Thousand)
TABLE 108 Canada Chemical Vapor Deposition (CVD) (Pyrolytic) in Flat Glass Market, By Process, 2019-2028 (USD Thousand)
TABLE 109 Canada Flat Glass Market, BY Application, 2019-2028 (USD Thousand)
TABLE 110 Canada Building and Construction In Flat Glass Market, By Application, 2019-2028 (USD Thousand)
TABLE 111 Canada Building and Construction In Flat Glass Market, By Type, 2019-2028 (USD Thousand)
TABLE 112 Canada Automotive In Flat Glass Market, By Application, 2019-2028 (USD Thousand)
TABLE 113 Canada Automotive In Flat Glass Market, By Type, 2019-2028 (USD Thousand)
TABLE 114 Canada Aerospace In Flat Glass Market, By Type, 2019-2028 (USD Thousand)
TABLE 115 Canada Electronic Appliances In Flat Glass Market, By Type, 2019-2028 (USD Thousand)
TABLE 116 Canada Solar Energy In Flat Glass Market, By Application, 2019-2028 (USD Thousand)
TABLE 117 Canada Solar Energy In Flat Glass Market, By Type, 2019-2028 (USD Thousand)
TABLE 118 Canada Furniture In Flat Glass Market, By Type, 2019-2028 (USD Thousand)
TABLE 119 Canada Others In Flat Glass Market, By Type, 2019-2028 (USD Thousand)
TABLE 120 Mexico Flat Glass Market, By Type, 2019-2028 (USD Thousand)
TABLE 121 Mexico Flat Glass Market, By Type, 2019-2028 (Thousand Square Meter)
TABLE 122 Mexico Flat Glass Market, By Function, 2019-2028 (USD Thousand)
TABLE 123 Mexico Flat Glass Market,BY Product, 2019-2028 (USD Thousand)
TABLE 124 Mexico Coated In Flat Glass Market, By Coating Resin, 2019-2028 (USD Thousand)
TABLE 125 Mexico Coating Technology In Flat Glass Market, BY Coating Technology, 2019-2028 (USD Thousand)
TABLE 126 Mexico Coated In Flat Glass Market, BY Coating Process, 2019-2028 (USD Thousand)
TABLE 127 Mexico Chemical Vapor Deposition (CVD) (Pyrolytic) in Flat Glass Market, By Process, 2019-2028 (USD Thousand)
TABLE 128 Mexico Flat Glass Market, BY Application, 2019-2028 (USD Thousand)
TABLE 129 Mexico Building and Construction In Flat Glass Market, By Application, 2019-2028 (USD Thousand)
TABLE 130 Mexico Building and Construction In Flat Glass Market, By Type, 2019-2028 (USD Thousand)
TABLE 131 Mexico Automotive In Flat Glass Market, By Application, 2019-2028 (USD Thousand)
TABLE 132 Mexico Automotive In Flat Glass Market, By Type, 2019-2028 (USD Thousand)
TABLE 133 Mexico Aerospace In Flat Glass Market, By Type, 2019-2028 (USD Thousand)
TABLE 134 Mexico Electronic Appliances In Flat Glass Market, By Type, 2019-2028 (USD Thousand)
TABLE 135 Mexico Solar Energy In Flat Glass Market, By Application, 2019-2028 (USD Thousand)
TABLE 136 Mexico Solar Energy In Flat Glass Market, By Type, 2019-2028 (USD Thousand)
TABLE 137 Mexico Furniture In Flat Glass Market, By Type, 2019-2028 (USD Thousand)
TABLE 138 Mexico Others In Flat Glass Market, By Type, 2019-2028 (USD Thousand)
TABLE 139 Europe flat glass Market, BY COUNtry, 2019-2028 (USD Thousand)
TABLE 140 Europe flat glass Market, BY COUNtry, 2019-2028 (Thousand Square Meter)
TABLE 141 Europe Flat Glass Market, By Type, 2019-2028 (USD Thousand)
TABLE 142 Europe Flat Glass Market, By Type, 2019-2028 (Thousand Square Meter)
TABLE 143 Europe Flat Glass Market, By Function, 2019-2028 (USD Thousand)
TABLE 144 Europe Flat Glass Market, BY Product, 2019-2028 (USD Thousand)
TABLE 145 Europe Coated In Flat Glass Market, By Coating Resin, 2019-2028 (USD Thousand)
TABLE 146 Europe Coating Technology In Flat Glass Market, BY Coating Technology, 2019-2028 (USD Thousand)
TABLE 147 Europe Coated In Flat Glass Market, BY Coating Process, 2019-2028 (USD Thousand)
TABLE 148 Europe Chemical Vapor Deposition (CVD) (Pyrolytic) in Flat Glass Market By Process, 2019-2028 (USD Thousand)
TABLE 149 Europe Flat Glass Market, BY Application, 2019-2028 (USD Thousand)
TABLE 150 Europe Building and Construction In Flat Glass Market, By Application, 2019-2028 (USD Thousand)
TABLE 151 Europe Building and Construction In Flat Glass Market, By Type, 2019-2028 (USD Thousand)
TABLE 152 Europe Automotive In Flat Glass Market, By Application, 2019-2028 (USD Thousand)
TABLE 153 Europe Automotive In Flat Glass Market, By Type, 2019-2028 (USD Thousand)
TABLE 154 Europe Aerospace In Flat Glass Market, By Type, 2019-2028 (USD Thousand)
TABLE 155 Europe Electronic Appliances In Flat Glass Market, By Type, 2019-2028 (USD Thousand)
TABLE 156 Europe Solar Energy In Flat Glass Market, By Application 2019-2028 (USD Thousand)
TABLE 157 Europe Solar Energy In Flat Glass Market, By Type, 2019-2028 (USD Thousand)
TABLE 158 Europe Furniture In Flat Glass Market, By Type, 2019-2028 (USD Thousand)
TABLE 159 Europe Others In Flat Glass Market, By Type, 2019-2028 (USD Thousand)
TABLE 160 Germany Flat Glass Market, By Type, 2019-2028 (USD Thousand)
TABLE 161 Germany Flat Glass Market, By Type, 2019-2028 (Thousand Square Meter)
TABLE 162 Germany Flat Glass Market, By Function, 2019-2028 (USD Thousand)
TABLE 163 Germany Flat Glass MARKET, BY PRODUCT, 2019-2028 (USD Thousand)
TABLE 164 Germany Coated In Flat Glass Market, By Coating Resin, 2019-2028 (USD Thousand)
TABLE 165 Germany Coating Technology In Flat Glass Market, BY Coating Technology, 2019-2028 (USD Thousand)
TABLE 166 Germany Coated In Flat Glass Market, BY Coating Process, 2019-2028 (USD Thousand)
TABLE 167 Germany Chemical Vapor Deposition (CVD) (Pyrolytic) in Flat Glass Market, By Process, 2019-2028 (USD Thousand)
TABLE 168 Germany Flat Glass Market, BY Application, 2019-2028 (USD Thousand)
TABLE 169 Germany Building and Construction In Flat Glass Market, By Application, 2019-2028 (USD Thousand)
TABLE 170 Germany Building and Construction In Flat Glass Market, By Type, 2019-2028 (USD Thousand)
TABLE 171 Germany Automotive In Flat Glass Market, By Application, 2019-2028 (USD Thousand)
TABLE 172 Germany Automotive In Flat Glass Market, By Type, 2019-2028 (USD Thousand)
TABLE 173 Germany Aerospace In Flat Glass Market, By Type, 2019-2028 (USD Thousand)
TABLE 174 Germany Electronic Appliances In Flat Glass Market, By Type, 2019-2028 (USD Thousand)
TABLE 175 Germany Solar Energy In Flat Glass Market, By Application, 2019-2028 (USD Thousand)
TABLE 176 Germany Solar Energy In Flat Glass Market, By Type, 2019-2028 (USD Thousand)
TABLE 177 Germany Furniture In Flat Glass Market, By Type, 2019-2028 (USD Thousand)
TABLE 178 Germany Others In Flat Glass Market, By Type, 2019-2028 (USD Thousand)
TABLE 179 U.K Flat Glass Market, By Type, 2019-2028 (USD Thousand)
TABLE 180 U.K Flat Glass Market, By Type, 2019-2028 (Thousand Square Meter)
TABLE 181 U.K Flat Glass Market, By Function, 2019-2028 (USD Thousand)
TABLE 182 U.K Flat Glass Market, BY Product, 2019-2028 (USD Thousand)
TABLE 183 U.K Coated In Flat Glass Market, By Coating Resin, 2019-2028 (USD Thousand)
TABLE 184 U.K Coating Technology In Flat Glass Market, BY Coating Technology, 2019-2028 (USD Thousand)
TABLE 185 U.K Coated In Flat Glass Market, BY Coating Process, 2019-2028 (USD Thousand)
TABLE 186 U.K Chemical Vapor Deposition (CVD) (Pyrolytic) in Flat Glass Market By Process, 2019-2028 (USD Thousand)
TABLE 187 U.K Flat Glass Market, BY Application, 2019-2028 (USD Thousand)
TABLE 188 U.K Building and Construction In Flat Glass Market, By Application, 2019-2028 (USD Thousand)
TABLE 189 U.K Building and Construction In Flat Glass Market, By Type, 2019-2028 (USD Thousand)
TABLE 190 U.K Automotive In Flat Glass Market, By Application, 2019-2028 (USD Thousand)
TABLE 191 U.K Automotive In Flat Glass Market, By Type, 2019-2028 (USD Thousand)
TABLE 192 U.K Aerospace In Flat Glass Market, By Type, 2019-2028 (USD Thousand)
TABLE 193 U.K Electronic Appliances In Flat Glass Market, By Type, 2019-2028 (USD Thousand)
TABLE 194 U.K Solar Energy In Flat Glass Market, By Application 2019-2028 (USD Thousand)
TABLE 195 U.K Solar Energy In Flat Glass Market, By Type, 2019-2028 (USD Thousand)
TABLE 196 U.K Furniture In Flat Glass Market, By Type, 2019-2028 (USD Thousand)
TABLE 197 U.K Others In Flat Glass Market, By Type, 2019-2028 (USD Thousand)
TABLE 198 France Flat Glass Market, By Type, 2019-2028 (USD Thousand)
TABLE 199 France Flat Glass Market, By Type, 2019-2028 (Thousand Square Meter)
TABLE 200 France Flat Glass Market, By Function, 2019-2028 (USD Thousand)
TABLE 201 France Flat Glass Market, BY Product, 2019-2028 (USD Thousand)
TABLE 202 France Coated In Flat Glass Market, By Coating Resin, 2019-2028 (USD Thousand)
TABLE 203 France Coating Technology In Flat Glass Market, BY Coating Technology, 2019-2028 (USD Thousand)
TABLE 204 France Coated In Flat Glass Market, BY Coating Process, 2019-2028 (USD Thousand)
TABLE 205 France Chemical Vapor Deposition (CVD) (Pyrolytic) in Flat Glass Market By Process, 2019-2028 (USD Thousand)
TABLE 206 France Flat Glass Market, BY Application, 2019-2028 (USD Thousand)
TABLE 207 France Building and Construction In Flat Glass Market, By Application, 2019-2028 (USD Thousand)
TABLE 208 France Building and Construction In Flat Glass Market, By Type, 2019-2028 (USD Thousand)
TABLE 209 France Automotive In Flat Glass Market, By Application, 2019-2028 (USD Thousand)
TABLE 210 France Automotive In Flat Glass Market, By Type, 2019-2028 (USD Thousand)
TABLE 211 France Aerospace In Flat Glass Market, By Type, 2019-2028 (USD Thousand)
TABLE 212 France Electronic Appliances In Flat Glass Market, By Type, 2019-2028 (USD Thousand)
TABLE 213 france Solar Energy In Flat Glass Market, By Application 2019-2028 (USD Thousand)
TABLE 214 France Solar Energy In Flat Glass Market, By Type, 2019-2028 (USD Thousand)
TABLE 215 France Furniture In Flat Glass Market, By Type, 2019-2028 (USD Thousand)
TABLE 216 France Others In Flat Glass Market, By Type, 2019-2028 (USD Thousand)
TABLE 217 Italy Flat Glass Market, By Type, 2019-2028 (USD Thousand)
TABLE 218 Italy Flat Glass Market, By Type, 2019-2028 (Thousand Square Meter)
TABLE 219 Italy Flat Glass Market, By Function, 2019-2028 (USD Thousand)
TABLE 220 Italy Flat Glass MARKET, BY PRODUCT, 2019-2028 (USD Thousand)
TABLE 221 Italy Coated In Flat Glass Market, By Coating Resin, 2019-2028 (USD Thousand)
TABLE 222 Italy Coating Technology In Flat Glass Market, BY Coating Technology, 2019-2028 (USD Thousand)
TABLE 223 Italy Coated In Flat Glass Market, BY Coating Process, 2019-2028 (USD Thousand)
TABLE 224 Italy Chemical Vapor Deposition (CVD) (Pyrolytic) in Flat Glass Market By Process, 2019-2028 (USD Thousand)
TABLE 225 Italy Flat Glass Market, BY Application, 2019-2028 (USD Thousand)
TABLE 226 Italy Building and Construction In Flat Glass Market, By Application, 2019-2028 (USD Thousand)
TABLE 227 Italy Building and Construction In Flat Glass Market, By Type, 2019-2028 (USD Thousand)
TABLE 228 Italy Automotive In Flat Glass Market, By Application, 2019-2028 (USD Thousand)
TABLE 229 Italy Automotive In Flat Glass Market, By Type, 2019-2028 (USD Thousand)
TABLE 230 Italy Aerospace In Flat Glass Market, By Type, 2019-2028 (USD Thousand)
TABLE 231 Italy Electronic Appliances In Flat Glass Market, By Type, 2019-2028 (USD Thousand)
TABLE 232 Italy Solar Energy In Flat Glass Market, By Application 2019-2028 (USD Thousand)
TABLE 233 Italy Solar Energy In Flat Glass Market, By Type, 2019-2028 (USD Thousand)
TABLE 234 Italy Furniture In Flat Glass Market, By Type, 2019-2028 (USD Thousand)
TABLE 235 Italy Others In Flat Glass Market, By Type, 2019-2028 (USD Thousand)
TABLE 236 Spain Flat Glass Market, By Type, 2019-2028 (USD Thousand)
TABLE 237 Spain Flat Glass Market, By Type, 2019-2028 (Thousand Square Meter)
TABLE 238 Spain Flat Glass Market, By Function, 2019-2028 (USD Thousand)
TABLE 239 Spain Flat Glass MARKET, BY PRODUCT, 2019-2028 (USD Thousand)
TABLE 240 Spain Coated In Flat Glass Market, By Coating Resin, 2019-2028 (USD Thousand)
TABLE 241 Spain Coating Technology In Flat Glass Market, BY Coating Technology, 2019-2028 (USD Thousand)
TABLE 242 Spain Coated In Flat Glass Market, BY Coating Process, 2019-2028 (USD Thousand)
TABLE 243 Spain Chemical Vapor Deposition (CVD) (Pyrolytic) in Flat Glass Market, By Process, 2019-2028 (USD Thousand)
TABLE 244 Spain Flat Glass Market, BY Application, 2019-2028 (USD Thousand)
TABLE 245 Spain Building and Construction In Flat Glass Market, By Application, 2019-2028 (USD Thousand)
TABLE 246 Spain Building and Construction In Flat Glass Market, By Type, 2019-2028 (USD Thousand)
TABLE 247 Spain Automotive In Flat Glass Market, By Application, 2019-2028 (USD Thousand)
TABLE 248 Spain Automotive In Flat Glass Market, By Type, 2019-2028 (USD Thousand)
TABLE 249 Spain Aerospace In Flat Glass Market, By Type, 2019-2028 (USD Thousand)
TABLE 250 Spain Electronic Appliances In Flat Glass Market, By Type, 2019-2028 (USD Thousand)
TABLE 251 Spain Solar Energy In Flat Glass Market, By Application 2019-2028 (USD Thousand)
TABLE 252 Spain Solar Energy In Flat Glass Market, By Type, 2019-2028 (USD Thousand)
TABLE 253 Spain Furniture In Flat Glass Market, By Type, 2019-2028 (USD Thousand)
TABLE 254 Spain Others In Flat Glass Market, By Type, 2019-2028 (USD Thousand)
TABLE 255 Netherlands Flat Glass Market, By Type, 2019-2028 (USD Thousand)
TABLE 256 Netherlands Flat Glass Market, By Type, 2019-2028 (Thousand Square Meter)
TABLE 257 Netherlands Flat Glass Market, By Function, 2019-2028 (USD Thousand)
TABLE 258 Netherlands Flat Glass MARKET, BY PRODUCT, 2019-2028 (USD Thousand)
TABLE 259 Netherlands Coated In Flat Glass Market, By Coating Resin, 2019-2028 (USD Thousand)
TABLE 260 Netherlands Coating Technology In Flat Glass Market, BY Coating Technology, 2019-2028 (USD Thousand)
TABLE 261 Netherlands Coated In Flat Glass Market, BY Coating Process, 2019-2028 (USD Thousand)
TABLE 262 Netherlands Chemical Vapor Deposition (CVD) (Pyrolytic) in Flat Glass Market, By Process, 2019-2028 (USD Thousand)
TABLE 263 Netherlands Flat Glass Market, BY Application, 2019-2028 (USD Thousand)
TABLE 264 Netherlands Building and Construction In Flat Glass Market, By Application, 2019-2028 (USD Thousand)
TABLE 265 Netherlands Building and Construction In Flat Glass Market, By Type, 2019-2028 (USD Thousand)
TABLE 266 Netherlands Automotive In Flat Glass Market, By Application, 2019-2028 (USD Thousand)
TABLE 267 Netherlands Automotive In Flat Glass Market, By Type, 2019-2028 (USD Thousand)
TABLE 268 Netherlands Aerospace In Flat Glass Market, By Type, 2019-2028 (USD Thousand)
TABLE 269 Netherlands Electronic Appliances In Flat Glass Market, By Type, 2019-2028 (USD Thousand)
TABLE 270 Netherlands Solar Energy In Flat Glass Market, By Application 2019-2028 (USD Thousand)
TABLE 271 Netherlands Solar Energy In Flat Glass Market, By Type, 2019-2028 (USD Thousand)
TABLE 272 Netherlands Furniture In Flat Glass Market, By Type, 2019-2028 (USD Thousand)
TABLE 273 Netherlands Others In Flat Glass Market, By Type, 2019-2028 (USD Thousand)
TABLE 274 Belgium Flat Glass Market, By Type, 2019-2028 (USD Thousand)
TABLE 275 Belgium Flat Glass Market, By Type, 2019-2028 (Thousand Square Meter)
TABLE 276 Belgium Flat Glass Market, By Function, 2019-2028 (USD Thousand)
TABLE 277 Belgium Flat Glass MARKET, BY PRODUCT, 2019-2028 (USD Thousand)
TABLE 278 Belgium Coated In Flat Glass Market, By Coating Resin, 2019-2028 (USD Thousand)
TABLE 279 Belgium Coating Technology In Flat Glass Market, BY Coating Technology, 2019-2028 (USD Thousand)
TABLE 280 Belgium Coated In Flat Glass Market, BY Coating Process, 2019-2028 (USD Thousand)
TABLE 281 Belgium Chemical Vapor Deposition (CVD) (Pyrolytic) in Flat Glass Market, By Process, 2019-2028 (USD Thousand)
TABLE 282 Belgium Flat Glass Market, BY Application, 2019-2028 (USD Thousand)
TABLE 283 Belgium Building and Construction In Flat Glass Market, By Application, 2019-2028 (USD Thousand)
TABLE 284 Belgium Building and Construction In Flat Glass Market, By Type, 2019-2028 (USD Thousand)
TABLE 285 Belgium Automotive In Flat Glass Market, By Application, 2019-2028 (USD Thousand)
TABLE 286 Belgium Automotive In Flat Glass Market, By Type, 2019-2028 (USD Thousand)
TABLE 287 Belgium Aerospace In Flat Glass Market, By Type, 2019-2028 (USD Thousand)
TABLE 288 Belgium Electronic Appliances In Flat Glass Market, By Type, 2019-2028 (USD Thousand)
TABLE 289 Belgium Solar Energy In Flat Glass Market, By Application 2019-2028 (USD Thousand)
TABLE 290 Belgium Solar Energy In Flat Glass Market, By Type, 2019-2028 (USD Thousand)
TABLE 291 Belgium Furniture In Flat Glass Market, By Type, 2019-2028 (USD Thousand)
TABLE 292 Belgium Others In Flat Glass Market, By Type, 2019-2028 (USD Thousand)
TABLE 293 Russia Flat Glass Market, By Type, 2019-2028 (USD Thousand)
TABLE 294 Russia Flat Glass Market, By Type, 2019-2028 (Thousand Square Meter)
TABLE 295 Russia Flat Glass Market, By Function, 2019-2028 (USD Thousand)
TABLE 296 Russia Flat Glass MARKET, BY PRODUCT, 2019-2028 (USD Thousand)
TABLE 297 Russia Coated In Flat Glass Market, By Coating Resin, 2019-2028 (USD Thousand)
TABLE 298 Russia Coating Technology In Flat Glass Market, BY Coating Technology, 2019-2028 (USD Thousand)
TABLE 299 Russia Coated In Flat Glass Market, BY Coating Process, 2019-2028 (USD Thousand)
TABLE 300 Russia Chemical Vapor Deposition (CVD) (Pyrolytic) in Flat Glass Market, By Process, 2019-2028 (USD Thousand)
TABLE 301 Russia Flat Glass Market, BY Application, 2019-2028 (USD Thousand)
TABLE 302 Russia Building and Construction In Flat Glass Market, By Application, 2019-2028 (USD Thousand)
TABLE 303 Russia Building and Construction In Flat Glass Market, By Type, 2019-2028 (USD Thousand)
TABLE 304 Russia Automotive In Flat Glass Market, By Application, 2019-2028 (USD Thousand)
TABLE 305 Russia Automotive In Flat Glass Market, By Type, 2019-2028 (USD Thousand)
TABLE 306 Russia Aerospace In Flat Glass Market, By Type, 2019-2028 (USD Thousand)
TABLE 307 Russia Electronic Appliances In Flat Glass Market, By Type, 2019-2028 (USD Thousand)
TABLE 308 Russia Solar Energy In Flat Glass Market, By Application 2019-2028 (USD Thousand)
TABLE 309 Russia Solar Energy In Flat Glass Market, By Type, 2019-2028 (USD Thousand)
TABLE 310 Russia Furniture In Flat Glass Market, By Type, 2019-2028 (USD Thousand)
TABLE 311 Russia Others In Flat Glass Market, By Type, 2019-2028 (USD Thousand)
TABLE 312 Turkey Flat Glass Market, By Type, 2019-2028 (USD Thousand)
TABLE 313 Turkey Flat Glass Market, By Type, 2019-2028 (Thousand Square Meter)
TABLE 314 Turkey Flat Glass Market, By Function, 2019-2028 (USD Thousand)
TABLE 315 Turkey Flat Glass MARKET, BY PRODUCT, 2019-2028 (USD Thousand)
TABLE 316 Turkey Coated In Flat Glass Market, By Coating Resin, 2019-2028 (USD Thousand)
TABLE 317 Turkey Coating Technology In Flat Glass Market, BY Coating Technology, 2019-2028 (USD Thousand)
TABLE 318 Turkey Coated In Flat Glass Market, BY Coating Process, 2019-2028 (USD Thousand)
TABLE 319 Turkey Chemical Vapor Deposition (CVD) (Pyrolytic) in Flat Glass Market By Process, 2019-2028 (USD Thousand)
TABLE 320 Turkey Flat Glass Market, BY Application, 2019-2028 (USD Thousand)
TABLE 321 Turkey Building and Construction In Flat Glass Market, By Application, 2019-2028 (USD Thousand)
TABLE 322 Turkey Building and Construction In Flat Glass Market, By Type, 2019-2028 (USD Thousand)
TABLE 323 Turkey Automotive In Flat Glass Market, By Application, 2019-2028 (USD Thousand)
TABLE 324 Turkey Automotive In Flat Glass Market, By Type, 2019-2028 (USD Thousand)
TABLE 325 Turkey Aerospace In Flat Glass Market, By Type, 2019-2028 (USD Thousand)
TABLE 326 Turkey Electronic Appliances In Flat Glass Market, By Type, 2019-2028 (USD Thousand)
TABLE 327 Turkey Solar Energy In Flat Glass Market, By Application 2019-2028 (USD Thousand)
TABLE 328 Turkey Solar Energy In Flat Glass Market, By Type, 2019-2028 (USD Thousand)
TABLE 329 Turkey Furniture In Flat Glass Market, By Type, 2019-2028 (USD Thousand)
TABLE 330 Turkey Others In Flat Glass Market, By Type, 2019-2028 (USD Thousand)
TABLE 331 Switzerland Flat Glass Market, By Type, 2019-2028 (USD Thousand)
TABLE 332 Switzerland Flat Glass Market, By Type, 2019-2028 (Thousand Square Meter)
TABLE 333 Switzerland Flat Glass Market, By Function, 2019-2028 (USD Thousand)
TABLE 334 Switzerland Flat Glass MARKET, BY PRODUCT, 2019-2028 (USD Thousand)
TABLE 335 Switzerland Coated In Flat Glass Market, By Coating Resin, 2019-2028 (USD Thousand)
TABLE 336 Switzerland Coating Technology In Flat Glass Market, BY Coating Technology, 2019-2028 (USD Thousand)
TABLE 337 Switzerland Coated In Flat Glass Market, BY Coating Process, 2019-2028 (USD Thousand)
TABLE 338 Switzerland Chemical Vapor Deposition (CVD) (Pyrolytic) in Flat Glass Market, By Process, 2019-2028 (USD Thousand)
TABLE 339 Switzerland Flat Glass Market, BY Application, 2019-2028 (USD Thousand)
TABLE 340 Switzerland Building and Construction In Flat Glass Market, By Application, 2019-2028 (USD Thousand)
TABLE 341 Switzerland Building and Construction In Flat Glass Market, By Type, 2019-2028 (USD Thousand)
TABLE 342 Switzerland Automotive In Flat Glass Market, By Application, 2019-2028 (USD Thousand)
TABLE 343 Switzerland Automotive In Flat Glass Market, By Type, 2019-2028 (USD Thousand)
TABLE 344 Switzerland Aerospace In Flat Glass Market, By Type, 2019-2028 (USD Thousand)
TABLE 345 Switzerland Electronic Appliances In Flat Glass Market, By Type, 2019-2028 (USD Thousand)
TABLE 346 Switzerland Solar Energy In Flat Glass Market, By Application 2019-2028 (USD Thousand)
TABLE 347 Switzerland Solar Energy In Flat Glass Market, By Type, 2019-2028 (USD Thousand)
TABLE 348 Switzerland Furniture In Flat Glass Market, By Type, 2019-2028 (USD Thousand)
TABLE 349 Switzerland Others In Flat Glass Market, By Type, 2019-2028 (USD Thousand)
TABLE 350 Rest of Europe Flat Glass Market, By Type, 2019-2028 (USD Thousand)
TABLE 351 Rest of Europe Flat Glass Market, By Type, 2019-2028 (Thousand Square Meter)
TABLE 352 Asia-Pacific flat glass Market, BY COUNtry,2019-2028 (USD Thousand)
TABLE 353 Asia-Pacific flat glass Market, BY COUNtry,2019-2028 (Thousand square meter)
TABLE 354 Asia-Pacific Flat Glass Market, By Type, 2019-2028 (USD Thousand)
TABLE 355 Asia-Pacific Flat Glass Market, By Type, 2019-2028 (Thousand Square Meter)
TABLE 356 Asia-Pacific Flat Glass Market, By Function, 2019-2028 (USD Thousand)
TABLE 357 Asia-Pacific Flat Glass MARKET, BY PRODUCT, 2019-2028 (USD Thousand)
TABLE 358 Asia-Pacific Coated In Flat Glass Market, By Coating Resin, 2019-2028 (USD Thousand)
TABLE 359 Asia-Pacific Coating Technology In Flat Glass Market, BY Coating Technology, 2019-2028 (USD Thousand)
TABLE 360 Asia-Pacific Coated In Flat Glass Market, BY Coating Process, 2019-2028 (USD Thousand)
TABLE 361 Asia-Pacific Chemical Vapor Deposition (CVD) (Pyrolytic) in Flat Glass Market, By Process, 2019-2028 (USD Thousand)
TABLE 362 Asia-Pacific Flat Glass Market, BY Application, 2019-2028 (USD Thousand)
TABLE 363 Asia-Pacific Building and Construction In Flat Glass Market, By Application, 2019-2028 (USD Thousand)
TABLE 364 Asia-Pacific Building and Construction In Flat Glass Market, By Type, 2019-2028 (USD Thousand)
TABLE 365 Asia-Pacific Automotive In Flat Glass Market, By Application, 2019-2028 (USD Thousand)
TABLE 366 Asia-Pacific Automotive In Flat Glass Market, By Type, 2019-2028 (USD Thousand)
TABLE 367 Asia-Pacific Aerospace In Flat Glass Market, By Type, 2019-2028 (USD Thousand)
TABLE 368 Asia-Pacific Electronic Appliances In Flat Glass Market, By Type, 2019-2028 (USD Thousand)
TABLE 369 Asia-Pacific Solar Energy In Flat Glass Market, By Application 2019-2028 (USD Thousand)
TABLE 370 Asia-Pacific Solar Energy In Flat Glass Market, By Type, 2019-2028 (USD Thousand)
TABLE 371 Asia-Pacific Furniture In Flat Glass Market, By Type, 2019-2028 (USD Thousand)
TABLE 372 Asia-Pacific Others In Flat Glass Market, By Type, 2019-2028 (USD Thousand)
TABLE 373 China Flat Glass Market, By Type, 2019-2028 (USD Thousand)
TABLE 374 China Flat Glass Market, By Type, 2019-2028 (Thousand Square Meter)
TABLE 375 China Flat Glass Market, By Function, 2019-2028 (USD Thousand)
TABLE 376 China Flat Glass MARKET, BY PRODUCT, 2019-2028 (USD Thousand)
TABLE 377 China Coated In Flat Glass Market, By Coating Resin, 2019-2028 (USD Thousand)
TABLE 378 China Coating Technology In Flat Glass Market, BY Coating Technology, 2019-2028 (USD Thousand)
TABLE 379 China Coated In Flat Glass Market, BY Coating Process, 2019-2028 (USD Thousand)
TABLE 380 China Chemical Vapor Deposition (CVD) (Pyrolytic) in Flat Glass Market, By Process, 2019-2028 (USD Thousand)
TABLE 381 China Flat Glass Market, BY Application, 2019-2028 (USD Thousand)
TABLE 382 China Building and Construction In Flat Glass Market, By Application, 2019-2028 (USD Thousand)
TABLE 383 China Building and Construction In Flat Glass Market, By Type, 2019-2028 (USD Thousand)
TABLE 384 China Automotive In Flat Glass Market, By Application, 2019-2028 (USD Thousand)
TABLE 385 China Automotive In Flat Glass Market, By Type, 2019-2028 (USD Thousand)
TABLE 386 China Aerospace In Flat Glass Market, By Type, 2019-2028 (USD Thousand)
TABLE 387 China Electronic Appliances In Flat Glass Market, By Type, 2019-2028 (USD Thousand)
TABLE 388 China Solar Energy In Flat Glass Market, By Application 2019-2028 (USD Thousand)
TABLE 389 China Solar Energy In Flat Glass Market, By Type, 2019-2028 (USD Thousand)
TABLE 390 China Furniture In Flat Glass Market, By Type, 2019-2028 (USD Thousand)
TABLE 391 China Others In Flat Glass Market, By Type, 2019-2028 (USD Thousand)
TABLE 392 INDIA Flat Glass Market, By Type, 2019-2028 (USD Thousand)
TABLE 393 INDIA Flat Glass Market, By Type, 2019-2028 (Thousand Square Meter)
TABLE 394 INDIA Flat Glass Market, By Function, 2019-2028 (USD Thousand)
TABLE 395 INDIA Flat Glass MARKET, BY PRODUCT, 2019-2028 (USD Thousand)
TABLE 396 INDIA Coated In Flat Glass Market, By Coating Resin, 2019-2028 (USD Thousand)
TABLE 397 INDIA Coating Technology In Flat Glass Market, BY Coating Technology, 2019-2028 (USD Thousand)
TABLE 398 INDIA Coated In Flat Glass Market, BY Coating Process, 2019-2028 (USD Thousand)
TABLE 399 INDIA Chemical Vapor Deposition (CVD) (Pyrolytic) in Flat Glass Market By Process, 2019-2028 (USD Thousand)
TABLE 400 INDIA Flat Glass Market, BY Application, 2019-2028 (USD Thousand)
TABLE 401 INDIA Building and Construction In Flat Glass Market, By Application, 2019-2028 (USD Thousand)
TABLE 402 INDIA Building and Construction In Flat Glass Market, By Type, 2019-2028 (USD Thousand)
TABLE 403 INDIA Automotive In Flat Glass Market, By Application, 2019-2028 (USD Thousand)
TABLE 404 INDIA Automotive In Flat Glass Market, By Type, 2019-2028 (USD Thousand)
TABLE 405 INDIA Aerospace In Flat Glass Market, By Type, 2019-2028 (USD Thousand)
TABLE 406 INDIA Electronic Appliances In Flat Glass Market, By Type, 2019-2028 (USD Thousand)
TABLE 407 INDIA Solar Energy In Flat Glass Market, By Application 2019-2028 (USD Thousand)
TABLE 408 INDIA Solar Energy In Flat Glass Market, By Type, 2019-2028 (USD Thousand)
TABLE 409 INDIA Furniture In Flat Glass Market, By Type, 2019-2028 (USD Thousand)
TABLE 410 INDIA Others In Flat Glass Market, By Type, 2019-2028 (USD Thousand)
TABLE 411 Japan Flat Glass Market, By Type, 2019-2028 (USD Thousand)
TABLE 412 Japan Flat Glass Market, By Type, 2019-2028 (Thousand Square Meter)
TABLE 413 Japan Flat Glass Market, By Function, 2019-2028 (USD Thousand)
TABLE 414 Japan Flat Glass MARKET, BY PRODUCT, 2019-2028 (USD Thousand)
TABLE 415 Japan Coated In Flat Glass Market, By Coating Resin, 2019-2028 (USD Thousand)
TABLE 416 Japan Coating Technology In Flat Glass Market, BY Coating Technology, 2019-2028 (USD Thousand)
TABLE 417 Japan Coated In Flat Glass Market, BY Coating Process, 2019-2028 (USD Thousand)
TABLE 418 Japan Chemical Vapor Deposition (CVD) (Pyrolytic) in Flat Glass Market, By Process, 2019-2028 (USD Thousand)
TABLE 419 Japan Flat Glass Market, BY Application, 2019-2028 (USD Thousand)
TABLE 420 Japan Building and Construction In Flat Glass Market, By Application, 2019-2028 (USD Thousand)
TABLE 421 Japan Building and Construction In Flat Glass Market, By Type, 2019-2028 (USD Thousand)
TABLE 422 Japan Automotive In Flat Glass Market, By Application, 2019-2028 (USD Thousand)
TABLE 423 Japan Automotive In Flat Glass Market, By Type, 2019-2028 (USD Thousand)
TABLE 424 Japan Aerospace In Flat Glass Market, By Type, 2019-2028 (USD Thousand)
TABLE 425 Japan Electronic Appliances In Flat Glass Market, By Type, 2019-2028 (USD Thousand)
TABLE 426 Japan Solar Energy In Flat Glass Market, By Application, 2019-2028 (USD Thousand)
TABLE 427 Japan Solar Energy In Flat Glass Market, By Type, 2019-2028 (USD Thousand)
TABLE 428 Japan Furniture In Flat Glass Market, By Type, 2019-2028 (USD Thousand)
TABLE 429 Japan Others In Flat Glass Market, By Type, 2019-2028 (USD Thousand)
TABLE 430 South Korea Flat Glass Market, By Type, 2019-2028 (USD Thousand)
TABLE 431 South Korea Flat Glass Market, By Type, 2019-2028 (Thousand Square Meter)
TABLE 432 South Korea Flat Glass Market, By Function, 2019-2028 (USD Thousand)
TABLE 433 South Korea Flat Glass MARKET, BY PRODUCT, 2019-2028 (USD Thousand)
TABLE 434 South Korea Coated In Flat Glass Market, By Coating Resin, 2019-2028 (USD Thousand)
TABLE 435 South Korea Coating Technology In Flat Glass Market, BY Coating Technology, 2019-2028 (USD Thousand)
TABLE 436 South Korea Coated In Flat Glass Market, BY Coating Process, 2019-2028 (USD Thousand)
TABLE 437 South Korea Chemical Vapor Deposition (CVD) (Pyrolytic) in Flat Glass Market, By Process, 2019-2028 (USD Thousand)
TABLE 438 South Korea Flat Glass Market, BY Application, 2019-2028 (USD Thousand)
TABLE 439 South Korea Building and Construction In Flat Glass Market, By Application, 2019-2028 (USD Thousand)
TABLE 440 South Korea Building and Construction In Flat Glass Market, By Type, 2019-2028 (USD Thousand)
TABLE 441 South Korea Automotive In Flat Glass Market, By Application, 2019-2028 (USD Thousand)
TABLE 442 South Korea Automotive In Flat Glass Market, By Type, 2019-2028 (USD Thousand)
TABLE 443 South Korea Aerospace In Flat Glass Market, By Type, 2019-2028 (USD Thousand)
TABLE 444 South Korea Electronic Appliances In Flat Glass Market, By Type, 2019-2028 (USD Thousand)
TABLE 445 South Korea Solar Energy In Flat Glass Market, By Application 2019-2028 (USD Thousand)
TABLE 446 South Korea Solar Energy In Flat Glass Market, By Type, 2019-2028 (USD Thousand)
TABLE 447 South Korea Furniture In Flat Glass Market, By Type, 2019-2028 (USD Thousand)
TABLE 448 South Korea Others In Flat Glass Market, By Type, 2019-2028 (USD Thousand)
TABLE 449 Australia and New Zealand Flat Glass Market, By Type, 2019-2028 (USD Thousand)
TABLE 450 Australia and New Zealand Flat Glass Market, By Type, 2019-2028 (Thousand Square Meter)
TABLE 451 Australia and New Zealand Flat Glass Market, By Function, 2019-2028 (USD Thousand)
TABLE 452 Australia and New Zealand Flat Glass Market, BY Product, 2019-2028 (USD Thousand)
TABLE 453 Australia and New Zealand Coated In Flat Glass Market, By Coating Resin, 2019-2028 (USD Thousand)
TABLE 454 Australia and New Zealand Coating Technology In Flat Glass Market, BY Coating Technology, 2019-2028 (USD Thousand)
TABLE 455 Australia and New Zealand Coated In Flat Glass Market, BY Coating Process, 2019-2028 (USD Thousand)
TABLE 456 Australia and New Zealand Chemical Vapor Deposition (CVD) (Pyrolytic) in Flat Glass Market, By Process, 2019-2028 (USD Thousand)
TABLE 457 Australia and New Zealand Flat Glass Market, BY Application, 2019-2028 (USD Thousand)
TABLE 458 Australia and New Zealand Building and Construction In Flat Glass Market, By Application, 2019-2028 (USD Thousand)
TABLE 459 Australia and New Zealand Building and Construction In Flat Glass Market, By Type, 2019-2028 (USD Thousand)
TABLE 460 Australia and New Zealand Automotive In Flat Glass Market, By Application, 2019-2028 (USD Thousand)
TABLE 461 Australia and New Zealand Automotive In Flat Glass Market, By Type, 2019-2028 (USD Thousand)
TABLE 462 Australia and New Zealand Aerospace In Flat Glass Market, By Type, 2019-2028 (USD Thousand)
TABLE 463 Australia and New Zealand Electronic Appliances In Flat Glass Market, By Type, 2019-2028 (USD Thousand)
TABLE 464 Australia and New Zealand Solar Energy In Flat Glass Market, By Application 2019-2028 (USD Thousand)
TABLE 465 Australia and New Zealand Solar Energy In Flat Glass Market, By Type, 2019-2028 (USD Thousand)
TABLE 466 Australia and New Zealand Furniture In Flat Glass Market, By Type, 2019-2028 (USD Thousand)
TABLE 467 Australia and New Zealand Others In Flat Glass Market, By Type, 2019-2028 (USD Thousand)
TABLE 468 Indonesia Flat Glass Market, By Type, 2019-2028 (USD Thousand)
TABLE 469 Indonesia Flat Glass Market, By Type, 2019-2028 (Thousand Square Meter)
TABLE 470 Indonesia Flat Glass Market, By Function, 2019-2028 (USD Thousand)
TABLE 471 Indonesia Flat Glass MARKET, BY PRODUCT, 2019-2028 (USD Thousand)
TABLE 472 Indonesia Coated In Flat Glass Market, By Coating Resin, 2019-2028 (USD Thousand)
TABLE 473 Indonesia Coating Technology In Flat Glass Market, BY Coating Technology, 2019-2028 (USD Thousand)
TABLE 474 Indonesia Coated In Flat Glass Market, BY Coating Process, 2019-2028 (USD Thousand)
TABLE 475 Indonesia Chemical Vapor Deposition (CVD) (Pyrolytic) in Flat Glass Market, By Process, 2019-2028 (USD Thousand)
TABLE 476 Indonesia Flat Glass Market, BY Application, 2019-2028 (USD Thousand)
TABLE 477 Indonesia Building and Construction In Flat Glass Market, By Application, 2019-2028 (USD Thousand)
TABLE 478 Indonesia Building and Construction In Flat Glass Market, By Type, 2019-2028 (USD Thousand)
TABLE 479 Indonesia Automotive In Flat Glass Market, By Application, 2019-2028 (USD Thousand)
TABLE 480 Indonesia Automotive In Flat Glass Market, By Type, 2019-2028 (USD Thousand)
TABLE 481 Indonesia Aerospace In Flat Glass Market, By Type, 2019-2028 (USD Thousand)
TABLE 482 Indonesia Electronic Appliances In Flat Glass Market, By Type, 2019-2028 (USD Thousand)
TABLE 483 Indonesia Solar Energy In Flat Glass Market, By Application 2019-2028 (USD Thousand)
TABLE 484 Indonesia Solar Energy In Flat Glass Market, By Type, 2019-2028 (USD Thousand)
TABLE 485 Indonesia Furniture In Flat Glass Market, By Type, 2019-2028 (USD Thousand)
TABLE 486 Indonesia Others In Flat Glass Market, By Type, 2019-2028 (USD Thousand)
TABLE 487 Singapore Flat Glass Market, By Type, 2019-2028 (USD Thousand)
TABLE 488 Singapore Flat Glass Market, By Type, 2019-2028 (Thousand Square Meter)
TABLE 489 Singapore Flat Glass Market, By Function, 2019-2028 (USD Thousand)
TABLE 490 Singapore Flat Glass MARKET, BY PRODUCT, 2019-2028 (USD Thousand)
TABLE 491 Singapore Coated In Flat Glass Market, By Coating Resin, 2019-2028 (USD Thousand)
TABLE 492 Singapore Coating Technology In Flat Glass Market, BY Coating Technology, 2019-2028 (USD Thousand)
TABLE 493 Singapore Coated In Flat Glass Market, BY Coating Process, 2019-2028 (USD Thousand)
TABLE 494 Singapore Chemical Vapor Deposition (CVD) (Pyrolytic) in Flat Glass Market, By Process, 2019-2028 (USD Thousand)
TABLE 495 Singapore Flat Glass Market, BY Application, 2019-2028 (USD Thousand)
TABLE 496 Singapore Building and Construction In Flat Glass Market, By Application, 2019-2028 (USD Thousand)
TABLE 497 Singapore Building and Construction In Flat Glass Market, By Type, 2019-2028 (USD Thousand)
TABLE 498 Singapore Automotive In Flat Glass Market, By Application, 2019-2028 (USD Thousand)
TABLE 499 Singapore Automotive In Flat Glass Market, By Type, 2019-2028 (USD Thousand)
TABLE 500 Singapore Aerospace In Flat Glass Market, By Type, 2019-2028 (USD Thousand)
TABLE 501 Singapore Electronic Appliances In Flat Glass Market, By Type, 2019-2028 (USD Thousand)
TABLE 502 Singapore Solar Energy In Flat Glass Market, By Application 2019-2028 (USD Thousand)
TABLE 503 Singapore Solar Energy In Flat Glass Market, By Type, 2019-2028 (USD Thousand)
TABLE 504 Singapore Furniture In Flat Glass Market, By Type, 2019-2028 (USD Thousand)
TABLE 505 Singapore Others In Flat Glass Market, By Type, 2019-2028 (USD Thousand)
TABLE 506 Malaysia Flat Glass Market, By Type, 2019-2028 (USD Thousand)
TABLE 507 Malaysia Flat Glass Market, By Type, 2019-2028 (Thousand Square Meter)
TABLE 508 Malaysia Flat Glass Market, By Function, 2019-2028 (USD Thousand)
TABLE 509 Malaysia Flat Glass MARKET, BY PRODUCT, 2019-2028 (USD Thousand)
TABLE 510 Malaysia Coated In Flat Glass Market, By Coating Resin, 2019-2028 (USD Thousand)
TABLE 511 Malaysia Coating Technology In Flat Glass Market, BY Coating Technology, 2019-2028 (USD Thousand)
TABLE 512 Malaysia Coated In Flat Glass Market, BY Coating Process, 2019-2028 (USD Thousand)
TABLE 513 Malaysia Chemical Vapor Deposition (CVD) (Pyrolytic) in Flat Glass Market, By Process, 2019-2028 (USD Thousand)
TABLE 514 Malaysia Flat Glass Market, BY Application, 2019-2028 (USD Thousand)
TABLE 515 Malaysia Building and Construction In Flat Glass Market, By Application, 2019-2028 (USD Thousand)
TABLE 516 Malaysia Building and Construction In Flat Glass Market, By Type, 2019-2028 (USD Thousand)
TABLE 517 Malaysia Automotive In Flat Glass Market, By Application, 2019-2028 (USD Thousand)
TABLE 518 Malaysia Automotive In Flat Glass Market, By Type, 2019-2028 (USD Thousand)
TABLE 519 Malaysia Aerospace In Flat Glass Market, By Type, 2019-2028 (USD Thousand)
TABLE 520 Malaysia Electronic Appliances In Flat Glass Market, By Type, 2019-2028 (USD Thousand)
TABLE 521 Malaysia Solar Energy In Flat Glass Market, By Application 2019-2028 (USD Thousand)
TABLE 522 Malaysia Solar Energy In Flat Glass Market, By Type, 2019-2028 (USD Thousand)
TABLE 523 Malaysia Furniture In Flat Glass Market, By Type, 2019-2028 (USD Thousand)
TABLE 524 Malaysia Others In Flat Glass Market, By Type, 2019-2028 (USD Thousand)
TABLE 525 Thailand Flat Glass Market, By Type, 2019-2028 (USD Thousand)
TABLE 526 Thailand Flat Glass Market, By Type, 2019-2028 (Thousand Square Meter)
TABLE 527 Thailand Flat Glass Market, By Function, 2019-2028 (USD Thousand)
TABLE 528 Thailand Flat Glass MARKET, BY PRODUCT, 2019-2028 (USD Thousand)
TABLE 529 Thailand Coated In Flat Glass Market, By Coating Resin, 2019-2028 (USD Thousand)
TABLE 530 Thailand Coating Technology In Flat Glass Market, BY Coating Technology, 2019-2028 (USD Thousand)
TABLE 531 Thailand Coated In Flat Glass Market, BY Coating Process, 2019-2028 (USD Thousand)
TABLE 532 Thailand Chemical Vapor Deposition (CVD) (Pyrolytic) in Flat Glass Market, By Process, 2019-2028 (USD Thousand)
TABLE 533 Thailand Flat Glass Market, BY Application, 2019-2028 (USD Thousand)
TABLE 534 Thailand Building and Construction In Flat Glass Market, By Application, 2019-2028 (USD Thousand)
TABLE 535 Thailand Building and Construction In Flat Glass Market, By Type, 2019-2028 (USD Thousand)
TABLE 536 Thailand Automotive In Flat Glass Market, By Application, 2019-2028 (USD Thousand)
TABLE 537 Thailand Automotive In Flat Glass Market, By Type, 2019-2028 (USD Thousand)
TABLE 538 Thailand Aerospace In Flat Glass Market, By Type, 2019-2028 (USD Thousand)
TABLE 539 Thailand Electronic Appliances In Flat Glass Market, By Type, 2019-2028 (USD Thousand)
TABLE 540 Thailand Solar Energy In Flat Glass Market, By Application, 2019-2028 (USD Thousand)
TABLE 541 Thailand Solar Energy In Flat Glass Market, By Type, 2019-2028 (USD Thousand)
TABLE 542 Thailand Furniture In Flat Glass Market, By Type, 2019-2028 (USD Thousand)
TABLE 543 Thailand Others In Flat Glass Market, By Type, 2019-2028 (USD Thousand)
TABLE 544 Philippines Flat Glass Market, By Type, 2019-2028 (USD Thousand)
TABLE 545 Philippines Flat Glass Market, By Type, 2019-2028 (Thousand Square Meter)
TABLE 546 Philippines Flat Glass Market, By Function, 2019-2028 (USD Thousand)
TABLE 547 Philippines Flat Glass MARKET, BY PRODUCT, 2019-2028 (USD Thousand)
TABLE 548 Philippines Coated In Flat Glass Market, By Coating Resin, 2019-2028 (USD Thousand)
TABLE 549 Philippines Coating Technology In Flat Glass Market, BY Coating Technology, 2019-2028 (USD Thousand)
TABLE 550 Philippines Coated In Flat Glass Market, BY Coating Process, 2019-2028 (USD Thousand)
TABLE 551 Philippines Chemical Vapor Deposition (CVD) (Pyrolytic) in Flat Glass Market, By Process, 2019-2028 (USD Thousand)
TABLE 552 Philippines Flat Glass Market, BY Application, 2019-2028 (USD Thousand)
TABLE 553 Philippines Building and Construction In Flat Glass Market, By Application, 2019-2028 (USD Thousand)
TABLE 554 Philippines Building and Construction In Flat Glass Market, By Type, 2019-2028 (USD Thousand)
TABLE 555 Philippines Automotive In Flat Glass Market, By Application, 2019-2028 (USD Thousand)
TABLE 556 Philippines Automotive In Flat Glass Market, By Type, 2019-2028 (USD Thousand)
TABLE 557 Philippines Aerospace In Flat Glass Market, By Type, 2019-2028 (USD Thousand)
TABLE 558 Philippines Electronic Appliances In Flat Glass Market, By Type, 2019-2028 (USD Thousand)
TABLE 559 Philippines Solar Energy In Flat Glass Market, By Application 2019-2028 (USD Thousand)
TABLE 560 Philippines Solar Energy In Flat Glass Market, By Type, 2019-2028 (USD Thousand)
TABLE 561 Philippines Furniture In Flat Glass Market, By Type, 2019-2028 (USD Thousand)
TABLE 562 Philippines Others In Flat Glass Market, By Type, 2019-2028 (USD Thousand)
TABLE 563 Rest of Asia-Pacific Flat Glass Market, By Type, 2019-2028 (USD Thousand)
TABLE 564 Rest of Asia-Pacific Flat Glass Market, By Type, 2019-2028 (Thousand Square Meter)
TABLE 565 Middle East and Africa flat glass Market, BY COUNtry, 2019-2028 (USD Thousand)
TABLE 566 Middle East and Africa flat glass MARKET, BY COUNtry,2019-2028 (Thousand Square meter)
TABLE 567 Middle East and Africa Flat Glass Market, By Type, 2019-2028 (USD Thousand)
TABLE 568 Middle East and Africa Flat Glass Market, By Type, 2019-2028 (Thousand Square Meter)
TABLE 569 Middle East and Africa Flat Glass Market, By Function, 2019-2028 (USD Thousand)
TABLE 570 Middle East and Africa Flat Glass MARKET, BY Product, 2019-2028 (USD Thousand)
TABLE 571 Middle East and Africa Coated In Flat Glass Market, By Coating Resin, 2019-2028 (USD Thousand)
TABLE 572 Middle East and Africa Coating Technology In Flat Glass Market, BY Coating Technology, 2019-2028 (USD Thousand)
TABLE 573 Middle East and Africa Coated In Flat Glass Market, BY Coating Process, 2019-2028 (USD Thousand)
TABLE 574 Middle East and Africa Chemical Vapor Deposition (CVD) (Pyrolytic) in Flat Glass Market, By Process, 2019-2028 (USD Thousand)
TABLE 575 Middle East and Africa Flat Glass Market, BY Application, 2019-2028 (USD Thousand)
TABLE 576 Middle East and Africa Building and Construction In Flat Glass Market, By Application, 2019-2028 (USD Thousand)
TABLE 577 Middle East and Africa Building and Construction In Flat Glass Market, By Type, 2019-2028 (USD Thousand)
TABLE 578 Middle East and Africa Automotive In Flat Glass Market, By Application, 2019-2028 (USD Thousand)
TABLE 579 Middle East and Africa Automotive In Flat Glass Market, By Type, 2019-2028 (USD Thousand)
TABLE 580 Middle East and Africa Aerospace In Flat Glass Market, By Type, 2019-2028 (USD Thousand)
TABLE 581 Middle East and Africa Electronic Appliances In Flat Glass Market, By Type, 2019-2028 (USD Thousand)
TABLE 582 Middle East and Africa Solar Energy In Flat Glass Market, By Application 2019-2028 (USD Thousand)
TABLE 583 Middle East and Africa Solar Energy In Flat Glass Market, By Type, 2019-2028 (USD Thousand)
TABLE 584 Middle East and Africa Furniture In Flat Glass Market, By Type, 2019-2028 (USD Thousand)
TABLE 585 Middle East and Africa Others In Flat Glass Market, By Type, 2019-2028 (USD Thousand)
TABLE 586 U.A.E. Flat Glass Market, By Type, 2019-2028 (USD Thousand)
TABLE 587 U.A.E. Flat Glass Market, By Type, 2019-2028 (Thousand Square Meter)
TABLE 588 U.A.E. Flat Glass Market, By Function, 2019-2028 (USD Thousand)
TABLE 589 U.A.E. Flat Glass MARKET, BY Product, 2019-2028 (USD Thousand)
TABLE 590 U.A.E. Coated In Flat Glass Market, By Coating Resin, 2019-2028 (USD Thousand)
TABLE 591 U.A.E. Coating Technology In Flat Glass Market, BY Coating Technology, 2019-2028 (USD Thousand)
TABLE 592 U.A.E. Coated In Flat Glass Market, BY Coating Process, 2019-2028 (USD Thousand)
TABLE 593 U.A.E. Chemical Vapor Deposition (CVD) (Pyrolytic) in Flat Glass Market By Process, 2019-2028 (USD Thousand)
TABLE 594 U.A.E. Flat Glass Market, BY Application, 2019-2028 (USD Thousand)
TABLE 595 U.A.E. Building and Construction In Flat Glass Market, By Application, 2019-2028 (USD Thousand)
TABLE 596 U.A.E. Building and Construction In Flat Glass Market, By Type, 2019-2028 (USD Thousand)
TABLE 597 U.A.E. Automotive In Flat Glass Market, By Application, 2019-2028 (USD Thousand)
TABLE 598 U.A.E. Automotive In Flat Glass Market, By Type, 2019-2028 (USD Thousand)
TABLE 599 U.A.E. Aerospace In Flat Glass Market, By Type, 2019-2028 (USD Thousand)
TABLE 600 U.A.E. Electronic Appliances In Flat Glass Market, By Type, 2019-2028 (USD Thousand)
TABLE 601 U.A.E. Solar Energy In Flat Glass Market, By Application 2019-2028 (USD Thousand)
TABLE 602 U.A.E. Solar Energy In Flat Glass Market, By Type, 2019-2028 (USD Thousand)
TABLE 603 U.A.E. Furniture In Flat Glass Market, By Type, 2019-2028 (USD Thousand)
TABLE 604 U.A.E. Others In Flat Glass Market, By Type, 2019-2028 (USD Thousand)
TABLE 605 Saudi Arabia Flat Glass Market, By Type, 2019-2028 (USD Thousand)
TABLE 606 Saudi Arabia Flat Glass Market, By Type, 2019-2028 (Thousand Square Meter)
TABLE 607 Saudi Arabia Flat Glass Market, By Function, 2019-2028 (USD Thousand)
TABLE 608 Saudi Arabia Flat Glass MARKET, BY Product, 2019-2028 (USD Thousand)
TABLE 609 Saudi Arabia Coated In Flat Glass Market, By Coating Resin, 2019-2028 (USD Thousand)
TABLE 610 Saudi Arabia Coating Technology In Flat Glass Market, BY Coating Technology, 2019-2028 (USD Thousand)
TABLE 611 Saudi Arabia Coated In Flat Glass Market, BY Coating Process, 2019-2028 (USD Thousand)
TABLE 612 Saudi Arabia Chemical Vapor Deposition (CVD) (Pyrolytic) in Flat Glass Market, By Process, 2019-2028 (USD Thousand)
TABLE 613 Saudi Arabia Flat Glass Market, BY Application, 2019-2028 (USD Thousand)
TABLE 614 Saudi Arabia Building and Construction In Flat Glass Market, By Application, 2019-2028 (USD Thousand)
TABLE 615 Saudi Arabia Building and Construction In Flat Glass Market, By Type, 2019-2028 (USD Thousand)
TABLE 616 Saudi Arabia Automotive In Flat Glass Market, By Application, 2019-2028 (USD Thousand)
TABLE 617 Saudi Arabia Automotive In Flat Glass Market, By Type, 2019-2028 (USD Thousand)
TABLE 618 Saudi Arabia Aerospace In Flat Glass Market, By Type, 2019-2028 (USD Thousand)
TABLE 619 Saudi Arabia Electronic Appliances In Flat Glass Market, By Type, 2019-2028 (USD Thousand)
TABLE 620 Saudi Arabia Solar Energy In Flat Glass Market, By Application, 2019-2028 (USD Thousand)
TABLE 621 Saudi Arabia Solar Energy In Flat Glass Market, By Type, 2019-2028 (USD Thousand)
TABLE 622 Saudi Arabia Furniture In Flat Glass Market, By Type, 2019-2028 (USD Thousand)
TABLE 623 Saudi Arabia Others In Flat Glass Market, By Type, 2019-2028 (USD Thousand)
TABLE 624 South Africa Flat Glass Market, By Type, 2019-2028 (USD Thousand)
TABLE 625 South Africa Flat Glass Market, By Type, 2019-2028 (Thousand Square Meter)
TABLE 626 South Africa Flat Glass Market, By Function, 2019-2028 (USD Thousand)
TABLE 627 South Africa Flat Glass MARKET, BY Product, 2019-2028 (USD Thousand)
TABLE 628 South Africa Coated In Flat Glass Market, By Coating Resin, 2019-2028 (USD Thousand)
TABLE 629 South Africa Coating Technology In Flat Glass Market, BY Coating Technology, 2019-2028 (USD Thousand)
TABLE 630 South Africa Coated In Flat Glass Market, BY Coating Process, 2019-2028 (USD Thousand)
TABLE 631 South Africa Chemical Vapor Deposition (CVD) (Pyrolytic) in Flat Glass Market By Process, 2019-2028 (USD Thousand)
TABLE 632 South Africa Flat Glass Market, BY Application, 2019-2028 (USD Thousand)
TABLE 633 South Africa Building and Construction In Flat Glass Market, By Application, 2019-2028 (USD Thousand)
TABLE 634 South Africa Building and Construction In Flat Glass Market, By Type, 2019-2028 (USD Thousand)
TABLE 635 South Africa Automotive In Flat Glass Market, By Application, 2019-2028 (USD Thousand)
TABLE 636 South Africa Automotive In Flat Glass Market, By Type, 2019-2028 (USD Thousand)
TABLE 637 South Africa Aerospace In Flat Glass Market, By Type, 2019-2028 (USD Thousand)
TABLE 638 South Africa Electronic Appliances In Flat Glass Market, By Type, 2019-2028 (USD Thousand)
TABLE 639 South Africa Solar Energy In Flat Glass Market, By Application 2019-2028 (USD Thousand)
TABLE 640 South Africa Solar Energy In Flat Glass Market, By Type, 2019-2028 (USD Thousand)
TABLE 641 South Africa Furniture In Flat Glass Market, By Type, 2019-2028 (USD Thousand)
TABLE 642 South Africa Others In Flat Glass Market, By Type, 2019-2028 (USD Thousand)
TABLE 643 Egypt Flat Glass Market, By Type, 2019-2028 (USD Thousand)
TABLE 644 Egypt Flat Glass Market, By Type, 2019-2028 (Thousand Square Meter)
TABLE 645 Egypt Flat Glass Market, By Function, 2019-2028 (USD Thousand)
TABLE 646 Egypt Flat Glass MARKET, BY Product, 2019-2028 (USD Thousand)
TABLE 647 Egypt Coated In Flat Glass Market, By Coating Resin, 2019-2028 (USD Thousand)
TABLE 648 Egypt Coating Technology In Flat Glass Market, BY Coating Technology, 2019-2028 (USD Thousand)
TABLE 649 Egypt Coated In Flat Glass Market, BY Coating Process, 2019-2028 (USD Thousand)
TABLE 650 Egypt Chemical Vapor Deposition (CVD) (Pyrolytic) in Flat Glass Market By Process, 2019-2028 (USD Thousand)
TABLE 651 Egypt Flat Glass Market, BY Application, 2019-2028 (USD Thousand)
TABLE 652 Egypt Building and Construction In Flat Glass Market, By Application, 2019-2028 (USD Thousand)
TABLE 653 Egypt Building and Construction In Flat Glass Market, By Type, 2019-2028 (USD Thousand)
TABLE 654 Egypt Automotive In Flat Glass Market, By Application, 2019-2028 (USD Thousand)
TABLE 655 Egypt Automotive In Flat Glass Market, By Type, 2019-2028 (USD Thousand)
TABLE 656 Egypt Aerospace In Flat Glass Market, By Type, 2019-2028 (USD Thousand)
TABLE 657 Egypt Electronic Appliances In Flat Glass Market, By Type, 2019-2028 (USD Thousand)
TABLE 658 Egypt Solar Energy In Flat Glass Market, By Application 2019-2028 (USD Thousand)
TABLE 659 Egypt Solar Energy In Flat Glass Market, By Type, 2019-2028 (USD Thousand)
TABLE 660 Egypt Furniture In Flat Glass Market, By Type, 2019-2028 (USD Thousand)
TABLE 661 Egypt Others In Flat Glass Market, By Type, 2019-2028 (USD Thousand)
TABLE 662 Israel Flat Glass Market, By Type, 2019-2028 (USD Thousand)
TABLE 663 Israel Flat Glass Market, By Type, 2019-2028 (Thousand Square Meter)
TABLE 664 Israel Flat Glass Market, By Function, 2019-2028 (USD Thousand)
TABLE 665 Israel Flat Glass MARKET, BY Product, 2019-2028 (USD Thousand)
TABLE 666 Israel Coated In Flat Glass Market, By Coating Resin, 2019-2028 (USD Thousand)
TABLE 667 Israel Coating Technology In Flat Glass Market, BY Coating Technology, 2019-2028 (USD Thousand)
TABLE 668 Israel Coated In Flat Glass Market, BY Coating Process, 2019-2028 (USD Thousand)
TABLE 669 Israel Chemical Vapor Deposition (CVD) (Pyrolytic) in Flat Glass Market By Process, 2019-2028 (USD Thousand)
TABLE 670 Israel Flat Glass Market, BY Application, 2019-2028 (USD Thousand)
TABLE 671 Israel Building and Construction In Flat Glass Market, By Application, 2019-2028 (USD Thousand)
TABLE 672 Israel Building and Construction In Flat Glass Market, By Type, 2019-2028 (USD Thousand)
TABLE 673 Israel Automotive In Flat Glass Market, By Application, 2019-2028 (USD Thousand)
TABLE 674 Israel Automotive In Flat Glass Market, By Type, 2019-2028 (USD Thousand)
TABLE 675 Israel Aerospace In Flat Glass Market, By Type, 2019-2028 (USD Thousand)
TABLE 676 Israel Electronic Appliances In Flat Glass Market, By Type, 2019-2028 (USD Thousand)
TABLE 677 Israel Solar Energy In Flat Glass Market, By Application, 2019-2028 (USD Thousand)
TABLE 678 Israel Solar Energy In Flat Glass Market, By Type, 2019-2028 (USD Thousand)
TABLE 679 Israel Furniture In Flat Glass Market, By Type, 2019-2028 (USD Thousand)
TABLE 680 Israel Others In Flat Glass Market, By Type, 2019-2028 (USD Thousand)
TABLE 681 Rest of Middle East and Africa Flat Glass Market, By Type, 2019-2028 (USD Thousand)
TABLE 682 rest of Middle East and Africa Flat Glass Market, By Type, 2019-2028 (Thousand Square Meter)
TABLE 683 South America flat glass Market, BY COUNtry, 2019-2028 (USD Thousand)
TABLE 684 South America flat glass Market, BY COUNtry, 2019-2028 (Thousand Units)
TABLE 685 South America Flat Glass Market, By Type, 2019-2028 (USD Thousand)
TABLE 686 South America Flat Glass Market, By Type, 2019-2028 (Thousand Square Meter)
TABLE 687 South America Flat Glass Market, By Function, 2019-2028 (USD Thousand)
TABLE 688 South America Flat Glass Market, BY Product, 2019-2028 (USD Thousand)
TABLE 689 South America Coated In Flat Glass Market, By Coating Resin, 2019-2028 (USD Thousand)
TABLE 690 South America Coating Technology In Flat Glass Market, BY Coating Technology, 2019-2028 (USD Thousand)
TABLE 691 South America Coated In Flat Glass Market, BY Coating Process, 2019-2028 (USD Thousand)
TABLE 692 South America Chemical Vapor Deposition (CVD) (Pyrolytic) in Flat Glass Market, By Process, 2019-2028 (USD Thousand)
TABLE 693 South America Flat Glass Market, BY Application, 2019-2028 (USD Thousand)
TABLE 694 South America Building and Construction In Flat Glass Market, By Application, 2019-2028 (USD Thousand)
TABLE 695 South America Building and Construction In Flat Glass Market, By Type, 2019-2028 (USD Thousand)
TABLE 696 South America Automotive In Flat Glass Market, By Application, 2019-2028 (USD Thousand)
TABLE 697 South America Automotive In Flat Glass Market, By Type, 2019-2028 (USD Thousand)
TABLE 698 South America Aerospace In Flat Glass Market, By Type, 2019-2028 (USD Thousand)
TABLE 699 South America Electronic Appliances In Flat Glass Market, By Type, 2019-2028 (USD Thousand)
TABLE 700 South America Solar Energy In Flat Glass Market, By Application 2019-2028 (USD Thousand)
TABLE 701 South America Solar Energy In Flat Glass Market, By Type, 2019-2028 (USD Thousand)
TABLE 702 South America Furniture In Flat Glass Market, By Type, 2019-2028 (USD Thousand)
TABLE 703 South America Others In Flat Glass Market, By Type, 2019-2028 (USD Thousand)
TABLE 704 BRAZIL Flat Glass Market, By Type, 2019-2028 (USD Thousand)
TABLE 705 BRAZIL Flat Glass Market, By Type, 2019-2028 (Thousand Square Meter)
TABLE 706 BRAZIL Flat Glass Market, By Function, 2019-2028 (USD Thousand)
TABLE 707 BRAZIL Flat Glass Market, BY Product, 2019-2028 (USD Thousand)
TABLE 708 BRAZIL Coated In Flat Glass Market, By Coating Resin, 2019-2028 (USD Thousand)
TABLE 709 BRAZIL Coating Technology In Flat Glass Market, BY Coating Technology, 2019-2028 (USD Thousand)
TABLE 710 BRAZIL Coated In Flat Glass Market, BY Coating Process, 2019-2028 (USD Thousand)
TABLE 711 BRAZIL Chemical Vapor Deposition (CVD) (Pyrolytic) in Flat Glass Market By Process, 2019-2028 (USD Thousand)
TABLE 712 BRAZIL Flat Glass Market, BY Application, 2019-2028 (USD Thousand)
TABLE 713 BRAZIL Building and Construction In Flat Glass Market, By Application, 2019-2028 (USD Thousand)
TABLE 714 BRAZIL Building and Construction In Flat Glass Market, By Type, 2019-2028 (USD Thousand)
TABLE 715 BRAZIL Automotive In Flat Glass Market, By Application, 2019-2028 (USD Thousand)
TABLE 716 BRAZIL Automotive In Flat Glass Market, By Type, 2019-2028 (USD Thousand)
TABLE 717 BRAZIL Aerospace In Flat Glass Market, By Type, 2019-2028 (USD Thousand)
TABLE 718 BRAZIL Electronic Appliances In Flat Glass Market, By Type, 2019-2028 (USD Thousand)
TABLE 719 BRAZIL Solar Energy In Flat Glass Market, By Application 2019-2028 (USD Thousand)
TABLE 720 BRAZIL Solar Energy In Flat Glass Market, By Type, 2019-2028 (USD Thousand)
TABLE 721 BRAZIL Furniture In Flat Glass Market, By Type, 2019-2028 (USD Thousand)
TABLE 722 BRAZIL Others In Flat Glass Market, By Type, 2019-2028 (USD Thousand)
TABLE 723 Argentina Flat Glass Market, By Type, 2019-2028 (USD Thousand)
TABLE 724 Argentina Flat Glass Market, By Type, 2019-2028 (Thousand Square Meter)
TABLE 725 Argentina Flat Glass Market, By Function, 2019-2028 (USD Thousand)
TABLE 726 Argentina Flat Glass Market, BY Product, 2019-2028 (USD Thousand)
TABLE 727 Argentina Coated In Flat Glass Market, By Coating Resin, 2019-2028 (USD Thousand)
TABLE 728 Argentina Coating Technology In Flat Glass Market, BY Coating Technology, 2019-2028 (USD Thousand)
TABLE 729 Argentina Coated In Flat Glass Market, BY Coating Process, 2019-2028 (USD Thousand)
TABLE 730 Argentina Chemical Vapor Deposition (CVD) (Pyrolytic) in Flat Glass Market By Process, 2019-2028 (USD Thousand)
TABLE 731 Argentina Flat Glass Market, BY Application, 2019-2028 (USD Thousand)
TABLE 732 Argentina Building and Construction In Flat Glass Market, By Application, 2019-2028 (USD Thousand)
TABLE 733 Argentina Building and Construction In Flat Glass Market, By Type, 2019-2028 (USD Thousand)
TABLE 734 Argentina Automotive In Flat Glass Market, By Application, 2019-2028 (USD Thousand)
TABLE 735 Argentina Automotive In Flat Glass Market, By Type, 2019-2028 (USD Thousand)
TABLE 736 Argentina Aerospace In Flat Glass Market, By Type, 2019-2028 (USD Thousand)
TABLE 737 Argentina Electronic Appliances In Flat Glass Market, By Type, 2019-2028 (USD Thousand)
TABLE 738 Argentina Solar Energy In Flat Glass Market, By Application 2019-2028 (USD Thousand)
TABLE 739 Argentina Solar Energy In Flat Glass Market, By Type, 2019-2028 (USD Thousand)
TABLE 740 Argentina Furniture In Flat Glass Market, By Type, 2019-2028 (USD Thousand)
TABLE 741 Argentina Others In Flat Glass Market, By Type, 2019-2028 (USD Thousand)
TABLE 742 Rest of South America Flat Glass Market, By Type, 2019-2028 (USD Thousand)
TABLE 743 Rest of South America Flat Glass Market, By Type, 2019-2028 (Thousand Square Meter)
図表一覧
FIGURE 1 GLOBAL FLAT GLASS MARKET: segmentation
FIGURE 2 GLOBAL FLAT GLASS MARKET: data triangulation
FIGURE 3 GLOBAL FLAT GLASS MARKET: DROC ANALYSIS
FIGURE 4 GLOBAL FLAT GLASS MARKET: global VS regional MARKET analysis
FIGURE 5 GLOBAL FLAT GLASS MARKET: company research analysis
FIGURE 6 GLOBAL FLAT GLASS MARKET: THE FUNCTION LIFE LINE CURVE
FIGURE 7 GLOBAL FLAT GLASS MARKET: MULTIVARIATE MODELLING
FIGURE 8 GLOBAL FLAT GLASS MARKET: INTERVIEW DEMOGRAPHICS
FIGURE 9 GLOBAL FLAT GLASS MARKET: DBMR MARKET POSITION GRID
FIGURE 10 GLOBAL FLAT GLASS MARKET: MARKET APPLICATION COVERAGE GRID
FIGURE 11 GLOBAL FLAT GLASS MARKET: THE MARKET CHALLENGE MATRIX
FIGURE 12 GLOBAL Flat glass Market: vendor share analysis
FIGURE 13 GLOBAL FLAT GLASS MARKET: SEGMENTATION
FIGURE 14 Asia-PAcific is expected to DOMINATE THE global flat glass market and IS EXPECTED TO GROW WITH THE HIGHEST CAGR IN the forecast period of 2021 to 2028
FIGURE 15 Increase in use of flat glass in the production and installation of solar panels IS DRIVING THE GLOBAL flat glass market in the forecast period of 2021 to 2028
FIGURE 16 FLOAT glass SEGMENT is expected to account for the largest share of the GLOBAL FLAT GLASS MARKET in 2021 & 2028
FIGURE 17 Asia-Pacific is the fastest-growing market for FLAT GLASS manufacturers in the forecast period of 2021 to 2028
FIGURE 18 DRIVERS, RESTRAINTS, OPPORTUNITIES AND CHALLENGES OF GLOBAL FLAT GLASS MARKET
FIGURE 19 TOTAL SALES OF CAR FROM 2015-2020 (USD MILLION)
FIGURE 20 ELECTRIC CAR DEPLOYMENT ALL AROUND THE WORLD (2015-2018) (USD MILLION)
FIGURE 21 INCREASING NUMBER OF CAR ACCIDENTS IN PHILIPPINES (2007-2018)
FIGURE 22 AVERAGE PRICE PER UNIT OF GLASS RAW MATERIALS (USD)
FIGURE 23 Global FLAT GLASS market: BY type, 2020
FIGURE 24 Global FLAT GLASS market: BY function, 2020
FIGURE 25 Global FLAT GLASS market: BY product, 2020
FIGURE 26 Global FLAT GLASS market: BY application, 2020
FIGURE 27 GLOBAL Flat glass Market: SNAPSHOT (2020)
FIGURE 28 GLOBAL Flat glass Market: by region (2020)
FIGURE 29 GLOBAL Flat glass Market: by region (2021 & 2028)
FIGURE 30 GLOBAL Flat glass Market: by region (2020 & 2028)
FIGURE 31 GLOBAL Flat glass Market: by TYPE (2021& 2028)
FIGURE 32 NORTH AMERICA flat glass market: SNAPSHOT (2020)
FIGURE 33 NORTH AMERICA flat glass market: by COUNTRY (2020)
FIGURE 34 NORTH AMERICA flat glass market: by COUNTRY (2021 & 2028)
FIGURE 35 NORTH AMERICA flat glass market: by COUNTRY (2020 & 2028)
FIGURE 36 NORTH AMERICA flat glass market: by TYPE (2021-2028)
FIGURE 37 EUROPE Flat glass market: SNAPSHOT (2020)
FIGURE 38 EUROPE Flat glass market: by COUNTRY (2020)
FIGURE 39 EUROPE Flat glass market: by COUNTRY (2021 & 2028)
FIGURE 40 EUROPE Flat glass market: by COUNTRY (2020 & 2028)
FIGURE 41 EUROPE Flat glass market: by TYPE (2021-2028)
FIGURE 42 ASIA-PACIFIC Flat glass market: SNAPSHOT (2020)
FIGURE 43 ASIA-PACIFIC Flat glass market: by COUNTRY (2020)
FIGURE 44 ASIA-PACIFIC Flat glass market: by COUNTRY (2021 & 2028)
FIGURE 45 ASIA-PACIFIC Flat glass market: by COUNTRY (2020 & 2028)
FIGURE 46 ASIA-PACIFIC Flat glass market: by TYPE (2021-2028)
FIGURE 47 MIDDLE EAST AND AFRICA Flat glass market: SNAPSHOT (2020)
FIGURE 48 MIDDLE EAST AND AFRICA Flat glass market: by COUNTRY (2020)
FIGURE 49 MIDDLE EAST AND AFRICA Flat glass market: by COUNTRY (2021 & 2028)
FIGURE 50 MIDDLE EAST AND AFRICA Flat glass market: by COUNTRY (2020 & 2028)
FIGURE 51 MIDDLE EAST AND AFRICA Flat glass market: by TYPE (2021-2028)
FIGURE 52 SOUTH AMERICA flat glass market: SNAPSHOT (2020)
FIGURE 53 SOUTH AMERICA flat glass market: by COUNTRY (2020)
FIGURE 54 SOUTH AMERICA flat glass market: by COUNTRY (2021 & 2028)
FIGURE 55 SOUTH AMERICA flat glass market: by COUNTRY (2020 & 2028)
FIGURE 56 SOUTH AMERICA flat glass market: by TYPE (2021-2028)
FIGURE 57 GLOBAL FLAT GLASS MARKET: company share 2020 (%)
FIGURE 58 north AMERICA FLAT GLASS MARKET: COMPANY SHARE 2020 (%)
FIGURE 59 EUROPE FLAT GLASS MARKET: company share 2020 (%)
FIGURE 60 Asia-Pacific FLAT GLASS MARKET: COMPANY SHARE 2020 (%)
調査方法
データ収集と基準年分析は、大規模なサンプル サイズのデータ収集モジュールを使用して行われます。この段階では、さまざまなソースと戦略を通じて市場情報または関連データを取得します。過去に取得したすべてのデータを事前に調査および計画することも含まれます。また、さまざまな情報ソース間で見られる情報の不一致の調査も含まれます。市場データは、市場統計モデルと一貫性モデルを使用して分析および推定されます。また、市場シェア分析と主要トレンド分析は、市場レポートの主要な成功要因です。詳細については、アナリストへの電話をリクエストするか、お問い合わせをドロップダウンしてください。
DBMR 調査チームが使用する主要な調査方法は、データ マイニング、データ変数が市場に与える影響の分析、および一次 (業界の専門家) 検証を含むデータ三角測量です。データ モデルには、ベンダー ポジショニング グリッド、市場タイムライン分析、市場概要とガイド、企業ポジショニング グリッド、特許分析、価格分析、企業市場シェア分析、測定基準、グローバルと地域、ベンダー シェア分析が含まれます。調査方法について詳しくは、お問い合わせフォームから当社の業界専門家にご相談ください。
カスタマイズ可能
Data Bridge Market Research は、高度な形成的調査のリーダーです。当社は、既存および新規のお客様に、お客様の目標に合致し、それに適したデータと分析を提供することに誇りを持っています。レポートは、対象ブランドの価格動向分析、追加国の市場理解 (国のリストをお問い合わせください)、臨床試験結果データ、文献レビュー、リファービッシュ市場および製品ベース分析を含めるようにカスタマイズできます。対象競合他社の市場分析は、技術ベースの分析から市場ポートフォリオ戦略まで分析できます。必要な競合他社のデータを、必要な形式とデータ スタイルでいくつでも追加できます。当社のアナリスト チームは、粗い生の Excel ファイル ピボット テーブル (ファクト ブック) でデータを提供したり、レポートで利用可能なデータ セットからプレゼンテーションを作成するお手伝いをしたりすることもできます。

