
世界の電子部品市場
Market Size in USD Billion
CAGR :
% 
 USD
484,625.45 Million
USD
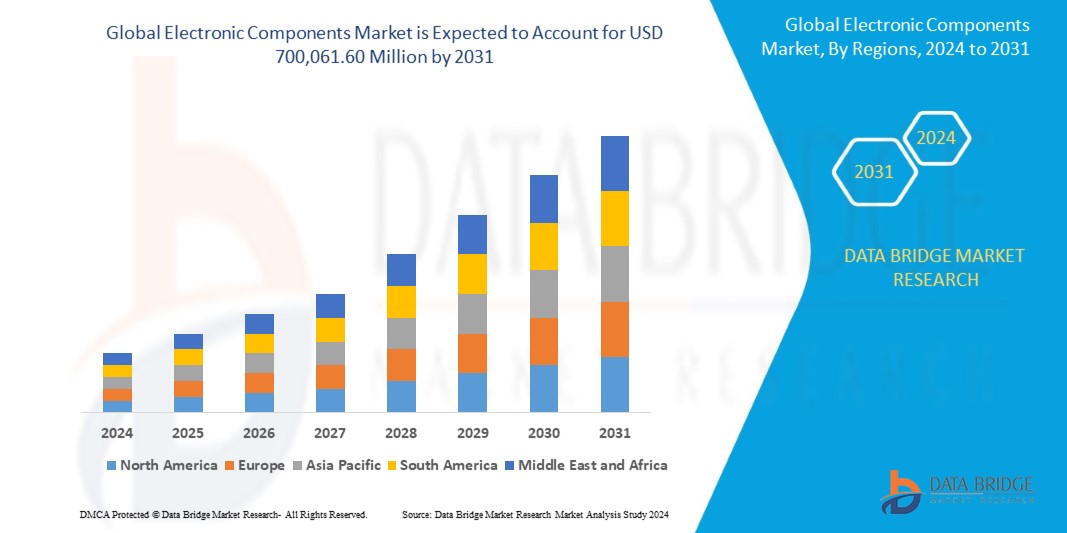
700,061.60 Million
2023
2031
USD
484,625.45 Million
USD
700,061.60 Million
2023
2031
| 2024 –2031 | |
| USD 484,625.45 Million | |
| USD 700,061.60 Million | |
| % | |
|
世界の電子部品市場、部品タイプ別(プロセッサ、モーター、バッテリー、マイクロコントローラ、集積回路、回路ブレーカー、変圧器、コンデンサ、ダイオード、抵抗器、インダクタ、リレー、スイッチ、ヒューズ)、商品タイプ別(ブラウン家電、白物家電、小型白物家電)、製品タイプ別(アクティブ、パッシブ、電気機械部品)、最終用途タイプ別(民生用電子機器、ネットワークおよび通信、自動車、製造、航空宇宙および防衛、ヘルスケア) - 2031年までの業界動向および予測。
電子部品市場の分析と規模
電子部品は、電子機器やシステムの基本的な構成要素です。これらの部品には、抵抗器、コンデンサ、ダイオード、トランジスタ、集積回路、その他のさまざまな電気部品が含まれます。これらは、電流の調整、電荷の蓄積、信号の増幅、データの処理などの特定の機能を実行します。電子部品は、スマートフォンやコンピューターから産業機械や自動車システムまで、すべての電子機器の機能に不可欠です。電子部品は、複雑な回路や電子製品の作成を可能にする、エレクトロニクス分野の重要な要素です。電子部品は、電子システムに関連するあらゆる分野で幅広い用途があります。電子システムの重要な部分であるため、この市場は将来的に高い速度で成長する大きな可能性を秘めています。
Data Bridge Market Researchは、世界の電子部品市場は2023年に484,625.45百万米ドルと評価され、2031年までに700,061.60百万米ドルに達し、2023年から2030年の予測期間中に8.5%のCAGRを記録すると分析しています。製品タイプのアクティブコンポーネントセグメントは、ほとんどの電子機器でマイクロプロセッサ、マイクロコントローラ、 ICなどのアクティブ半導体コンポーネントの使用が増えているため、最高の成長率で成長すると予想されています。市場価値、成長率、セグメンテーション、地理的範囲、主要プレーヤーなどの市場シナリオに関する洞察に加えて、Data Bridge Market Researchがまとめた市場レポートには、詳細な専門家分析、地理的に表された企業別の生産と生産能力、販売代理店とパートナーのネットワークレイアウト、詳細で最新の価格動向分析、サプライチェーンと需要の不足分析も含まれています。
電子部品市場の範囲とセグメンテーション
|
レポートメトリック |
詳細 |
|
予測期間 |
2024年から2031年 |
|
基準年 |
2023 |
|
歴史的な年 |
2022 (2016~2021年にカスタマイズ可能) |
|
定量単位 |
売上高(百万米ドル)、販売数量(個数)、価格(米ドル) |
|
対象セグメント |
コンポーネント タイプ (プロセッサ、モーター、バッテリー、マイクロコントローラ、集積回路、回路ブレーカー、トランス、コンデンサ、ダイオード、抵抗器、インダクタ、リレー、スイッチ、ヒューズ)、商品タイプ (ブラウン家電、白物家電、小型白物家電)、製品タイプ (アクティブ、パッシブ、電気機械コンポーネント)、最終用途タイプ (民生用電子機器、ネットワークおよび通信、自動車、製造、航空宇宙および防衛、ヘルスケア) |
|
対象国 |
米国、カナダ、メキシコ、ドイツ、イタリア、英国、フランス、スペイン、オランダ、ベルギー、スイス、トルコ、ロシア、その他のヨーロッパ諸国、日本、中国、インド、韓国、オーストラリア、シンガポール、マレーシア、タイ、インドネシア、フィリピン、その他のアジア太平洋諸国、ブラジル、アルゼンチン、その他の南米諸国、南アフリカ、サウジアラビア、UAE、エジプト、イスラエル、その他の中東およびアフリカ諸国 |
|
対象となる市場プレーヤー |
Infineon Technologies AG(ドイツ)、NXP Semiconductors NV(オランダ)、Texas Instruments, Inc.(米国)、東芝(日本)、Intel Corporation(米国)、Maxim Integrated(米国)、Broadcom Inc.(米国)、Qualcomm Inc.(米国)、Analog Devices, Inc.(米国)、Advanced Micro Devices(米国)、Microchip Technology, Inc.(米国)、Monolithic Power Systems, Inc.(米国)、Samsung Semiconductor, Inc.(韓国)、SK Hynix Inc.(韓国)、Mediatek Inc.(台湾)、日立製作所(日本)、Schurter (S) Pte, Ltd.(スイス)、Rewell Industrial Co. Ltd.(台湾)、京セラエレクトロニクスデバイス(日本)、Watts Electronics Pvt. Ltd.(インド) |
|
市場機会 |
|
市場の定義
電子部品は、電子回路または電子システムの基本的な構成要素です。電子部品は、回路全体の電子の流れを制御します。相互に接続する 2 つ以上の端子で構成されています。これらの部品は、プリント基板などの電子基板で接続され、電子回路を形成します。電子部品には、アクティブ、パッシブ、電気機械の 3 つの主要な種類があります。アクティブ部品は、ゲインを持ち、電気信号を増幅または通電できる部品です。一方、パッシブ部品はゲインを持たず、電気信号を増幅または通電できず、減衰することしかできません。電気機械部品は、電気信号を機械信号に変換して、何らかの変化を引き起こします。
世界の電子部品市場の動向
ドライバー
- IoTデバイスの需要増加
ヘルスケア、自動車、スマートホームなど、さまざまな業界でモノのインターネット (IoT) 技術の採用が拡大しており、電子部品の需要が高まっています。IoT デバイスにはセンサー、マイクロコントローラ、接続コンポーネントが必要であり、電子部品市場が拡大しています。
- 自動車エレクトロニクスの進歩
自動車業界は、電気自動車(EV)、自動運転、高度なインフォテインメント システムの開発により変革を遂げています。これらのイノベーションは、パワー半導体やセンサーなどの電子部品に大きく依存しており、大きな市場牽引力となっています。
機会
- 5G技術の拡大
5G ネットワークの展開により、電子部品に新たな機会が生まれています。5G テクノロジーには、RF 部品、アンテナ、高周波半導体などの堅牢なインフラストラクチャが必要です。5G の導入が進むにつれて、これらの部品の市場は拡大すると予想されます。
- 環境に優しく持続可能なエレクトロニクス
持続可能性と環境に優しい製品の重要性が高まっています。電子部品メーカーには、グリーンエレクトロニクスの需要の高まりに応えるために、エネルギー効率の高い半導体やリサイクル可能な材料などの環境に優しい部品を開発する機会があります。
制約/課題
- サプライチェーンの混乱
電子部品市場は、重要な材料の不足、地政学的緊張、自然災害などのサプライ チェーンの混乱の影響を受けやすく、これらの混乱により生産が遅れ、メーカーのコストが増加する可能性があります。
- 知的財産に関する懸念
知的財産 (IP) の盗難や電子部品の偽造は、継続的な課題です。貴重な IP を保護し、部品の真正性を確保することは、顧客の信頼を維持し、さまざまなアプリケーションにおける潜在的なセキュリティ リスクを防ぐために不可欠です。
最近の開発
- 2020年3月、インフィニオンテクノロジーズAGは、3D認証の高品質な標準ソリューションを実現するために、クアルコムと新たな提携を発表しました。これにより、インフィニオンはモバイルデバイス向けの3Dセンサー技術のアプリケーションポートフォリオを拡大しています。リファレンスデザインは、REAL3 3Dタイムオブフライト(ToF)センサーを使用し、スマートフォンメーカー向けに標準化され、コスト効率が高く、設計が容易な統合を可能にします。
- 2020年10月、フォルクスワーゲンはMEB電気自動車プラットフォームにNXPのバッテリー管理ソリューションを採用しました。フォルクスワーゲンとのコラボレーションは、電気自動車(EV)の電子機器を中心に行われました。フォルクスワーゲンは、車両の航続距離の延長、バッテリー寿命の延長、安全性の向上を支援するために、革新的なMEBプラットフォームにNXPのバッテリー管理システム(BMS)を採用しました。
世界の電子部品市場の範囲
電子部品市場は、部品タイプ、商品タイプ、製品タイプ、最終用途タイプに基づいてセグメント化されています。これらのセグメントの成長は、業界のわずかな成長セグメントを分析するのに役立ち、ユーザーに貴重な市場概要と市場洞察を提供し、コア市場アプリケーションを特定するための戦略的決定を下すのに役立ちます。
コンポーネントタイプ
- プロセッサ
- モーター
- バッテリー
- マイクロコントローラ
- 集積回路
- サーキットブレーカー
- トランス
- コンデンサ
- ダイオード
- 抵抗器
- インダクタ
- リレー
- スイッチ
- ヒューズ
商品タイプ
- ブラウングッズ
- 白物家電
- 小型白物家電
製品タイプ
- アクティブ
- 受け身
- 電気機械部品
最終用途タイプ
- 家電
- ネットワークと通信
- 自動車
- 製造業
- 航空宇宙および防衛
- 健康管理
世界の電子部品市場の国別分析/洞察
電子部品市場が分析され、市場規模の情報は、上記のように国、部品タイプ、商品タイプ、製品タイプ、最終用途タイプ別に提供されます。
市場レポートで取り上げられている国は、米国、カナダ、メキシコ、ドイツ、フランス、英国、イタリア、スペイン、スイス、オランダ、ロシア、トルコ、ベルギー、その他のヨーロッパ諸国、日本、中国、韓国、インド、オーストラリア、シンガポール、タイ、マレーシア、インドネシア、フィリピン、その他のアジア太平洋諸国、南アフリカ、イスラエル、UAE、サウジアラビア、エジプト、その他の中東およびアフリカ諸国、ブラジル、アルゼンチン、コロンビア、ペルー、チリ、ベネズエラ、エクアドル、その他の南米諸国です。
アジア太平洋地域は、その強力な製造エコシステム、技術的専門知識、および革新、効率性、および費用対効果を促進する主要な業界プレーヤーの存在により、予測期間中に優位になると予想されています。ヨーロッパは、技術革新、強力な製造能力、およびさまざまな業界にわたる高度な電子デバイスに対する需要の増加に重点を置いていることに起因する電子部品市場の急速な成長により、市場で最も急速に成長する地域になると予想されています。
レポートの国別セクションでは、市場の現在および将来の傾向に影響を与える国内市場における個別の市場影響要因と規制の変更も提供しています。新規販売、交換販売、国の人口統計、規制行為、輸出入関税などのデータ ポイントは、各国の市場シナリオを予測するために使用される主要な指標の一部です。また、国別データの予測分析を提供する際には、グローバル ブランドの存在と可用性、および地元および国内ブランドとの競争が激しいか少ないために直面する課題、販売チャネルの影響も考慮されます。
世界の電子部品市場の競争環境と市場シェア分析
電子部品市場の競争環境は、競合他社ごとに詳細を提供します。詳細には、会社概要、会社の財務状況、収益、市場の可能性、研究開発への投資、新しい市場への取り組み、生産拠点と施設、会社の強みと弱み、製品の発売、製品試験パイプライン、製品の承認、特許、製品の幅と広さ、アプリケーションの優位性、技術ライフライン曲線が含まれます。上記のデータ ポイントは、電子部品市場に関連する会社の焦点にのみ関連しています。
電子部品市場で活動している主要企業は次のとおりです。
- インフィニオンテクノロジーズAG(ドイツ)
- NXPセミコンダクターズNV(オランダ)
- テキサス・インスツルメンツ社(米国)
- 東芝(日本)
- インテルコーポレーション(米国)
- マキシム・インテグレーテッド(米国)
- ブロードコム社(米国)
- クアルコム社(米国)
- アナログ・デバイセズ社(米国)
- アドバンスト・マイクロ・デバイセズ(米国)
- マイクロチップテクノロジー社(米国)
- モノリシック・パワー・システムズ社(米国)
- サムスンセミコンダクター株式会社(韓国)
- SKハイニックス株式会社(韓国)
- メディアテック株式会社(台湾)
- 日立製作所(日本)
- Schurter (S) Pte, Ltd.(スイス)
- リウェル工業株式会社(台湾)
- 京セラエレクトロニクスデバイス(日本)
- Watts Electronics Pvt. Ltd. (インド)
SKU-
世界初のマーケットインテリジェンスクラウドに関するレポートにオンラインでアクセスする

- インタラクティブなデータ分析ダッシュボード
- 成長の可能性が高い機会のための企業分析ダッシュボード
- カスタマイズとクエリのためのリサーチアナリストアクセス
- インタラクティブなダッシュボードによる競合分析
- 最新ニュース、更新情報、トレンド分析
- 包括的な競合追跡のためのベンチマーク分析のパワーを活用
目次
- INTRODUCTION
- OBJECTIVES OF THE STUDY
- MARKET DEFINITION
- OVERVIEW OF GLOBAL ELECTRONIC COMPONENTS MARKET
- CURRENCY AND PRICING
- LIMITATIONS
- MARKETS COVERED
- MARKET SEGMENTATION
- MARKETS COVERED
- GEOGRAPHICAL SCOPE
- YEARS CONSIDERED FOR THE STUDY
- DBMR TRIPOD DATA VALIDATION MODEL
- PRIMARY INTERVIEWS WITH KEY OPINION LEADERS
- DBMR MARKET POSITION GRID
- VENDOR SHARE ANALYSIS
- MULTIVARIATE MODELING
- COMPONENT TYPE TIMELINE CURVE
- SECONDARY SOURCES
- ASSUMPTIONS
- EXECUTIVE SUMMARY
- PREMIUM INSIGHTS
- MARKET OVERVIEW
- DRIVERS
- INCREASE IN DEMAND FOR SMART ELECTRONIC DEVICES
- RISE IN PREFERENCE FOR MINIATURIZED DESIGN COMPONENT
- RISE IN ADOPTION OF ELECTRONIC COMPONENTS IN NUMEROUS INDUSTRIES
- RISE IN DEMAND FOR THE SOFT ELECTRONIC COMPONENTS
- RESTRAINTS
- RISE IN METAL PRICES HAMPERS THE OVERALL COMPONENT PRODUCTION COSTS
- CHANGE IN ECONOMIC AND POLITICAL OUTLOOK
- OPPORTUNITIES
- INCREASE IN USAGE OF IOT
- INCREASE IN VARIOUS STRATEGIC DECISIONS SUCH AS PARTNERSHIPS AND MERGERS
- RISE IN ADOPTION OF ELECTRONIC COMPONENTS IN APPLICATIONS SUCH AS SATELLITE AND SPACE TECHNOLOGY
- RISE IN AUTOMATION IN THE AUTOMOTIVE SECTOR
- ADVENT OF DIFFERENT CONNECTED TECHNOLOGIES WITH ENHANCED EFFICIENCY
- CHALLENGES
- RISE IN DEPENDENCY OF MANUFACTURER ON DIFFERENT SUPPLIERS
- SHORTAGE IN SUPPLY OF ELECTRONIC COMPONENTS
- IMPACT OF COVID-19 ON THE GLOBAL ELECTRONIC COMPONENTS MARKET
- ANALYSIS ON IMPACT OF COVID-19 ON THE MARKET
- AFTERMATH OF COVID-19 AND GOVERNMENT INITIATIVE TO BOOST THE MARKET
- STRATEGIC DECISIONS FOR MANUFACTURERS AFTER COVID-19 TO GAIN COMPETITIVE MARKET SHARE
- IMPACT ON DEMAND
- IMPACT ON SUPPLY CHAIN
- CONCLUSION
- GLOBAL ELECTRONIC COMPONENTS MARKET, BY COMPONENT TYPE
- OVERVIEW
- PROCESSORS
- MOTORS
- BATTERY
- MICROCONTROLLER
- INTEGRATED CIRCUIT (IC)
- CIRCUIT BREAKERS
- TRANSFORMERS
- CAPACITORS
- PAPER AND FILM
- CERAMIC
- ALUMINUM
- TANTALUM
- SUPERCAPACITOR
- OTHERS
- DIODES
- POWER DIODE
- ZENER DIODE
- SCHOTTKY DIODE
- RECTIFIER DIODE
- SMALL SIGNAL SWITCHING DIODE
- RF DIODE
- OTHERS
- RESISTORS
- INDUCTORS
- SWITCHES
- SINGLE POLE DOUBLE THROW (SPDT)
- SINGLE POLE SINGLE THROW (SPST)
- DOUBLE POLE DOUBLE THROW (DPDT)
- DOUBLE POLE SINGLE THROW (DPST)
- RELAYS
- FUSE
- OTHERS
- GLOBAL ELECTRONIC COMPONENTS MARKET, BY COMMODITIES TYPE
- OVERVIEW
- BROWN GOODS
- BY TYPE
- PERSONAL COMPUTERS
- TV
- DVD PLAYERS
- CD PLAYERS
- VCRS
- OTHERS
- ELECTRONIC COMPONENTS
- PROCESSORS
- MICROCONTROLLERS
- INTEGRATED CIRCUITS (IC)
- BATTERY
- MOTORS
- VACUUM TUBES
- OTHERS
- BY MATERIAL
- METAL
- GOLD
- PALLADIUM
- PLATINUM
- COPPER
- TIN
- SILVER
- NICKEL
- ALUMINUM
- COBALT
- ZINC
- TANTALUM
- NEODYMIUM
- PLASTIC
- BY TYPE
- THERMOSET
- THERMOPLASTIC
- WHITE GOODS
- BY TYPE
- REFRIGERATORS
- WASHING MACHINES
- AIR CONDITIONERS
- MICROWAVE OVENS
- DISHWASHERS
- CLOTHES DRYERS
- WATER HEATERS
- FREEZERS
- KITCHEN STOVES
- INDUCTION COOKERS
- DRYING CABINETS
- TRASH COMPACTORS
- BY ELECTRONIC COMPONENT
- MOTORS
- MICROCONTROLLERS
- INTEGRATED CIRCUITS (IC)
- PROCESSORS
- BATTERY
- VACUUM TUBES
- OTHERS
- BY MATERIAL
- METAL
- GOLD
- PALLADIUM
- PLATINUM
- COPPER
- ALUMINUM
- TIN
- SILVER
- NICKEL
- TANTALUM
- NEODYMIUM
- COBALT
- ZINC
- PLASTIC
- THERMOSET
- THERMOPLASTIC
- SMALL WHITE GOODS
- BY TYPE
- FOOD PROCESSORS
- TOASTERS
- HAIRDRYERS
- KETTLES
- OTHERS
- BY ELECTRONIC COMPONENTS
- MICROCONTROLLERS
- INTEGRATED CIRCUITS (IC)
- MOTORS
- PROCESSORS
- BATTERY
- VACUUM TUBES
- OTHERS
- BY MATERIAL
- METAL
- GOLD
- PALLADIUM
- PLATINUM
- COPPER
- TIN
- SILVER
- NICKEL
- ALUMINUM
- TANTALUM
- COBALT
- NEODYMIUM
- ZINC
- PLASTIC
- THERMOSET
- THERMOPLASTIC
- OTHERS
- GLOBAL ELECTRONIC COMPONENTS MARKET, BY PRODUCT TYPE
- OVERVIEW
- ACTIVE
- PASSIVE
- ELECTROMECHANICAL COMPONENTS
- OTHERS
- GLOBAL ELECTRONIC COMPONENTS MARKET, BY END USE TYPE
- OVERVIEW
- CONSUMER ELECTRONICS
- NETWORKING & TELECOMMUNICATION
- MANUFACTURING
- AUTOMOTIVE
- AEROSPACE & DEFENSE
- HEALTHCARE
- OTHERS
- GLOBAL ELECTRONIC COMPONENTS MARKET, BY REGION
- OVERVIEW
- NORTH AMERICA
- U.S.
- CANADA
- MEXICO
- EUROPE
- GERMANY
- FRANCE
- U.K.
- ITALY
- SPAIN
- NETHERLANDS
- SWITZERLAND
- RUSSIA
- TURKEY
- BELGIUM
- REST OF EUROPE
- SOUTH AMERICA
- BRAZIL
- ARGENTINA
- COLOMBIA
- PERU
- CHILE
- VENEZUELA
- ECUADOR
- REST OF SOUTH AMERICA
- ASIA-PACIFIC
- CHINA
- SOUTH KOREA
- JAPAN
- INDIA
- SINGAPORE
- AUSTRALIA
- MALAYSIA
- PHILIPPINES
- THAILAND
- INDONESIA
- REST OF ASIA-PACIFIC
- MIDDLE EAST & AFRICA
- ISRAEL
- U.A.E.
- SOUTH AFRICA
- SAUDI ARABIA
- EGYPT
- REST OF MIDDLE EAST & AFRICA
- GLOBAL ELECTRONIC COMPONENTS MARKET: COMPANY LANDSCAPE
- COMPANY SHARE ANALYSIS: GLOBAL
- COMPANY SHARE ANALYSIS: NORTH AMERICA
- COMPANY SHARE ANALYSIS: EUROPE
- COMPANY SHARE ANALYSIS: ASIA-PACIFIC
- SWOT ANALYSIS
- COMPANY PROFILE
- INTEL CORPORATION
- COMPANY SNAPSHOT
- REVENUE ANALYSIS
- COMPANY SHARE ANALYSIS
- PRODUCT PORTFOLIO
- RECENT DEVELOPMENTS
- QUALCOMM TECHNOLOGIES, INC.
- COMPANY SNAPSHOT
- REVENUE ANALYSIS
- COMPANY SHARE ANALYSIS
- PRODUCT PORTFOLIO
- RECENT DEVELOPMENTS
- BROADCOM
- COMPANY SNAPSHOT
- REVENUE ANALYSIS
- COMPANY SHARE ANALYSIS
- PRODUCT PORTFOLIO
- RECENT DEVELOPMENTS
- NXP SEMICONDUCTORS
- COMPANY SNAPSHOT
- REVENUE ANALYSIS
- COMPANY SHARE ANALYSIS
- PRODUCT PORTFOLIO
- RECENT DEVELOPMENTS
- ADVANCED MICRO DEVICES, INC.
- COMPANY SNAPSHOT
- REVENUE ANALYSIS
- PRODUCT PORTFOLIO
- RECENT DEVELOPMENTS
- ANALOG DEVICES INC.
- COMPANY SNAPSHOT
- REVENUE ANALYSIS
- PRODUCT PORTFOLIO
- RECENT DEVELOPMENTS
- HITACHI HIGH-TECH CORPORATION
- COMPANY SNAPSHOT
- REVENUE ANALYSIS
- PRODUCT PORTFOLIO
- RECENT DEVELOPMENTS
- INFINEON TECHNOLOGIES AG
- COMPANY SNAPSHOT
- REVENUE ANALYSIS
- PRODUCT PORTFOLIO
- RECENT DEVELOPMENTS
- KYOCERA CORPORATION
- COMPANY SNAPSHOT
- REVENUE ANALYSIS
- PRODUCT PORTFOLIO
- RECENT DEVELOPMENTS
- MAXIM INTEGRATED
- COMPANY SNAPSHOT
- REVENUE ANALYSIS
- PRODUCT PORTFOLIO
- RECENT DEVELOPMENTS
- MEDIATEK INC.
- COMPANY SNAPSHOT
- REVENUE ANALYSIS
- PRODUCT PORTFOLIO
- RECENT DEVELOPMENTS
- MICROCHIP TECHNOLOGY INC.
- COMPANY SNAPSHOT
- REVENUE ANALYSIS
- PRODUCT PORTFOLIO
- RECENT DEVELOPMENTS
- MONOLITHIC POWER SYSTEMS, INC.
- COMPANY SNAPSHOT
- REVENUE ANALYSIS
- PRODUCT PORTFOLIO
- RECENT DEVELOPMENTS
- REWELL INDUSTRIAL CO., LTD
- COMPANY SNAPSHOT
- PRODUCT PORTFOLIO
- RECENT DEVELOPMENTS
- SAMSUNG ELECTRONICS CO., LTD.
- COMPANY SNAPSHOT
- REVENUE ANALYSIS
- PRODUCT PORTFOLIO
- RECENT DEVELOPMENTS
- SCHURTER
- COMPANY SNAPSHOT
- PRODUCT PORTFOLIO
- RECENT DEVELOPMENTS
- SK HYNIX INC.
- COMPANY SNAPSHOT
- REVENUE ANALYSIS
- PRODUCT PORTFOLIO
- RECENT DEVELOPMENTS
- TEXAS INSTRUMENTS INCORPORATED
- COMPANY SNAPSHOT
- REVENUE ANALYSIS
- PRODUCT PORTFOLIO
- RECENT DEVELOPMENTS
- TOSHIBA CORPORATION
- COMPANY SNAPSHOT
- REVENUE ANALYSIS
- PRODUCT PORTFOLIO
- RECENT DEVELOPMENTS
- WATTS
- COMPANY SNAPSHOT
- PRODUCT PORTFOLIO
- RECENT DEVELOPMENT
- QUESTIONNAIRE
- RELATED REPORTS
表のリスト
TABLE 1 Global Electronic Components Market, BY Component TYPE, 2019-2028 (USD Million)
TABLE 2 Global Processors in Electronic Components Market, By Region, 2019-2028 (USD Million)
TABLE 3 Global motors in Electronic Components Market, By Region, 2019-2028 (USD Million)
TABLE 4 Global Battery in Electronic Components Market, By Region, 2019-2028 (USD Million)
TABLE 5 Global microcontroller in Electronic Components Market, By Region, 2019-2028 (USD MILLION)
TABLE 6 Global Integrated Circuit (IC) in Electronic Components Market, By Region, 2019-2028 (USD MILLION)
TABLE 7 Global Circuit breakers in Electronic Components Market, By Region, 2019-2028 (USD MILLION)
TABLE 8 Global transformers in Electronic Components Market, By Region, 2019-2028 (USD MILLION)
TABLE 9 Global capacitors in Electronic Components Market, By Region, 2019-2028 (USD MILLION)
TABLE 10 Global Capacitors in Electronic Components Market, By Type, 2019-2028 (USD Million)
TABLE 11 Global Diodes in Electronic Components Market, By Region, 2019-2028 (USD MILLION)
TABLE 12 Global diodes in Electronic Components Market, By Type, 2019-2028 (USD Million)
TABLE 13 Global Power diode in Electronic Components Market, By Type, 2019-2028 (USD Million)
TABLE 14 Global resistors in Electronic Components Market, By Region, 2019-2028 (USD Million)
TABLE 15 Global Inductors in Electronic Components Market, By Region, 2019-2028 (USD MILLION)
TABLE 16 Global Switches in Electronic Components Market, By Region, 2019-2028 (USD MILLION)
TABLE 17 Global diodes in Electronic Components Market, By Type, 2019-2028 (USD Million)
TABLE 18 Global Relays in Electronic Components Market, By Region, 2019-2028 (USD MILLION)
TABLE 19 Global Fuse in Electronic Components Market, By Region, 2019-2028 (USD MILLION)
TABLE 20 Global Others in Electronic Components Market, By Region, 2019-2028 (USD MILLION)
TABLE 21 Global Electronic Components Market, BY Commodities type, 2019-2028 (USD million)
TABLE 22 Global brown goods in Electronic Components Market, By Region, 2019-2028, (USD MILLION)
TABLE 23 Global Brown Goods in Electronic Components Market, By Type, 2019-2028 (USD MILLION)
TABLE 24 Global Brown Goods in Electronic Components Market, By Electronic Components, 2019-2028 (USD MILLION)
TABLE 25 Global Brown Goods in Electronic Components Market, By material, 2019-2028 (USD MILLION)
TABLE 26 Global Metal in Electronic Components Market, By type, 2019-2028 (USD MILLION)
TABLE 27 Global plastic in Electronic Components Market, By type, 2019-2028 (USD MILLION)
TABLE 28 Global white goods in Electronic Components Market, By Region, 2019-2028, (USD MILLION)
TABLE 29 Global white Goods in Electronic Components Market, By type, 2019-2028 (USD MILLION)
TABLE 30 Global white Goods in Electronic Components Market, By Electronic Components, 2019-2028 (USD MILLION)
TABLE 31 Global White Goods in Electronic Components Market, By Material, 2019-2028 (USD MILLION)
TABLE 32 Global Metal in Electronic Components Market, By type, 2019-2028 (USD MILLION)
TABLE 33 Global plastic in Electronic Components Market, By type, 2019-2028 (USD MILLION)
TABLE 34 Global Small White Goods in Electronic Components Market, By Region, 2019-2028, (USD MILLION)
TABLE 35 Global Small white Goods in Electronic Components Market, By type, 2019-2028 (USD MILLION)
TABLE 36 Global small white Goods in Electronic Components Market, By Electronic Components, 2019-2028 (USD MILLION)
TABLE 37 Global small White Goods in Electronic Components Market, By Material, 2019-2028 (USD MILLION)
TABLE 38 Global METAL in Electronic Components Market, By type, 2019-2028 (USD MILLION)
TABLE 39 Global plastic in Electronic Components Market, By type, 2019-2028 (USD MILLION)
TABLE 40 Global others in Electronic Components Market, By Region, 2019-2028 (USD MILLION)
TABLE 41 Global Electronic Components Market, BY product type, 2019-2028 (USD Million)
TABLE 42 Global Active in Electronic Components Market, By Region, 2019-2028 (USD MILLION)
TABLE 43 Global passive in Electronic Components Market, By Region, 2019-2028 (USD Million)
TABLE 44 Global Electromechanical Components in Electronic Components Market, By Region, 2019-2028 (USD Million)
TABLE 45 Global Others in Electronic Components Market, By Region, 2019-2028 (USD Million)
TABLE 46 Global Electronic Components Market, BY End Use type, 2019-2028 (USD Million)
TABLE 47 Global Consumer Electronics in Electronic Components Market, By Region, 2019-2028 (USD MILLION)
TABLE 48 Global NETWORKING & TELECOMMUNICATION in Electronic Components Market, By Region, 2019-2028 (USD MILLION)
TABLE 49 Global manufacturing in Electronic Components Market, By Region, 2019-2028 (USD MILLION)
TABLE 50 Global automotive in Electronic Components Market, By Region, 2019-2028 (USD MILLION)
TABLE 51 Global aerospace & DEFENSE in Electronic Components Market, By Region, 2019-2028 (USD MILLION)
TABLE 52 Global healthcare in Electronic Components Market, By Region, 2019-2028 (USD MILLION)
TABLE 53 Global others in Electronic Components Market, By Region, 2019-2028 (USD MILLION)
TABLE 54 GLOBAL electronic components market, By REGION, 2019-2028 (USD million)
TABLE 55 NORTH AMERICA electronic components market, By Country, 2019-2028 (USD million)
TABLE 56 NORTH AMERICA electronic components market, By Component Type, 2019-2028 (USD million)
TABLE 57 North America Capacitors in electronic components market, By Type, 2019-2028 (USD million)
TABLE 58 North America Diodes in electronic components market, By Type, 2019-2028 (USD million)
TABLE 59 North America Power Diode in electronic components market, By Type, 2019-2028 (USD million)
TABLE 60 North America Switches in electronic components market, By Type, 2019-2028 (USD million)
TABLE 61 North America Electronic Components market, By Commodities Type, 2019-2028 (USD million)
TABLE 62 North America Brown Goods in electronic components market, By Type, 2019-2028 (USD million)
TABLE 63 North America Brown Goods in electronic components market, By Electronic Components, 2019-2028 (USD million)
TABLE 64 North America Brown Goods in Electronic Components market, By Material, 2019-2028 (USD million)
TABLE 65 North America Metal in electronic components market, By Type, 2019-2028 (USD million)
TABLE 66 North America Plastic in electronic components market, By Type, 2019-2028 (USD million)
TABLE 67 North America White Goods in electronic components market, By Type, 2019-2028 (USD million)
TABLE 68 North America White Goods in electronic components market, By Electronic Components, 2019-2028 (USD million)
TABLE 69 North America White Goods in Electronic Components market, By Material, 2019-2028 (USD million)
TABLE 70 North America Metal in electronic components market, By Type, 2019-2028 (USD million)
TABLE 71 North America Plastic in electronic components market, By Type, 2019-2028 (USD million)
TABLE 72 North America Small White Goods in electronic components market, By Type, 2019-2028 (USD million)
TABLE 73 North America Small White Goods in electronic components market, By Electronic Components, 2019-2028 (USD million)
TABLE 74 North America Small White Goods in Electronic Components market, By Material, 2019-2028 (USD million)
TABLE 75 North America Metal in electronic components market, By Type, 2019-2028 (USD million)
TABLE 76 North America Plastic in electronic components market, By Type, 2019-2028 (USD million)
TABLE 77 North America electronic components market, By Product Type, 2019-2028 (USD million)
TABLE 78 NORTH AMERICA electronic components market, By End Use Type, 2019-2028 (USD million)
TABLE 79 U.S. electronic components market, By Component Type, 2019-2028 (USD million)
TABLE 80 U.S. Capacitors in electronic components market, By Type, 2019-2028 (USD million)
TABLE 81 U.S. Diodes in electronic components market, By Type, 2019-2028 (USD million)
TABLE 82 U.S. Power Diode in electronic components market, By Type, 2019-2028 (USD million)
TABLE 83 U.S. Switches in electronic components market, By Type, 2019-2028 (USD million)
TABLE 84 U.S. Electronic Components market, By Commodities Type, 2019-2028 (USD million)
TABLE 85 U.S. Brown Goods in electronic components market, By Type, 2019-2028 (USD million)
TABLE 86 U.S. Brown Goods in electronic components market, By Electronic Components, 2019-2028 (USD million)
TABLE 87 U.S. Brown Goods in Electronic Components market, By Material, 2019-2028 (USD million)
TABLE 88 U.S. Metal in electronic components market, By Type, 2019-2028 (USD million)
TABLE 89 U.S. Plastic in electronic components market, By Type, 2019-2028 (USD million)
TABLE 90 U.S. White Goods in electronic components market, By Type, 2019-2028 (USD million)
TABLE 91 U.S. White Goods in electronic components market, By Electronic Components, 2019-2028 (USD million)
TABLE 92 U.S. White Goods in Electronic Components market, By Material, 2019-2028 (USD million)
TABLE 93 U.S. Metal in electronic components market, By Type, 2019-2028 (USD million)
TABLE 94 U.S. Plastic in electronic components market, By Type, 2019-2028 (USD million)
TABLE 95 U.S. Small White Goods in electronic components market, By Type, 2019-2028 (USD million)
TABLE 96 U.S. Small White Goods in electronic components market, By Electronic Components, 2019-2028 (USD million)
TABLE 97 U.S. Small White Goods in Electronic Components market, By Material, 2019-2028 (USD million)
TABLE 98 U.S. Metal in electronic components market, By Type, 2019-2028 (USD million)
TABLE 99 U.S. Plastic in electronic components market, By Type, 2019-2028 (USD million)
TABLE 100 U.S. electronic components market, By Product Type, 2019-2028 (USD million)
TABLE 101 U.S. electronic components market, By End Use Type, 2019-2028 (USD million)
TABLE 102 CANADA electronic components market, By Component Type, 2019-2028 (USD million)
TABLE 103 CANADA Capacitors in electronic components market, By Type, 2019-2028 (USD million)
TABLE 104 CANADA Diodes in electronic components market, By Type, 2019-2028 (USD million)
TABLE 105 CANADA Power Diode in electronic components market, By Type, 2019-2028 (USD million)
TABLE 106 CANADA Switches in electronic components market, By Type, 2019-2028 (USD million)
TABLE 107 CANADA Electronic Components market, By Commodities Type, 2019-2028 (USD million)
TABLE 108 CANADA Brown Goods in electronic components market, By Type, 2019-2028 (USD million)
TABLE 109 CANADA Brown Goods in electronic components market, By Electronic Components, 2019-2028 (USD million)
TABLE 110 CANADA Brown Goods in Electronic Components market, By Material, 2019-2028 (USD million)
TABLE 111 CANADA Metal in electronic components market, By Type, 2019-2028 (USD million)
TABLE 112 CANADA Plastic in electronic components market, By Type, 2019-2028 (USD million)
TABLE 113 CANADA White Goods in electronic components market, By Type, 2019-2028 (USD million)
TABLE 114 CANADA White Goods in electronic components market, By Electronic Components, 2019-2028 (USD million)
TABLE 115 CANADA White Goods in Electronic Components market, By Material, 2019-2028 (USD million)
TABLE 116 CANADA Metal in electronic components market, By Type, 2019-2028 (USD million)
TABLE 117 CANADA Plastic in electronic components market, By Type, 2019-2028 (USD million)
TABLE 118 CANADA Small White Goods in electronic components market, By Type, 2019-2028 (USD million)
TABLE 119 CANADA Small White Goods in electronic components market, By Electronic Components, 2019-2028 (USD million)
TABLE 120 CANADA Small White Goods in Electronic Components market, By Material, 2019-2028 (USD million)
TABLE 121 CANADA Metal in electronic components market, By Type, 2019-2028 (USD million)
TABLE 122 CANADA Plastic in electronic components market, By Type, 2019-2028 (USD million)
TABLE 123 CANADA electronic components market, By Product Type, 2019-2028 (USD million)
TABLE 124 CANADA electronic components market, By End Use Type, 2019-2028 (USD million)
TABLE 125 MEXICO electronic components market, By Component Type, 2019-2028 (USD million)
TABLE 126 MEXICO Capacitors in electronic components market, By Type, 2019-2028 (USD million)
TABLE 127 MEXICO Diodes in electronic components market, By Type, 2019-2028 (USD million)
TABLE 128 MEXICO Power Diode in electronic components market, By Type, 2019-2028 (USD million)
TABLE 129 MEXICO Switches in electronic components market, By Type, 2019-2028 (USD million)
TABLE 130 MEXICO Electronic Components market, By Commodities Type, 2019-2028 (USD million)
TABLE 131 MEXICO Brown Goods in electronic components market, By Type, 2019-2028 (USD million)
TABLE 132 MEXICO Brown Goods in electronic components market, By Electronic Components, 2019-2028 (USD million)
TABLE 133 MEXICO Brown Goods in Electronic Components market, By Material, 2019-2028 (USD million)
TABLE 134 MEXICO Metal in electronic components market, By Type, 2019-2028 (USD million)
TABLE 135 MEXICO Plastic in electronic components market, By Type, 2019-2028 (USD million)
TABLE 136 MEXICO White Goods in electronic components market, By Type, 2019-2028 (USD million)
TABLE 137 MEXICO White Goods in electronic components market, By Electronic Components, 2019-2028 (USD million)
TABLE 138 MEXICO White Goods in Electronic Components market, By Material, 2019-2028 (USD million)
TABLE 139 MEXICO Metal in electronic components market, By Type, 2019-2028 (USD million)
TABLE 140 MEXICO Plastic in electronic components market, By Type, 2019-2028 (USD million)
TABLE 141 MEXICO Small White Goods in electronic components market, By Type, 2019-2028 (USD million)
TABLE 142 MEXICO Small White Goods in electronic components market, By Electronic Components, 2019-2028 (USD million)
TABLE 143 MEXICO Small White Goods in Electronic Components market, By Material, 2019-2028 (USD million)
TABLE 144 MEXICO Metal in electronic components market, By Type, 2019-2028 (USD million)
TABLE 145 MEXICO Plastic in electronic components market, By Type, 2019-2028 (USD million)
TABLE 146 MEXICO electronic components market, By Product Type, 2019-2028 (USD million)
TABLE 147 MEXICO electronic components market, By End Use Type, 2019-2028 (USD million)
TABLE 148 Europe electronic component market, By Country, 2019-2028 (USD million)
TABLE 149 EUROPE electronic component market, By Component Type, 2019-2028 (USD million)
TABLE 150 Europe Capacitors in electronic component market, By Type, 2019-2028 (USD million)
TABLE 151 Europe Diode in electronic component market, By Type, 2019-2028 (USD million)
TABLE 152 Europe Power Diode in electronic component market, By Type, 2019-2028 (USD million)
TABLE 153 Europe Switches in electronic component market, By Type, 2019-2028 (USD million)
TABLE 154 Europe Electronic Component market, By Commodities Type, 2019-2028 (USD million)
TABLE 155 Europe Brown Goods in electronic component market, By Type, 2019-2028 (USD million)
TABLE 156 Europe Brown Goods in electronic component market, By Electronic Component, 2019-2028 (USD million)
TABLE 157 Europe Brown Goods in Electronic Component market, By Material, 2019-2028 (USD million)
TABLE 158 Europe Metal in electronic component market, By Type, 2019-2028 (USD million)
TABLE 159 Europe Plastic in electronic component market, By Type, 2019-2028 (USD million)
TABLE 160 Europe White Goods in electronic component market, By Type, 2019-2028 (USD million)
TABLE 161 Europe White Goods in electronic component market, By Electronic Component, 2019-2028 (USD million)
TABLE 162 Europe White Goods in Electronic Component market, By Material, 2019-2028 (USD million)
TABLE 163 Europe Metal in electronic component market, By Type, 2019-2028 (USD million)
TABLE 164 Europe Plastic in electronic component market, By Type, 2019-2028 (USD million)
TABLE 165 Europe Small White Goods in electronic component market, By Type, 2019-2028 (USD million)
TABLE 166 Europe Small White Goods in electronic component market, By Electronic Component, 2019-2028 (USD million)
TABLE 167 Europe Small White Goods in Electronic Component market, By Material, 2019-2028 (USD million)
TABLE 168 Europe Metal in electronic component market, By Type, 2019-2028 (USD million)
TABLE 169 Europe Plastic in electronic component market, By Type, 2019-2028 (USD million)
TABLE 170 Europe electronic component market, By Product Type, 2019-2028 (USD million)
TABLE 171 EUROPE electronic component market, By End Use Type, 2019-2028 (USD million)
TABLE 172 GERMANY electronic component market, By Component Type, 2019-2028 (USD million)
TABLE 173 Germany Capacitors in electronic component market, By Type, 2019-2028 (USD million)
TABLE 174 Germany Diode in electronic component market, By Type, 2019-2028 (USD million)
TABLE 175 Germany Power Diode in electronic component market, By Type, 2019-2028 (USD million)
TABLE 176 Germany Switches in electronic component market, By Type, 2019-2028 (USD million)
TABLE 177 Germany Electronic Component market, By Commodities Type, 2019-2028 (USD million)
TABLE 178 Germany Brown Goods in electronic component market, By Type, 2019-2028 (USD million)
TABLE 179 Germany Brown Goods in electronic component market, By Electronic Component, 2019-2028 (USD million)
TABLE 180 Germany Brown Goods in Electronic Component market, By Material, 2019-2028 (USD million)
TABLE 181 Germany Metal in electronic component market, By Type, 2019-2028 (USD million)
TABLE 182 Germany Plastic in electronic component market, By Type, 2019-2028 (USD million)
TABLE 183 Germany White Goods in electronic component market, By Type, 2019-2028 (USD million)
TABLE 184 Germany White Goods in electronic component market, By Electronic Component, 2019-2028 (USD million)
TABLE 185 Germany White Goods in Electronic Component market, By Material, 2019-2028 (USD million)
TABLE 186 Germany Metal in electronic component market, By Type, 2019-2028 (USD million)
TABLE 187 Germany Plastic in electronic component market, By Type, 2019-2028 (USD million)
TABLE 188 Germany Small White Goods in electronic component market, By Type, 2019-2028 (USD million)
TABLE 189 Germany Small White Goods in electronic component market, By Electronic Component, 2019-2028 (USD million)
TABLE 190 Germany Small White Goods in Electronic Component market, By Material, 2019-2028 (USD million)
TABLE 191 Germany Metal in electronic component market, By Type, 2019-2028 (USD million)
TABLE 192 Germany Plastic in electronic component market, By Type, 2019-2028 (USD million)
TABLE 193 Germany electronic component market, By Product Type, 2019-2028 (USD million)
TABLE 194 GERMANY electronic component market, By End Use Type, 2019-2028 (USD million)
TABLE 195 FRANCE electronic component market, By Component Type, 2019-2028 (USD million)
TABLE 196 France Capacitors in electronic component market, By Type, 2019-2028 (USD million)
TABLE 197 France Diode in electronic component market, By Type, 2019-2028 (USD million)
TABLE 198 France Power Diode in electronic component market, By Type, 2019-2028 (USD million)
TABLE 199 France Switches in electronic component market, By Type, 2019-2028 (USD million)
TABLE 200 France Electronic Component market, By Commodities Type, 2019-2028 (USD million)
TABLE 201 France Brown Goods in electronic component market, By Type, 2019-2028 (USD million)
TABLE 202 France Brown Goods in electronic component market, By Electronic Component, 2019-2028 (USD million)
TABLE 203 France Brown Goods in Electronic Component market, By Material, 2019-2028 (USD million)
TABLE 204 France Metal in electronic component market, By Type, 2019-2028 (USD million)
TABLE 205 France Plastic in electronic component market, By Type, 2019-2028 (USD million)
TABLE 206 France White Goods in electronic component market, By Type, 2019-2028 (USD million)
TABLE 207 France White Goods in electronic component market, By Electronic Component, 2019-2028 (USD million)
TABLE 208 France White Goods in Electronic Component market, By Material, 2019-2028 (USD million)
TABLE 209 France Metal in electronic component market, By Type, 2019-2028 (USD million)
TABLE 210 France Plastic in electronic component market, By Type, 2019-2028 (USD million)
TABLE 211 France Small White Goods in electronic component market, By Type, 2019-2028 (USD million)
TABLE 212 France Small White Goods in electronic component market, By Electronic Component, 2019-2028 (USD million)
TABLE 213 France Small White Goods in Electronic Component market, By Material, 2019-2028 (USD million)
TABLE 214 France Metal in electronic component market, By Type, 2019-2028 (USD million)
TABLE 215 France Plastic in electronic component market, By Type, 2019-2028 (USD million)
TABLE 216 France electronic component market, By Product Type, 2019-2028 (USD million)
TABLE 217 FRANCE electronic component market, By End Use Type, 2019-2028 (USD million)
TABLE 218 U.K. electronic component market, By Component Type, 2019-2028 (USD million)
TABLE 219 U.K. Capacitors in electronic component market, By Type, 2019-2028 (USD million)
TABLE 220 U.K. Diode in electronic component market, By Type, 2019-2028 (USD million)
TABLE 221 U.K. Power Diode in electronic component market, By Type, 2019-2028 (USD million)
TABLE 222 U.K. Switches in electronic component market, By Type, 2019-2028 (USD million)
TABLE 223 U.K. Electronic Component market, By Commodities Type, 2019-2028 (USD million)
TABLE 224 U.K. Brown Goods in electronic component market, By Type, 2019-2028 (USD million)
TABLE 225 U.K. Brown Goods in electronic component market, By Electronic Component, 2019-2028 (USD million)
TABLE 226 U.K. Brown Goods in Electronic Component market, By Material, 2019-2028 (USD million)
TABLE 227 U.K. Metal in electronic component market, By Type, 2019-2028 (USD million)
TABLE 228 U.K. Plastic in electronic component market, By Type, 2019-2028 (USD million)
TABLE 229 U.K. White Goods in electronic component market, By Type, 2019-2028 (USD million)
TABLE 230 U.K. White Goods in electronic component market, By Electronic Component, 2019-2028 (USD million)
TABLE 231 U.K. White Goods in Electronic Component market, By Material, 2019-2028 (USD million)
TABLE 232 U.K. Metal in electronic component market, By Type, 2019-2028 (USD million)
TABLE 233 U.K. Plastic in electronic component market, By Type, 2019-2028 (USD million)
TABLE 234 U.K. Small White Goods in electronic component market, By Type, 2019-2028 (USD million)
TABLE 235 U.K. Small White Goods in electronic component market, By Electronic Component, 2019-2028 (USD million)
TABLE 236 U.K. Small White Goods in Electronic Component market, By Material, 2019-2028 (USD million)
TABLE 237 U.K. Metal in electronic component market, By Type, 2019-2028 (USD million)
TABLE 238 U.K. Plastic in electronic component market, By Type, 2019-2028 (USD million)
TABLE 239 U.K. electronic component market, By Product Type, 2019-2028 (USD million)
TABLE 240 U.K. electronic component market, By End Use Type, 2019-2028 (USD million)
TABLE 241 ITALY electronic component market, By Component Type, 2019-2028 (USD million)
TABLE 242 Italy Capacitors in electronic component market, By Type, 2019-2028 (USD million)
TABLE 243 Italy Diode in electronic component market, By Type, 2019-2028 (USD million)
TABLE 244 Italy Power Diode in electronic component market, By Type, 2019-2028 (USD million)
TABLE 245 Italy Switches in electronic component market, By Type, 2019-2028 (USD million)
TABLE 246 Italy Electronic Component market, By Commodities Type, 2019-2028 (USD million)
TABLE 247 Italy Brown Goods in electronic component market, By Type, 2019-2028 (USD million)
TABLE 248 Italy Brown Goods in electronic component market, By Electronic Component, 2019-2028 (USD million)
TABLE 249 Italy Brown Goods in Electronic Component market, By Material, 2019-2028 (USD million)
TABLE 250 Italy Metal in electronic component market, By Type, 2019-2028 (USD million)
TABLE 251 Italy Plastic in electronic component market, By Type, 2019-2028 (USD million)
TABLE 252 Italy White Goods in electronic component market, By Type, 2019-2028 (USD million)
TABLE 253 Italy White Goods in electronic component market, By Electronic Component, 2019-2028 (USD million)
TABLE 254 Italy White Goods in Electronic Component market, By Material, 2019-2028 (USD million)
TABLE 255 Italy Metal in electronic component market, By Type, 2019-2028 (USD million)
TABLE 256 Italy Plastic in electronic component market, By Type, 2019-2028 (USD million)
TABLE 257 Italy Small White Goods in electronic component market, By Type, 2019-2028 (USD million)
TABLE 258 Italy Small White Goods in electronic component market, By Electronic Component, 2019-2028 (USD million)
TABLE 259 Italy Small White Goods in Electronic Component market, By Material, 2019-2028 (USD million)
TABLE 260 Italy Metal in electronic component market, By Type, 2019-2028 (USD million)
TABLE 261 Italy Plastic in electronic component market, By Type, 2019-2028 (USD million)
TABLE 262 Italy electronic component market, By Product Type, 2019-2028 (USD million)
TABLE 263 ITALY electronic component market, By End Use Type, 2019-2028 (USD million)
TABLE 264 SPAIN electronic component market, By Component Type, 2019-2028 (USD million)
TABLE 265 Spain Capacitors in electronic component market, By Type, 2019-2028 (USD million)
TABLE 266 Spain Diode in electronic component market, By Type, 2019-2028 (USD million)
TABLE 267 Spain Power Diode in electronic component market, By Type, 2019-2028 (USD million)
TABLE 268 Spain Switches in electronic component market, By Type, 2019-2028 (USD million)
TABLE 269 Spain Electronic Component market, By Commodities Type, 2019-2028 (USD million)
TABLE 270 Spain Brown Goods in electronic component market, By Type, 2019-2028 (USD million)
TABLE 271 Spain Brown Goods in electronic component market, By Electronic Component, 2019-2028 (USD million)
TABLE 272 Spain Brown Goods in Electronic Component market, By Material, 2019-2028 (USD million)
TABLE 273 Spain Metal in electronic component market, By Type, 2019-2028 (USD million)
TABLE 274 Spain Plastic in electronic component market, By Type, 2019-2028 (USD million)
TABLE 275 Spain White Goods in electronic component market, By Type, 2019-2028 (USD million)
TABLE 276 Spain White Goods in electronic component market, By Electronic Component, 2019-2028 (USD million)
TABLE 277 Spain White Goods in Electronic Component market, By Material, 2019-2028 (USD million)
TABLE 278 Spain Metal in electronic component market, By Type, 2019-2028 (USD million)
TABLE 279 Spain Plastic in electronic component market, By Type, 2019-2028 (USD million)
TABLE 280 Spain Small White Goods in electronic component market, By Type, 2019-2028 (USD million)
TABLE 281 Spain Small White Goods in electronic component market, By Electronic Component, 2019-2028 (USD million)
TABLE 282 Spain Small White Goods in Electronic Component market, By Material, 2019-2028 (USD million)
TABLE 283 Spain Metal in electronic component market, By Type, 2019-2028 (USD million)
TABLE 284 Spain Plastic in electronic component market, By Type, 2019-2028 (USD million)
TABLE 285 Spain electronic component market, By Product Type, 2019-2028 (USD million)
TABLE 286 SPAIN electronic component market, By End Use Type, 2019-2028 (USD million)
TABLE 287 NETHERLANDS electronic component market, By Component Type, 2019-2028 (USD million)
TABLE 288 Netherlands Capacitors in electronic component market, By Type, 2019-2028 (USD million)
TABLE 289 Netherlands Diode in electronic component market, By Type, 2019-2028 (USD million)
TABLE 290 Netherlands Power Diode in electronic component market, By Type, 2019-2028 (USD million)
TABLE 291 Netherlands Switches in electronic component market, By Type, 2019-2028 (USD million)
TABLE 292 Netherlands Electronic Component market, By Commodities Type, 2019-2028 (USD million)
TABLE 293 Netherlands Brown Goods in electronic component market, By Type, 2019-2028 (USD million)
TABLE 294 Netherlands Brown Goods in electronic component market, By Electronic Component, 2019-2028 (USD million)
TABLE 295 Netherlands Brown Goods in Electronic Component market, By Material, 2019-2028 (USD million)
TABLE 296 Netherlands Metal in electronic component market, By Type, 2019-2028 (USD million)
TABLE 297 Netherlands Plastic in electronic component market, By Type, 2019-2028 (USD million)
TABLE 298 Netherlands White Goods in electronic component market, By Type, 2019-2028 (USD million)
TABLE 299 Netherlands White Goods in electronic component market, By Electronic Component, 2019-2028 (USD million)
TABLE 300 Netherlands White Goods in Electronic Component market, By Material, 2019-2028 (USD million)
TABLE 301 Netherlands Metal in electronic component market, By Type, 2019-2028 (USD million)
TABLE 302 Netherlands Plastic in electronic component market, By Type, 2019-2028 (USD million)
TABLE 303 Netherlands Small White Goods in electronic component market, By Type, 2019-2028 (USD million)
TABLE 304 Netherlands Small White Goods in electronic component market, By Electronic Component, 2019-2028 (USD million)
TABLE 305 Netherlands Small White Goods in Electronic Component market, By Material, 2019-2028 (USD million)
TABLE 306 Netherlands Metal in electronic component market, By Type, 2019-2028 (USD million)
TABLE 307 Netherlands Plastic in electronic component market, By Type, 2019-2028 (USD million)
TABLE 308 Netherlands electronic component market, By Product Type, 2019-2028 (USD million)
TABLE 309 NETHERLANDS electronic component market, By End Use Type, 2019-2028 (USD million)
TABLE 310 SWITZERLAND electronic component market, By Component Type, 2019-2028 (USD million)
TABLE 311 Switzerland Capacitors in electronic component market, By Type, 2019-2028 (USD million)
TABLE 312 Switzerland Diode in electronic component market, By Type, 2019-2028 (USD million)
TABLE 313 Switzerland Power Diode in electronic component market, By Type, 2019-2028 (USD million)
TABLE 314 Switzerland Switches in electronic component market, By Type, 2019-2028 (USD million)
TABLE 315 Switzerland Electronic Component market, By Commodities Type, 2019-2028 (USD million)
TABLE 316 Switzerland Brown Goods in electronic component market, By Type, 2019-2028 (USD million)
TABLE 317 Switzerland Brown Goods in electronic component market, By Electronic Component, 2019-2028 (USD million)
TABLE 318 Switzerland Brown Goods in Electronic Component market, By Material, 2019-2028 (USD million)
TABLE 319 Switzerland Metal in electronic component market, By Type, 2019-2028 (USD million)
TABLE 320 Switzerland Plastic in electronic component market, By Type, 2019-2028 (USD million)
TABLE 321 Switzerland White Goods in electronic component market, By Type, 2019-2028 (USD million)
TABLE 322 Switzerland White Goods in electronic component market, By Electronic Component, 2019-2028 (USD million)
TABLE 323 Switzerland White Goods in Electronic Component market, By Material, 2019-2028 (USD million)
TABLE 324 Switzerland Metal in electronic component market, By Type, 2019-2028 (USD million)
TABLE 325 Switzerland Plastic in electronic component market, By Type, 2019-2028 (USD million)
TABLE 326 Switzerland Small White Goods in electronic component market, By Type, 2019-2028 (USD million)
TABLE 327 Switzerland Small White Goods in electronic component market, By Electronic Component, 2019-2028 (USD million)
TABLE 328 Switzerland Small White Goods in Electronic Component market, By Material, 2019-2028 (USD million)
TABLE 329 Switzerland Metal in electronic component market, By Type, 2019-2028 (USD million)
TABLE 330 Switzerland Plastic in electronic component market, By Type, 2019-2028 (USD million)
TABLE 331 Switzerland electronic component market, By Product Type, 2019-2028 (USD million)
TABLE 332 SWITZERLAND electronic component market, By End Use Type, 2019-2028 (USD million)
TABLE 333 RUSSIA electronic component market, By Component Type, 2019-2028 (USD million)
TABLE 334 Russia Capacitors in electronic component market, By Type, 2019-2028 (USD million)
TABLE 335 Russia Diode in electronic component market, By Type, 2019-2028 (USD million)
TABLE 336 Russia Power Diode in electronic component market, By Type, 2019-2028 (USD million)
TABLE 337 Russia Switches in electronic component market, By Type, 2019-2028 (USD million)
TABLE 338 Russia Electronic Component market, By Commodities Type, 2019-2028 (USD million)
TABLE 339 Russia Brown Goods in electronic component market, By Type, 2019-2028 (USD million)
TABLE 340 Russia Brown Goods in electronic component market, By Electronic Component, 2019-2028 (USD million)
TABLE 341 Russia Brown Goods in Electronic Component market, By Material, 2019-2028 (USD million)
TABLE 342 Russia Metal in electronic component market, By Type, 2019-2028 (USD million)
TABLE 343 Russia Plastic in electronic component market, By Type, 2019-2028 (USD million)
TABLE 344 Russia White Goods in electronic component market, By Type, 2019-2028 (USD million)
TABLE 345 Russia White Goods in electronic component market, By Electronic Component, 2019-2028 (USD million)
TABLE 346 Russia White Goods in Electronic Component market, By Material, 2019-2028 (USD million)
TABLE 347 Russia Metal in electronic component market, By Type, 2019-2028 (USD million)
TABLE 348 Russia Plastic in electronic component market, By Type, 2019-2028 (USD million)
TABLE 349 Russia Small White Goods in electronic component market, By Type, 2019-2028 (USD million)
TABLE 350 Russia Small White Goods in electronic component market, By Electronic Component, 2019-2028 (USD million)
TABLE 351 Russia Small White Goods in Electronic Component market, By Material, 2019-2028 (USD million)
TABLE 352 Russia Metal in electronic component market, By Type, 2019-2028 (USD million)
TABLE 353 Russia Plastic in electronic component market, By Type, 2019-2028 (USD million)
TABLE 354 Russia electronic component market, By Product Type, 2019-2028 (USD million)
TABLE 355 RUSSIA electronic component market, By End Use Type, 2019-2028 (USD million)
TABLE 356 TURKEY electronic component market, By Component Type, 2019-2028 (USD million)
TABLE 357 Turkey Capacitors in electronic component market, By Type, 2019-2028 (USD million)
TABLE 358 Turkey Diode in electronic component market, By Type, 2019-2028 (USD million)
TABLE 359 Turkey Power Diode in electronic component market, By Type, 2019-2028 (USD million)
TABLE 360 Turkey Switches in electronic component market, By Type, 2019-2028 (USD million)
TABLE 361 Turkey Electronic Component market, By Commodities Type, 2019-2028 (USD million)
TABLE 362 Turkey Brown Goods in electronic component market, By Type, 2019-2028 (USD million)
TABLE 363 Turkey Brown Goods in electronic component market, By Electronic Component, 2019-2028 (USD million)
TABLE 364 Turkey Brown Goods in Electronic Component market, By Material, 2019-2028 (USD million)
TABLE 365 Turkey Metal in electronic component market, By Type, 2019-2028 (USD million)
TABLE 366 Turkey Plastic in electronic component market, By Type, 2019-2028 (USD million)
TABLE 367 Turkey White Goods in electronic component market, By Type, 2019-2028 (USD million)
TABLE 368 Turkey White Goods in electronic component market, By Electronic Component, 2019-2028 (USD million)
TABLE 369 Turkey White Goods in Electronic Component market, By Material, 2019-2028 (USD million)
TABLE 370 Turkey Metal in electronic component market, By Type, 2019-2028 (USD million)
TABLE 371 Turkey Plastic in electronic component market, By Type, 2019-2028 (USD million)
TABLE 372 Turkey Small White Goods in electronic component market, By Type, 2019-2028 (USD million)
TABLE 373 Turkey Small White Goods in electronic component market, By Electronic Component, 2019-2028 (USD million)
TABLE 374 Turkey Small White Goods in Electronic Component market, By Material, 2019-2028 (USD million)
TABLE 375 Turkey Metal in electronic component market, By Type, 2019-2028 (USD million)
TABLE 376 Turkey Plastic in electronic component market, By Type, 2019-2028 (USD million)
TABLE 377 Turkey electronic component market, By Product Type, 2019-2028 (USD million)
TABLE 378 TURKEY electronic component market, By End Use Type, 2019-2028 (USD million)
TABLE 379 BELGIUM electronic component market, By Component Type, 2019-2028 (USD million)
TABLE 380 Belgium Capacitors in electronic component market, By Type, 2019-2028 (USD million)
TABLE 381 Belgium Diode in electronic component market, By Type, 2019-2028 (USD million)
TABLE 382 Belgium Power Diode in electronic component market, By Type, 2019-2028 (USD million)
TABLE 383 Belgium Switches in electronic component market, By Type, 2019-2028 (USD million)
TABLE 384 Belgium Electronic Component market, By Commodities Type, 2019-2028 (USD million)
TABLE 385 Belgium Brown Goods in electronic component market, By Type, 2019-2028 (USD million)
TABLE 386 Belgium Brown Goods in electronic component market, By Electronic Component, 2019-2028 (USD million)
TABLE 387 Belgium Brown Goods in Electronic Component market, By Material, 2019-2028 (USD million)
TABLE 388 Belgium Metal in electronic component market, By Type, 2019-2028 (USD million)
TABLE 389 Belgium Plastic in electronic component market, By Type, 2019-2028 (USD million)
TABLE 390 Belgium White Goods in electronic component market, By Type, 2019-2028 (USD million)
TABLE 391 Belgium White Goods in electronic component market, By Electronic Component, 2019-2028 (USD million)
TABLE 392 Belgium White Goods in Electronic Component market, By Material, 2019-2028 (USD million)
TABLE 393 Belgium Metal in electronic component market, By Type, 2019-2028 (USD million)
TABLE 394 Belgium Plastic in electronic component market, By Type, 2019-2028 (USD million)
TABLE 395 Belgium Small White Goods in electronic component market, By Type, 2019-2028 (USD million)
TABLE 396 Belgium Small White Goods in electronic component market, By Electronic Component, 2019-2028 (USD million)
TABLE 397 Belgium Small White Goods in Electronic Component market, By Material, 2019-2028 (USD million)
TABLE 398 Belgium Metal in electronic component market, By Type, 2019-2028 (USD million)
TABLE 399 Belgium Plastic in electronic component market, By Type, 2019-2028 (USD million)
TABLE 400 Belgium electronic component market, By Product Type, 2019-2028 (USD million)
TABLE 401 BELGIUM electronic component market, By End Use Type, 2019-2028 (USD million)
TABLE 402 REST OF EUROPE electronic component market, By Component Type, 2019-2028 (USD million)
TABLE 403 SOUTH AMERICA electronic components market, By Country, 2018-2027 (USD million)
TABLE 404 SOUTH AMERICA electronic components market, By Components Type, 2019-2028 (USD million)
TABLE 405 South America Capacitors in electronic components market, By Type, 2019-2028 (USD million)
TABLE 406 South America Diodes in electronic components market, By Type, 2019-2028 (USD million)
TABLE 407 South America Power Diode in electronic components market, By Type, 2019-2028 (USD million)
TABLE 408 South America Switches in electronic components market, By Type, 2019-2028 (USD million)
TABLE 409 South America Electronic Components market, By Commodities Type, 2019-2028 (USD million)
TABLE 410 South America Brown Goods in electronic components market, By Type, 2019-2028 (USD million)
TABLE 411 South America Brown Goods in electronic components market, By Electronic Components, 2019-2028 (USD million)
TABLE 412 South America Brown Goods in Electronic Components market, By Material, 2019-2028 (USD million)
TABLE 413 South America Metal in electronic components market, By Type, 2019-2028 (USD million)
TABLE 414 South America Plastic in electronic components market, By Type, 2019-2028 (USD million)
TABLE 415 South America White Goods in electronic components market, By Type, 2019-2028 (USD million)
TABLE 416 South America White Goods in electronic components market, By Electronic Components, 2019-2028 (USD million)
TABLE 417 South America White Goods in Electronic Components market, By Material, 2019-2028 (USD million)
TABLE 418 South America Metal in electronic components market, By Type, 2019-2028 (USD million)
TABLE 419 South America Plastic in electronic components market, By Type, 2019-2028 (USD million)
TABLE 420 South America Small White Goods in electronic components market, By Type, 2019-2028 (USD million)
TABLE 421 South America Small White Goods in electronic components market, By Electronic Components, 2019-2028 (USD million)
TABLE 422 South America Small White Goods in Electronic Components market, By Material, 2019-2028 (USD million)
TABLE 423 South America Metal in electronic components market, By Type, 2019-2028 (USD million)
TABLE 424 South America Plastic in electronic components market, By Type, 2019-2028 (USD million)
TABLE 425 South America electronic components market, By Product Type, 2019-2028 (USD million)
TABLE 426 SOUTH AMERICA electronic components market, By End Use Type, 2019-2028 (USD million)
TABLE 427 BRAZIL electronic components market, By Components Type, 2019-2028 (USD million)
TABLE 428 BRAZIL Capacitors in electronic components market, By Type, 2019-2028 (USD million)
TABLE 429 BRAZIL Diodes in electronic components market, By Type, 2019-2028 (USD million)
TABLE 430 BRAZIL Power Diode in electronic components market, By Type, 2019-2028 (USD million)
TABLE 431 BRAZIL Switches in electronic components market, By Type, 2019-2028 (USD million)
TABLE 432 BRAZIL Electronic Components market, By Commodities Type, 2019-2028 (USD million)
TABLE 433 BRAZIL Brown Goods in electronic components market, By Type, 2019-2028 (USD million)
TABLE 434 BRAZIL Brown Goods in electronic components market, By Electronic Components, 2019-2028 (USD million)
TABLE 435 BRAZIL Brown Goods in Electronic Components market, By Material, 2019-2028 (USD million)
TABLE 436 BRAZIL Metal in electronic components market, By Type, 2019-2028 (USD million)
TABLE 437 BRAZIL Plastic in electronic components market, By Type, 2019-2028 (USD million)
TABLE 438 BRAZIL White Goods in electronic components market, By Type, 2019-2028 (USD million)
TABLE 439 BRAZIL White Goods in electronic components market, By Electronic Components, 2019-2028 (USD million)
TABLE 440 BRAZIL White Goods in Electronic Components market, By Material, 2019-2028 (USD million)
TABLE 441 BRAZIL Metal in electronic components market, By Type, 2019-2028 (USD million)
TABLE 442 BRAZIL Plastic in electronic components market, By Type, 2019-2028 (USD million)
TABLE 443 BRAZIL Small White Goods in electronic components market, By Type, 2019-2028 (USD million)
TABLE 444 BRAZIL Small White Goods in electronic components market, By Electronic Components, 2019-2028 (USD million)
TABLE 445 BRAZIL Small White Goods in Electronic Components market, By Material, 2019-2028 (USD million)
TABLE 446 BRAZIL Metal in electronic components market, By Type, 2019-2028 (USD million)
TABLE 447 BRAZIL Plastic in electronic components market, By Type, 2019-2028 (USD million)
TABLE 448 BRAZIL electronic components market, By Product Type, 2019-2028 (USD million)
TABLE 449 BRAZIL electronic components market, By End Use Type, 2019-2028 (USD million)
TABLE 450 ARGENTINA electronic components market, By Components Type, 2019-2028 (USD million)
TABLE 451 ARGENTINA Capacitors in electronic components market, By Type, 2019-2028 (USD million)
TABLE 452 ARGENTINA Diodes in electronic components market, By Type, 2019-2028 (USD million)
TABLE 453 ARGENTINA Power Diode in electronic components market, By Type, 2019-2028 (USD million)
TABLE 454 ARGENTINA Switches in electronic components market, By Type, 2019-2028 (USD million)
TABLE 455 ARGENTINA Electronic Components market, By Commodities Type, 2019-2028 (USD million)
TABLE 456 ARGENTINA Brown Goods in electronic components market, By Type, 2019-2028 (USD million)
TABLE 457 ARGENTINA Brown Goods in electronic components market, By Electronic Components, 2019-2028 (USD million)
TABLE 458 ARGENTINA Brown Goods in Electronic Components market, By Material, 2019-2028 (USD million)
TABLE 459 ARGENTINA Metal in electronic components market, By Type, 2019-2028 (USD million)
TABLE 460 ARGENTINA Plastic in electronic components market, By Type, 2019-2028 (USD million)
TABLE 461 ARGENTINA White Goods in electronic components market, By Type, 2019-2028 (USD million)
TABLE 462 ARGENTINA White Goods in electronic components market, By Electronic Components, 2019-2028 (USD million)
TABLE 463 ARGENTINA White Goods in Electronic Components market, By Material, 2019-2028 (USD million)
TABLE 464 ARGENTINA Metal in electronic components market, By Type, 2019-2028 (USD million)
TABLE 465 ARGENTINA Plastic in electronic components market, By Type, 2019-2028 (USD million)
TABLE 466 ARGENTINA Small White Goods in electronic components market, By Type, 2019-2028 (USD million)
TABLE 467 ARGENTINA Small White Goods in electronic components market, By Electronic Components, 2019-2028 (USD million)
TABLE 468 ARGENTINA Small White Goods in Electronic Components market, By Material, 2019-2028 (USD million)
TABLE 469 ARGENTINA Metal in electronic components market, By Type, 2019-2028 (USD million)
TABLE 470 ARGENTINA Plastic in electronic components market, By Type, 2019-2028 (USD million)
TABLE 471 ARGENTINA electronic components market, By Product Type, 2019-2028 (USD million)
TABLE 472 ARGENTINA electronic components market, By End Use Type, 2019-2028 (USD million)
TABLE 473 COLOMBIA electronic components market, By Components Type, 2019-2028 (USD million)
TABLE 474 COLOMBIA Capacitors in electronic components market, By Type, 2019-2028 (USD million)
TABLE 475 COLOMBIA Diodes in electronic components market, By Type, 2019-2028 (USD million)
TABLE 476 COLOMBIA Power Diode in electronic components market, By Type, 2019-2028 (USD million)
TABLE 477 COLOMBIA Switches in electronic components market, By Type, 2019-2028 (USD million)
TABLE 478 COLOMBIA Electronic Components market, By Commodities Type, 2019-2028 (USD million)
TABLE 479 COLOMBIA Brown Goods in electronic components market, By Type, 2019-2028 (USD million)
TABLE 480 COLOMBIA Brown Goods in electronic components market, By Electronic Components, 2019-2028 (USD million)
TABLE 481 COLOMBIA Brown Goods in Electronic Components market, By Material, 2019-2028 (USD million)
TABLE 482 COLOMBIA Metal in electronic components market, By Type, 2019-2028 (USD million)
TABLE 483 COLOMBIA Plastic in electronic components market, By Type, 2019-2028 (USD million)
TABLE 484 COLOMBIA White Goods in electronic components market, By Type, 2019-2028 (USD million)
TABLE 485 COLOMBIA White Goods in electronic components market, By Electronic Components, 2019-2028 (USD million)
TABLE 486 COLOMBIA White Goods in Electronic Components market, By Material, 2019-2028 (USD million)
TABLE 487 COLOMBIA Metal in electronic components market, By Type, 2019-2028 (USD million)
TABLE 488 COLOMBIA Plastic in electronic components market, By Type, 2019-2028 (USD million)
TABLE 489 COLOMBIA Small White Goods in electronic components market, By Type, 2019-2028 (USD million)
TABLE 490 COLOMBIA Small White Goods in electronic components market, By Electronic Components, 2019-2028 (USD million)
TABLE 491 COLOMBIA Small White Goods in Electronic Components market, By Material, 2019-2028 (USD million)
TABLE 492 COLOMBIA Metal in electronic components market, By Type, 2019-2028 (USD million)
TABLE 493 COLOMBIA Plastic in electronic components market, By Type, 2019-2028 (USD million)
TABLE 494 COLOMBIA electronic components market, By Product Type, 2019-2028 (USD million)
TABLE 495 COLOMBIA electronic components market, By End Use Type, 2019-2028 (USD million)
TABLE 496 PERU electronic components market, By Components Type, 2019-2028 (USD million)
TABLE 497 PERU Capacitors in electronic components market, By Type, 2019-2028 (USD million)
TABLE 498 PERU Diodes in electronic components market, By Type, 2019-2028 (USD million)
TABLE 499 PERU Power Diode in electronic components market, By Type, 2019-2028 (USD million)
TABLE 500 PERU Switches in electronic components market, By Type, 2019-2028 (USD million)
TABLE 501 PERU Electronic Components market, By Commodities Type, 2019-2028 (USD million)
TABLE 502 PERU Brown Goods in electronic components market, By Type, 2019-2028 (USD million)
TABLE 503 PERU Brown Goods in electronic components market, By Electronic Components, 2019-2028 (USD million)
TABLE 504 PERU Brown Goods in Electronic Components market, By Material, 2019-2028 (USD million)
TABLE 505 PERU Metal in electronic components market, By Type, 2019-2028 (USD million)
TABLE 506 PERU Plastic in electronic components market, By Type, 2019-2028 (USD million)
TABLE 507 PERU White Goods in electronic components market, By Type, 2019-2028 (USD million)
TABLE 508 PERU White Goods in electronic components market, By Electronic Components, 2019-2028 (USD million)
TABLE 509 PERU White Goods in Electronic Components market, By Material, 2019-2028 (USD million)
TABLE 510 PERU Metal in electronic components market, By Type, 2019-2028 (USD million)
TABLE 511 PERU Plastic in electronic components market, By Type, 2019-2028 (USD million)
TABLE 512 PERU Small White Goods in electronic components market, By Type, 2019-2028 (USD million)
TABLE 513 PERU Small White Goods in electronic components market, By Electronic Components, 2019-2028 (USD million)
TABLE 514 PERU Small White Goods in Electronic Components market, By Material, 2019-2028 (USD million)
TABLE 515 PERU Metal in electronic components market, By Type, 2019-2028 (USD million)
TABLE 516 PERU Plastic in electronic components market, By Type, 2019-2028 (USD million)
TABLE 517 PERU electronic components market, By Product Type, 2019-2028 (USD million)
TABLE 518 PERU electronic components market, By End Use Type, 2019-2028 (USD million)
TABLE 519 CHILE electronic components market, By Components Type, 2019-2028 (USD million)
TABLE 520 CHILE Capacitors in electronic components market, By Type, 2019-2028 (USD million)
TABLE 521 CHILE Diodes in electronic components market, By Type, 2019-2028 (USD million)
TABLE 522 CHILE Power Diode in electronic components market, By Type, 2019-2028 (USD million)
TABLE 523 CHILE Switches in electronic components market, By Type, 2019-2028 (USD million)
TABLE 524 CHILE Electronic Components market, By Commodities Type, 2019-2028 (USD million)
TABLE 525 CHILE Brown Goods in electronic components market, By Type, 2019-2028 (USD million)
TABLE 526 CHILE Brown Goods in electronic components market, By Electronic Components, 2019-2028 (USD million)
TABLE 527 CHILE Brown Goods in Electronic Components market, By Material, 2019-2028 (USD million)
TABLE 528 CHILE Metal in electronic components market, By Type, 2019-2028 (USD million)
TABLE 529 CHILE Plastic in electronic components market, By Type, 2019-2028 (USD million)
TABLE 530 CHILE White Goods in electronic components market, By Type, 2019-2028 (USD million)
TABLE 531 CHILE White Goods in electronic components market, By Electronic Components, 2019-2028 (USD million)
TABLE 532 CHILE White Goods in Electronic Components market, By Material, 2019-2028 (USD million)
TABLE 533 CHILE Metal in electronic components market, By Type, 2019-2028 (USD million)
TABLE 534 CHILE Plastic in electronic components market, By Type, 2019-2028 (USD million)
TABLE 535 CHILE Small White Goods in electronic components market, By Type, 2019-2028 (USD million)
TABLE 536 CHILE Small White Goods in electronic components market, By Electronic Components, 2019-2028 (USD million)
TABLE 537 CHILE Small White Goods in Electronic Components market, By Material, 2019-2028 (USD million)
TABLE 538 CHILE Metal in electronic components market, By Type, 2019-2028 (USD million)
TABLE 539 CHILE Plastic in electronic components market, By Type, 2019-2028 (USD million)
TABLE 540 CHILE electronic components market, By Product Type, 2019-2028 (USD million)
TABLE 541 CHILE electronic components market, By End Use Type, 2019-2028 (USD million)
TABLE 542 VENEZUELA electronic components market, By Components Type, 2019-2028 (USD million)
TABLE 543 VENEZUELA Capacitors in electronic components market, By Type, 2019-2028 (USD million)
TABLE 544 VENEZUELA Diodes in electronic components market, By Type, 2019-2028 (USD million)
TABLE 545 VENEZUELA Power Diode in electronic components market, By Type, 2019-2028 (USD million)
TABLE 546 VENEZUELA Switches in electronic components market, By Type, 2019-2028 (USD million)
TABLE 547 VENEZUELA Electronic Components market, By Commodities Type, 2019-2028 (USD million)
TABLE 548 VENEZUELA Brown Goods in electronic components market, By Type, 2019-2028 (USD million)
TABLE 549 VENEZUELA Brown Goods in electronic components market, By Electronic Components, 2019-2028 (USD million)
TABLE 550 VENEZUELA Brown Goods in Electronic Components market, By Material, 2019-2028 (USD million)
TABLE 551 VENEZUELA Metal in electronic components market, By Type, 2019-2028 (USD million)
TABLE 552 VENEZUELA Plastic in electronic components market, By Type, 2019-2028 (USD million)
TABLE 553 VENEZUELA White Goods in electronic components market, By Type, 2019-2028 (USD million)
TABLE 554 VENEZUELA White Goods in electronic components market, By Electronic Components, 2019-2028 (USD million)
TABLE 555 VENEZUELA White Goods in Electronic Components market, By Material, 2019-2028 (USD million)
TABLE 556 VENEZUELA Metal in electronic components market, By Type, 2019-2028 (USD million)
TABLE 557 VENEZUELA Plastic in electronic components market, By Type, 2019-2028 (USD million)
TABLE 558 VENEZUELA Small White Goods in electronic components market, By Type, 2019-2028 (USD million)
TABLE 559 VENEZUELA Small White Goods in electronic components market, By Electronic Components, 2019-2028 (USD million)
TABLE 560 VENEZUELA Small White Goods in Electronic Components market, By Material, 2019-2028 (USD million)
TABLE 561 VENEZUELA Metal in electronic components market, By Type, 2019-2028 (USD million)
TABLE 562 VENEZUELA Plastic in electronic components market, By Type, 2019-2028 (USD million)
TABLE 563 VENEZUELA electronic components market, By Product Type, 2019-2028 (USD million)
TABLE 564 VENEZUELA electronic components market, By End Use Type, 2019-2028 (USD million)
TABLE 565 Ecuador electronic components market, By Components Type, 2019-2028 (USD million)
TABLE 566 Ecuador Capacitors in electronic components market, By Type, 2019-2028 (USD million)
TABLE 567 Ecuador Diodes in electronic components market, By Type, 2019-2028 (USD million)
TABLE 568 Ecuador Power Diode in electronic components market, By Type, 2019-2028 (USD million)
TABLE 569 Ecuador Switches in electronic components market, By Type, 2019-2028 (USD million)
TABLE 570 Ecuador Electronic Components market, By Commodities Type, 2019-2028 (USD million)
TABLE 571 Ecuador Brown Goods in electronic components market, By Type, 2019-2028 (USD million)
TABLE 572 Ecuador Brown Goods in electronic components market, By Electronic Components, 2019-2028 (USD million)
TABLE 573 Ecuador Brown Goods in Electronic Components market, By Material, 2019-2028 (USD million)
TABLE 574 Ecuador Metal in electronic components market, By Type, 2019-2028 (USD million)
TABLE 575 Ecuador Plastic in electronic components market, By Type, 2019-2028 (USD million)
TABLE 576 Ecuador White Goods in electronic components market, By Type, 2019-2028 (USD million)
TABLE 577 Ecuador White Goods in electronic components market, By Electronic Components, 2019-2028 (USD million)
TABLE 578 Ecuador White Goods in Electronic Components market, By Material, 2019-2028 (USD million)
TABLE 579 Ecuador Metal in electronic components market, By Type, 2019-2028 (USD million)
TABLE 580 Ecuador Plastic in electronic components market, By Type, 2019-2028 (USD million)
TABLE 581 Ecuador Small White Goods in electronic components market, By Type, 2019-2028 (USD million)
TABLE 582 Ecuador Small White Goods in electronic components market, By Electronic Components, 2019-2028 (USD million)
TABLE 583 Ecuador Small White Goods in Electronic Components market, By Material, 2019-2028 (USD million)
TABLE 584 Ecuador Metal in electronic components market, By Type, 2019-2028 (USD million)
TABLE 585 Ecuador Plastic in electronic components market, By Type, 2019-2028 (USD million)
TABLE 586 Ecuador electronic components market, By Product Type, 2019-2028 (USD million)
TABLE 587 Ecuador electronic components market, By End Use Type, 2019-2028 (USD million)
TABLE 588 rest of mea electronic components market, By Components Type, 2019-2028 (USD million)
TABLE 589 Asia-Pacific electronic components market, By Country, 2019-2028 (USD million)
TABLE 590 ASIA-PACIFIC electronic components market, By Components Type, 2019-2028 (USD million)
TABLE 591 Asia-Pacific Capacitors in electronic components market, By Type, 2019-2028 (USD million)
TABLE 592 Asia-Pacific Diodes in electronic components market, By Type, 2019-2028 (USD million)
TABLE 593 Asia-Pacific Power Diode in electronic components market, By Type, 2019-2028 (USD million)
TABLE 594 Asia-Pacific Switches in electronic components market, By Type, 2019-2028 (USD million)
TABLE 595 Asia-Pacific Electronic Components market, By Commodities Type, 2019-2028 (USD million)
TABLE 596 Asia-Pacific Brown Goods in electronic components market, By Type, 2019-2028 (USD million)
TABLE 597 Asia-Pacific Brown Goods in electronic components market, By Electronic Components, 2019-2028 (USD million)
TABLE 598 Asia-Pacific Brown Goods in Electronic Components market, By Material, 2019-2028 (USD million)
TABLE 599 Asia-Pacific Metal in electronic components market, By Type, 2019-2028 (USD million)
TABLE 600 Asia-Pacific Plastic in electronic components market, By Type, 2019-2028 (USD million)
TABLE 601 Asia-Pacific White Goods in electronic components market, By Type, 2019-2028 (USD million)
TABLE 602 Asia-Pacific White Goods in electronic components market, By Electronic Components, 2019-2028 (USD million)
TABLE 603 Asia-Pacific White Goods in Electronic Components market, By Material, 2019-2028 (USD million)
TABLE 604 Asia-Pacific Metal in electronic components market, By Type, 2019-2028 (USD million)
TABLE 605 Asia-Pacific Plastic in electronic components market, By Type, 2019-2028 (USD million)
TABLE 606 Asia-Pacific Small White Goods in electronic components market, By Type, 2019-2028 (USD million)
TABLE 607 Asia-Pacific Small White Goods in electronic components market, By Electronic Components, 2019-2028 (USD million)
TABLE 608 Asia-Pacific Small White Goods in Electronic Components market, By Material, 2019-2028 (USD million)
TABLE 609 Asia-Pacific Metal in electronic components market, By Type, 2019-2028 (USD million)
TABLE 610 Asia-Pacific Plastic in electronic components market, By Type, 2019-2028 (USD million)
TABLE 611 Asia-Pacific electronic components market, By Product Type, 2019-2028 (USD million)
TABLE 612 ASIA-PACIFIC electronic components market, By End Use Type, 2019-2028 (USD million)
TABLE 613 CHINA electronic components market, By Components Type, 2019-2028 (USD million)
TABLE 614 China Capacitors in electronic components market, By Type, 2019-2028 (USD million)
TABLE 615 China Diodes in electronic components market, By Type, 2019-2028 (USD million)
TABLE 616 China Power Diode in electronic components market, By Type, 2019-2028 (USD million)
TABLE 617 China Switches in electronic components market, By Type, 2019-2028 (USD million)
TABLE 618 China Electronic Components market, By Commodities Type, 2019-2028 (USD million)
TABLE 619 China Brown Goods in electronic components market, By Type, 2019-2028 (USD million)
TABLE 620 China Brown Goods in electronic components market, By Electronic Components, 2019-2028 (USD million)
TABLE 621 China Brown Goods in Electronic Components market, By Material, 2019-2028 (USD million)
TABLE 622 China Metal in electronic components market, By Type, 2019-2028 (USD million)
TABLE 623 China Plastic in electronic components market, By Type, 2019-2028 (USD million)
TABLE 624 China White Goods in electronic components market, By Type, 2019-2028 (USD million)
TABLE 625 China White Goods in electronic components market, By Electronic Components, 2019-2028 (USD million)
TABLE 626 China White Goods in Electronic Components market, By Material, 2019-2028 (USD million)
TABLE 627 China Metal in electronic components market, By Type, 2019-2028 (USD million)
TABLE 628 China Plastic in electronic components market, By Type, 2019-2028 (USD million)
TABLE 629 China Small White Goods in electronic components market, By Type, 2019-2028 (USD million)
TABLE 630 China Small White Goods in electronic components market, By Electronic Components, 2019-2028 (USD million)
TABLE 631 China Small White Goods in Electronic Components market, By Material, 2019-2028 (USD million)
TABLE 632 China Metal in electronic components market, By Type, 2019-2028 (USD million)
TABLE 633 China Plastic in electronic components market, By Type, 2019-2028 (USD million)
TABLE 634 China electronic components market, By Product Type, 2019-2028 (USD million)
TABLE 635 CHINA electronic components market, By End Use Type, 2019-2028 (USD million)
TABLE 636 SOUTH KOREA electronic components market, By Components Type, 2019-2028 (USD million)
TABLE 637 South Korea Capacitors in electronic components market, By Type, 2019-2028 (USD million)
TABLE 638 South Korea Diodes in electronic components market, By Type, 2019-2028 (USD million)
TABLE 639 South Korea Power Diode in electronic components market, By Type, 2019-2028 (USD million)
TABLE 640 South Korea Switches in electronic components market, By Type, 2019-2028 (USD million)
TABLE 641 South Korea Electronic Components market, By Commodities Type, 2019-2028 (USD million)
TABLE 642 South Korea Brown Goods in electronic components market, By Type, 2019-2028 (USD million)
TABLE 643 South Korea Brown Goods in electronic components market, By Electronic Components, 2019-2028 (USD million)
TABLE 644 South Korea Brown Goods in Electronic Components market, By Material, 2019-2028 (USD million)
TABLE 645 South Korea Metal in electronic components market, By Type, 2019-2028 (USD million)
TABLE 646 South Korea Plastic in electronic components market, By Type, 2019-2028 (USD million)
TABLE 647 South Korea White Goods in electronic components market, By Type, 2019-2028 (USD million)
TABLE 648 South Korea White Goods in electronic components market, By Electronic Components, 2019-2028 (USD million)
TABLE 649 South Korea White Goods in Electronic Components market, By Material, 2019-2028 (USD million)
TABLE 650 South Korea Metal in electronic components market, By Type, 2019-2028 (USD million)
TABLE 651 South Korea Plastic in electronic components market, By Type, 2019-2028 (USD million)
TABLE 652 South Korea Small White Goods in electronic components market, By Type, 2019-2028 (USD million)
TABLE 653 South Korea Small White Goods in electronic components market, By Electronic Components, 2019-2028 (USD million)
TABLE 654 South Korea Small White Goods in Electronic Components market, By Material, 2019-2028 (USD million)
TABLE 655 South Korea Metal in electronic components market, By Type, 2019-2028 (USD million)
TABLE 656 South Korea Plastic in electronic components market, By Type, 2019-2028 (USD million)
TABLE 657 South Korea electronic components market, By Product Type, 2019-2028 (USD million)
TABLE 658 SOUTH KOREA electronic components market, By End Use Type, 2019-2028 (USD million)
TABLE 659 JAPAN electronic components market, By Components Type, 2019-2028 (USD million)
TABLE 660 Japan Capacitors in electronic components market, By Type, 2019-2028 (USD million)
TABLE 661 Japan Diodes in electronic components market, By Type, 2019-2028 (USD million)
TABLE 662 Japan Power Diode in electronic components market, By Type, 2019-2028 (USD million)
TABLE 663 Japan Switches in electronic components market, By Type, 2019-2028 (USD million)
TABLE 664 Japan Electronic Components market, By Commodities Type, 2019-2028 (USD million)
TABLE 665 Japan Brown Goods in electronic components market, By Type, 2019-2028 (USD million)
TABLE 666 Japan Brown Goods in electronic components market, By Electronic Components, 2019-2028 (USD million)
TABLE 667 Japan Brown Goods in Electronic Components market, By Material, 2019-2028 (USD million)
TABLE 668 Japan Metal in electronic components market, By Type, 2019-2028 (USD million)
TABLE 669 Japan Plastic in electronic components market, By Type, 2019-2028 (USD million)
TABLE 670 Japan White Goods in electronic components market, By Type, 2019-2028 (USD million)
TABLE 671 Japan White Goods in electronic components market, By Electronic Components, 2019-2028 (USD million)
TABLE 672 Japan White Goods in Electronic Components market, By Material, 2019-2028 (USD million)
TABLE 673 Japan Metal in electronic components market, By Type, 2019-2028 (USD million)
TABLE 674 Japan Plastic in electronic components market, By Type, 2019-2028 (USD million)
TABLE 675 Japan Small White Goods in electronic components market, By Type, 2019-2028 (USD million)
TABLE 676 Japan Small White Goods in electronic components market, By Electronic Components, 2019-2028 (USD million)
TABLE 677 Japan Small White Goods in Electronic Components market, By Material, 2019-2028 (USD million)
TABLE 678 Japan Metal in electronic components market, By Type, 2019-2028 (USD million)
TABLE 679 Japan Plastic in electronic components market, By Type, 2019-2028 (USD million)
TABLE 680 Japan electronic components market, By Product Type, 2019-2028 (USD million)
TABLE 681 JAPAN electronic components market, By End Use Type, 2019-2028 (USD million)
TABLE 682 INDIA electronic components market, By Components Type, 2019-2028 (USD million)
TABLE 683 India Capacitors in electronic components market, By Type, 2019-2028 (USD million)
TABLE 684 India Diodes in electronic components market, By Type, 2019-2028 (USD million)
TABLE 685 India Power Diode in electronic components market, By Type, 2019-2028 (USD million)
TABLE 686 India Switches in electronic components market, By Type, 2019-2028 (USD million)
TABLE 687 India Electronic Components market, By Commodities Type, 2019-2028 (USD million)
TABLE 688 India Brown Goods in electronic components market, By Type, 2019-2028 (USD million)
TABLE 689 India Brown Goods in electronic components market, By Electronic Components, 2019-2028 (USD million)
TABLE 690 India Brown Goods in Electronic Components market, By Material, 2019-2028 (USD million)
TABLE 691 India Metal in electronic components market, By Type, 2019-2028 (USD million)
TABLE 692 India Plastic in electronic components market, By Type, 2019-2028 (USD million)
TABLE 693 India White Goods in electronic components market, By Type, 2019-2028 (USD million)
TABLE 694 India White Goods in electronic components market, By Electronic Components, 2019-2028 (USD million)
TABLE 695 India White Goods in Electronic Components market, By Material, 2019-2028 (USD million)
TABLE 696 India Metal in electronic components market, By Type, 2019-2028 (USD million)
TABLE 697 India Plastic in electronic components market, By Type, 2019-2028 (USD million)
TABLE 698 India Small White Goods in electronic components market, By Type, 2019-2028 (USD million)
TABLE 699 India Small White Goods in electronic components market, By Electronic Components, 2019-2028 (USD million)
TABLE 700 India Small White Goods in Electronic Components market, By Material, 2019-2028 (USD million)
TABLE 701 India Metal in electronic components market, By Type, 2019-2028 (USD million)
TABLE 702 India Plastic in electronic components market, By Type, 2019-2028 (USD million)
TABLE 703 India electronic components market, By Product Type, 2019-2028 (USD million)
TABLE 704 INDIA electronic components market, By End Use Type, 2019-2028 (USD million)
TABLE 705 SINGAPORE electronic components market, By Components Type, 2019-2028 (USD million)
TABLE 706 Singapore Capacitors in electronic components market, By Type, 2019-2028 (USD million)
TABLE 707 Singapore Diodes in electronic components market, By Type, 2019-2028 (USD million)
TABLE 708 Singapore Power Diode in electronic components market, By Type, 2019-2028 (USD million)
TABLE 709 Singapore Switches in electronic components market, By Type, 2019-2028 (USD million)
TABLE 710 Singapore Electronic Components market, By Commodities Type, 2019-2028 (USD million)
TABLE 711 Singapore Brown Goods in electronic components market, By Type, 2019-2028 (USD million)
TABLE 712 Singapore Brown Goods in electronic components market, By Electronic Components, 2019-2028 (USD million)
TABLE 713 Singapore Brown Goods in Electronic Components market, By Material, 2019-2028 (USD million)
TABLE 714 Singapore Metal in electronic components market, By Type, 2019-2028 (USD million)
TABLE 715 Singapore Plastic in electronic components market, By Type, 2019-2028 (USD million)
TABLE 716 Singapore White Goods in electronic components market, By Type, 2019-2028 (USD million)
TABLE 717 Singapore White Goods in electronic components market, By Electronic Components, 2019-2028 (USD million)
TABLE 718 Singapore White Goods in Electronic Components market, By Material, 2019-2028 (USD million)
TABLE 719 Singapore Metal in electronic components market, By Type, 2019-2028 (USD million)
TABLE 720 Singapore Plastic in electronic components market, By Type, 2019-2028 (USD million)
TABLE 721 Singapore Small White Goods in electronic components market, By Type, 2019-2028 (USD million)
TABLE 722 Singapore Small White Goods in electronic components market, By Electronic Components, 2019-2028 (USD million)
TABLE 723 Singapore Small White Goods in Electronic Components market, By Material, 2019-2028 (USD million)
TABLE 724 Singapore Metal in electronic components market, By Type, 2019-2028 (USD million)
TABLE 725 Singapore Plastic in electronic components market, By Type, 2019-2028 (USD million)
TABLE 726 Singapore electronic components market, By Product Type, 2019-2028 (USD million)
TABLE 727 SINGAPORE electronic components market, By End Use Type, 2019-2028 (USD million)
TABLE 728 AUSTRALIA electronic components market, By Components Type, 2019-2028 (USD million)
TABLE 729 Australia Capacitors in electronic components market, By Type, 2019-2028 (USD million)
TABLE 730 Australia Diodes in electronic components market, By Type, 2019-2028 (USD million)
TABLE 731 Australia Power Diode in electronic components market, By Type, 2019-2028 (USD million)
TABLE 732 Australia Switches in electronic components market, By Type, 2019-2028 (USD million)
TABLE 733 Australia Electronic Components market, By Commodities Type, 2019-2028 (USD million)
TABLE 734 Australia Brown Goods in electronic components market, By Type, 2019-2028 (USD million)
TABLE 735 Australia Brown Goods in electronic components market, By Electronic Components, 2019-2028 (USD million)
TABLE 736 Australia Brown Goods in Electronic Components market, By Material, 2019-2028 (USD million)
TABLE 737 Australia Metal in electronic components market, By Type, 2019-2028 (USD million)
TABLE 738 Australia Plastic in electronic components market, By Type, 2019-2028 (USD million)
TABLE 739 Australia White Goods in electronic components market, By Type, 2019-2028 (USD million)
TABLE 740 Australia White Goods in electronic components market, By Electronic Components, 2019-2028 (USD million)
TABLE 741 Australia White Goods in Electronic Components market, By Material, 2019-2028 (USD million)
TABLE 742 Australia Metal in electronic components market, By Type, 2019-2028 (USD million)
TABLE 743 Australia Plastic in electronic components market, By Type, 2019-2028 (USD million)
TABLE 744 Australia Small White Goods in electronic components market, By Type, 2019-2028 (USD million)
TABLE 745 Australia Small White Goods in electronic components market, By Electronic Components, 2019-2028 (USD million)
TABLE 746 Australia Small White Goods in Electronic Components market, By Material, 2019-2028 (USD million)
TABLE 747 Australia Metal in electronic components market, By Type, 2019-2028 (USD million)
TABLE 748 Australia Plastic in electronic components market, By Type, 2019-2028 (USD million)
TABLE 749 Australia electronic components market, By Product Type, 2019-2028 (USD million)
TABLE 750 AUSTRALIA electronic components market, By End Use Type, 2019-2028 (USD million)
TABLE 751 MALAYSIA electronic components market, By Components Type, 2019-2028 (USD million)
TABLE 752 Malaysia Capacitors in electronic components market, By Type, 2019-2028 (USD million)
TABLE 753 Malaysia Diodes in electronic components market, By Type, 2019-2028 (USD million)
TABLE 754 Malaysia Power Diode in electronic components market, By Type, 2019-2028 (USD million)
TABLE 755 Malaysia Switches in electronic components market, By Type, 2019-2028 (USD million)
TABLE 756 Malaysia Electronic Components market, By Commodities Type, 2019-2028 (USD million)
TABLE 757 Malaysia Brown Goods in electronic components market, By Type, 2019-2028 (USD million)
TABLE 758 Malaysia Brown Goods in electronic components market, By Electronic Components, 2019-2028 (USD million)
TABLE 759 Malaysia Brown Goods in Electronic Components market, By Material, 2019-2028 (USD million)
TABLE 760 Malaysia Metal in electronic components market, By Type, 2019-2028 (USD million)
TABLE 761 Malaysia Plastic in electronic components market, By Type, 2019-2028 (USD million)
TABLE 762 Malaysia White Goods in electronic components market, By Type, 2019-2028 (USD million)
TABLE 763 Malaysia White Goods in electronic components market, By Electronic Components, 2019-2028 (USD million)
TABLE 764 Malaysia White Goods in Electronic Components market, By Material, 2019-2028 (USD million)
TABLE 765 Malaysia Metal in electronic components market, By Type, 2019-2028 (USD million)
TABLE 766 Malaysia Plastic in electronic components market, By Type, 2019-2028 (USD million)
TABLE 767 Malaysia Small White Goods in electronic components market, By Type, 2019-2028 (USD million)
TABLE 768 Malaysia Small White Goods in electronic components market, By Electronic Components, 2019-2028 (USD million)
TABLE 769 Malaysia Small White Goods in Electronic Components market, By Material, 2019-2028 (USD million)
TABLE 770 Malaysia Metal in electronic components market, By Type, 2019-2028 (USD million)
TABLE 771 Malaysia Plastic in electronic components market, By Type, 2019-2028 (USD million)
TABLE 772 Malaysia electronic components market, By Product Type, 2019-2028 (USD million)
TABLE 773 MALAYSIA electronic components market, By End Use Type, 2019-2028 (USD million)
TABLE 774 PHILIPPINES electronic components market, By Components Type, 2019-2028 (USD million)
TABLE 775 Philippines Capacitors in electronic components market, By Type, 2019-2028 (USD million)
TABLE 776 Philippines Diodes in electronic components market, By Type, 2019-2028 (USD million)
TABLE 777 Philippines Power Diode in electronic components market, By Type, 2019-2028 (USD million)
TABLE 778 Philippines Switches in electronic components market, By Type, 2019-2028 (USD million)
TABLE 779 Philippines Electronic Components market, By Commodities Type, 2019-2028 (USD million)
TABLE 780 Philippines Brown Goods in electronic components market, By Type, 2019-2028 (USD million)
TABLE 781 Philippines Brown Goods in electronic components market, By Electronic Components, 2019-2028 (USD million)
TABLE 782 Philippines Brown Goods in Electronic Components market, By Material, 2019-2028 (USD million)
TABLE 783 Philippines Metal in electronic components market, By Type, 2019-2028 (USD million)
TABLE 784 Philippines Plastic in electronic components market, By Type, 2019-2028 (USD million)
TABLE 785 Philippines White Goods in electronic components market, By Type, 2019-2028 (USD million)
TABLE 786 Philippines White Goods in electronic components market, By Electronic Components, 2019-2028 (USD million)
TABLE 787 Philippines White Goods in Electronic Components market, By Material, 2019-2028 (USD million)
TABLE 788 Philippines Metal in electronic components market, By Type, 2019-2028 (USD million)
TABLE 789 Philippines Plastic in electronic components market, By Type, 2019-2028 (USD million)
TABLE 790 Philippines Small White Goods in electronic components market, By Type, 2019-2028 (USD million)
TABLE 791 Philippines Small White Goods in electronic components market, By Electronic Components, 2019-2028 (USD million)
TABLE 792 Philippines Small White Goods in Electronic Components market, By Material, 2019-2028 (USD million)
TABLE 793 Philippines Metal in electronic components market, By Type, 2019-2028 (USD million)
TABLE 794 Philippines Plastic in electronic components market, By Type, 2019-2028 (USD million)
TABLE 795 Philippines electronic components market, By Product Type, 2019-2028 (USD million)
TABLE 796 PHILIPPINES electronic components market, By End Use Type, 2019-2028 (USD million)
TABLE 797 THAILAND electronic components market, By Components Type, 2019-2028 (USD million)
TABLE 798 Thailand Capacitors in electronic components market, By Type, 2019-2028 (USD million)
TABLE 799 Thailand Diodes in electronic components market, By Type, 2019-2028 (USD million)
TABLE 800 Thailand Power Diode in electronic components market, By Type, 2019-2028 (USD million)
TABLE 801 Thailand Switches in electronic components market, By Type, 2019-2028 (USD million)
TABLE 802 Thailand Electronic Components market, By Commodities Type, 2019-2028 (USD million)
TABLE 803 Thailand Brown Goods in electronic components market, By Type, 2019-2028 (USD million)
TABLE 804 Thailand Brown Goods in electronic components market, By Electronic Components, 2019-2028 (USD million)
TABLE 805 Thailand Brown Goods in Electronic Components market, By Material, 2019-2028 (USD million)
TABLE 806 Thailand Metal in electronic components market, By Type, 2019-2028 (USD million)
TABLE 807 Thailand Plastic in electronic components market, By Type, 2019-2028 (USD million)
TABLE 808 Thailand White Goods in electronic components market, By Type, 2019-2028 (USD million)
TABLE 809 Thailand White Goods in electronic components market, By Electronic Components, 2019-2028 (USD million)
TABLE 810 Thailand White Goods in Electronic Components market, By Material, 2019-2028 (USD million)
TABLE 811 Thailand Metal in electronic components market, By Type, 2019-2028 (USD million)
TABLE 812 Thailand Plastic in electronic components market, By Type, 2019-2028 (USD million)
TABLE 813 Thailand Small White Goods in electronic components market, By Type, 2019-2028 (USD million)
TABLE 814 Thailand Small White Goods in electronic components market, By Electronic Components, 2019-2028 (USD million)
TABLE 815 Thailand Small White Goods in Electronic Components market, By Material, 2019-2028 (USD million)
TABLE 816 Thailand Metal in electronic components market, By Type, 2019-2028 (USD million)
TABLE 817 Thailand Plastic in electronic components market, By Type, 2019-2028 (USD million)
TABLE 818 Thailand electronic components market, By Product Type, 2019-2028 (USD million)
TABLE 819 THAILAND electronic components market, By End Use Type, 2019-2028 (USD million)
TABLE 820 INDONESIA electronic components market, By Components Type, 2019-2028 (USD million)
TABLE 821 Indonesia Capacitors in electronic components market, By Type, 2019-2028 (USD million)
TABLE 822 Indonesia Diodes in electronic components market, By Type, 2019-2028 (USD million)
TABLE 823 Indonesia Power Diode in electronic components market, By Type, 2019-2028 (USD million)
TABLE 824 Indonesia Switches in electronic components market, By Type, 2019-2028 (USD million)
TABLE 825 Indonesia Electronic Components market, By Commodities Type, 2019-2028 (USD million)
TABLE 826 Indonesia Brown Goods in electronic components market, By Type, 2019-2028 (USD million)
TABLE 827 Indonesia Brown Goods in electronic components market, By Electronic Components, 2019-2028 (USD million)
TABLE 828 Indonesia Brown Goods in Electronic Components market, By Material, 2019-2028 (USD million)
TABLE 829 Indonesia Metal in electronic components market, By Type, 2019-2028 (USD million)
TABLE 830 Indonesia Plastic in electronic components market, By Type, 2019-2028 (USD million)
TABLE 831 Indonesia White Goods in electronic components market, By Type, 2019-2028 (USD million)
TABLE 832 Indonesia White Goods in electronic components market, By Electronic Components, 2019-2028 (USD million)
TABLE 833 Indonesia White Goods in Electronic Components market, By Material, 2019-2028 (USD million)
TABLE 834 Indonesia Metal in electronic components market, By Type, 2019-2028 (USD million)
TABLE 835 Indonesia Plastic in electronic components market, By Type, 2019-2028 (USD million)
TABLE 836 Indonesia Small White Goods in electronic components market, By Type, 2019-2028 (USD million)
TABLE 837 Indonesia Small White Goods in electronic components market, By Electronic Components, 2019-2028 (USD million)
TABLE 838 Indonesia Small White Goods in Electronic Components market, By Material, 2019-2028 (USD million)
TABLE 839 Indonesia Metal in electronic components market, By Type, 2019-2028 (USD million)
TABLE 840 Indonesia Plastic in electronic components market, By Type, 2019-2028 (USD million)
TABLE 841 Indonesia electronic components market, By Product Type, 2019-2028 (USD million)
TABLE 842 INDONESIA electronic components market, By End Use Type, 2019-2028 (USD million)
TABLE 843 REST OF ASIA-PACIFIC electronic components market, By Components Type, 2019-2028 (USD million)
TABLE 844 MIDDLE EAST & AFRICA Electronic Components Market, By Country, 2019-2027 (USD Million)
TABLE 845 MIDDLE EAST & AFRICA Electronic Components Market, By Component Type, 2019-2028 (USD Million)
TABLE 846 Middle East & Africa Capacitors in Electronic Components Market, By Type, 2019-2028 (USD Million)
TABLE 847 Middle East & Africa Diodes in Electronic Components Market, By Type, 2019-2028 (USD Million)
TABLE 848 Middle East & Africa Power Diode in Electronic Components Market, By Type, 2019-2028 (USD Million)
TABLE 849 Middle East & Africa Switches in Electronic Components Market, By Type, 2019-2028 (USD Million)
TABLE 850 Middle East & Africa Electronic Components market, By Commodities Type, 2019-2028 (USD Million)
TABLE 851 Middle East & Africa Brown Goods in Electronic Components Market, By Type, 2019-2028 (USD Million)
TABLE 852 Middle East & Africa Brown Goods in Electronic Components Market, By Electronic Components, 2019-2028 (USD Million)
TABLE 853 Middle East & Africa Brown Goods in Electronic Components market, By Material, 2019-2028 (USD Million)
TABLE 854 Middle East & Africa Metal in Electronic Components Market, By Type, 2019-2028 (USD Million)
TABLE 855 Middle East & Africa Plastic in Electronic Components Market, By Type, 2019-2028 (USD Million)
TABLE 856 Middle East & Africa White Goods in Electronic Components Market, By Type, 2019-2028 (USD Million)
TABLE 857 Middle East & Africa White Goods in Electronic Components Market, By Electronic Components, 2019-2028 (USD Million)
TABLE 858 Middle East & Africa White Goods in Electronic Components market, By Material, 2019-2028 (USD Million)
TABLE 859 Middle East & Africa Metal in Electronic Components Market, By Type, 2019-2028 (USD Million)
TABLE 860 Middle East & Africa Plastic in Electronic Components Market, By Type, 2019-2028 (USD Million)
TABLE 861 Middle East & Africa Small White Goods in Electronic Components Market, By Type, 2019-2028 (USD Million)
TABLE 862 Middle East & Africa Small White Goods in Electronic Components Market, By Electronic Components, 2019-2028 (USD Million)
TABLE 863 Middle East & Africa Small White Goods in Electronic Components market, By Material, 2019-2028 (USD Million)
TABLE 864 Middle East & Africa Metal in Electronic Components Market, By Type, 2019-2028 (USD Million)
TABLE 865 Middle East & Africa Plastic in Electronic Components Market, By Type, 2019-2028 (USD Million)
TABLE 866 Middle East & Africa Electronic Components Market, By Product Type, 2019-2028 (USD Million)
TABLE 867 MIDDLE EAST & AFRICA Electronic Components Market, By End Use Type, 2019-2028 (USD Million)
TABLE 868 ISRAEL Electronic Components Market, By Component Type, 2019-2028 (USD Million)
TABLE 869 ISRAEL Capacitors in Electronic Components Market, By Type, 2019-2028 (USD Million)
TABLE 870 ISRAEL Diodes in Electronic Components Market, By Type, 2019-2028 (USD Million)
TABLE 871 ISRAEL Power Diode in Electronic Components Market, By Type, 2019-2028 (USD Million)
TABLE 872 ISRAEL Switches in Electronic Components Market, By Type, 2019-2028 (USD Million)
TABLE 873 ISRAEL Electronic Components market, By Commodities Type, 2019-2028 (USD Million)
TABLE 874 ISRAEL Brown Goods in Electronic Components Market, By Type, 2019-2028 (USD Million)
TABLE 875 ISRAEL Brown Goods in Electronic Components Market, By Electronic Components, 2019-2028 (USD Million)
TABLE 876 ISRAEL Brown Goods in Electronic Components market, By Material, 2019-2028 (USD Million)
TABLE 877 ISRAEL Metal in Electronic Components Market, By Type, 2019-2028 (USD Million)
TABLE 878 ISRAEL Plastic in Electronic Components Market, By Type, 2019-2028 (USD Million)
TABLE 879 ISRAEL White Goods in Electronic Components Market, By Type, 2019-2028 (USD Million)
TABLE 880 ISRAEL White Goods in Electronic Components Market, By Electronic Components, 2019-2028 (USD Million)
TABLE 881 ISRAEL White Goods in Electronic Components market, By Material, 2019-2028 (USD Million)
TABLE 882 ISRAEL Metal in Electronic Components Market, By Type, 2019-2028 (USD Million)
TABLE 883 ISRAEL Plastic in Electronic Components Market, By Type, 2019-2028 (USD Million)
TABLE 884 ISRAEL Small White Goods in Electronic Components Market, By Type, 2019-2028 (USD Million)
TABLE 885 ISRAEL Small White Goods in Electronic Components Market, By Electronic Components, 2019-2028 (USD Million)
TABLE 886 ISRAEL Small White Goods in Electronic Components market, By Material, 2019-2028 (USD Million)
TABLE 887 ISRAEL Metal in Electronic Components Market, By Type, 2019-2028 (USD Million)
TABLE 888 ISRAEL Plastic in Electronic Components Market, By Type, 2019-2028 (USD Million)
TABLE 889 ISRAEL Electronic Components Market, By Product Type, 2019-2028 (USD Million)
TABLE 890 ISRAEL Electronic Components Market, By End Use Type, 2019-2028 (USD Million)
TABLE 891 U.A.E. Electronic Components Market, By Component Type, 2019-2028 (USD Million)
TABLE 892 U.A.E. Capacitors in Electronic Components Market, By Type, 2019-2028 (USD Million)
TABLE 893 U.A.E. Diodes in Electronic Components Market, By Type, 2019-2028 (USD Million)
TABLE 894 U.A.E. Power Diode in Electronic Components Market, By Type, 2019-2028 (USD Million)
TABLE 895 U.A.E. Switches in Electronic Components Market, By Type, 2019-2028 (USD Million)
TABLE 896 U.A.E. Electronic Components market, By Commodities Type, 2019-2028 (USD Million)
TABLE 897 U.A.E. Brown Goods in Electronic Components Market, By Type, 2019-2028 (USD Million)
TABLE 898 U.A.E. Brown Goods in Electronic Components Market, By Electronic Components, 2019-2028 (USD Million)
TABLE 899 U.A.E. Brown Goods in Electronic Components market, By Material, 2019-2028 (USD Million)
TABLE 900 U.A.E. Metal in Electronic Components Market, By Type, 2019-2028 (USD Million)
TABLE 901 U.A.E. Plastic in Electronic Components Market, By Type, 2019-2028 (USD Million)
TABLE 902 U.A.E. White Goods in Electronic Components Market, By Type, 2019-2028 (USD Million)
TABLE 903 U.A.E. White Goods in Electronic Components Market, By Electronic Components, 2019-2028 (USD Million)
TABLE 904 U.A.E. White Goods in Electronic Components market, By Material, 2019-2028 (USD Million)
TABLE 905 U.A.E. Metal in Electronic Components Market, By Type, 2019-2028 (USD Million)
TABLE 906 U.A.E. Plastic in Electronic Components Market, By Type, 2019-2028 (USD Million)
TABLE 907 U.A.E. Small White Goods in Electronic Components Market, By Type, 2019-2028 (USD Million)
TABLE 908 U.A.E. Small White Goods in Electronic Components Market, By Electronic Components, 2019-2028 (USD Million)
TABLE 909 U.A.E. Small White Goods in Electronic Components market, By Material, 2019-2028 (USD Million)
TABLE 910 U.A.E. Metal in Electronic Components Market, By Type, 2019-2028 (USD Million)
TABLE 911 U.A.E. Plastic in Electronic Components Market, By Type, 2019-2028 (USD Million)
TABLE 912 U.A.E. Electronic Components Market, By Product Type, 2019-2028 (USD Million)
TABLE 913 U.A.E. Electronic Components Market, By End Use Type, 2019-2028 (USD Million)
TABLE 914 SOUTH AFRICA Electronic Components Market, By Component Type, 2019-2028 (USD Million)
TABLE 915 SOUTH AFRICA Capacitors in Electronic Components Market, By Type, 2019-2028 (USD Million)
TABLE 916 SOUTH AFRICA Diodes in Electronic Components Market, By Type, 2019-2028 (USD Million)
TABLE 917 SOUTH AFRICA Power Diode in Electronic Components Market, By Type, 2019-2028 (USD Million)
TABLE 918 SOUTH AFRICA Switches in Electronic Components Market, By Type, 2019-2028 (USD Million)
TABLE 919 SOUTH AFRICA Electronic Components market, By Commodities Type, 2019-2028 (USD Million)
TABLE 920 SOUTH AFRICA Brown Goods in Electronic Components Market, By Type, 2019-2028 (USD Million)
TABLE 921 SOUTH AFRICA Brown Goods in Electronic Components Market, By Electronic Components, 2019-2028 (USD Million)
TABLE 922 SOUTH AFRICA Brown Goods in Electronic Components market, By Material, 2019-2028 (USD Million)
TABLE 923 SOUTH AFRICA Metal in Electronic Components Market, By Type, 2019-2028 (USD Million)
TABLE 924 SOUTH AFRICA Plastic in Electronic Components Market, By Type, 2019-2028 (USD Million)
TABLE 925 SOUTH AFRICA White Goods in Electronic Components Market, By Type, 2019-2028 (USD Million)
TABLE 926 SOUTH AFRICA White Goods in Electronic Components Market, By Electronic Components, 2019-2028 (USD Million)
TABLE 927 SOUTH AFRICA White Goods in Electronic Components market, By Material, 2019-2028 (USD Million)
TABLE 928 SOUTH AFRICA Metal in Electronic Components Market, By Type, 2019-2028 (USD Million)
TABLE 929 SOUTH AFRICA Plastic in Electronic Components Market, By Type, 2019-2028 (USD Million)
TABLE 930 SOUTH AFRICA Small White Goods in Electronic Components Market, By Type, 2019-2028 (USD Million)
TABLE 931 SOUTH AFRICA Small White Goods in Electronic Components Market, By Electronic Components, 2019-2028 (USD Million)
TABLE 932 SOUTH AFRICA Small White Goods in Electronic Components market, By Material, 2019-2028 (USD Million)
TABLE 933 SOUTH AFRICA Metal in Electronic Components Market, By Type, 2019-2028 (USD Million)
TABLE 934 SOUTH AFRICA Plastic in Electronic Components Market, By Type, 2019-2028 (USD Million)
TABLE 935 SOUTH AFRICA Electronic Components Market, By Product Type, 2019-2028 (USD Million)
TABLE 936 SOUTH AFRICA Electronic Components Market, By End Use Type, 2019-2028 (USD Million)
TABLE 937 SAUDI ARABIA Electronic Components Market, By Component Type, 2019-2028 (USD Million)
TABLE 938 SAUDI ARABIA Capacitors in Electronic Components Market, By Type, 2019-2028 (USD Million)
TABLE 939 SAUDI ARABIA Diodes in Electronic Components Market, By Type, 2019-2028 (USD Million)
TABLE 940 SAUDI ARABIA Power Diode in Electronic Components Market, By Type, 2019-2028 (USD Million)
TABLE 941 SAUDI ARABIA Switches in Electronic Components Market, By Type, 2019-2028 (USD Million)
TABLE 942 SAUDI ARABIA Electronic Components market, By Commodities Type, 2019-2028 (USD Million)
TABLE 943 SAUDI ARABIA Brown Goods in Electronic Components Market, By Type, 2019-2028 (USD Million)
TABLE 944 SAUDI ARABIA Brown Goods in Electronic Components Market, By Electronic Components, 2019-2028 (USD Million)
TABLE 945 SAUDI ARABIA Brown Goods in Electronic Components market, By Material, 2019-2028 (USD Million)
TABLE 946 SAUDI ARABIA Metal in Electronic Components Market, By Type, 2019-2028 (USD Million)
TABLE 947 SAUDI ARABIA Plastic in Electronic Components Market, By Type, 2019-2028 (USD Million)
TABLE 948 SAUDI ARABIA White Goods in Electronic Components Market, By Type, 2019-2028 (USD Million)
TABLE 949 SAUDI ARABIA White Goods in Electronic Components Market, By Electronic Components, 2019-2028 (USD Million)
TABLE 950 SAUDI ARABIA White Goods in Electronic Components market, By Material, 2019-2028 (USD Million)
TABLE 951 SAUDI ARABIA Metal in Electronic Components Market, By Type, 2019-2028 (USD Million)
TABLE 952 SAUDI ARABIA Plastic in Electronic Components Market, By Type, 2019-2028 (USD Million)
TABLE 953 SAUDI ARABIA Small White Goods in Electronic Components Market, By Type, 2019-2028 (USD Million)
TABLE 954 SAUDI ARABIA Small White Goods in Electronic Components Market, By Electronic Components, 2019-2028 (USD Million)
TABLE 955 SAUDI ARABIA Small White Goods in Electronic Components market, By Material, 2019-2028 (USD Million)
TABLE 956 SAUDI ARABIA Metal in Electronic Components Market, By Type, 2019-2028 (USD Million)
TABLE 957 SAUDI ARABIA Plastic in Electronic Components Market, By Type, 2019-2028 (USD Million)
TABLE 958 SAUDI ARABIA Electronic Components Market, By Product Type, 2019-2028 (USD Million)
TABLE 959 SAUDI ARABIA Electronic Components Market, By End Use Type, 2019-2028 (USD Million)
TABLE 960 EGYPT Electronic Components Market, By Component Type, 2019-2028 (USD Million)
TABLE 961 EGYPT Capacitors in Electronic Components Market, By Type, 2019-2028 (USD Million)
TABLE 962 EGYPT Diodes in Electronic Components Market, By Type, 2019-2028 (USD Million)
TABLE 963 EGYPT Power Diode in Electronic Components Market, By Type, 2019-2028 (USD Million)
TABLE 964 EGYPT Switches in Electronic Components Market, By Type, 2019-2028 (USD Million)
TABLE 965 EGYPT Electronic Components market, By Commodities Type, 2019-2028 (USD Million)
TABLE 966 EGYPT Brown Goods in Electronic Components Market, By Type, 2019-2028 (USD Million)
TABLE 967 EGYPT Brown Goods in Electronic Components Market, By Electronic Components, 2019-2028 (USD Million)
TABLE 968 EGYPT Brown Goods in Electronic Components market, By Material, 2019-2028 (USD Million)
TABLE 969 EGYPT Metal in Electronic Components Market, By Type, 2019-2028 (USD Million)
TABLE 970 EGYPT Plastic in Electronic Components Market, By Type, 2019-2028 (USD Million)
TABLE 971 EGYPT White Goods in Electronic Components Market, By Type, 2019-2028 (USD Million)
TABLE 972 EGYPT White Goods in Electronic Components Market, By Electronic Components, 2019-2028 (USD Million)
TABLE 973 EGYPT White Goods in Electronic Components market, By Material, 2019-2028 (USD Million)
TABLE 974 EGYPT Metal in Electronic Components Market, By Type, 2019-2028 (USD Million)
TABLE 975 EGYPT Plastic in Electronic Components Market, By Type, 2019-2028 (USD Million)
TABLE 976 EGYPT Small White Goods in Electronic Components Market, By Type, 2019-2028 (USD Million)
TABLE 977 EGYPT Small White Goods in Electronic Components Market, By Electronic Components, 2019-2028 (USD Million)
TABLE 978 EGYPT Small White Goods in Electronic Components market, By Material, 2019-2028 (USD Million)
TABLE 979 EGYPT Metal in Electronic Components Market, By Type, 2019-2028 (USD Million)
TABLE 980 EGYPT Plastic in Electronic Components Market, By Type, 2019-2028 (USD Million)
TABLE 981 EGYPT Electronic Components Market, By Product Type, 2019-2028 (USD Million)
TABLE 982 EGYPT Electronic Components Market, By End Use Type, 2019-2028 (USD Million)
TABLE 983 Rest of Middle East & Africa Electronic Components Market, By Component Type, 2019-2028 (USD Million)
図表一覧
FIGURE 1 Global Electronic Components Market: segmentation
FIGURE 2 Global Electronic Components Market: data triangulation
FIGURE 3 Global Electronic Components Market: DROC ANALYSIS
FIGURE 4 Global Electronic Components Market: GLOBAL VS REGIONAL MARKET ANALYSIS
FIGURE 5 Global Electronic Components Market: COMPANY RESEARCH ANALYSIS
FIGURE 6 Global Electronic Components Market: INTERVIEW DEMOGRAPHICS
FIGURE 7 Global Electronic Components Market: DBMR MARKET POSITION GRID
FIGURE 8 Global Electronic Components Market: vendor share analysis
FIGURE 9 Global Electronic Components Market: SEGMENTATION
FIGURE 10 INCREASE IN DEMAND FOR SMART ELECTRONIC DEVICES is EXPECTED TO DRIVE GLOBAL ELECTRONIC COMPONENTS MARKET IN THE FORECAST PERIOD OF 2021 TO 2028
FIGURE 11 Processors segment is expected to account for the largest share of Global Electronic Components Market in 2021 & 2028
FIGURE 12 Asia-pacific is expected to DOMINATE and is the fastest growing region in THE Global Electronic Components Market IN the forecast period of 2021 to 2028
FIGURE 13 asia-pacific is the fastest growing market for electronic components manufacturers in the forecast period of 2021 to 2028
FIGURE 14 DRIVERS, RESTRAINTS, OPPORTUNITIES, AND CHALLENGES OF GLOBAL Electronic Components market
FIGURE 15 COPPER PRICES (PER POUND) - 45 YEAR HISTORICAL CHART
FIGURE 16 Global Electronic Components market: BY Component Type, 2020
FIGURE 17 Global Electronic Components market: BY commodities type, 2020
FIGURE 18 Global Electronic Components market: BY Product Type, 2020
FIGURE 19 Global Electronic Components market: BY End Use type, 2020
FIGURE 20 GLOBAL electronic components market: SNAPSHOT (2020)
FIGURE 21 GLOBAL electronic components market: by region (2020)
FIGURE 22 GLOBAL electronic components market: by region (2021 & 2028)
FIGURE 23 GLOBAL electronic components market: by region (2020 & 2028)
FIGURE 24 GLOBAL electronic components market: by component TYPE (2021-2028)
FIGURE 25 NORTH AMERICA electronic components market: SNAPSHOT (2020)
FIGURE 26 NORTH AMERICA electronic components market: by Country (2020)
FIGURE 27 NORTH AMERICA electronic components market: by Country (2021 & 2028)
FIGURE 28 NORTH AMERICA electronic components market: by Country (2020 & 2028)
FIGURE 29 NORTH AMERICA electronic components market: by COMPONENT type (2021-2028)
FIGURE 30 EUROPE electronic component market: SNAPSHOT (2020)
FIGURE 31 EUROPE electronic component market: by Country (2020)
FIGURE 32 EUROPE electronic component market: by Country (2021 & 2028)
FIGURE 33 EUROPE electronic component market: by Country (2020 & 2028)
FIGURE 34 EUROPE electronic component market: by COMPONENT TYPE (2021-2028)
FIGURE 35 SOUTH AMERICA electronic components market: SNAPSHOT (2020)
FIGURE 36 SOUTH AMERICA electronic components market: by Country (2020)
FIGURE 37 SOUTH AMERICA electronic components market: by Country (2021 & 2028)
FIGURE 38 SOUTH AMERICA electronic components market: by Country (2020 & 2028)
FIGURE 39 SOUTH AMERICA electronic components market: by COMPONENT TYPE (2019-2028)
FIGURE 40 ASIA-PACIFIC electronic components market: SNAPSHOT (2020)
FIGURE 41 ASIA-PACIFIC electronic components market: by Country (2020)
FIGURE 42 ASIA-PACIFIC electronic components market: by Country (2021 & 2028)
FIGURE 43 ASIA-PACIFIC electronic components market: by Country (2020 & 2028)
FIGURE 44 ASIA-PACIFIC electronic components market: by COMPONENT TYPE (2021-2028)
FIGURE 45 MIDDLE EAST & AFRICA Electronic Components Market: SNAPSHOT (2020)
FIGURE 46 MIDDLE EAST & AFRICA Electronic Components Market: by Country (2020)
FIGURE 47 MIDDLE EAST & AFRICA Electronic Components Market: by Country (2021 & 2028)
FIGURE 48 MIDDLE EAST & AFRICA Electronic Components Market: by Country (2020 & 2028)
FIGURE 49 MIDDLE EAST & AFRICA Electronic Components Market: by COMPONENT TYPE (2021-2028)
FIGURE 50 global Electronic components Market: company share 2020 (%)
FIGURE 51 NORTH AMERICA Electronic components Market: company share 2020 (%)
FIGURE 52 Europe Electronic components Market: company share 2020 (%)
FIGURE 53 Asia-Pacific Electronic components Market: company share 2020 (%)
調査方法
データ収集と基準年分析は、大規模なサンプル サイズのデータ収集モジュールを使用して行われます。この段階では、さまざまなソースと戦略を通じて市場情報または関連データを取得します。過去に取得したすべてのデータを事前に調査および計画することも含まれます。また、さまざまな情報ソース間で見られる情報の不一致の調査も含まれます。市場データは、市場統計モデルと一貫性モデルを使用して分析および推定されます。また、市場シェア分析と主要トレンド分析は、市場レポートの主要な成功要因です。詳細については、アナリストへの電話をリクエストするか、お問い合わせをドロップダウンしてください。
DBMR 調査チームが使用する主要な調査方法は、データ マイニング、データ変数が市場に与える影響の分析、および一次 (業界の専門家) 検証を含むデータ三角測量です。データ モデルには、ベンダー ポジショニング グリッド、市場タイムライン分析、市場概要とガイド、企業ポジショニング グリッド、特許分析、価格分析、企業市場シェア分析、測定基準、グローバルと地域、ベンダー シェア分析が含まれます。調査方法について詳しくは、お問い合わせフォームから当社の業界専門家にご相談ください。
カスタマイズ可能
Data Bridge Market Research は、高度な形成的調査のリーダーです。当社は、既存および新規のお客様に、お客様の目標に合致し、それに適したデータと分析を提供することに誇りを持っています。レポートは、対象ブランドの価格動向分析、追加国の市場理解 (国のリストをお問い合わせください)、臨床試験結果データ、文献レビュー、リファービッシュ市場および製品ベース分析を含めるようにカスタマイズできます。対象競合他社の市場分析は、技術ベースの分析から市場ポートフォリオ戦略まで分析できます。必要な競合他社のデータを、必要な形式とデータ スタイルでいくつでも追加できます。当社のアナリスト チームは、粗い生の Excel ファイル ピボット テーブル (ファクト ブック) でデータを提供したり、レポートで利用可能なデータ セットからプレゼンテーションを作成するお手伝いをしたりすることもできます。

