世界のダイエット・栄養アプリ市場 - 2031年までの業界動向と予測

Request for TOC TOC のリクエスト Speak to Analyst アナリストに相談する Buy Now今すぐ購入 Inquire Before Buying 事前に問い合わせる Free Sample Report 無料サンプルレポート

世界のダイエット・栄養アプリ市場 - 2031年までの業界動向と予測

  • Semiconductors and Electronics
  • Upcoming Report
  • Mar 2024
  • Global
  • 350 ページ
  • テーブル数: 220
  • 図の数: 60

世界のダイエット・栄養アプリ市場

Market Size in USD Billion

CAGR :  % Diagram

Diagram 予測期間
2024 –2031
Diagram 市場規模(基準年)
USD 9,655.78 Million
Diagram Market Size (Forecast Year)
USD 35,346.09 Million
Diagram CAGR
%
Diagram 主要市場プレーヤー
  • Dummy1
  • Dummy2
  • Dummy3
  • Dummy4
  • Dummy5

>世界のダイエットおよび栄養アプリ市場、タイプ別(栄養追跡アプリ、活動追跡アプリ、ソーシャル プラットフォーム アプリ、賭けアプリなど)、製品別(スマートフォン、ウェアラブル デバイス、タブレット)、性別別(女性と男性)、年齢別(成人、ティーンエイジャー、高齢者)、プラットフォーム別(Android、IOS、Windows など)、エンド ユーザー別(フィットネス センター、ヘルスケア業界、在宅ケア環境など) - 2031 年までの業界動向と予測。

ダイエットと栄養アプリの市場分析と規模

ダイエットや栄養に関するアプリは、多くの場合、個人の好み、食事制限、健康目標に基づいて、パーソナライズされた食事プランを提供します。これらのアプリは、ユーザーの毎日の食事摂取量を追跡し、栄養に関する洞察を提供し、場合によってはアルゴリズムを使用して最適な食事の選択肢を提案し、健康的な食生活を維持するためのより情報に基づいたカスタマイズされたアプローチを促進します。

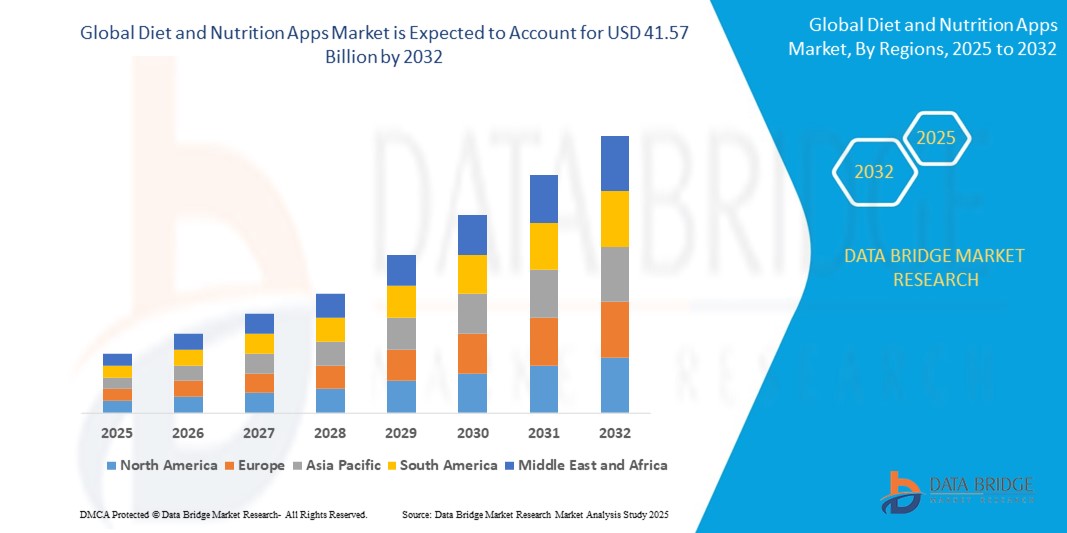
Data Bridge Market Researchは、2023年に96億5,578万米ドルだった世界のダイエットおよび栄養アプリ市場を分析しています。この市場は2031年までに353億4,609万米ドルに達し、2024年から2031年の予測期間中に17.61%のCAGRを達成すると予想されています。市場価値、成長率、セグメンテーション、地理的範囲、主要プレーヤーなどの市場シナリオに関する洞察に加えて、Data Bridge Market Researchがまとめた市場レポートには、詳細な専門家分析、地理的に表された企業別の生産と生産能力、販売業者とパートナーのネットワークレイアウト、詳細で最新の価格動向分析、サプライチェーンと需要の不足分析も含まれています。

レポートの範囲と市場セグメンテーション      

レポートメトリック

詳細

予測期間

2024年から2031年

基準年

2023

歴史的な年

2022 (2016~2021年にカスタマイズ可能)

定量単位

売上高(百万米ドル)、販売数量(個数)、価格(米ドル)

対象セグメント

タイプ (栄養追跡アプリ、活動追跡アプリ、ソーシャル プラットフォーム アプリ、食事計画アプリ、カロリー計算アプリ、体重増加/減少追跡アプリ)、製品 (スマートフォン、ウェアラブル デバイス、タブレット)、性別 (女性、男性)、年齢 (成人、ティーンエイジャー、高齢者)、プラットフォーム (Android、IOS、Windows、その他)、エンド ユーザー (フィットネス センター、ヘルスケア業界、在宅ケア設定、その他)

対象国

米国、カナダ、メキシコ、ブラジル、アルゼンチン、その他の南米諸国、ドイツ、イタリア、英国、フランス、スペイン、オランダ、ベルギー、スイス、トルコ、ロシア、その他のヨーロッパ諸国、日本、中国、インド、韓国、オーストラリア、シンガポール、マレーシア、タイ、インドネシア、フィリピン、その他のアジア太平洋諸国、サウジアラビア、UAE、南アフリカ、エジプト、イスラエル、その他の中東およびアフリカ諸国

対象となる市場プレーヤー

Azumio Inc. (米国)、MyFitnessPal, Inc. (米国)、Noom, Inc. (米国)、Lifesum Ab (スウェーデン)、FitNow, Inc. (米国)、MyNetDiary Inc. (米国)、Innit International SCA (米国)、The Kroger Co. (米国)、mySugr GmbH (ドイツ)、FatSecret (オーストラリア)、HappyCow, Inc. (米国)、HealthifyMe Wellness Private Limited (インド)、Fitocracy, Inc. (米国)、Wombat Apps LLC(米国)、Cronometer Software Inc. (カナダ)、CareClinic (カナダ)、Syndigo LLC (米国)、foodvisor.io (フランス)、Eat This Much Inc. (米国)、Asken Inc. (米国)、Leaf Group Ltd. (米国)、Avatar Nutrition LLC (米国)

市場機会

  • パーソナライズされた栄養ソリューション
  • ウェアラブルデバイスとヘルストラッカーの統合
  • 医療提供者とのパートナーシップ

市場の定義

ダイエットと栄養のアプリは、個人の食生活と栄養習慣の管理を支援するために設計されています。これらのアプリは通常、食事の追跡、カロリー計算、栄養分析などの機能を備えています。健康とウェルネスへの関心が高まる中、ユーザーはこれらのアプリを利用して、食事の摂取量を監視したり、フィットネスの目標を設定したり、栄養に関する情報に基づいた決定を下したりしています。

世界のダイエット・栄養アプリ市場の動向

ドライバー

  • 健康とウェルネスへの意識の高まり

健康的なライフスタイルの重要性を人々がより意識するようになり、より良い食事の選択を促進するツールの需要が高まっています。ダイエットや栄養に関するアプリは、ユーザーにパーソナライズされた洞察、食事の追跡機能、健康関連情報を提供することで、このニーズに応えています。栄養が健康に与える影響に対する認識は、人々が積極的に食事管理を支援するデジタルソリューションを探して採用する動機となり、これらのアプリの市場を活性化させています。

  • デジタル化の進展

デジタル化により、健康志向の消費者にとってアクセスしやすくパーソナライズされたソリューションが提供され、世界のダイエットおよび栄養アプリ市場が拡大しています。スマートフォンやスマート デバイスの普及により、ダイエットおよび栄養アプリが広く採用されるようになり、ユーザーは食習慣を追跡し、フィットネス目標を設定し、リアルタイムのガイダンスを受けることができます。デジタル プラットフォームと健康モニタリング デバイスがシームレスに統合されることで、ユーザー エンゲージメントが強化され、データに基づく健康へのアプローチが促進されます。デジタル ソリューションの進化により、人々がダイエットや栄養を管理する方法が変わり、市場の上昇軌道が推進されています。

機会

  • 企業向けウェルネスプログラム

企業のウェルネス プログラムは、企業内の従業員の健康と幸福を高めることを目的としています。これらの取り組みには、フィットネス プログラム、ストレス管理、メンタル ヘルス サポート、栄養教育などが含まれることがよくあります。世界のダイエットおよび栄養アプリ市場では、企業のウェルネス プログラムをデジタル プラットフォームと統合することでチャンスが生まれます。この相乗効果により、栄養指導、フィットネス追跡、従業員の幸福に対する総合的なアプローチが可能になります。健康的なライフスタイルを促進し、より生産的で積極的な従業員を育成する便利でアクセスしやすいソリューションに対する高まる需要に応えることが、市場の潜在性です。

  • 医療提供者とのパートナーシップ

ヘルスケア プロバイダーとのパートナーシップは、世界のダイエットおよび栄養アプリ市場にとって大きなチャンスとなります。ヘルスケア機関と連携することで、アプリは医療の専門知識とデータを統合し、栄養に関する推奨事項の信頼性と正確性を高めることができます。このようなパートナーシップにより、ユーザーの信頼が高まり、食事指導と専門的な医療の洞察を組み合わせることで、健康管理に対するより総合的なアプローチが促進され、ダイエットおよび栄養アプリは包括的なヘルスケア戦略における貴重なツールとして位置付けられます。

制約/課題

  • ダイエットや栄養アプリの使用に関する消費者のプライバシーへの懸念が高まる

プライバシーに関する懸念は、世界のダイエットおよび栄養アプリ市場において大きな制約となっています。ユーザーは、食事の好みや健康状態などの機密性の高い個人データを共有することが多く、そうした情報のセキュリティと機密性に対する懸念が生じています。データ漏洩や不正アクセスが発生すると、ユーザーの信頼が損なわれ、広範な導入が妨げられる可能性があります。個人データの誤用や誤った取り扱いの可能性は、ユーザーエンゲージメントの大きな障壁となります。なぜなら、個人が、パーソナライズされたダイエットや栄養の推奨に不可欠な機密情報を開示することを躊躇する可能性があるからです。

  • 食習慣における社会文化的差異

世界のダイエットおよび栄養アプリ市場は、食習慣の社会文化的多様性により、大きな課題に直面しています。これらのアプリは多様な文化的嗜好に十分に対応できない可能性があるため、その有効性が妨げられ、さまざまな地域での関連性と適用性が制限されます。この課題は、食事の選択が文化的要因に大きく影響され、アプリが必ずしもこれらの多様性に一致または対応しない可能性があるという事実から生じます。その結果、異なる文化的背景を持つユーザーは、コンテンツや推奨事項が特定のニーズにあまり適合していないと感じる可能性があり、世界規模でダイエットおよび栄養アプリの有効性と採用が減少します。

この世界的なダイエットおよび栄養アプリ市場レポートでは、最近の新しい開発、貿易規制、輸出入分析、生産分析、バリュー チェーンの最適化、市場シェア、国内および現地の市場プレーヤーの影響、新たな収益源の観点から見た機会の分析、市場規制の変更、戦略的市場成長分析、市場規模、カテゴリ市場の成長、アプリケーションのニッチと優位性、製品の承認、製品の発売、地理的拡大、市場における技術革新などの詳細が提供されます。世界的なダイエットおよび栄養アプリ市場に関する詳細情報を取得するには、データ ブリッジ マーケット リサーチにアナリストの概要をお問い合わせください。当社のチームが、市場の成長を達成するための情報に基づいた市場決定を行うお手伝いをします。

原材料不足と出荷遅延の影響と現在の市場シナリオ

Data Bridge Market Research は、市場の高水準な分析を提供し、原材料不足や出荷遅延の影響と現在の市場環境を考慮した情報を提供します。これは、戦略的な可能性を評価し、効果的な行動計画を作成し、企業が重要な決定を下すのを支援することにつながります。

標準レポートの他に、予測される出荷遅延からの調達レベルの詳細な分析、地域別の販売代理店マッピング、商品分析、生産分析、価格マッピングの傾向、調達、カテゴリパフォーマンス分析、サプライチェーンリスク管理ソリューション、高度なベンチマーク、その他の調達および戦略サポートサービスも提供しています。

経済減速が製品の価格と入手可能性に及ぼす予想される影響

経済活動が減速すると、業界は打撃を受け始めます。DBMR が提供する市場洞察レポートとインテリジェンス サービスでは、景気後退が製品の価格設定と入手しやすさに及ぼす予測される影響が考慮されています。これにより、当社のクライアントは通常、競合他社より一歩先を行き、売上と収益を予測し、損益支出を見積もることができます。

最近の動向

  • 2023年10月、インドの子会社であるHealthifyMe Wellness Pvt Ltdは、規制当局への提出書類によると、単独の営業収益が22億8,700万インドルピーに達したことを明らかにした。これは、前年度18億5,000万インドルピーから大幅に増加した。この顕著な成長は、栄養とウェルネスコーチングサービスの25%増加によって推進され、前年度11億1,600万インドルピーから13億9,000万インドルピーに増加した。
  • 2023年10月、Noomは臨床的肥満管理ソリューションであるNoom Medを導入し、雇用主向けサービスを拡大しました。ラスベガスのHLTH 2023で発表されたNoom Medは、減量の過程で追加の臨床サポートを求める個人向けにカスタマイズされています。このプログラムは、GLP-1を含む臨床医や医薬品へのアクセスを提供し、Noomのデジタル減量サポートプラットフォームを強化します。
  • 2021年7月、行動変容に特化した著名なデジタルヘルスプラットフォームであるNoomと、2,000万人の糖尿病患者を抱える血糖値モニタリングの世界的リーダーであるLifeScanは、包括的なパートナーシップの拡大を発表しました。このコラボレーションは、心理学に基づいた記事、血糖値追跡などの教育ツールなどを備えたNoomの糖尿病サポートプログラムを通じて、糖尿病患者を支援することを目的としています。LifeScanとNoomは協力して、持続的なライフスタイルの変化に必要な知識とリソースの提供に努めています。
  • 2021年4月、アディダス・ランタスティックはトゥーズ・テクノロジーズと提携し、スポーツ用スマートグラスを使用するアスリート向けの没入型ランニング体験の先駆けとなりました。この提携は、スポーツとフィットネスの分野で革新的な開発を約束する次世代ウェアラブル技術の研究の開始を示しました。

世界のダイエット・栄養アプリ市場の範囲

世界のダイエットおよび栄養アプリ市場は、タイプ、製品、性別、年齢、プラットフォーム、エンドユーザーに基づいてセグメント化されています。これらのセグメントの成長は、業界のわずかな成長セグメントの分析に役立ち、ユーザーに貴重な市場の概要と市場の洞察を提供し、コア市場アプリケーションを特定するための戦略的決定を下すのに役立ちます。

タイプ

  • 栄養追跡アプリ
  • アクティビティ追跡アプリ
  • ソーシャルプラットフォームアプリ
  • 食事計画アプリ
  • カロリー計算アプリ
  • 体重増加/減少を追跡するアプリ
  • 賭けアプリ
  • その他

製品

  • スマートフォン
  • ウェアラブルデバイス
  •  タブレット

性別

  • 女性
  • 男性

  • 大人
  • ティーンエイジャー
  • 熟成

プラットフォーム

  • アンドロイド
  • iOS版
  • ウィンドウズ
  • その他

エンドユーザー

  • フィットネスセンター
  • ヘルスケア産業
  • ホームケア設定
  • その他

世界のダイエットおよび栄養アプリ市場の地域分析/洞察

世界のダイエットおよび栄養アプリ市場が分析され、上記のようにタイプ、製品、性別、年齢、プラットフォーム、エンドユーザー別に市場規模の洞察と傾向が提供されます。

世界のダイエットおよび栄養アプリ市場レポートで取り上げられている国は、北米では米国、カナダ、メキシコ、ヨーロッパではドイツ、フランス、英国、オランダ、スイス、ベルギー、ロシア、イタリア、スペイン、トルコ、その他のヨーロッパ諸国、アジア太平洋地域 (APAC) では中国、日本、インド、韓国、シンガポール、マレーシア、オーストラリア、タイ、インドネシア、フィリピン、その他のアジア太平洋地域 (APAC)、中東およびアフリカ (MEA) の一部としてサウジアラビア、UAE、南アフリカ、エジプト、イスラエル、その他の中東およびアフリカ (MEA)、南米の一部としてブラジル、アルゼンチン、その他の南米です。

北米は、主要な業界プレーヤーの強力な存在とスマートフォンの普及により、ダイエットおよび栄養アプリ市場を支配すると予想されています。この地域のスマートフォン使用率の高さは、ダイエットおよび栄養アプリにアクセスするための主要なプラットフォームとして機能します。さらに、食習慣と栄養成分に関する人々の意識と関心の高まりも、北米での市場支配にさらに貢献しています。

アジア太平洋地域では、健康志向の人口増加、スマートフォンの普及率の拡大、パーソナライズされた栄養に対する意識の高まりにより、ダイエットおよび栄養アプリ市場が急成長すると予想されています。食生活の好みや健康を管理するためのデジタルソリューションを積極的に取り入れる人口の増加が、この地域のダイナミックな市場拡大を推進しています。

レポートの国別セクションでは、市場の現在および将来の動向に影響を与える国内市場における個別の市場影響要因と規制の変更も提供しています。下流および上流のバリュー チェーン分析、技術動向、ポーターの 5 つの力の分析、ケース スタディなどのデータ ポイントは、各国の市場シナリオを予測するために使用される指標の一部です。また、国別データの予測分析を提供する際には、グローバル ブランドの存在と可用性、および地元および国内ブランドとの競争が激しいか少ないために直面​​する課題、国内関税と貿易ルートの影響も考慮されます。

競争環境と世界のダイエット・栄養アプリ市場シェア分析

世界のダイエットおよび栄養アプリ市場の競争状況は、競合他社ごとに詳細を提供します。含まれる詳細には、会社概要、会社の財務状況、生み出される収益、市場の可能性、研究開発への投資、新しい市場への取り組み、地域的プレゼンス、会社の強みと弱み、製品の発売、製品の幅と広さ、アプリケーションの優位性などがあります。提供されている上記のデータ ポイントは、世界のダイエットおよび栄養アプリ市場に関連する企業の焦点にのみ関連しています。

世界のダイエットおよび栄養アプリ市場で活動している主要企業は次のとおりです。

  • Azumio Inc.(米国)
  • MyFitnessPal, Inc.(米国)
  • Noom, Inc.(米国)
  • ライフサムアブ(スウェーデン)
  • FitNow, Inc.(米国)
  • MyNetDiary Inc. (米国)
  • イニットインターナショナルSCA(米国)
  • クローガー社(米国)
  • mySugr GmbH (オーストリア)
  • FatSecret (オーストラリア)
  • HappyCowの健康的な食事ガイド(米国)
  • HealthifyMe Wellness Private Limited (インド)
  • フィトクラシー(米国)
  • ウォンバット アプリ LLC (米国)
  • Cronometer Software Inc. (カナダ)
  • シンディゴLLC(米国)
  • foodvisor.io (フランス)
  • Eat This Much Inc. (米国)
  • アスクン株式会社(米国)
  • リーフグループ株式会社(米国)
  • アバターニュートリションLLC(米国)


SKU-

世界初のマーケットインテリジェンスクラウドに関するレポートにオンラインでアクセスする

  • インタラクティブなデータ分析ダッシュボード
  • 成長の可能性が高い機会のための企業分析ダッシュボード
  • カスタマイズとクエリのためのリサーチアナリストアクセス
  • インタラクティブなダッシュボードによる競合分析
  • 最新ニュース、更新情報、トレンド分析
  • 包括的な競合追跡のためのベンチマーク分析のパワーを活用
デモのリクエスト

目次

  1. INTRODUCTION
    1. OBJECTIVES OF THE STUDY
    2. MARKET DEFINITION
    3. OVERVIEW OF GLOBAL DIET AND NUTRITION APPS MARKET
    4. CURRENCY AND PRICING
    5. LIMITATIONS
    6. MARKETS COVERED
  2. MARKET SEGMENTATION
    1. MARKETS COVERED
    2. GEOGRAPHICAL SCOPE
    3. YEARS CONSIDERED FOR THE STUDY
    4. DBMR TRIPOD DATA VALIDATION MODEL
    5. PRIMARY INTERVIEWS WITH KEY OPINION LEADERS
    6. DBMR MARKET POSITION GRID
    7. VENDOR SHARE ANALYSIS
    8. MULTIVARIATE MODELING
    9. TYPE TIMELINE CURVE
    10. SECONDARY SOURCES
    11. ASSUMPTIONS
  3. EXECUTIVE SUMMARY
  4. PREMIUM INSIGHTS
    1. APPS FEATURE BASED ON THE SPECIFIC REQUIREMENTS
    2. INFORMATION ON SCORING/RATING
    3. NUTRIENT INFORMATION GUIDE:
    4. REASON WHY SOME OF THE FOOD ITEMS ARE NOT RATED:
    5. REASON WHY SAME TYPE OF FOOD CAN GET DIFFERENT RATINGS:
    6. REASONS FOR RATING THE FOOD:
    7. NUTRIENT PROFILING SCHEMES
    8. APPS PROVIDING PRODUCT NUTRITION RATING/SCORING
  5. MARKET OVERVIEW
    1. DRIVERS
      1. INCREASING PENETRATION OF DIGITAL DEVICES AND THE INTERNET
      2. GROWING AWARENESS REGARDING HEALTH AND WELLNESS
      3. SCIENTIFIC ADVANCES IN NUTRITION
      4. INCREASING NUMBER OF LIFESTYLE-RELATED DISEASES
      5. GOVERNMENT ENCOURAGEMENT FOR HEALTHY LIFESTYLES THROUGH REGULATORY LAWS
    2. RESTRAINTS
      1. NUTRIENT CODING INCONSISTENCY AS COMPARED TO THE STANDARD REFERENCE DATABASES
      2. DATA COMPLIANCES BY REGIONAL GOVERNMENT ORGANIZATION RESTRICTS AND MAKES CROSS BORDER DATA TRANSFER COSTLY
    3. OPPORTUNITIES
      1. APPLICATION OF AI AND ML TECHNOLOGIES TO PROVIDE PERSONALISED DIET PLANS
      2. INCREASING USE OF SMARTPHONE APPS DUE TO SURGE IN INDIVIDUALS WITH HIGHER PERSONAL INNOVATIVENESS
      3. INCREASING FOCUS OF WORKING CLASS ON PROACTIVE HEALTH MONITORING
      4. INTEGRATION OF APPS WITH FITNESS DEVICES FOR CONTINUOUS TRACKING OF HEALTH
    4. CHALLENGES
      1. DATA SECURITY ISSUES IN HEALTH AND FITNESS APPS
      2. LACK OF AWARENESS REGARDING SPECIFIC FUNCTIONALITIES AND CAPABILITIES OF NUTRITION APPS
      3. LACK OF KNOWLEDGE REGARDING THE TECHNICAL FEATURES AND PERSONALIZATION IN AN APP LEADING TO SUBSEQUENT DISENGAGEMENT
  6. COVID-19 IMPACT ON GLOBAL DIET AND NUTRITION APPS MARKET
    1. ANALYSIS ON IMPACT OF COVID-19 ON THE MARKET
    2. AFTERMATH OF COVID-19 AND GOVERNMENT INITIATIVE TO BOOST THE MARKET
    3. STRATEGIC DECISIONS FOR MANUFACTURERS AFTER COVID-19 TO GAIN COMPETITIVE MARKET SHARE
    4. IMPACT ON DEMAND
    5. IMPACT ON SUPPLY CHAIN
    6. PRICE IMPACT
    7. CONCLUSION
  7. GLOBAL DIET AND NUTRITION APPS MARKET, BY TYPE
    1. OVERVIEW
    2. NUTRITION TRACKING APP
      1. CALORIE COUNTING AND DETOX
      2. MEAL DATA AND HEALTHY RECIPES
      3. DIET TIPS
      4. WEIGHT LOSS AND GAIN DIARIES
    3. ACTIVITY TRACKING APP
      1. FOOD TRACKER
      2. WATER TRACKER
      3. OTHERS
    4. SOCIAL PLATFORM APPS
    5. WAGER APPS
    6. OTHERS
  8. GLOBAL DIET AND NUTRITION APPS MARKET, BY PRODUCTS
    1. OVERVIEW
    2. SMARTPHONES
    3. WEARABLE DEVICES
      1. WRIST BANDS
      2. SMARTWATCH
    4. TABLETS
  9. GLOBAL DIET AND NUTRITION APPS MARKET, BY GENDER
    1. OVERVIEW
    2. WOMEN
    3. MEN
  10. GLOBAL DIET AND NUTRITION APPS MARKET, BY AGE
    1. OVERVIEW
    2. ADULTS
    3. TEENAGERS
    4. AGED
  11. GLOBAL DIET AND NUTRITION APPS MARKET, BY PLATFORM
    1. OVERVIEW
    2. ANDROID
    3. IOS
    4. WINDOWS
    5. OTHERS
  12. GLOBAL DIET AND NUTRITION APPS MARKET, BY END USER
    1. OVERVIEW
    2. FITNESS CENTERS
      1. GYM
      2. FITNESS STUDIOS
      3. HEALTH CLUBS
      4. OTHERS
    3. HEALTHCARE INDUSTRIES
      1. HOSPITALS
        1. GENERAL HOSPITAL
        2. PHYSICIAN REFERRAL
        3. WAYFINDING
        4. OTHERS
      2. CLINICS
      3. OTHERS
    4. HOMECARE SETTINGS
    5. OTHERS
  13. GLOBAL DIET AND NUTRITION APPS MARKET, BY REGION
    1. OVERVIEW
    2. NORTH AMERICA
      1. U.S.
      2. CANADA
      3. MEXICO
    3. EUROPE
      1. GERMANY
      2. U.K.
      3. ITALY
      4. SPAIN
      5. FRANCE
      6. NETHERLANDS
      7. SWITZERLAND
      8. RUSSIA
      9. TURKEY
      10. BELGIUM
      11. REST OF EUROPE
    4. ASIA-PACIFIC
      1. CHINA
      2. INDIA
      3. JAPAN
      4. SOUTH KOREA
      5. AUSTRALIA
      6. INDONESIA
      7. THAILAND
      8. PHILIPPINES
      9. MALAYSIA
      10. SINGAPORE
      11. REST OF ASIA-PACIFIC
    5. MIDDLE EAST AND AFRICA
      1. U.A.E.
      2. SAUDI ARABIA
      3. SOUTH AFRICA
      4. EGYPT
      5. ISRAEL
      6. REST OF MIDDLE EAST AND AFRICA
    6. SOUTH AMERICA
      1. BRAZIL
      2. ARGENTINA
      3. REST OF SOUTH AMERICA
  14. GLOBAL DIET AND NUTRITION APPS MARKET: COMPANY LANDSCAPE
    1. COMPANY SHARE ANALYSIS: GLOBAL
    2. COMPANY SHARE ANALYSIS: NORTH AMERICA
    3. COMPANY SHARE ANALYSIS: EUROPE
    4. COMPANY SHARE ANALYSIS: ASIA-PACIFIC
  15. SWOT ANALYSIS
  16. COMPANY PROFILE
    1. NOOM, INC.
      1. COMPANY SNAPSHOT
      2. COMPANY SHARE ANALYSIS
      3. PRODUCT PORTFOLIO
      4. RECENT DEVELOPMENT
    2. THE KROGER CO.
      1. COMPANY SNAPSHOT
      2. REVENUE ANALYSIS
      3. COMPANY SHARE ANALYSIS
      4. PRODUCT PORTFOLIO
      5. RECENT DEVELOPMENT
    3. MYFITNESSPAL, INC.
      1. COMPANY SNAPSHOT
      2. COMPANY SHARE ANALYSIS
      3. PRODUCT PORTFOLIO
      4. RECENT DEVELOPMENTS
    4. LEAF GROUP LTD.
      1. COMPANY SNAPSHOT
      2. COMPANY SHARE ANALYSIS
      3. PRODUCT PORTFOLIO
      4. RECENT DEVELOPMENTS
    5. LIFESUM AB
      1. COMPANY SNAPSHOT
      2. COMPANY SHARE ANALYSIS
      3. PRODUCT PORTFOLIO
      4. RECENT DEVELOPMENTS
    6. ASKEN INC.
      1. COMPANY SNAPSHOT
      2. PRODUCT PORTFOLIO
      3. RECENT DEVELOPMENTS
    7. AVATAR NUTRITION LLC.
      1. COMPANY SNAPSHOT
      2. PRODUCT PORTFOLIO
      3. RECENT DEVELOPMENT
    8. AZUMIO INC.
      1. COMPANY SNAPSHOT
      2. PRODUCT PORTFOLIO
      3. RECENT DEVELOPMENTS
    9. CARECLINIC
      1. COMPANY SNAPSHOT
      2. PRODUCT PORTFOLIO
      3. RECENT DEVELOPMENT
    10. CRONOMETER SOFTWARE INC.
      1. COMPANY SNAPSHOT
      2. PRODUCT PORTFOLIO
      3. RECENT DEVELOPMENTS
    11. EAT THIS MUCH INC.
      1. COMPANY SNAPSHOT
      2. PRODUCT PORTFOLIO
      3. RECENT DEVELOPMENT
    12. FATSECRET
      1. COMPANY SNAPSHOT
      2. PRODUCT PORTFOLIO
      3. RECENT DEVELOPMENTS
    13. FITNOW, INC
      1. COMPANY SNAPSHOT
      2. PRODUCT PORTFOLIO
      3. RECENT DEVELOPMENTS
    14. FITOCRACY, INC.
      1. COMPANY SNAPSHOT
      2. PRODUCT PORTFOLIO
      3. RECENT DEVELOPMENTS
    15. FOODVISOR.IO
      1. COMPANY SNAPSHOT
      2. PRODUCT PORTFOLIO
      3. RECENT DEVELOPMENTS
    16. HAPPYCOW, INC.
      1. COMPANY SNAPSHOT
      2. PRODUCT PORTFOLIO
      3. RECENT DEVELOPMENT
    17. HEALTHIFYME WELLNESS PRIVATE LIMITED
      1. COMPANY SNAPSHOT
      2. PRODUCT PORTFOLIO
      3. RECENT DEVELOPMENTS
    18. INNIT INTERNATIONAL SCA
      1. COMPANY SNAPSHOT
      2. PRODUCT PORTFOLIO
      3. RECENT DEVELOPMENTS
    19. MYNETDIARY INC.
      1. COMPANY SNAPSHOT
      2. PRODUCT PORTFOLIO
      3. RECENT DEVELOPMENTS
    20. MYSUGR GMBH
      1. COMPANY SNAPSHOT
      2. PRODUCT PORTFOLIO
      3. RECENT DEVELOPMENTS
    21. NUTRITIONIX (A SYNDIGO LLC COMPANY)
      1. COMPANY SNAPSHOT
      2. PRODUCT PORTFOLIO
      3. RECENT DEVELOPMENT
    22. WOMBAT APPS LLC
      1. COMPANY SNAPSHOT
      2. PRODUCT PORTFOLIO
      3. RECENT DEVELOPMENT
  17. QUESTIONNAIRE
  18. RELATED REPORTS

表のリスト

TABLE 1 Global diet and nutrition apps Market, By type, 2019-2028 (USD MILLION)

TABLE 2 Global Nutrition Tracking App in Diet and Nutrition Apps Market, By Region, 2019-2028 (USD Million)

TABLE 3 Global Nutrition Tracking App in Diet and Nutrition Apps Market, By Type, 2019-2028 (USD Million)

TABLE 4 Global Activity Tracking App in Diet and Nutrition Apps Market, By Region, 2019-2028(USD Million)

TABLE 5 Global Activity Tracking App in Diet and Nutrition Apps Market, By Type, 2019-2028 (USD Million)

TABLE 6 Global Social Platform Apps in Diet and Nutrition Apps Market, By Region, 2019-2028 (USD Million)

TABLE 7 Global Wager Apps in Diet and Nutrition Apps Market, By Region, 2019-2028 (USD Million)

TABLE 8 Global Others in Diet and Nutrition Apps Market, By Region, 2019-2028(USD Million)

TABLE 9 Global Diet and Nutrition Apps Market, By Products, 2019-2028 (USD Million)

TABLE 10 Global Smartphones in Diet and Nutrition Apps Market, By Region, 2019-2028 (USD Million)

TABLE 11 Global Wearable Devices in Diet and Nutrition Apps Market, By Region, 2019-2028(USD Million)

TABLE 12 Global Wearable Devices in Diet and Nutrition Apps Market, By Type, 2019-2028 (USD Million)

TABLE 13 Global Tablets in Diet and Nutrition Apps Market, By Region, 2019-2028 (USD Million)

TABLE 14 Global Diet and Nutrition Apps Market, By Gender, 2019-2028 (USD Million)

TABLE 15 Global Women in Diet and Nutrition Apps Market, By Region, 2019-2028 (USD Million)

TABLE 16 Global Men in Diet and Nutrition Apps Market, By Region, 2019-2028 (USD Million)

TABLE 17 Global Diet and Nutrition Apps Market, By Age, 2019-2028 (USD Million)

TABLE 18 Global Adults in Diet and Nutrition Apps Market, By Region, 2019-2028(USD Million)

TABLE 19 Global Teenagers in Diet and Nutrition Apps Market, By Region, 2019-2028 (USD Million)

TABLE 20 Global Aged in Diet and Nutrition Apps Market, By Region, 2019-2028 (USD Million)

TABLE 21 Global Diet and Nutrition Apps Market, By Platform, 2019-2028 (USD Million)

TABLE 22 Global Android in Diet and Nutrition Apps Market, By Region, 2019-2028 (USD Million)

TABLE 23 Global IOS in Diet and Nutrition Apps Market, By Region, 2019-2028 (USD Million)

TABLE 24 Global Windows in Diet and Nutrition Apps Market, By Region, 2019-2028 (USD Million)

TABLE 25 Global Others in Diet and Nutrition Apps Market, By Region, 2019-2028 (USD Million)

TABLE 26 Global Diet and Nutrition Apps Market, By End User, 2019-2028 (USD Million)

TABLE 27 Global Fitness Centers in Diet and Nutrition Apps Market, By Region, 2019-2028 (USD Million)

TABLE 28 Global Fitness Centers in Diet and Nutrition Apps Market, By Type, 2019-2028 (USD Million)

TABLE 29 Global Healthcare Industries in Diet and Nutrition Apps Market, By Region, 2019-2028 (USD Million)

TABLE 30 Global Healthcare Industries in Diet and Nutrition Apps Market, By Type, 2019-2028 (USD Million)

TABLE 31 Global Hospitals in Diet and Nutrition Apps Market, By Type, 2019-2028 (USD Million)

TABLE 32 Global Homecare Settings in Diet and Nutrition Apps Market, By Region, 2019-2028 (USD Million)

TABLE 33 Global Others in Diet and Nutrition Apps Market, By Region, 2019-2028 (USD Million)

TABLE 34 Global diet and nutrition apps market, By rEGION, 2019-2028 (USD Million)

TABLE 35 NORTH AMERICA DIET AND NUTRITION APPS Market, By Country, 2019-2028 (USD Million)

TABLE 36 North America Diet and Nutrition Apps Market, By Type, 2019-2028 (USD Million)

TABLE 37 North America Nutrition Tracking App in Diet and Nutrition Apps Market, By Type, 2019-2028 (USD Million)

TABLE 38 North America Activity Tracking App in Diet and Nutrition Apps Market, By Type, 2019-2028 (USD Million)

TABLE 39 North America Diet and Nutrition Apps Market, By Products, 2019-2028 (USD Million)

TABLE 40 North America Wearable Devices in Diet and Nutrition Apps Market, By Type, 2019-2028 (USD Million)

TABLE 41 North America Diet and Nutrition Apps Market, By Gender, 2019-2028 (USD Million)

TABLE 42 North America Diet and Nutrition Apps Market, By Age, 2019-2028 (USD Million)

TABLE 43 North America Diet and Nutrition Apps Market, By Platform, 2019-2028 (USD Million)

TABLE 44 North America Diet and Nutrition Apps Market, By End User, 2019-2028 (USD Million)

TABLE 45 North America Fitness Centers in Diet and Nutrition Apps Market, By Type, 2019-2028 (USD Million)

TABLE 46 North America Healthcare Industries in Diet and Nutrition Apps Market, By Type, 2019-2028 (USD Million)

TABLE 47 North America Hospitals in Diet and Nutrition Apps Market, By Type, 2019-2028 (USD Million)

TABLE 48 U.S. Diet and Nutrition Apps Market, By Type, 2019-2028 (USD Million)

TABLE 49 U.S. Nutrition Tracking App in Diet and Nutrition Apps Market, By Type, 2019-2028 (USD Million)

TABLE 50 U.S. Activity Tracking App in Diet and Nutrition Apps Market, By Type, 2019-2028 (USD Million)

TABLE 51 U.S. Diet and Nutrition Apps Market, By Products, 2019-2028 (USD Million)

TABLE 52 U.S. Wearable Devices in Diet and Nutrition Apps Market, By Type, 2019-2028 (USD Million)

TABLE 53 U.S. Diet and Nutrition Apps Market, By Gender, 2019-2028 (USD Million)

TABLE 54 U.S. Diet and Nutrition Apps Market, By Age, 2019-2028 (USD Million)

TABLE 55 U.S. Diet and Nutrition Apps Market, By Platform, 2019-2028 (USD Million)

TABLE 56 U.S. Diet and Nutrition Apps Market, By End User, 2019-2028 (USD Million)

TABLE 57 U.S. Fitness Centers in Diet and Nutrition Apps Market, By Type, 2019-2028 (USD Million)

TABLE 58 U.S. Healthcare Industries in Diet and Nutrition Apps Market, By Type, 2019-2028 (USD Million)

TABLE 59 U.S. Hospitals in Diet and Nutrition Apps Market, By Type, 2019-2028 (USD Million)

TABLE 60 Canada Diet and Nutrition Apps Market, By Type, 2019-2028 (USD Million)

TABLE 61 Canada Nutrition Tracking App in Diet and Nutrition Apps Market, By Type, 2019-2028 (USD Million)

TABLE 62 Canada Activity Tracking App in Diet and Nutrition Apps Market, By Type, 2019-2028 (USD Million)

TABLE 63 Canada Diet and Nutrition Apps Market, By Products, 2019-2028 (USD Million)

TABLE 64 Canada Wearable Devices in Diet and Nutrition Apps Market, By Type, 2019-2028 (USD Million)

TABLE 65 Canada Diet and Nutrition Apps Market, By Gender, 2019-2028 (USD Million)

TABLE 66 Canada Diet and Nutrition Apps Market, By Age, 2019-2028 (USD Million)

TABLE 67 Canada Diet and Nutrition Apps Market, By Platform, 2019-2028 (USD Million)

TABLE 68 Canada Diet and Nutrition Apps Market, By End User, 2019-2028 (USD Million)

TABLE 69 Canada Fitness Centers in Diet and Nutrition Apps Market, By Type, 2019-2028 (USD Million)

TABLE 70 Canada Healthcare Industries in Diet and Nutrition Apps Market, By Type, 2019-2028 (USD Million)

TABLE 71 Canada Hospitals in Diet and Nutrition Apps Market, By Type, 2019-2028 (USD Million)

TABLE 72 Mexico Diet and Nutrition Apps Market, By Type, 2019-2028 (USD Million)

TABLE 73 Mexico Nutrition Tracking App in Diet and Nutrition Apps Market, By Type, 2019-2028 (USD Million)

TABLE 74 Mexico Activity Tracking App in Diet and Nutrition Apps Market, By Type, 2019-2028 (USD Million)

TABLE 75 Mexico Diet and Nutrition Apps Market, By Products, 2019-2028 (USD Million)

TABLE 76 Mexico Wearable Devices in Diet and Nutrition Apps Market, By Type, 2019-2028 (USD Million)

TABLE 77 Mexico Diet and Nutrition Apps Market, By Gender, 2019-2028 (USD Million)

TABLE 78 Mexico Diet and Nutrition Apps Market, By Age, 2019-2028 (USD Million)

TABLE 79 Mexico Diet and Nutrition Apps Market, By Platform, 2019-2028 (USD Million)

TABLE 80 Mexico Diet and Nutrition Apps Market, By End User, 2019-2028 (USD Million)

TABLE 81 Mexico Fitness Centers in Diet and Nutrition Apps Market, By Type, 2019-2028 (USD Million)

TABLE 82 Mexico Healthcare Industries in Diet and Nutrition Apps Market, By Type, 2019-2028 (USD Million)

TABLE 83 Mexico Hospitals in Diet and Nutrition Apps Market, By Type, 2019-2028 (USD Million)

TABLE 84 Europe DIET AND NUTRITION APPS Market, By Country, 2019-2028 (USD Million)

TABLE 85 Europe Diet and Nutrition Apps Market, By Type, 2019-2028 (USD Million)

TABLE 86 Europe Nutrition Tracking App in Diet and Nutrition Apps Market, By Type, 2019-2028 (USD Million)

TABLE 87 Europe Activity Tracking App in Diet and Nutrition Apps Market, By Type, 2019-2028 (USD Million)

TABLE 88 Europe Diet and Nutrition Apps Market, By Products, 2019-2028 (USD Million)

TABLE 89 Europe Wearable Devices in Diet and Nutrition Apps Market, By Type, 2019-2028 (USD Million)

TABLE 90 Europe Diet and Nutrition Apps Market, By Gender, 2019-2028 (USD Million)

TABLE 91 Europe Diet and Nutrition Apps Market, By Age, 2019-2028 (USD Million)

TABLE 92 Europe Diet and Nutrition Apps Market, By Platform, 2019-2028 (USD Million)

TABLE 93 Europe Diet and Nutrition Apps Market, By End User, 2019-2028 (USD Million)

TABLE 94 Europe Fitness Centers in Diet and Nutrition Apps Market, By Type, 2019-2028 (USD Million)

TABLE 95 Europe Healthcare Industries in Diet and Nutrition Apps Market, By Type, 2019-2028 (USD Million)

TABLE 96 Europe Hospitals in Diet and Nutrition Apps Market, By Type, 2019-2028 (USD Million)

TABLE 97 Germany Diet and Nutrition Apps Market, By Type, 2019-2028 (USD Million)

TABLE 98 Germany Nutrition Tracking App in Diet and Nutrition Apps Market, By Type, 2019-2028 (USD Million)

TABLE 99 Germany Activity Tracking App in Diet and Nutrition Apps Market, By Type, 2019-2028 (USD Million)

TABLE 100 Germany Diet and Nutrition Apps Market, By Products, 2019-2028 (USD Million)

TABLE 101 Germany Wearable Devices in Diet and Nutrition Apps Market, By Type, 2019-2028 (USD Million)

TABLE 102 Germany Diet and Nutrition Apps Market, By Gender, 2019-2028 (USD Million)

TABLE 103 Germany Diet and Nutrition Apps Market, By Age, 2019-2028 (USD Million)

TABLE 104 Germany Diet and Nutrition Apps Market, By Platform, 2019-2028 (USD Million)

TABLE 105 Germany Diet and Nutrition Apps Market, By End User, 2019-2028 (USD Million)

TABLE 106 Germany Fitness Centers in Diet and Nutrition Apps Market, By Type, 2019-2028 (USD Million)

TABLE 107 Germany Healthcare Industries in Diet and Nutrition Apps Market, By Type, 2019-2028 (USD Million)

TABLE 108 Germany Hospitals in Diet and Nutrition Apps Market, By Type, 2019-2028 (USD Million)

TABLE 109 U.K. Diet and Nutrition Apps Market, By Type, 2019-2028 (USD Million)

TABLE 110 U.K. Nutrition Tracking App in Diet and Nutrition Apps Market, By Type, 2019-2028 (USD Million)

TABLE 111 U.K. Activity Tracking App in Diet and Nutrition Apps Market, By Type, 2019-2028 (USD Million)

TABLE 112 U.K. Diet and Nutrition Apps Market, By Products, 2019-2028 (USD Million)

TABLE 113 U.K. Wearable Devices in Diet and Nutrition Apps Market, By Type, 2019-2028 (USD Million)

TABLE 114 U.K. Diet and Nutrition Apps Market, By Gender, 2019-2028 (USD Million)

TABLE 115 U.K. Diet and Nutrition Apps Market, By Age, 2019-2028 (USD Million)

TABLE 116 U.K. Diet and Nutrition Apps Market, By Platform, 2019-2028 (USD Million)

TABLE 117 U.K. Diet and Nutrition Apps Market, By End User, 2019-2028 (USD Million)

TABLE 118 U.K. Fitness Centers in Diet and Nutrition Apps Market, By Type, 2019-2028 (USD Million)

TABLE 119 U.K. Healthcare Industries in Diet and Nutrition Apps Market, By Type, 2019-2028 (USD Million)

TABLE 120 U.K. Hospitals in Diet and Nutrition Apps Market, By Type, 2019-2028 (USD Million)

TABLE 121 Italy Diet and Nutrition Apps Market, By Type, 2019-2028 (USD Million)

TABLE 122 Italy Nutrition Tracking App in Diet and Nutrition Apps Market, By Type, 2019-2028 (USD Million)

TABLE 123 Italy Activity Tracking App in Diet and Nutrition Apps Market, By Type, 2019-2028 (USD Million)

TABLE 124 Italy Diet and Nutrition Apps Market, By Products, 2019-2028 (USD Million)

TABLE 125 Italy Wearable Devices in Diet and Nutrition Apps Market, By Type, 2019-2028 (USD Million)

TABLE 126 Italy Diet and Nutrition Apps Market, By Gender, 2019-2028 (USD Million)

TABLE 127 Italy Diet and Nutrition Apps Market, By Age, 2019-2028 (USD Million)

TABLE 128 Italy Diet and Nutrition Apps Market, By Platform, 2019-2028 (USD Million)

TABLE 129 Italy Diet and Nutrition Apps Market, By End User, 2019-2028 (USD Million)

TABLE 130 Italy Fitness Centers in Diet and Nutrition Apps Market, By Type, 2019-2028 (USD Million)

TABLE 131 Italy Healthcare Industries in Diet and Nutrition Apps Market, By Type, 2019-2028 (USD Million)

TABLE 132 Italy Hospitals in Diet and Nutrition Apps Market, By Type, 2019-2028 (USD Million)

TABLE 133 Spain Diet and Nutrition Apps Market, By Type, 2019-2028 (USD Million)

TABLE 134 Spain Nutrition Tracking App in Diet and Nutrition Apps Market, By Type, 2019-2028 (USD Million)

TABLE 135 Spain Activity Tracking App in Diet and Nutrition Apps Market, By Type, 2019-2028 (USD Million)

TABLE 136 Spain Diet and Nutrition Apps Market, By Products, 2019-2028 (USD Million)

TABLE 137 Spain Wearable Devices in Diet and Nutrition Apps Market, By Type, 2019-2028 (USD Million)

TABLE 138 Spain Diet and Nutrition Apps Market, By Gender, 2019-2028 (USD Million)

TABLE 139 Spain Diet and Nutrition Apps Market, By Age, 2019-2028 (USD Million)

TABLE 140 Spain Diet and Nutrition Apps Market, By Platform, 2019-2028 (USD Million)

TABLE 141 Spain Diet and Nutrition Apps Market, By End User, 2019-2028 (USD Million)

TABLE 142 Spain Fitness Centers in Diet and Nutrition Apps Market, By Type, 2019-2028 (USD Million)

TABLE 143 Spain Healthcare Industries in Diet and Nutrition Apps Market, By Type, 2019-2028 (USD Million)

TABLE 144 Spain Hospitals in Diet and Nutrition Apps Market, By Type, 2019-2028 (USD Million)

TABLE 145 France Diet and Nutrition Apps Market, By Type, 2019-2028 (USD Million)

TABLE 146 France Nutrition Tracking App in Diet and Nutrition Apps Market, By Type, 2019-2028 (USD Million)

TABLE 147 France Activity Tracking App in Diet and Nutrition Apps Market, By Type, 2019-2028 (USD Million)

TABLE 148 France Diet and Nutrition Apps Market, By Products, 2019-2028 (USD Million)

TABLE 149 France Wearable Devices in Diet and Nutrition Apps Market, By Type, 2019-2028 (USD Million)

TABLE 150 France Diet and Nutrition Apps Market, By Gender, 2019-2028 (USD Million)

TABLE 151 France Diet and Nutrition Apps Market, By Age, 2019-2028 (USD Million)

TABLE 152 France Diet and Nutrition Apps Market, By Platform, 2019-2028 (USD Million)

TABLE 153 France Diet and Nutrition Apps Market, By End User, 2019-2028 (USD Million)

TABLE 154 France Fitness Centers in Diet and Nutrition Apps Market, By Type, 2019-2028 (USD Million)

TABLE 155 France Healthcare Industries in Diet and Nutrition Apps Market, By Type, 2019-2028 (USD Million)

TABLE 156 France Hospitals in Diet and Nutrition Apps Market, By Type, 2019-2028 (USD Million)

TABLE 157 Netherlands Diet and Nutrition Apps Market, By Type, 2019-2028 (USD Million)

TABLE 158 Netherlands Nutrition Tracking App in Diet and Nutrition Apps Market, By Type, 2019-2028 (USD Million)

TABLE 159 Netherlands Activity Tracking App in Diet and Nutrition Apps Market, By Type, 2019-2028 (USD Million)

TABLE 160 Netherlands Diet and Nutrition Apps Market, By Products, 2019-2028 (USD Million)

TABLE 161 Netherlands Wearable Devices in Diet and Nutrition Apps Market, By Type, 2019-2028 (USD Million)

TABLE 162 Netherlands Diet and Nutrition Apps Market, By Gender, 2019-2028 (USD Million)

TABLE 163 Netherlands Diet and Nutrition Apps Market, By Age, 2019-2028 (USD Million)

TABLE 164 Netherlands Diet and Nutrition Apps Market, By Platform, 2019-2028 (USD Million)

TABLE 165 Netherlands Diet and Nutrition Apps Market, By End User, 2019-2028 (USD Million)

TABLE 166 Netherlands Fitness Centers in Diet and Nutrition Apps Market, By Type, 2019-2028 (USD Million)

TABLE 167 Netherlands Healthcare Industries in Diet and Nutrition Apps Market, By Type, 2019-2028 (USD Million)

TABLE 168 Netherlands Hospitals in Diet and Nutrition Apps Market, By Type, 2019-2028 (USD Million)

TABLE 169 Switzerland Diet and Nutrition Apps Market, By Type, 2019-2028 (USD Million)

TABLE 170 Switzerland Nutrition Tracking App in Diet and Nutrition Apps Market, By Type, 2019-2028 (USD Million)

TABLE 171 Switzerland Activity Tracking App in Diet and Nutrition Apps Market, By Type, 2019-2028 (USD Million)

TABLE 172 Switzerland Diet and Nutrition Apps Market, By Products, 2019-2028 (USD Million)

TABLE 173 Switzerland Wearable Devices in Diet and Nutrition Apps Market, By Type, 2019-2028 (USD Million)

TABLE 174 Switzerland Diet and Nutrition Apps Market, By Gender, 2019-2028 (USD Million)

TABLE 175 Switzerland Diet and Nutrition Apps Market, By Age, 2019-2028 (USD Million)

TABLE 176 Switzerland Diet and Nutrition Apps Market, By Platform, 2019-2028 (USD Million)

TABLE 177 Switzerland Diet and Nutrition Apps Market, By End User, 2019-2028 (USD Million)

TABLE 178 Switzerland Fitness Centers in Diet and Nutrition Apps Market, By Type, 2019-2028 (USD Million)

TABLE 179 Switzerland Healthcare Industries in Diet and Nutrition Apps Market, By Type, 2019-2028 (USD Million)

TABLE 180 Switzerland Hospitals in Diet and Nutrition Apps Market, By Type, 2019-2028 (USD Million)

TABLE 181 Russia Diet and Nutrition Apps Market, By Type, 2019-2028 (USD Million)

TABLE 182 Russia Nutrition Tracking App in Diet and Nutrition Apps Market, By Type, 2019-2028 (USD Million)

TABLE 183 Russia Activity Tracking App in Diet and Nutrition Apps Market, By Type, 2019-2028 (USD Million)

TABLE 184 Russia Diet and Nutrition Apps Market, By Products, 2019-2028 (USD Million)

TABLE 185 Russia Wearable Devices in Diet and Nutrition Apps Market, By Type, 2019-2028 (USD Million)

TABLE 186 Russia Diet and Nutrition Apps Market, By Gender, 2019-2028 (USD Million)

TABLE 187 Russia Diet and Nutrition Apps Market, By Age, 2019-2028 (USD Million)

TABLE 188 Russia Diet and Nutrition Apps Market, By Platform, 2019-2028 (USD Million)

TABLE 189 Russia Diet and Nutrition Apps Market, By End User, 2019-2028 (USD Million)

TABLE 190 Russia Fitness Centers in Diet and Nutrition Apps Market, By Type, 2019-2028 (USD Million)

TABLE 191 Russia Healthcare Industries in Diet and Nutrition Apps Market, By Type, 2019-2028 (USD Million)

TABLE 192 Russia Hospitals in Diet and Nutrition Apps Market, By Type, 2019-2028 (USD Million)

TABLE 193 Turkey Diet and Nutrition Apps Market, By Type, 2019-2028 (USD Million)

TABLE 194 Turkey Nutrition Tracking App in Diet and Nutrition Apps Market, By Type, 2019-2028 (USD Million)

TABLE 195 Turkey Activity Tracking App in Diet and Nutrition Apps Market, By Type, 2019-2028 (USD Million)

TABLE 196 Turkey Diet and Nutrition Apps Market, By Products, 2019-2028 (USD Million)

TABLE 197 Turkey Wearable Devices in Diet and Nutrition Apps Market, By Type, 2019-2028 (USD Million)

TABLE 198 Turkey Diet and Nutrition Apps Market, By Gender, 2019-2028 (USD Million)

TABLE 199 Turkey Diet and Nutrition Apps Market, By Age, 2019-2028 (USD Million)

TABLE 200 Turkey Diet and Nutrition Apps Market, By Platform, 2019-2028 (USD Million)

TABLE 201 Turkey Diet and Nutrition Apps Market, By End User, 2019-2028 (USD Million)

TABLE 202 Turkey Fitness Centers in Diet and Nutrition Apps Market, By Type, 2019-2028 (USD Million)

TABLE 203 Turkey Healthcare Industries in Diet and Nutrition Apps Market, By Type, 2019-2028 (USD Million)

TABLE 204 Turkey Hospitals in Diet and Nutrition Apps Market, By Type, 2019-2028 (USD Million)

TABLE 205 Belgium Diet and Nutrition Apps Market, By Type, 2019-2028 (USD Million)

TABLE 206 Belgium Nutrition Tracking App in Diet and Nutrition Apps Market, By Type, 2019-2028 (USD Million)

TABLE 207 Belgium Activity Tracking App in Diet and Nutrition Apps Market, By Type, 2019-2028 (USD Million)

TABLE 208 Belgium Diet and Nutrition Apps Market, By Products, 2019-2028 (USD Million)

TABLE 209 Belgium Wearable Devices in Diet and Nutrition Apps Market, By Type, 2019-2028 (USD Million)

TABLE 210 Belgium Diet and Nutrition Apps Market, By Gender, 2019-2028 (USD Million)

TABLE 211 Belgium Diet and Nutrition Apps Market, By Age, 2019-2028 (USD Million)

TABLE 212 Belgium Diet and Nutrition Apps Market, By Platform, 2019-2028 (USD Million)

TABLE 213 Belgium Diet and Nutrition Apps Market, By End User, 2019-2028 (USD Million)

TABLE 214 Belgium Fitness Centers in Diet and Nutrition Apps Market, By Type, 2019-2028 (USD Million)

TABLE 215 Belgium Healthcare Industries in Diet and Nutrition Apps Market, By Type, 2019-2028 (USD Million)

TABLE 216 Belgium Hospitals in Diet and Nutrition Apps Market, By Type, 2019-2028 (USD Million)

TABLE 217 Rest of Europe Diet and Nutrition Apps Market, By Type, 2019-2028 (USD Million)

TABLE 218 asia-pacific DIET AND NUTRITION APPS Market, By Country, 2019-2028 (USD Million)

TABLE 219 Asia-Pacific Diet and Nutrition Apps Market, By Type, 2019-2028 (USD Million)

TABLE 220 Asia-Pacific Nutrition Tracking App in Diet and Nutrition Apps Market, By Type, 2019-2028 (USD Million)

TABLE 221 Asia-Pacific Activity Tracking App in Diet and Nutrition Apps Market, By Type, 2019-2028 (USD Million)

TABLE 222 Asia-Pacific Diet and Nutrition Apps Market, By Products, 2019-2028 (USD Million)

TABLE 223 Asia-Pacific Wearable Devices in Diet and Nutrition Apps Market, By Type, 2019-2028 (USD Million)

TABLE 224 Asia-Pacific Diet and Nutrition Apps Market, By Gender, 2019-2028 (USD Million)

TABLE 225 Asia-Pacific Diet and Nutrition Apps Market, By Age, 2019-2028 (USD Million)

TABLE 226 Asia-Pacific Diet and Nutrition Apps Market, By Platform, 2019-2028 (USD Million)

TABLE 227 Asia-Pacific Diet and Nutrition Apps Market, By End User, 2019-2028 (USD Million)

TABLE 228 Asia-Pacific Fitness Centers in Diet and Nutrition Apps Market, By Type, 2019-2028 (USD Million)

TABLE 229 Asia-Pacific Healthcare Industries in Diet and Nutrition Apps Market, By Type, 2019-2028 (USD Million)

TABLE 230 Asia-Pacific Hospitals in Diet and Nutrition Apps Market, By Type, 2019-2028 (USD Million)

TABLE 231 China Diet and Nutrition Apps Market, By Type, 2019-2028 (USD Million)

TABLE 232 China Nutrition Tracking App in Diet and Nutrition Apps Market, By Type, 2019-2028 (USD Million)

TABLE 233 China Activity Tracking App in Diet and Nutrition Apps Market, By Type, 2019-2028 (USD Million)

TABLE 234 China Diet and Nutrition Apps Market, By Products, 2019-2028 (USD Million)

TABLE 235 China Wearable Devices in Diet and Nutrition Apps Market, By Type, 2019-2028 (USD Million)

TABLE 236 China Diet and Nutrition Apps Market, By Gender, 2019-2028 (USD Million)

TABLE 237 China Diet and Nutrition Apps Market, By Age, 2019-2028 (USD Million)

TABLE 238 China Diet and Nutrition Apps Market, By Platform, 2019-2028 (USD Million)

TABLE 239 China Diet and Nutrition Apps Market, By End User, 2019-2028 (USD Million)

TABLE 240 China Fitness Centers in Diet and Nutrition Apps Market, By Type, 2019-2028 (USD Million)

TABLE 241 China Healthcare Industries in Diet and Nutrition Apps Market, By Type, 2019-2028 (USD Million)

TABLE 242 China Hospitals in Diet and Nutrition Apps Market, By Type, 2019-2028 (USD Million)

TABLE 243 INDIA Diet and Nutrition Apps Market, By Type, 2019-2028 (USD Million)

TABLE 244 INDIA Nutrition Tracking App in Diet and Nutrition Apps Market, By Type, 2019-2028 (USD Million)

TABLE 245 INDIA Activity Tracking App in Diet and Nutrition Apps Market, By Type, 2019-2028 (USD Million)

TABLE 246 INDIA Diet and Nutrition Apps Market, By Products, 2019-2028 (USD Million)

TABLE 247 INDIA Wearable Devices in Diet and Nutrition Apps Market, By Type, 2019-2028 (USD Million)

TABLE 248 INDIA Diet and Nutrition Apps Market, By Gender, 2019-2028 (USD Million)

TABLE 249 INDIA Diet and Nutrition Apps Market, By Age, 2019-2028 (USD Million)

TABLE 250 INDIA Diet and Nutrition Apps Market, By Platform, 2019-2028 (USD Million)

TABLE 251 INDIA Diet and Nutrition Apps Market, By End User, 2019-2028 (USD Million)

TABLE 252 INDIA Fitness Centers in Diet and Nutrition Apps Market, By Type, 2019-2028 (USD Million)

TABLE 253 INDIA Healthcare Industries in Diet and Nutrition Apps Market, By Type, 2019-2028 (USD Million)

TABLE 254 INDIA Hospitals in Diet and Nutrition Apps Market, By Type, 2019-2028 (USD Million)

TABLE 255 Japan Diet and Nutrition Apps Market, By Type, 2019-2028 (USD Million)

TABLE 256 Japan Nutrition Tracking App in Diet and Nutrition Apps Market, By Type, 2019-2028 (USD Million)

TABLE 257 Japan Activity Tracking App in Diet and Nutrition Apps Market, By Type, 2019-2028 (USD Million)

TABLE 258 Japan Diet and Nutrition Apps Market, By Products, 2019-2028 (USD Million)

TABLE 259 Japan Wearable Devices in Diet and Nutrition Apps Market, By Type, 2019-2028 (USD Million)

TABLE 260 Japan Diet and Nutrition Apps Market, By Gender, 2019-2028 (USD Million)

TABLE 261 Japan Diet and Nutrition Apps Market, By Age, 2019-2028 (USD Million)

TABLE 262 Japan Diet and Nutrition Apps Market, By Platform, 2019-2028 (USD Million)

TABLE 263 Japan Diet and Nutrition Apps Market, By End User, 2019-2028 (USD Million)

TABLE 264 Japan Fitness Centers in Diet and Nutrition Apps Market, By Type, 2019-2028 (USD Million)

TABLE 265 Japan Healthcare Industries in Diet and Nutrition Apps Market, By Type, 2019-2028 (USD Million)

TABLE 266 Japan Hospitals in Diet and Nutrition Apps Market, By Type, 2019-2028 (USD Million)

TABLE 267 South Korea Diet and Nutrition Apps Market, By Type, 2019-2028 (USD Million)

TABLE 268 South Korea Nutrition Tracking App in Diet and Nutrition Apps Market, By Type, 2019-2028 (USD Million)

TABLE 269 South Korea Activity Tracking App in Diet and Nutrition Apps Market, By Type, 2019-2028 (USD Million)

TABLE 270 South Korea Diet and Nutrition Apps Market, By Products, 2019-2028 (USD Million)

TABLE 271 South Korea Wearable Devices in Diet and Nutrition Apps Market, By Type, 2019-2028 (USD Million)

TABLE 272 South Korea Diet and Nutrition Apps Market, By Gender, 2019-2028 (USD Million)

TABLE 273 South Korea Diet and Nutrition Apps Market, By Age, 2019-2028 (USD Million)

TABLE 274 South Korea Diet and Nutrition Apps Market, By Platform, 2019-2028 (USD Million)

TABLE 275 South Korea Diet and Nutrition Apps Market, By End User, 2019-2028 (USD Million)

TABLE 276 South Korea Fitness Centers in Diet and Nutrition Apps Market, By Type, 2019-2028 (USD Million)

TABLE 277 South Korea Healthcare Industries in Diet and Nutrition Apps Market, By Type, 2019-2028 (USD Million)

TABLE 278 South Korea Hospitals in Diet and Nutrition Apps Market, By Type, 2019-2028 (USD Million)

TABLE 279 Australia Diet and Nutrition Apps Market, By Type, 2019-2028 (USD Million)

TABLE 280 Australia Nutrition Tracking App in Diet and Nutrition Apps Market, By Type, 2019-2028 (USD Million)

TABLE 281 Australia Activity Tracking App in Diet and Nutrition Apps Market, By Type, 2019-2028 (USD Million)

TABLE 282 Australia Diet and Nutrition Apps Market, By Products, 2019-2028 (USD Million)

TABLE 283 Australia Wearable Devices in Diet and Nutrition Apps Market, By Type, 2019-2028 (USD Million)

TABLE 284 Australia Diet and Nutrition Apps Market, By Gender, 2019-2028 (USD Million)

TABLE 285 Australia Diet and Nutrition Apps Market, By Age, 2019-2028 (USD Million)

TABLE 286 Australia Diet and Nutrition Apps Market, By Platform, 2019-2028 (USD Million)

TABLE 287 Australia Diet and Nutrition Apps Market, By End User, 2019-2028 (USD Million)

TABLE 288 Australia Fitness Centers in Diet and Nutrition Apps Market, By Type, 2019-2028 (USD Million)

TABLE 289 Australia Healthcare Industries in Diet and Nutrition Apps Market, By Type, 2019-2028 (USD Million)

TABLE 290 Australia Hospitals in Diet and Nutrition Apps Market, By Type, 2019-2028 (USD Million)

TABLE 291 Indonesia Diet and Nutrition Apps Market, By Type, 2019-2028 (USD Million)

TABLE 292 Indonesia Nutrition Tracking App in Diet and Nutrition Apps Market, By Type, 2019-2028 (USD Million)

TABLE 293 Indonesia Activity Tracking App in Diet and Nutrition Apps Market, By Type, 2019-2028 (USD Million)

TABLE 294 Indonesia Diet and Nutrition Apps Market, By Products, 2019-2028 (USD Million)

TABLE 295 Indonesia Wearable Devices in Diet and Nutrition Apps Market, By Type, 2019-2028 (USD Million)

TABLE 296 Indonesia Diet and Nutrition Apps Market, By Gender, 2019-2028 (USD Million)

TABLE 297 Indonesia Diet and Nutrition Apps Market, By Age, 2019-2028 (USD Million)

TABLE 298 Indonesia Diet and Nutrition Apps Market, By Platform, 2019-2028 (USD Million)

TABLE 299 Indonesia Diet and Nutrition Apps Market, By End User, 2019-2028 (USD Million)

TABLE 300 Indonesia Fitness Centers in Diet and Nutrition Apps Market, By Type, 2019-2028 (USD Million)

TABLE 301 Indonesia Healthcare Industries in Diet and Nutrition Apps Market, By Type, 2019-2028 (USD Million)

TABLE 302 Indonesia Hospitals in Diet and Nutrition Apps Market, By Type, 2019-2028 (USD Million)

TABLE 303 Thailand Diet and Nutrition Apps Market, By Type, 2019-2028 (USD Million)

TABLE 304 Thailand Nutrition Tracking App in Diet and Nutrition Apps Market, By Type, 2019-2028 (USD Million)

TABLE 305 Thailand Activity Tracking App in Diet and Nutrition Apps Market, By Type, 2019-2028 (USD Million)

TABLE 306 Thailand Diet and Nutrition Apps Market, By Products, 2019-2028 (USD Million)

TABLE 307 Thailand Wearable Devices in Diet and Nutrition Apps Market, By Type, 2019-2028 (USD Million)

TABLE 308 Thailand Diet and Nutrition Apps Market, By Gender, 2019-2028 (USD Million)

TABLE 309 Thailand Diet and Nutrition Apps Market, By Age, 2019-2028 (USD Million)

TABLE 310 Thailand Diet and Nutrition Apps Market, By Platform, 2019-2028 (USD Million)

TABLE 311 Thailand Diet and Nutrition Apps Market, By End User, 2019-2028 (USD Million)

TABLE 312 Thailand Fitness Centers in Diet and Nutrition Apps Market, By Type, 2019-2028 (USD Million)

TABLE 313 Thailand Healthcare Industries in Diet and Nutrition Apps Market, By Type, 2019-2028 (USD Million)

TABLE 314 Thailand Hospitals in Diet and Nutrition Apps Market, By Type, 2019-2028 (USD Million)

TABLE 315 Philippines Diet and Nutrition Apps Market, By Type, 2019-2028 (USD Million)

TABLE 316 Philippines Nutrition Tracking App in Diet and Nutrition Apps Market, By Type, 2019-2028 (USD Million)

TABLE 317 Philippines Activity Tracking App in Diet and Nutrition Apps Market, By Type, 2019-2028 (USD Million)

TABLE 318 Philippines Diet and Nutrition Apps Market, By Products, 2019-2028 (USD Million)

TABLE 319 Philippines Wearable Devices in Diet and Nutrition Apps Market, By Type, 2019-2028 (USD Million)

TABLE 320 Philippines Diet and Nutrition Apps Market, By Gender, 2019-2028 (USD Million)

TABLE 321 Philippines Diet and Nutrition Apps Market, By Age, 2019-2028 (USD Million)

TABLE 322 Philippines Diet and Nutrition Apps Market, By Platform, 2019-2028 (USD Million)

TABLE 323 Philippines Diet and Nutrition Apps Market, By End User, 2019-2028 (USD Million)

TABLE 324 Philippines Fitness Centers in Diet and Nutrition Apps Market, By Type, 2019-2028 (USD Million)

TABLE 325 Philippines Healthcare Industries in Diet and Nutrition Apps Market, By Type, 2019-2028 (USD Million)

TABLE 326 Philippines Hospitals in Diet and Nutrition Apps Market, By Type, 2019-2028 (USD Million)

TABLE 327 Malaysia Diet and Nutrition Apps Market, By Type, 2019-2028 (USD Million)

TABLE 328 Malaysia Nutrition Tracking App in Diet and Nutrition Apps Market, By Type, 2019-2028 (USD Million)

TABLE 329 Malaysia Activity Tracking App in Diet and Nutrition Apps Market, By Type, 2019-2028 (USD Million)

TABLE 330 Malaysia Diet and Nutrition Apps Market, By Products, 2019-2028 (USD Million)

TABLE 331 Malaysia Wearable Devices in Diet and Nutrition Apps Market, By Type, 2019-2028 (USD Million)

TABLE 332 Malaysia Diet and Nutrition Apps Market, By Gender, 2019-2028 (USD Million)

TABLE 333 Malaysia Diet and Nutrition Apps Market, By Age, 2019-2028 (USD Million)

TABLE 334 Malaysia Diet and Nutrition Apps Market, By Platform, 2019-2028 (USD Million)

TABLE 335 Malaysia Diet and Nutrition Apps Market, By End User, 2019-2028 (USD Million)

TABLE 336 Malaysia Fitness Centers in Diet and Nutrition Apps Market, By Type, 2019-2028 (USD Million)

TABLE 337 Malaysia Healthcare Industries in Diet and Nutrition Apps Market, By Type, 2019-2028 (USD Million)

TABLE 338 Malaysia Hospitals in Diet and Nutrition Apps Market, By Type, 2019-2028 (USD Million)

TABLE 339 Singapore Diet and Nutrition Apps Market, By Type, 2019-2028 (USD Million)

TABLE 340 Singapore Nutrition Tracking App in Diet and Nutrition Apps Market, By Type, 2019-2028 (USD Million)

TABLE 341 Singapore Activity Tracking App in Diet and Nutrition Apps Market, By Type, 2019-2028 (USD Million)

TABLE 342 Singapore Diet and Nutrition Apps Market, By Products, 2019-2028 (USD Million)

TABLE 343 Singapore Wearable Devices in Diet and Nutrition Apps Market, By Type, 2019-2028 (USD Million)

TABLE 344 Singapore Diet and Nutrition Apps Market, By Gender, 2019-2028 (USD Million)

TABLE 345 Singapore Diet and Nutrition Apps Market, By Age, 2019-2028 (USD Million)

TABLE 346 Singapore Diet and Nutrition Apps Market, By Platform, 2019-2028 (USD Million)

TABLE 347 Singapore Diet and Nutrition Apps Market, By End User, 2019-2028 (USD Million)

TABLE 348 Singapore Fitness Centers in Diet and Nutrition Apps Market, By Type, 2019-2028 (USD Million)

TABLE 349 Singapore Healthcare Industries in Diet and Nutrition Apps Market, By Type, 2019-2028 (USD Million)

TABLE 350 Singapore Hospitals in Diet and Nutrition Apps Market, By Type, 2019-2028 (USD Million)

TABLE 351 Rest of Asia-Pacific Diet and Nutrition Apps Market, By Type, 2019-2028 (USD Million)

TABLE 352 Middle East and Africa DIET AND NUTRITION APPS Market, By Country, 2019-2028 (USD Million)

TABLE 353 Middle East & Africa Diet and Nutrition Apps Market, By Type, 2019-2028 (USD Million)

TABLE 354 Middle East & Africa Nutrition Tracking App in Diet and Nutrition Apps Market, By Type, 2019-2028 (USD Million)

TABLE 355 Middle East & Africa Activity Tracking App in Diet and Nutrition Apps Market, By Type, 2019-2028 (USD Million)

TABLE 356 Middle East & Africa Diet and Nutrition Apps Market, By Products, 2019-2028 (USD Million)

TABLE 357 Middle East & Africa Wearable Devices in Diet and Nutrition Apps Market, By Type, 2019-2028 (USD Million)

TABLE 358 Middle East & Africa Diet and Nutrition Apps Market, By Gender, 2019-2028 (USD Million)

TABLE 359 Middle East & Africa Diet and Nutrition Apps Market, By Age, 2019-2028 (USD Million)

TABLE 360 Middle East & Africa Diet and Nutrition Apps Market, By Platform, 2019-2028 (USD Million)

TABLE 361 Middle East & Africa Diet and Nutrition Apps Market, By End User, 2019-2028 (USD Million)

TABLE 362 Middle East & Africa Fitness Centers in Diet and Nutrition Apps Market, By Type, 2019-2028 (USD Million)

TABLE 363 Middle East & Africa Healthcare Industries in Diet and Nutrition Apps Market, By Type, 2019-2028 (USD Million)

TABLE 364 Middle East & Africa Hospitals in Diet and Nutrition Apps Market, By Type, 2019-2028 (USD Million)

TABLE 365 U.A.E. Diet and Nutrition Apps Market, By Type, 2019-2028 (USD Million)

TABLE 366 U.A.E. Nutrition Tracking App in Diet and Nutrition Apps Market, By Type, 2019-2028 (USD Million)

TABLE 367 U.A.E. Activity Tracking App in Diet and Nutrition Apps Market, By Type, 2019-2028 (USD Million)

TABLE 368 U.A.E. Diet and Nutrition Apps Market, By Products, 2019-2028 (USD Million)

TABLE 369 U.A.E. Wearable Devices in Diet and Nutrition Apps Market, By Type, 2019-2028 (USD Million)

TABLE 370 U.A.E. Diet and Nutrition Apps Market, By Gender, 2019-2028 (USD Million)

TABLE 371 U.A.E. Diet and Nutrition Apps Market, By Age, 2019-2028 (USD Million)

TABLE 372 U.A.E. Diet and Nutrition Apps Market, By Platform, 2019-2028 (USD Million)

TABLE 373 U.A.E. Diet and Nutrition Apps Market, By End User, 2019-2028 (USD Million)

TABLE 374 U.A.E. Fitness Centers in Diet and Nutrition Apps Market, By Type, 2019-2028 (USD Million)

TABLE 375 U.A.E. Healthcare Industries in Diet and Nutrition Apps Market, By Type, 2019-2028 (USD Million)

TABLE 376 U.A.E. Hospitals in Diet and Nutrition Apps Market, By Type, 2019-2028 (USD Million)

TABLE 377 Saudi Arabia Diet and Nutrition Apps Market, By Type, 2019-2028 (USD Million)

TABLE 378 Saudi Arabia Nutrition Tracking App in Diet and Nutrition Apps Market, By Type, 2019-2028 (USD Million)

TABLE 379 Saudi Arabia Activity Tracking App in Diet and Nutrition Apps Market, By Type, 2019-2028 (USD Million)

TABLE 380 Saudi Arabia Diet and Nutrition Apps Market, By Products, 2019-2028 (USD Million)

TABLE 381 Saudi Arabia Wearable Devices in Diet and Nutrition Apps Market, By Type, 2019-2028 (USD Million)

TABLE 382 Saudi Arabia Diet and Nutrition Apps Market, By Gender, 2019-2028 (USD Million)

TABLE 383 Saudi Arabia Diet and Nutrition Apps Market, By Age, 2019-2028 (USD Million)

TABLE 384 Saudi Arabia Diet and Nutrition Apps Market, By Platform, 2019-2028 (USD Million)

TABLE 385 Saudi Arabia Diet and Nutrition Apps Market, By End User, 2019-2028 (USD Million)

TABLE 386 Saudi Arabia Fitness Centers in Diet and Nutrition Apps Market, By Type, 2019-2028 (USD Million)

TABLE 387 Saudi Arabia Healthcare Industries in Diet and Nutrition Apps Market, By Type, 2019-2028 (USD Million)

TABLE 388 Saudi Arabia Hospitals in Diet and Nutrition Apps Market, By Type, 2019-2028 (USD Million)

TABLE 389 South Africa Diet and Nutrition Apps Market, By Type, 2019-2028 (USD Million)

TABLE 390 South Africa Nutrition Tracking App in Diet and Nutrition Apps Market, By Type, 2019-2028 (USD Million)

TABLE 391 South Africa Activity Tracking App in Diet and Nutrition Apps Market, By Type, 2019-2028 (USD Million)

TABLE 392 South Africa Diet and Nutrition Apps Market, By Products, 2019-2028 (USD Million)

TABLE 393 South Africa Wearable Devices in Diet and Nutrition Apps Market, By Type, 2019-2028 (USD Million)

TABLE 394 South Africa Diet and Nutrition Apps Market, By Gender, 2019-2028 (USD Million)

TABLE 395 South Africa Diet and Nutrition Apps Market, By Age, 2019-2028 (USD Million)

TABLE 396 South Africa Diet and Nutrition Apps Market, By Platform, 2019-2028 (USD Million)

TABLE 397 South Africa Diet and Nutrition Apps Market, By End User, 2019-2028 (USD Million)

TABLE 398 South Africa Fitness Centers in Diet and Nutrition Apps Market, By Type, 2019-2028 (USD Million)

TABLE 399 South Africa Healthcare Industries in Diet and Nutrition Apps Market, By Type, 2019-2028 (USD Million)

TABLE 400 South Africa Hospitals in Diet and Nutrition Apps Market, By Type, 2019-2028 (USD Million)

TABLE 401 Egypt Diet and Nutrition Apps Market, By Type, 2019-2028 (USD Million)

TABLE 402 Egypt Nutrition Tracking App in Diet and Nutrition Apps Market, By Type, 2019-2028 (USD Million)

TABLE 403 Egypt Activity Tracking App in Diet and Nutrition Apps Market, By Type, 2019-2028 (USD Million)

TABLE 404 Egypt Diet and Nutrition Apps Market, By Products, 2019-2028 (USD Million)

TABLE 405 Egypt Wearable Devices in Diet and Nutrition Apps Market, By Type, 2019-2028 (USD Million)

TABLE 406 Egypt Diet and Nutrition Apps Market, By Gender, 2019-2028 (USD Million)

TABLE 407 Egypt Diet and Nutrition Apps Market, By Age, 2019-2028 (USD Million)

TABLE 408 Egypt Diet and Nutrition Apps Market, By Platform, 2019-2028 (USD Million)

TABLE 409 Egypt Diet and Nutrition Apps Market, By End User, 2019-2028 (USD Million)

TABLE 410 Egypt Fitness Centers in Diet and Nutrition Apps Market, By Type, 2019-2028 (USD Million)

TABLE 411 Egypt Healthcare Industries in Diet and Nutrition Apps Market, By Type, 2019-2028 (USD Million)

TABLE 412 Egypt Hospitals in Diet and Nutrition Apps Market, By Type, 2019-2028 (USD Million)

TABLE 413 Israel Diet and Nutrition Apps Market, By Type, 2019-2028 (USD Million)

TABLE 414 Israel Nutrition Tracking App in Diet and Nutrition Apps Market, By Type, 2019-2028 (USD Million)

TABLE 415 Israel Activity Tracking App in Diet and Nutrition Apps Market, By Type, 2019-2028 (USD Million)

TABLE 416 Israel Diet and Nutrition Apps Market, By Products, 2019-2028 (USD Million)

TABLE 417 Israel Wearable Devices in Diet and Nutrition Apps Market, By Type, 2019-2028 (USD Million)

TABLE 418 Israel Diet and Nutrition Apps Market, By Gender, 2019-2028 (USD Million)

TABLE 419 Israel Diet and Nutrition Apps Market, By Age, 2019-2028 (USD Million)

TABLE 420 Israel Diet and Nutrition Apps Market, By Platform, 2019-2028 (USD Million)

TABLE 421 Israel Diet and Nutrition Apps Market, By End User, 2019-2028 (USD Million)

TABLE 422 Israel Fitness Centers in Diet and Nutrition Apps Market, By Type, 2019-2028 (USD Million)

TABLE 423 Israel Healthcare Industries in Diet and Nutrition Apps Market, By Type, 2019-2028 (USD Million)

TABLE 424 Israel Hospitals in Diet and Nutrition Apps Market, By Type, 2019-2028 (USD Million)

TABLE 425 Rest of Middle East and Africa Diet and Nutrition Apps Market, By Type, 2019-2028 (USD Million)

TABLE 426 SOUTH AMERICA DIET AND NUTRITION APPS Market, By Country, 2019-2028 (USD Million)

TABLE 427 South America Diet and Nutrition Apps Market, By Type, 2019-2028 (USD Million)

TABLE 428 South America Nutrition Tracking App in Diet and Nutrition Apps Market, By Type, 2019-2028 (USD Million)

TABLE 429 South America Activity Tracking App in Diet and Nutrition Apps Market, By Type, 2019-2028 (USD Million)

TABLE 430 South America Diet and Nutrition Apps Market, By Products, 2019-2028 (USD Million)

TABLE 431 South America Wearable Devices in Diet and Nutrition Apps Market, By Type, 2019-2028 (USD Million)

TABLE 432 South America Diet and Nutrition Apps Market, By Gender, 2019-2028 (USD Million)

TABLE 433 South America Diet and Nutrition Apps Market, By Age, 2019-2028 (USD Million)

TABLE 434 South America Diet and Nutrition Apps Market, By Platform, 2019-2028 (USD Million)

TABLE 435 South America Diet and Nutrition Apps Market, By End User, 2019-2028 (USD Million)

TABLE 436 South America Fitness Centers in Diet and Nutrition Apps Market, By Type, 2019-2028 (USD Million)

TABLE 437 South America Healthcare Industries in Diet and Nutrition Apps Market, By Type, 2019-2028 (USD Million)

TABLE 438 South America Hospitals in Diet and Nutrition Apps Market, By Type, 2019-2028 (USD Million)

TABLE 439 BRAZIL Diet and Nutrition Apps Market, By Type, 2019-2028 (USD Million)

TABLE 440 BRAZIL Nutrition Tracking App in Diet and Nutrition Apps Market, By Type, 2019-2028 (USD Million)

TABLE 441 BRAZIL Activity Tracking App in Diet and Nutrition Apps Market, By Type, 2019-2028 (USD Million)

TABLE 442 BRAZIL Diet and Nutrition Apps Market, By Products, 2019-2028 (USD Million)

TABLE 443 BRAZIL Wearable Devices in Diet and Nutrition Apps Market, By Type, 2019-2028 (USD Million)

TABLE 444 BRAZIL Diet and Nutrition Apps Market, By Gender, 2019-2028 (USD Million)

TABLE 445 BRAZIL Diet and Nutrition Apps Market, By Age, 2019-2028 (USD Million)

TABLE 446 BRAZIL Diet and Nutrition Apps Market, By Platform, 2019-2028 (USD Million)

TABLE 447 BRAZIL Diet and Nutrition Apps Market, By End User, 2019-2028 (USD Million)

TABLE 448 Brazil Fitness Centers in Diet and Nutrition Apps Market, By Type, 2019-2028 (USD Million)

TABLE 449 BRAZIL Healthcare Industries in Diet and Nutrition Apps Market, By Type, 2019-2028 (USD Million)

TABLE 450 BRAZIL Hospitals in Diet and Nutrition Apps Market, By Type, 2019-2028 (USD Million)

TABLE 451 Argentina Diet and Nutrition Apps Market, By Type, 2019-2028 (USD Million)

TABLE 452 Argentina Nutrition Tracking App in Diet and Nutrition Apps Market, By Type, 2019-2028 (USD Million)

TABLE 453 Argentina Activity Tracking App in Diet and Nutrition Apps Market, By Type, 2019-2028 (USD Million)

TABLE 454 Argentina Diet and Nutrition Apps Market, By Products, 2019-2028 (USD Million)

TABLE 455 Argentina Wearable Devices in Diet and Nutrition Apps Market, By Type, 2019-2028 (USD Million)

TABLE 456 Argentina Diet and Nutrition Apps Market, By Gender, 2019-2028 (USD Million)

TABLE 457 Argentina Diet and Nutrition Apps Market, By Age, 2019-2028 (USD Million)

TABLE 458 Argentina Diet and Nutrition Apps Market, By Platform, 2019-2028 (USD Million)

TABLE 459 Argentina Diet and Nutrition Apps Market, By End User, 2019-2028 (USD Million)

TABLE 460 Argentina Fitness Centers in Diet and Nutrition Apps Market, By Type, 2019-2028 (USD Million)

TABLE 461 Argentina Healthcare Industries in Diet and Nutrition Apps Market, By Type, 2019-2028 (USD Million)

TABLE 462 Argentina Hospitals in Diet and Nutrition Apps Market, By Type, 2019-2028 (USD Million)

TABLE 463 Rest of South America Diet and Nutrition Apps Market, By Type, 2019-2028 (USD Million)

図表一覧

FIGURE 1 Global diet and nutrition apps market: segmentation

FIGURE 2 Global diet and nutrition apps market: data triangulation

FIGURE 3 Global diet and nutrition apps market: DROC ANALYSIS

FIGURE 4 Global diet and nutrition apps market: GLOBAL VS REGIONAL MARKET ANALYSIS

FIGURE 5 Global diet and nutrition apps market: COMPANY RESEARCH ANALYSIS

FIGURE 6 Global diet and nutrition apps market: INTERVIEW DEMOGRAPHICS

FIGURE 7 Global diet and nutrition apps market: DBMR MARKET POSITION GRID

FIGURE 8 Global diet and nutrition apps market: vendor share analysis

FIGURE 9 GLOBAL DIET AND NUTRITION APPS Market: MARKET end user COVERAGE GRID

FIGURE 10 Global diet and nutrition apps market: SEGMENTATION

FIGURE 11 Growing awareness regarding health and wellness is EXPECTED TO DRIVE THE Global diet and nutrition apps market IN THE FORECAST PERIOD OF 2021 to 2028

FIGURE 12 nutrition tracking app segment is expected to account for the largest share of THE Global diet and nutrition apps market in 2021 & 2028

FIGURE 13 north america is expected to DOMINATE and ASIA-PACIFIC is the fastest-growing region in THE global diet and nutrition apps market IN the forecast period of 2021 to 2028

FIGURE 14 north america is the fastest-growing market for diet and nutrition apps manufacturers in the forecast period of 2021 to 2028

FIGURE 15 DRIVERS, RESTRaINTS, OPPORTUNITIES, AND CHALLENGES OF GLOBAL DIET AND NUTRITION APPS MARKET

FIGURE 16 INCREASE IN THE INTERNET USERS WORLDWIDE, FROM 2010 TO 2021

FIGURE 17 Global diet and nutrition apps MARKET: BY type, 2020

FIGURE 18 Global diet and nutrition apps MARKET: BY products, 2020

FIGURE 19 Global diet and nutrition apps MARKET: BY gender, 2020

FIGURE 20 Global diet and nutrition apps MARKET: BY age, 2020

FIGURE 21 Global diet and nutrition apps MARKET: BY platform, 2020

FIGURE 22 Global diet and nutrition apps MARKET: BY end user, 2020

FIGURE 23 Global diet and nutrition apps market: SNAPSHOT (2020)

FIGURE 24 Global diet and nutrition apps market: by region (2020)

FIGURE 25 Global diet and nutrition apps market: by region (2021 & 2028)

FIGURE 26 Global diet and nutrition apps market: by region (2020 & 2028)

FIGURE 27 Global diet and nutrition apps market: by type (2021-2028)

FIGURE 28 NORTH AMERICA DIET AND NUTRITION APPS MARKET: SNAPSHOT (2020)

FIGURE 29 NORTH AMERICA DIET AND NUTRITION APPS MARKET: by Country (2020)

FIGURE 30 NORTH AMERICA DIET AND NUTRITION APPS MARKET: by Country (2021 & 2028)

FIGURE 31 NORTH AMERICA DIET AND NUTRITION APPS MARKET: by Country (2020 & 2028)

FIGURE 32 NORTH AMERICA DIET AND NUTRITION APPS MARKET: by Type (2021-2028)

FIGURE 33 Europe DIET AND NUTRITION APPS MARKET: SNAPSHOT (2020)

FIGURE 34 Europe DIET AND NUTRITION APPS MARKET: by Country (2020)

FIGURE 35 Europe DIET AND NUTRITION APPS MARKET: by Country (2021 & 2028)

FIGURE 36 Europe DIET AND NUTRITION APPS MARKET: by Country (2020 & 2028)

FIGURE 37 Europe DIET AND NUTRITION APPS MARKET: by Type (2021-2028)

FIGURE 38 asia-pacific DIET AND NUTRITION APPS MARKET: SNAPSHOT (2020)

FIGURE 39 asia-pacific DIET AND NUTRITION APPS MARKET: by Country (2020)

FIGURE 40 asia-pacific DIET AND NUTRITION APPS MARKET: by Country (2021 & 2028)

FIGURE 41 asia-pacific DIET AND NUTRITION APPS MARKET: by Country (2020 & 2028)

FIGURE 42 asia-pacific DIET AND NUTRITION APPS MARKET: by type (2021-2028)

FIGURE 43 Middle East and Africa DIET AND NUTRITION APPS MARKET: SNAPSHOT (2020)

FIGURE 44 Middle East and Africa DIET AND NUTRITION APPS MARKET: by Country (2020)

FIGURE 45 Middle East and Africa DIET AND NUTRITION APPS MARKET: by Country (2021 & 2028)

FIGURE 46 Middle East and Africa DIET AND NUTRITION APPS MARKET: by Country (2020 & 2028)

FIGURE 47 Middle East and Africa DIET AND NUTRITION APPS MARKET: by Type (2021-2028)

FIGURE 48 SOUTH AMERICA DIET AND NUTRITION APPS MARKET: SNAPSHOT (2020)

FIGURE 49 SOUTH AMERICA DIET AND NUTRITION APPS MARKET: by Country (2020)

FIGURE 50 SOUTH AMERICA DIET AND NUTRITION APPS MARKET: by Country (2021 & 2028)

FIGURE 51 SOUTH AMERICA DIET AND NUTRITION APPS MARKET: by Country (2020 & 2028)

FIGURE 52 SOUTH AMERICA DIET AND NUTRITION APPS MARKET: by Type (2021-2028)

FIGURE 53 global Diet and nutrition apps Market: company share 2020 (%)

FIGURE 54 NORTH AMERICA Diet and nutrition apps Market: company share 2020 (%)

FIGURE 55 Europe Diet and nutrition apps Market: company share 2020 (%)

FIGURE 56 Asia-Pacific Diet and nutrition apps Market: company share 2020 (%)

詳細情報を見る Right Arrow

調査方法

データ収集と基準年分析は、大規模なサンプル サイズのデータ​​収集モジュールを使用して行われます。この段階では、さまざまなソースと戦略を通じて市場情報または関連データを取得します。過去に取得したすべてのデータを事前に調査および計画することも含まれます。また、さまざまな情報ソース間で見られる情報の不一致の調査も含まれます。市場データは、市場統計モデルと一貫性モデルを使用して分析および推定されます。また、市場シェア分析と主要トレンド分析は、市場レポートの主要な成功要因です。詳細については、アナリストへの電話をリクエストするか、お問い合わせをドロップダウンしてください。

DBMR 調査チームが使用する主要な調査方法は、データ マイニング、データ変数が市場に与える影響の分析、および一次 (業界の専門家) 検証を含むデータ三角測量です。データ モデルには、ベンダー ポジショニング グリッド、市場タイムライン分析、市場概要とガイド、企業ポジショニング グリッド、特許分析、価格分析、企業市場シェア分析、測定基準、グローバルと地域、ベンダー シェア分析が含まれます。調査方法について詳しくは、お問い合わせフォームから当社の業界専門家にご相談ください。

カスタマイズ可能

Data Bridge Market Research は、高度な形成的調査のリーダーです。当社は、既存および新規のお客様に、お客様の目標に合致し、それに適したデータと分析を提供することに誇りを持っています。レポートは、対象ブランドの価格動向分析、追加国の市場理解 (国のリストをお問い合わせください)、臨床試験結果データ、文献レビュー、リファービッシュ市場および製品ベース分析を含めるようにカスタマイズできます。対象競合他社の市場分析は、技術ベースの分析から市場ポートフォリオ戦略まで分析できます。必要な競合他社のデータを、必要な形式とデータ スタイルでいくつでも追加できます。当社のアナリスト チームは、粗い生の Excel ファイル ピボット テーブル (ファクト ブック) でデータを提供したり、レポートで利用可能なデータ セットからプレゼンテーションを作成するお手伝いをしたりすることもできます。

Frequently Asked Questions

Growing health and wellness awareness & increase in digitalization are the growth drivers of the diet and nutrition apps market.
Type, products, gender, age, platform, and end-user are the factors on which the diet and nutrition apps market research is based.
Major companies in the diet and nutrition apps market are Azumio Inc. (U.S.), MyFitnessPal, Inc.(U.S.), Noom, Inc. (U.S.), Lifesum Ab (Sweden), FitNow, Inc. (U.S.), MyNetDiary Inc. (U.S.), Innit International SCA (U.S.), The Kroger Co. (U.S.), mySugr GmbH (Germany), FatSecret (Australia), HappyCow, Inc. (U.S.), HealthifyMe Wellness Private Limited (India), Fitocracy, Inc. (U.S.), Wombat Apps LLC(U.S.), Cronometer Software Inc. (Canada), CareClinic (Canada), Syndigo LLC (U.S.), foodvisor.io (France), Eat This Much Inc. (U.S.), Asken Inc. (U.S.), Leaf Group Ltd. (U.S.), Avatar Nutrition LLC (U.S.).
The diet and nutrition apps market size will be worth USD 35,346.09 million by 2031.
The growth rate of the diet and nutrition apps market is 17.61% in the forecast by 2031.