世界のコンピュータービジョン市場 – 2031年までの業界動向と予測

Request for TOC TOC のリクエスト Speak to Analyst アナリストに相談する Buy Now今すぐ購入 Inquire Before Buying 事前に問い合わせる Free Sample Report 無料サンプルレポート

世界のコンピュータービジョン市場 – 2031年までの業界動向と予測

  • Semiconductors and Electronics
  • Upcoming Report
  • Jun 2024
  • Global
  • 350 ページ
  • テーブル数: 220
  • 図の数: 60

世界のコンピュータービジョン市場

Market Size in USD Billion

CAGR :  % Diagram

Diagram 予測期間
2024 –2031
Diagram 市場規模(基準年)
USD 14.06 Billion
Diagram Market Size (Forecast Year)
USD 26.65 Billion
Diagram CAGR
%
Diagram Major Markets Players
  • Cognex Corporation
  • Basler AG
  • OMRON Corporation
  • KEYENCE CORPORATION
  • National Instruments Corp

>世界のコンピューター ビジョン市場、コンポーネント別 (ハードウェア、ソフトウェア、サービス)、製品別 (スマート カメラ ベースのコンピューター ビジョン システムと PC ベースのコンピューター ビジョン システム)、提供内容別 (ディープラーニングと従来のコンピューター ビジョン)、アプリケーション別 (品質保証と検査、位置決めとガイダンス、識別、予測保守)、垂直別 (産業用と非産業用) – 2031 年までの業界動向と予測。

 コンピュータビジョン市場

コンピュータビジョン市場の分析と規模

コンピューター ビジョン市場は、人工知能 (AI)と機械学習テクノロジーの進歩に牽引され、堅調な成長を遂げています。自動車、医療、小売、農業など、さまざまな業界で自動化と効率化の需要が高まっていることから、コンピューター ビジョン ソリューションの採用が進んでいます。これらのソリューションにより、機械は視覚世界を解釈して理解できるようになり、顔認識や物体検出から自律走行車や拡張現実まで、幅広いアプリケーションが可能になります。市場は、大量の視覚データの処理と分析に必要なインフラストラクチャを提供するクラウド コンピューティング サービスの利用可能性が高まっていることからも恩恵を受けています。

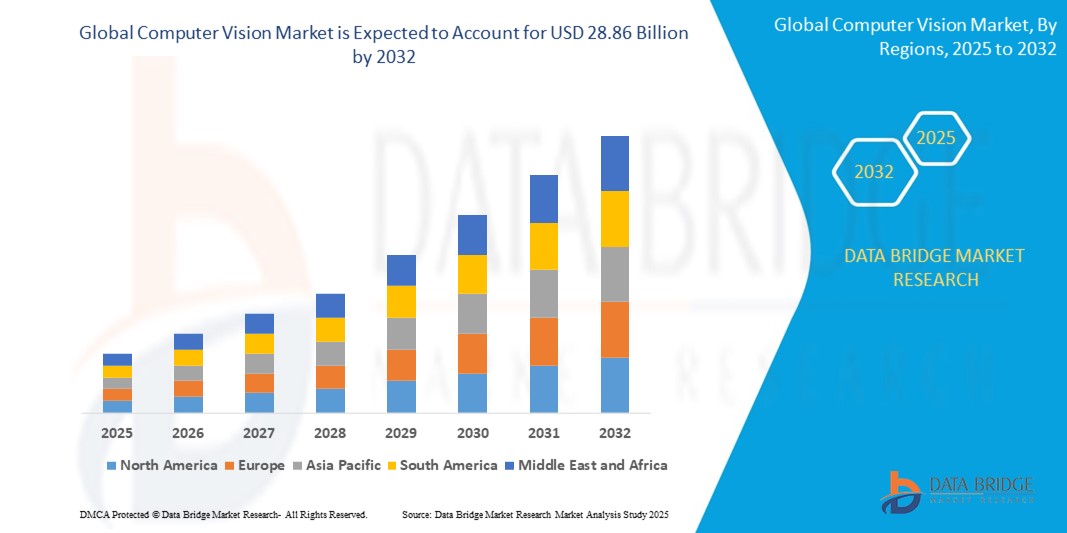
世界のコンピュータービジョン市場規模は、2023年に140億6,000万米ドルと評価され、2024年から2031年の予測期間中に8.32%のCAGRで成長し、2031年には266億5,000万米ドルに達すると予測されています。市場価値、成長率、セグメンテーション、地理的範囲、主要プレーヤーなどの市場シナリオに関する洞察に加えて、Data Bridge Market Researchがまとめた市場レポートには、詳細な専門家の分析、地理的に表された企業別の生産と生産能力、販売業者とパートナーのネットワークレイアウト、詳細で最新の価格動向分析、サプライチェーンと需要の不足分析も含まれています。

レポートの範囲と市場セグメンテーション       

レポートメトリック

詳細

予測期間

2024年から2031年

基準年

2023

歴史的な年

2022 (2016 - 2021 にカスタマイズ可能)

定量単位

売上高(10億米ドル)、販売数量(個数)、価格(米ドル)

対象セグメント

コンポーネント (ハードウェア、ソフトウェア、サービス)、製品 (スマート カメラ ベースのコンピューター ビジョン システムと PC ベースのコンピューター ビジョン システム)、提供内容 (ディープラーニングと従来のコンピューター ビジョン)、アプリケーション (品質保証と検査、位置決めとガイダンス、識別、予知保全)、垂直分野 (産業用と非産業用)

対象国

米国、カナダ、メキシコ、ドイツ、フランス、英国、オランダ、スイス、ベルギー、ロシア、イタリア、スペイン、トルコ、その他のヨーロッパ諸国、中国、日本、インド、韓国、シンガポール、マレーシア、オーストラリア、タイ、インドネシア、フィリピン、その他のアジア太平洋諸国、サウジアラビア、UAE、南アフリカ、エジプト、イスラエル、その他の中東およびアフリカ諸国、ブラジル、アルゼンチン、その他の南米諸国

対象となる市場プレーヤー

Cognex Corporation(米国)、Basler AG(ドイツ)、オムロン株式会社(日本)、キーエンス株式会社(日本)、National Instruments Corp(米国)、ソニー株式会社(日本)、Teledyne Technologies(米国)、Allied Vision Technologies GmbH(ドイツ)、Texas Instruments Incorporated(米国)、Intel Corporation(米国)、Baumer(ドイツ)、JAI(デンマーク)、MediaTek, Inc.(台湾)、Cadence Design Systems, Inc.(米国)、CEVA, Inc.(米国)、Synopsys, Inc.(米国)

市場機会

  • ロボットと自動化との統合  
  • 自動運転車の開発

市場の定義

コンピュータ ビジョンは、コンピュータが視覚世界を解釈および理解できるようにする人工知能 (AI) の分野です。人間の視覚を模倣して、機械が画像やビデオから情報を抽出できるようにするアルゴリズムと方法を作成します。コンピュータ ビジョン システムは、物体の識別、顔の認識、動きの検出、シーンの理解など、視覚データを分析および解釈できます。

コンピュータビジョン市場の動向

ドライバー

  • 自動化の需要増加        

企業は、プロセスの合理化、効率性の向上、コスト削減における自動化のメリットを認識しています。コンピューター ビジョンは、機械が視覚データを解釈して理解できるようにすることで、従来は人間の介入が必要だったタスクを実行できるようにすることで、自動化において重要な役割を果たします。製造、物流、医療などの業界では、反復的なタスクを自動化し、生産性を高め、全体的な運用効率を改善するために、コンピューター ビジョン ソリューションの導入が進んでいます。自動化の需要が高まり続けるにつれて、コンピューター ビジョン市場は大幅に拡大すると予想されます。              

  • AIと機械学習の進歩          

AI と機械学習の技術的進歩は、コンピューター ビジョン システムの能力を高めています。これらの進歩により、コンピューター ビジョン システムは、画像認識、物体検出、画像セグメンテーションなどのより正確で高度なタスクを実行できます。AI と機械学習アルゴリズムにより、コンピューター ビジョン システムはデータから学習し、時間の経過とともにパフォーマンスが向上します。これにより、自律走行車、顔認識、医療画像分析などのコンピューター ビジョン アプリケーションが大幅に進歩しました。AI のコンピューター ビジョンが進化し続けるにつれて、コンピューター ビジョン システムの能力はさらに向上し、コンピューター ビジョン市場の成長を促進すると予想されます。

機会

  • ロボットと自動化との統合  

コンピュータ ビジョンはロボット工学と自動化に不可欠であり、産業自動化から自律走行車まで、さまざまな用途に使用されています。ロボット工学では、コンピュータ ビジョンによって機械が視覚データを解釈できるようになり、製造における物体認識、ナビゲーション、品質管理などのタスクが容易になります。この統合により、さまざまな業界で効率、精度、安全性が向上します。自律走行車の場合、コンピュータ ビジョンによって車両は環境を認識し、障害物を検知し、安全に走行できます。ロボット工学と自動化が進化し続けるにつれて、コンピュータ ビジョン技術の需要は高まり、市場の革新と成長が促進されると予想されます。          

  • 自動運転車の開発

自動運転車の開発は、コンピューター ビジョン技術に大きく依存しています。自動運転車のコンピューター ビジョン システムは、カメラやセンサーからの視覚データを解釈して周囲の状況を把握し、障害物を検知し、情報に基づいた判断を下します。コンピューター ビジョンのアルゴリズムとハードウェアの進歩により、自動運転システムの機能が大幅に向上し、車両が複雑な環境をナビゲートして安全に運転できるようになりました。自動車業界が自動運転車技術に投資を続ける中、高度なコンピューター ビジョン ソリューションの需要は高まると予想されます。これにより、コンピューター ビジョン企業が革新を起こし、自動車メーカーと協力して輸送の未来を形作る新たな機会が生まれます。

制約/課題

  • データのプライバシーとセキュリティに関する懸念

コンピューター ビジョン テクノロジの使用は、データのプライバシーとセキュリティに関する重大な懸念を引き起こします。これらのシステムでは機密性の高い視覚データの収集と分析が必要になることが多いため、不正な監視や潜在的なデータ漏洩のリスクがあります。このデータの誤用や取り扱いミスは、深刻なプライバシー侵害や法的問題につながる可能性があります。さらに、コンピューター ビジョン アルゴリズムの複雑さと、処理するデータの膨大な量により、サイバー攻撃に対して脆弱になる可能性があります。       

  • 実装コストが高い

コンピューター ビジョン ソリューションの実装は、特に中小企業 (SME) にとってコストがかかる場合があります。コストが高い主な理由は、特殊なハードウェア、ソフトウェア、および熟練した人員が必要になることです。カメラ、センサー、処理ユニットなどの必要なハードウェアの調達と維持にはコストがかかります。さらに、コンピューター ビジョン アルゴリズムを実装して既存のシステムに統合するには専門知識が必要であり、追加のトレーニングや熟練した専門家の雇用が必要になる場合があります。これらのコストは中小企業の参入障壁となり、コンピューター ビジョン ソリューションを導入して大企業と競争する能力を制限する可能性があります。

この市場レポートでは、最近の新しい開発、貿易規制、輸出入分析、生産分析、バリュー チェーンの最適化、市場シェア、国内および現地の市場プレーヤーの影響、新たな収益源の観点から見た機会の分析、市場規制の変更、戦略的市場成長分析、市場規模、カテゴリ市場の成長、アプリケーションのニッチと優位性、製品の承認、製品の発売、地理的拡張、市場における技術革新などの詳細が提供されます。市場に関する詳細情報を取得するには、データ ブリッジ市場調査にアナリストの概要をお問い合わせください。当社のチームが、市場の成長を達成するための情報に基づいた市場決定を行うお手伝いをします。

最近の動向

  • 2023年3月、テキサス・インスツルメンツ社は、6つのArm Cortexベースのビジョンプロセッサを発売し、コンピュータビジョンソリューションを拡張しました。これらのプロセッサにより、設計者はビデオドアベル、マシンビジョン、自律移動ロボットなどのアプリケーションに強化されたビジョンと人工知能(AI)処理を組み込むことができます。新しいプロセッサは、コスト効率とエネルギー効率が向上し、さまざまなAI駆動型アプリケーションに大きなメリットをもたらします。
  • 2022年5月、クラウドコンピューティング、データセンター、IoTソリューションなど、多様なテクノロジー製品やサービスで知られる米国企業インテルコーポレーションは、「Sonoma Creek」というコンピュータービジョンソフトウェアを発表しました。このソフトウェアは、開発者が人工知能を自社製品に迅速に統合するのを支援することを目的としています。

原材料不足と出荷遅延の影響と現在の市場シナリオ

Data Bridge Market Research は、市場の高水準な分析を提供し、原材料不足や出荷遅延の影響と現在の市場環境を考慮した情報を提供します。これは、戦略的な可能性を評価し、効果的な行動計画を作成し、企業が重要な決定を下すのを支援することにつながります。

標準レポートの他に、予測される出荷遅延からの調達レベルの詳細な分析、地域別の販売代理店マッピング、商品分析、生産分析、価格マッピングの傾向、調達、カテゴリパフォーマンス分析、サプライチェーンリスク管理ソリューション、高度なベンチマーク、その他の調達および戦略サポートサービスも提供しています。

経済減速が製品の価格と入手可能性に及ぼす予想される影響

経済活動が減速すると、業界は打撃を受け始めます。DBMR が提供する市場分析レポートとインテリジェンス サービスでは、景気後退が製品の価格設定と入手しやすさに及ぼす予測される影響が考慮されています。これにより、当社のクライアントは通常、競合他社より一歩先を行き、売上と収益を予測し、損益支出を見積もることができます。

コンピュータビジョン市場の範囲

コンピューター ビジョン市場は、コンポーネント、製品、提供内容、アプリケーション、および垂直に基づいてセグメント化されています。これらのセグメント間の成長は、業界のわずかな成長セグメントの分析に役立ち、ユーザーに貴重な市場の概要と市場の洞察を提供して、コア市場アプリケーションを特定するための戦略的決定を下すのに役立ちます。

コンポーネント

  • ハードウェア
  • ソフトウェア
  • サービス

製品

  • スマートカメラベースのコンピュータビジョンシステム
  • PCベースのコンピュータビジョンシステム

提供

  • ディープラーニング
  • 従来のコンピュータビジョン

応用

  • 品質保証と検査
  • ポジショニングとガイダンス
  • 識別
  • 予知保全

垂直

  • 産業
  • 非産業

コンピュータビジョン市場の地域分析/洞察

市場は分析され、市場規模の洞察と傾向は、上記のように国、コンポーネント、製品、提供、アプリケーション、および業種別に提供されます。

市場レポートで取り上げられている国は、米国、カナダ、メキシコ、ドイツ、フランス、英国、オランダ、スイス、ベルギー、ロシア、イタリア、スペイン、トルコ、その他のヨーロッパ諸国、中国、日本、インド、韓国、シンガポール、マレーシア、オーストラリア、タイ、インドネシア、フィリピン、その他のアジア太平洋諸国、サウジアラビア、UAE、南アフリカ、エジプト、イスラエル、その他の中東およびアフリカ諸国、ブラジル、アルゼンチン、その他の南米諸国です。

アジア太平洋地域は、オムロン株式会社やソニーセミコンダクタソリューションズ株式会社などの主要企業の存在により、さらなる成長を牽引すると見込まれており、市場を独占すると予想されています。さらに、中国企業やその他のアジア太平洋諸国へのコンピュータービジョン技術への多額の投資も、この地域の高い市場シェアに貢献しています。                  

北米は、Microsoft、Google、IBM、Intel など、コンピューター ビジョン業界の大手企業が本社を置いている地域であるため、大幅な成長が見込まれています。これらの企業は、コンピューター ビジョン技術とそのアプリケーションを強化するために、研究開発に多額の投資を行っています。北米地域の市場は拡大しており、これらの企業は米国とカナダの両方で事業を拡大しています。

レポートの国別セクションでは、市場の現在および将来の傾向に影響を与える国内市場における個別の市場影響要因と規制の変更も提供しています。下流および上流のバリュー チェーン分析、技術動向、ポーターの 5 つの力の分析、ケース スタディなどのデータ ポイントは、各国の市場シナリオを予測するために使用される指標の一部です。また、国別データの予測分析を提供する際には、グローバル ブランドの存在と可用性、および地元および国内ブランドとの競争が激しいか少ないために直面​​する課題、国内関税と貿易ルートの影響も考慮されます。   

競争環境とコンピュータビジョン市場シェア分析

市場競争環境では、競合他社ごとの詳細が提供されます。詳細には、会社概要、会社の財務状況、収益、市場の可能性、研究開発への投資、新しい市場への取り組み、世界的なプレゼンス、生産拠点と施設、生産能力、会社の強みと弱み、製品の発売、製品の幅と広さ、アプリケーションの優位性などが含まれます。提供される上記のデータ ポイントは、市場に関連する会社の焦点にのみ関連しています。

市場で活動している主要企業は次のとおりです。

  • コグネックス株式会社(米国)
  • Basler AG(ドイツ)
  • オムロン株式会社(日本)
  • キーエンス株式会社(日本)
  • ナショナルインスツルメンツ社(米国)
  • ソニー株式会社(日本)
  • テレダイン・テクノロジーズ(米国)
  • アライドビジョンテクノロジーズ GmbH (ドイツ)
  • テキサス・インスツルメンツ社(米国)
  • インテルコーポレーション(米国)
  • バウマー(ドイツ)
  • JAI(デンマーク)
  • MediaTek, Inc.(台湾)
  • ケイデンス・デザイン・システムズ社(米国)
  • CEVA, Inc.(米国)
  • シノプシス社(米国) 


SKU-

世界初のマーケットインテリジェンスクラウドに関するレポートにオンラインでアクセスする

  • インタラクティブなデータ分析ダッシュボード
  • 成長の可能性が高い機会のための企業分析ダッシュボード
  • カスタマイズとクエリのためのリサーチアナリストアクセス
  • インタラクティブなダッシュボードによる競合分析
  • 最新ニュース、更新情報、トレンド分析
  • 包括的な競合追跡のためのベンチマーク分析のパワーを活用
デモのリクエスト

目次

  1. introduction
    1. OBJECTIVES OF THE STUDY
    2. MARKET DEFINITION
    3. OVERVIEW OF GLOBAL Computer vision MARKET
    4. Currency and Pricing
    5. LIMITATIONS
    6. MARKETS COVERED
  2. MARKET SEGMENTATION
    1. MARKETS COVERED
    2. geographicAL scope
    3. years considered for the study
    4. DBMR TRIPOD DATA VALIDATION MODEL
    5. primary interviews with key opinion leaders
    6. DBMR MARKET POSITION GRID
    7. vendor share analysis
    8. Multivariate Modeling
    9. components timeline curve
    10. MARKET APPLICATION COVERAGE GRID
    11. secondary sourcEs
    12. assumptions
  3. EXECUTIVE SUMMARY
  4. premium insights
  5. IMPACT OF COVID-19 ON THE GLOBAL COMPUTER VISION MARKET
    1. AFTERMATH OF COVID-19 AND GOVERNMENT INITIATIVE TO BOOST THE MARKET
    2. STRATEGIC DECISIONS FOR MANUFACTURERS AFTER COVID-19 TO GAIN COMPETITIVE MARKET SHARE
    3. IMPACT ON PRICE
    4. IMPACT ON DEMAND AND SUPPLY CHAIN
    5. CONCLUSION
  6. market overview
    1. drivers
      1. Accuracy and reliability offered by computer vision system
      2. Integration of deep learning with computer vision
      3. RISE IN ADOPTION OF AI USING COMPUTER VISION
      4. RISE IN demand for Augmented Reality
      5. INCREASE IN demand for Identity verification
    2. RESTRAINTS
      1. Threats OF cyber-attacks in AI-based computer vision
      2. Threats from virus and malware in computer vision system
      3. Difficulty in Object Localization and Detection
    3. OPPORTUNITIES
      1. RISE IN need FOR computer vision in automotive and Manufacturing industries
      2. RISE IN adoption of computer vision across Retails and healthcare sector
      3. INCREASE interest towards Financial services and Agriculture sector
    4. CHALLENGES
      1. complexities involved in designing of computer vision system
      2. Malfunctioning in equipment of computer vision systems due to harsh in environment
      3. Lack of potential skilled workers to operate and maintain the system
  7. global computer vision MARKET, BY component
    1. overview
    2. hardware
      1. cameras
        1. BY INTERFACE STANDARDS
          1. USB 3.0
          2. GIGE
          3. CAMERA LINK HS
          4. CAMERA LINK
          5. USB 2.0
          6. OTHERS
        2. BY FRAME RATE
          1. 25-125 FPS
          2. LESS THAN 25 FPS
          3. MORE THAN 125 FPS
        3. BY FORMAT
          1. AREA SCAN
          2. LINE SCAN
        4. BY SENSOR TYPE
          1. CCD
          2. CMOS
      2. PROCESSORS
        1. MICROCONTROLLER AND MICROPROCESSORS
        2. VPUS
        3. FPGAS
        4. DSPS
      3. FRAme grabbers
      4. optics
      5. LED Lighting
    3. Software
      1. Deep learning
      2. traditional computer vision
  8. global Computer vision MARKET, BY application
    1. overview
    2. Quality Assurance & Inspection
    3. Positioning & Guidance
    4. Predictive Maintenance
    5. Identification
  9. global COMPUTER VISION MARKET, BY vertical
    1. overview
    2. Industrial
      1. Electronic and semiconductor
      2. Consumer ELECTRONICS
      3. pharmaceuticals
      4. food and packaging
      5. automotive
      6. machinery
      7. textiles
      8. metals
      9. solar panel manufacturing
      10. printing
      11. glass
      12. rubber and plastics
      13. wood and paper
    3. Non Industrial
      1. healthcare
      2. retail
      3. consumer electronics
      4. Autonomous and Semi Autonomous Vehicles
      5. Intelligent Transportation Systems
      6. Security and Surveillance
      7. Sports & Entertainment
      8. Postal and Logistics
      9. agriculture
  10. global Computer vision MARKET, BY product
    1. overview
    2. Smart Cameras-Based Computer Vision Systems
    3. PC-Based Computer Vision Systems
  11. Global Computer Vision market, by region
    1. overview
    2. NORTH AMERICA
      1. u.s.
      2. canada
      3. mexico
    3. south AMERICA
      1. Brazil
      2. Argentina
      3. Rest of South America
    4. EUROPE
      1. U.K.
      2. Germany
      3. France
      4. Italy
      5. Spain
      6. Netherlands
      7. Switzerland
      8. Belgium
      9. Russia
      10. Turkey
      11. Rest of Europe
    5. Asia-Pacific
      1. CHINA
      2. Japan
      3. South Korea
      4. India
      5. Australia
      6. Singapore
      7. Indonesia
      8. Malaysia
      9. Thailand
      10. Philippines
      11. Rest of Asia-Pacific
    6. Middle East & Africa
      1. Saudi Arabia
      2. U.A.E.
      3. Israel
      4. South Africa
      5. Egypt
      6. Rest of Middle East and Africa
  12. GLOBAL Computer Vision market: COMPANY landscape
    1. company share analysis: GLOBAL
    2. company share analysis: NORTH AMERICA
    3. company share analysis: EUROPE
    4. company share analysis: Asia-pacific
  13. Swot analysis
  14. Company profile
    1. Texas Instruments Incorporated
      1. COMPANY snapshot
      2. REVENUE ANALYSIS
      3. COMPANY SHARE ANALYSIS
      4. Application PORTFOLIO
      5. recent DEVELOPMENT
    2. Cognex Corporation
      1. COMPANY snapshot
      2. REVENUE ANALYSIS
      3. COMPANY SHARE ANALYSIS
      4. product PORTFOLIO
      5. recent DEVELOPMENTS
    3. Teledyne Technologies Incorporated
      1. COMPANY snapshot
      2. REVENUE ANALYSIS
      3. COMPANY SHARE ANALYSIS
      4. product PORTFOLIO
      5. recent DEVELOPMENTS
    4. KEYENCE CORPORATION
      1. COMPANY snapshot
      2. REVENUE ANALYSIS
      3. COMPANY SHARE ANALYSIS
      4. product PORTFOLIO
      5. recent DEVELOPMENT
    5. ametek, inc.
      1. COMPANY snapshot
      2. REVENUE ANALYSIS
      3. COMPANY SHARE ANALYSIS
      4. product PORTFOLIO
      5. recent DEVELOPMENT
    6. Basler AG
      1. COMPANY snapshot
      2. REVENUE ANALYSIS
      3. product PORTFOLIO
      4. recent DEVELOPMENTS
    7. Baumer
      1. COMPANY snapshot
      2. product PORTFOLIO
      3. recent DEVELOPMENT
    8. Cadence Design Systems
      1. COMPANY snapshot
      2. REVENUE ANALYSIS
      3. product PORTFOLIO
      4. recent DEVELOPMENT
    9. CEVA, INC.
      1. COMPANY snapshot
      2. REVENUE ANALYSIS
      3. Application & product PORTFOLIO
      4. recent DEVELOPMENT
    10. Clarifai, Inc.
      1. COMPANY snapshot
      2. product & solution PORTFOLIO
      3. recent DEVELOPMENTs
    11. Intel Corporation
      1. COMPANY snapshot
      2. REVENUE ANALYSIS
      3. Product PORTFOLIO
      4. recent DEVELOPMENT
    12. ISRA VISION AG
      1. COMPANY snapshot
      2. REVENUE ANALYSIS
      3. Product PORTFOLIO
      4. recent DEVELOPMENT
    13. jai a/s
      1. COMPANY snapshot
      2. product PORTFOLIO
      3. recent DEVELOPMENTS
    14. MVTEC SOFTWARE GMBH
      1. COMPANY snapshot
      2. product PORTFOLIO
      3. recent DEVELOPMENT
    15. national instruments corp.
      1. COMPANY snapshot
      2. REVENUE ANALYSIS
      3. product PORTFOLIO
      4. recent DEVELOPMENT
    16. OMRON Corporation
      1. COMPANY snapshot
      2. REVENUE ANALYSIS
      3. product PORTFOLIO
      4. recent DEVELOPMENTS
    17. SICK AG
      1. COMPANY snapshot
      2. product PORTFOLIO
      3. recent DEVELOPMENT
    18. SONY GROUP CORPORATION
      1. COMPANY snapshot
      2. REVENUE ANALYSIS
      3. product PORTFOLIO
      4. recent DEVELOPMENTS
    19. Synopsys, Inc
      1. COMPANY snapshot
      2. REVENUE ANALYSIS
      3. product PORTFOLIO
      4. recent DEVELOPMENTS
    20. Tordivel AS
      1. COMPANY snapshot
      2. product & solution PORTFOLIO
      3. recent DEVELOPMENTs
  15. questionnaire
  16. related reports

表のリスト

TABLE 1 Global computer vision Market, By component, 2019-2028 (USD Million)

TABLE 2 Global hardware in Computer vision Market, By Region, 2019-2028 (USD MILLION)

TABLE 3 Global hardware in computer vision Market, By component, 2019-2028 (USD Million)

TABLE 4 Global cameras in computer vision Market, By interface standards, 2019-2028 (USD Million)

TABLE 5 Global cameras in computer vision Market, By Frame rate, 2019-2028 (USD Million)

TABLE 6 Global cameras in computer vision Market, By Format, 2019-2028 (USD Million)

TABLE 7 Global cameras in computer vision Market, By Sensor type, 2019-2028 (USD Million)

TABLE 8 Global processors in computer vision Market, By component, 2019-2028 (USD Million)

TABLE 9 Global Software in Computer vision Market, By Region, 2019-2028 (USD MILLION)

TABLE 10 Global Software in computer vision Market, By component, 2019-2028 (USD Million)

TABLE 11 Global Computer vision Market, By application,2019-2028 (USD Million)

TABLE 12 Global Quality ASSURANCE & Inspection in Computer vision market, By region,2019-2028 (USD Million)

TABLE 13 Global Positioning & Guidance in Computer vision market, By region, 2019-2028 (USD Million)

TABLE 14 Global Predictive Maintenance in Computer vision market, By region, 2019-2028 (USD Million)

TABLE 15 Global Identification in Computer vision market, By region, 2019-2028 (USD Million)

TABLE 16 Global Computer vision Market, By Vertical, 2019-2028 (USD Million)

TABLE 17 Global Industrial in Computer vision Market, By REGION, 2019-2028 (USD MILLION)

TABLE 18 Global industrial in Computer vision Market, By Vertical, 2019-2028 (USD Million)

TABLE 19 Global Non Industrial in Computer vision Market, By REGION, 2019-2028 (USD MILLION)

TABLE 20 Global non industrial in Computer vision Market, By Vertical, 2019-2028 (USD Million)

TABLE 21 Global Computer vision Market, By product, 2019-2028 (USD Million)

TABLE 22 Global Smart Cameras-Based Computer Vision Systems in Computer vision market, By region, 2019-2028 (USD Million)

TABLE 23 Global PC-Based Computer Vision Systems in Computer vision market, By region,2019-2028 (USD Million)

TABLE 24 Global computer vision market, By rEGION, 2019-2028 (USD Million)

TABLE 25 North America Computer Vision Market, By Country, 2019-2028 (USD Million)

TABLE 26 North America Computer Vision Market, By Component, 2019-2028 (USD Million)

TABLE 27 North America Software in Computer Vision Market, By Component, 2019-2028 (USD Million)

TABLE 28 North America Hardware in Computer Vision Market, By Component, 2019-2028 (USD Million)

TABLE 29 North America Cameras in Computer Vision Market, By Interface Standards, 2019-2028 (USD Million)

TABLE 30 North America Cameras in Computer Vision Market, By Frame Rate, 2019-2028 (USD Million)

TABLE 31 North America Cameras in Computer Vision Market, By Format, 2019-2028 (USD Million)

TABLE 32 North America Cameras in Computer Vision Market, By Sensor Type, 2019-2028 (USD Million)

TABLE 33 North America Processors in Computer Vision Market, By Component, 2019-2028 (USD Million)

TABLE 34 North America Computer Vision Market, By Application, 2019-2028 (USD Million)

TABLE 35 North America Computer Vision Market, By Vertical, 2019-2028 (USD Million)

TABLE 36 North America Industrial in Computer Vision Market, By Vertical, 2019-2028 (USD Million)

TABLE 37 North America Non Industrial in Computer Vision Market, By Vertical, 2019-2028 (USD Million)

TABLE 38 North America Computer Vision Market, By Product, 2019-2028 (USD Million)

TABLE 39 u.s. Computer Vision Market, By Component, 2019-2028 (USD Million)

TABLE 40 u.s. Software in Computer Vision Market, By Component, 2019-2028 (USD Million)

TABLE 41 u.s. Hardware in Computer Vision Market, By Component, 2019-2028 (USD Million)

TABLE 42 u.s. Cameras in Computer Vision Market, By Interface Standards, 2019-2028 (USD Million)

TABLE 43 u.s. Cameras in Computer Vision Market, By Frame Rate, 2019-2028 (USD Million)

TABLE 44 u.s. Cameras in Computer Vision Market, By Format, 2019-2028 (USD Million)

TABLE 45 u.s. Cameras in Computer Vision Market, By Sensor Type, 2019-2028 (USD Million)

TABLE 46 u.s. Processors in Computer Vision Market, By Component, 2019-2028 (USD Million)

TABLE 47 u.s. Computer Vision Market, By Application, 2019-2028 (USD Million)

TABLE 48 u.s. Computer Vision Market, By Vertical, 2019-2028 (USD Million)

TABLE 49 u.s. Industrial in Computer Vision Market, By Vertical, 2019-2028 (USD Million)

TABLE 50 u.s. Non Industrial in Computer Vision Market, By Vertical, 2019-2028 (USD Million)

TABLE 51 u.s. Computer Vision Market, By Product, 2019-2028 (USD Million)

TABLE 52 Canada Computer Vision Market, By Component, 2019-2028 (USD Million)

TABLE 53 Canada Software in Computer Vision Market, By Component, 2019-2028 (USD Million)

TABLE 54 Canada Hardware in Computer Vision Market, By Component, 2019-2028 (USD Million)

TABLE 55 Canada Cameras in Computer Vision Market, By Interface Standards, 2019-2028 (USD Million)

TABLE 56 Canada Cameras in Computer Vision Market, By Frame Rate, 2019-2028 (USD Million)

TABLE 57 Canada Cameras in Computer Vision Market, By Format, 2019-2028 (USD Million)

TABLE 58 Canada Cameras in Computer Vision Market, By Sensor Type, 2019-2028 (USD Million)

TABLE 59 Canada Processors in Computer Vision Market, By Component, 2019-2028 (USD Million)

TABLE 60 Canada Computer Vision Market, By Application, 2019-2028 (USD Million)

TABLE 61 Canada Computer Vision Market, By Vertical, 2019-2028 (USD Million)

TABLE 62 Canada Industrial in Computer Vision Market, By Vertical, 2019-2028 (USD Million)

TABLE 63 Canada Non Industrial in Computer Vision Market, By Vertical, 2019-2028 (USD Million)

TABLE 64 Canada Computer Vision Market, By Product, 2019-2028 (USD Million)

TABLE 65 Mexico Computer Vision Market, By Component, 2019-2028 (USD Million)

TABLE 66 Mexico Software in Computer Vision Market, By Component, 2019-2028 (USD Million)

TABLE 67 Mexico Hardware in Computer Vision Market, By Component, 2019-2028 (USD Million)

TABLE 68 Mexico Cameras in Computer Vision Market, By Interface Standards, 2019-2028 (USD Million)

TABLE 69 Mexico Cameras in Computer Vision Market, By Frame Rate, 2019-2028 (USD Million)

TABLE 70 Mexico Cameras in Computer Vision Market, By Format, 2019-2028 (USD Million)

TABLE 71 Mexico Cameras in Computer Vision Market, By Sensor Type, 2019-2028 (USD Million)

TABLE 72 Mexico Processors in Computer Vision Market, By Component, 2019-2028 (USD Million)

TABLE 73 Mexico Computer Vision Market, By Application, 2019-2028 (USD Million)

TABLE 74 Mexico Computer Vision Market, By Vertical, 2019-2028 (USD Million)

TABLE 75 Mexico Industrial in Computer Vision Market, By Vertical, 2019-2028 (USD Million)

TABLE 76 Mexico Non Industrial in Computer Vision Market, By Vertical, 2019-2028 (USD Million)

TABLE 77 Mexico Computer Vision Market, By Product, 2019-2028 (USD Million)

TABLE 78 South America Computer Vision Market, By Country, 2019-2028 (USD Million)

TABLE 79 South America Computer Vision Market, By Component, 2019-2028 (USD Million)

TABLE 80 South America Software in Computer Vision Market, By Component, 2019-2028 (USD Million)

TABLE 81 South America Hardware in Computer Vision Market, By Component, 2019-2028 (USD Million)

TABLE 82 South America Cameras in Computer Vision Market, By Interface Standards, 2019-2028 (USD Million)

TABLE 83 South America Cameras in Computer Vision Market, By Frame Rate, 2019-2028 (USD Million)

TABLE 84 South America Cameras in Computer Vision Market, By Format, 2019-2028 (USD Million)

TABLE 85 South America Cameras in Computer Vision Market, By Sensor Type, 2019-2028 (USD Million)

TABLE 86 South America Processors in Computer Vision Market, By Component, 2019-2028 (USD Million)

TABLE 87 South America Computer Vision Market, By Application, 2019-2028 (USD Million)

TABLE 88 South America Computer Vision Market, By Vertical, 2019-2028 (USD Million)

TABLE 89 South America Industrial in Computer Vision Market, By Vertical, 2019-2028 (USD Million)

TABLE 90 South America Non Industrial in Computer Vision Market, By Vertical, 2019-2028 (USD Million)

TABLE 91 South America Computer Vision Market, By Product, 2019-2028 (USD Million)

TABLE 92 Brazil Computer Vision Market, By Component, 2019-2028 (USD Million)

TABLE 93 Brazil Software in Computer Vision Market, By Component, 2019-2028 (USD Million)

TABLE 94 Brazil Hardware in Computer Vision Market, By Component, 2019-2028 (USD Million)

TABLE 95 Brazil Cameras in Computer Vision Market, By Interface Standards, 2019-2028 (USD Million)

TABLE 96 Brazil Cameras in Computer Vision Market, By Frame Rate, 2019-2028 (USD Million)

TABLE 97 Brazil Cameras in Computer Vision Market, By Format, 2019-2028 (USD Million)

TABLE 98 Brazil Cameras in Computer Vision Market, By Sensor Type, 2019-2028 (USD Million)

TABLE 99 Brazil Processors in Computer Vision Market, By Component, 2019-2028 (USD Million)

TABLE 100 Brazil Computer Vision Market, By Application, 2019-2028 (USD Million)

TABLE 101 Brazil Computer Vision Market, By Vertical, 2019-2028 (USD Million)

TABLE 102 Brazil Industrial in Computer Vision Market, By Vertical, 2019-2028 (USD Million)

TABLE 103 Brazil Non Industrial in Computer Vision Market, By Vertical, 2019-2028 (USD Million)

TABLE 104 Brazil Computer Vision Market, By Product, 2019-2028 (USD Million)

TABLE 105 Argentina Computer Vision Market, By Component, 2019-2028 (USD Million)

TABLE 106 Argentina Software in Computer Vision Market, By Component, 2019-2028 (USD Million)

TABLE 107 Argentina Hardware in Computer Vision Market, By Component, 2019-2028 (USD Million)

TABLE 108 Argentina Cameras in Computer Vision Market, By Interface Standards, 2019-2028 (USD Million)

TABLE 109 Argentina Cameras in Computer Vision Market, By Frame Rate, 2019-2028 (USD Million)

TABLE 110 Argentina Cameras in Computer Vision Market, By Format, 2019-2028 (USD Million)

TABLE 111 Argentina Cameras in Computer Vision Market, By Sensor Type, 2019-2028 (USD Million)

TABLE 112 Argentina Processors in Computer Vision Market, By Component, 2019-2028 (USD Million)

TABLE 113 Argentina Computer Vision Market, By Application, 2019-2028 (USD Million)

TABLE 114 Argentina Computer Vision Market, By Vertical, 2019-2028 (USD Million)

TABLE 115 Argentina Industrial in Computer Vision Market, By Vertical, 2019-2028 (USD Million)

TABLE 116 Argentina Non Industrial in Computer Vision Market, By Vertical, 2019-2028 (USD Million)

TABLE 117 Argentina Computer Vision Market, By Product, 2019-2028 (USD Million)

TABLE 118 Rest of South America Computer Vision Market, By Component, 2019-2028 (USD Million)

TABLE 119 Europe Computer Vision Market, By Country, 2019-2028 (USD Million)

TABLE 120 Europe Computer Vision Market, By Component, 2019-2028 (USD Million)

TABLE 121 Europe Software in Computer Vision Market, By Component, 2019-2028 (USD Million)

TABLE 122 Europe Hardware in Computer Vision Market, By Component, 2019-2028 (USD Million)

TABLE 123 Europe Cameras in Computer Vision Market, By Interface Standards, 2019-2028 (USD Million)

TABLE 124 Europe Cameras in Computer Vision Market, By Frame Rate, 2019-2028 (USD Million)

TABLE 125 Europe Cameras in Computer Vision Market, By Format, 2019-2028 (USD Million)

TABLE 126 Europe Cameras in Computer Vision Market, By Sensor Type, 2019-2028 (USD Million)

TABLE 127 Europe Processors in Computer Vision Market, By Component, 2019-2028 (USD Million)

TABLE 128 Europe Computer Vision Market, By Application, 2019-2028 (USD Million)

TABLE 129 Europe Computer Vision Market, By Vertical, 2019-2028 (USD Million)

TABLE 130 Europe Industrial in Computer Vision Market, By Vertical, 2019-2028 (USD Million)

TABLE 131 Europe Non Industrial in Computer Vision Market, By Vertical, 2019-2028 (USD Million)

TABLE 132 Europe Computer Vision Market, By Product, 2019-2028 (USD Million)

TABLE 133 U.K. Computer Vision Market, By Component, 2019-2028 (USD Million)

TABLE 134 U.K. Software in Computer Vision Market, By Component, 2019-2028 (USD Million)

TABLE 135 U.K. Hardware in Computer Vision Market, By Component, 2019-2028 (USD Million)

TABLE 136 U.K. Cameras in Computer Vision Market, By Interface Standards, 2019-2028 (USD Million)

TABLE 137 U.K. Cameras in Computer Vision Market, By Frame Rate, 2019-2028 (USD Million)

TABLE 138 U.K. Cameras in Computer Vision Market, By Format, 2019-2028 (USD Million)

TABLE 139 U.K. Cameras in Computer Vision Market, By Sensor Type, 2019-2028 (USD Million)

TABLE 140 U.K. Processors in Computer Vision Market, By Component, 2019-2028 (USD Million)

TABLE 141 U.K. Computer Vision Market, By Application, 2019-2028 (USD Million)

TABLE 142 U.K. Computer Vision Market, By Vertical, 2019-2028 (USD Million)

TABLE 143 U.K. Industrial in Computer Vision Market, By Vertical, 2019-2028 (USD Million)

TABLE 144 U.K. Non Industrial in Computer Vision Market, By Vertical, 2019-2028 (USD Million)

TABLE 145 U.K. Computer Vision Market, By Product, 2019-2028 (USD Million)

TABLE 146 Germany Computer Vision Market, By Component, 2019-2028 (USD Million)

TABLE 147 Germany Software in Computer Vision Market, By Component, 2019-2028 (USD Million)

TABLE 148 Germany Hardware in Computer Vision Market, By Component, 2019-2028 (USD Million)

TABLE 149 Germany Cameras in Computer Vision Market, By Interface Standards, 2019-2028 (USD Million)

TABLE 150 Germany Cameras in Computer Vision Market, By Frame Rate, 2019-2028 (USD Million)

TABLE 151 Germany Cameras in Computer Vision Market, By Format, 2019-2028 (USD Million)

TABLE 152 Germany Cameras in Computer Vision Market, By Sensor Type, 2019-2028 (USD Million)

TABLE 153 Germany Processors in Computer Vision Market, By Component, 2019-2028 (USD Million)

TABLE 154 Germany Computer Vision Market, By Application, 2019-2028 (USD Million)

TABLE 155 Germany Computer Vision Market, By Vertical, 2019-2028 (USD Million)

TABLE 156 Germany Industrial in Computer Vision Market, By Vertical, 2019-2028 (USD Million)

TABLE 157 Germany Non Industrial in Computer Vision Market, By Vertical, 2019-2028 (USD Million)

TABLE 158 Germany Computer Vision Market, By Product, 2019-2028 (USD Million)

TABLE 159 France Computer Vision Market, By Component, 2019-2028 (USD Million)

TABLE 160 France Software in Computer Vision Market, By Component, 2019-2028 (USD Million)

TABLE 161 France Hardware in Computer Vision Market, By Component, 2019-2028 (USD Million)

TABLE 162 France Cameras in Computer Vision Market, By Interface Standards, 2019-2028 (USD Million)

TABLE 163 France Cameras in Computer Vision Market, By Frame Rate, 2019-2028 (USD Million)

TABLE 164 France Cameras in Computer Vision Market, By Format, 2019-2028 (USD Million)

TABLE 165 France Cameras in Computer Vision Market, By Sensor Type, 2019-2028 (USD Million)

TABLE 166 France Processors in Computer Vision Market, By Component, 2019-2028 (USD Million)

TABLE 167 France Computer Vision Market, By Application, 2019-2028 (USD Million)

TABLE 168 France Computer Vision Market, By Vertical, 2019-2028 (USD Million)

TABLE 169 France Industrial in Computer Vision Market, By Vertical, 2019-2028 (USD Million)

TABLE 170 France Non Industrial in Computer Vision Market, By Vertical, 2019-2028 (USD Million)

TABLE 171 France Computer Vision Market, By Product, 2019-2028 (USD Million)

TABLE 172 Italy Computer Vision Market, By Component, 2019-2028 (USD Million)

TABLE 173 Italy Software in Computer Vision Market, By Component, 2019-2028 (USD Million)

TABLE 174 Italy Hardware in Computer Vision Market, By Component, 2019-2028 (USD Million)

TABLE 175 Italy Cameras in Computer Vision Market, By Interface Standards, 2019-2028 (USD Million)

TABLE 176 Italy Cameras in Computer Vision Market, By Frame Rate, 2019-2028 (USD Million)

TABLE 177 Italy Cameras in Computer Vision Market, By Format, 2019-2028 (USD Million)

TABLE 178 Italy Cameras in Computer Vision Market, By Sensor Type, 2019-2028 (USD Million)

TABLE 179 Italy Processors in Computer Vision Market, By Component, 2019-2028 (USD Million)

TABLE 180 Italy Computer Vision Market, By Application, 2019-2028 (USD Million)

TABLE 181 Italy Computer Vision Market, By Vertical, 2019-2028 (USD Million)

TABLE 182 Italy Industrial in Computer Vision Market, By Vertical, 2019-2028 (USD Million)

TABLE 183 Italy Non Industrial in Computer Vision Market, By Vertical, 2019-2028 (USD Million)

TABLE 184 Italy Computer Vision Market, By Product, 2019-2028 (USD Million)

TABLE 185 Spain Computer Vision Market, By Component, 2019-2028 (USD Million)

TABLE 186 Spain Software in Computer Vision Market, By Component, 2019-2028 (USD Million)

TABLE 187 Spain Hardware in Computer Vision Market, By Component, 2019-2028 (USD Million)

TABLE 188 Spain Cameras in Computer Vision Market, By Interface Standards, 2019-2028 (USD Million)

TABLE 189 Spain Cameras in Computer Vision Market, By Frame Rate, 2019-2028 (USD Million)

TABLE 190 Spain Cameras in Computer Vision Market, By Format, 2019-2028 (USD Million)

TABLE 191 Spain Cameras in Computer Vision Market, By Sensor Type, 2019-2028 (USD Million)

TABLE 192 Spain Processors in Computer Vision Market, By Component, 2019-2028 (USD Million)

TABLE 193 Spain Computer Vision Market, By Application, 2019-2028 (USD Million)

TABLE 194 Spain Computer Vision Market, By Vertical, 2019-2028 (USD Million)

TABLE 195 Spain Industrial in Computer Vision Market, By Vertical, 2019-2028 (USD Million)

TABLE 196 Spain Non Industrial in Computer Vision Market, By Vertical, 2019-2028 (USD Million)

TABLE 197 Spain Computer Vision Market, By Product, 2019-2028 (USD Million)

TABLE 198 Netherlands Computer Vision Market, By Component, 2019-2028 (USD Million)

TABLE 199 Netherlands Software in Computer Vision Market, By Component, 2019-2028 (USD Million)

TABLE 200 Netherlands Hardware in Computer Vision Market, By Component, 2019-2028 (USD Million)

TABLE 201 Netherlands Cameras in Computer Vision Market, By Interface Standards, 2019-2028 (USD Million)

TABLE 202 Netherlands Cameras in Computer Vision Market, By Frame Rate, 2019-2028 (USD Million)

TABLE 203 Netherlands Cameras in Computer Vision Market, By Format, 2019-2028 (USD Million)

TABLE 204 Netherlands Cameras in Computer Vision Market, By Sensor Type, 2019-2028 (USD Million)

TABLE 205 Netherlands Processors in Computer Vision Market, By Component, 2019-2028 (USD Million)

TABLE 206 Netherlands Computer Vision Market, By Application, 2019-2028 (USD Million)

TABLE 207 Netherlands Computer Vision Market, By Vertical, 2019-2028 (USD Million)

TABLE 208 Netherlands Industrial in Computer Vision Market, By Vertical, 2019-2028 (USD Million)

TABLE 209 Netherlands Non Industrial in Computer Vision Market, By Vertical, 2019-2028 (USD Million)

TABLE 210 Netherlands Computer Vision Market, By Product, 2019-2028 (USD Million)

TABLE 211 Switzerland Computer Vision Market, By Component, 2019-2028 (USD Million)

TABLE 212 Switzerland Software in Computer Vision Market, By Component, 2019-2028 (USD Million)

TABLE 213 Switzerland Hardware in Computer Vision Market, By Component, 2019-2028 (USD Million)

TABLE 214 Switzerland Cameras in Computer Vision Market, By Interface Standards, 2019-2028 (USD Million)

TABLE 215 Switzerland Cameras in Computer Vision Market, By Frame Rate, 2019-2028 (USD Million)

TABLE 216 Switzerland Cameras in Computer Vision Market, By Format, 2019-2028 (USD Million)

TABLE 217 Switzerland Cameras in Computer Vision Market, By Sensor Type, 2019-2028 (USD Million)

TABLE 218 Switzerland Processors in Computer Vision Market, By Component, 2019-2028 (USD Million)

TABLE 219 Switzerland Computer Vision Market, By Application, 2019-2028 (USD Million)

TABLE 220 Switzerland Computer Vision Market, By Vertical, 2019-2028 (USD Million)

TABLE 221 Switzerland Industrial in Computer Vision Market, By Vertical, 2019-2028 (USD Million)

TABLE 222 Switzerland Non Industrial in Computer Vision Market, By Vertical, 2019-2028 (USD Million)

TABLE 223 Switzerland Computer Vision Market, By Product, 2019-2028 (USD Million)

TABLE 224 Belgium Computer Vision Market, By Component, 2019-2028 (USD Million)

TABLE 225 Belgium Software in Computer Vision Market, By Component, 2019-2028 (USD Million)

TABLE 226 Belgium Hardware in Computer Vision Market, By Component, 2019-2028 (USD Million)

TABLE 227 Belgium Cameras in Computer Vision Market, By Interface Standards, 2019-2028 (USD Million)

TABLE 228 Belgium Cameras in Computer Vision Market, By Frame Rate, 2019-2028 (USD Million)

TABLE 229 Belgium Cameras in Computer Vision Market, By Format, 2019-2028 (USD Million)

TABLE 230 Belgium Cameras in Computer Vision Market, By Sensor Type, 2019-2028 (USD Million)

TABLE 231 Belgium Processors in Computer Vision Market, By Component, 2019-2028 (USD Million)

TABLE 232 Belgium Computer Vision Market, By Application, 2019-2028 (USD Million)

TABLE 233 Belgium Computer Vision Market, By Vertical, 2019-2028 (USD Million)

TABLE 234 Belgium Industrial in Computer Vision Market, By Vertical, 2019-2028 (USD Million)

TABLE 235 Belgium Non Industrial in Computer Vision Market, By Vertical, 2019-2028 (USD Million)

TABLE 236 Belgium Computer Vision Market, By Product, 2019-2028 (USD Million)

TABLE 237 Russia Computer Vision Market, By Component, 2019-2028 (USD Million)

TABLE 238 Russia Software in Computer Vision Market, By Component, 2019-2028 (USD Million)

TABLE 239 Russia Hardware in Computer Vision Market, By Component, 2019-2028 (USD Million)

TABLE 240 Russia Cameras in Computer Vision Market, By Interface Standards, 2019-2028 (USD Million)

TABLE 241 Russia Cameras in Computer Vision Market, By Frame Rate, 2019-2028 (USD Million)

TABLE 242 Russia Cameras in Computer Vision Market, By Format, 2019-2028 (USD Million)

TABLE 243 Russia Cameras in Computer Vision Market, By Sensor Type, 2019-2028 (USD Million)

TABLE 244 Russia Processors in Computer Vision Market, By Component, 2019-2028 (USD Million)

TABLE 245 Russia Computer Vision Market, By Application, 2019-2028 (USD Million)

TABLE 246 Russia Computer Vision Market, By Vertical, 2019-2028 (USD Million)

TABLE 247 Russia Industrial in Computer Vision Market, By Vertical, 2019-2028 (USD Million)

TABLE 248 Russia Non Industrial in Computer Vision Market, By Vertical, 2019-2028 (USD Million)

TABLE 249 Russia Computer Vision Market, By Product, 2019-2028 (USD Million)

TABLE 250 Turkey Computer Vision Market, By Component, 2019-2028 (USD Million)

TABLE 251 Turkey Software in Computer Vision Market, By Component, 2019-2028 (USD Million)

TABLE 252 Turkey Hardware in Computer Vision Market, By Component, 2019-2028 (USD Million)

TABLE 253 Turkey Cameras in Computer Vision Market, By Interface Standards, 2019-2028 (USD Million)

TABLE 254 Turkey Cameras in Computer Vision Market, By Frame Rate, 2019-2028 (USD Million)

TABLE 255 Turkey Cameras in Computer Vision Market, By Format, 2019-2028 (USD Million)

TABLE 256 Turkey Cameras in Computer Vision Market, By Sensor Type, 2019-2028 (USD Million)

TABLE 257 Turkey Processors in Computer Vision Market, By Component, 2019-2028 (USD Million)

TABLE 258 Turkey Computer Vision Market, By Application, 2019-2028 (USD Million)

TABLE 259 Turkey Computer Vision Market, By Vertical, 2019-2028 (USD Million)

TABLE 260 Turkey Industrial in Computer Vision Market, By Vertical, 2019-2028 (USD Million)

TABLE 261 Turkey Non Industrial in Computer Vision Market, By Vertical, 2019-2028 (USD Million)

TABLE 262 Turkey Computer Vision Market, By Product, 2019-2028 (USD Million)

TABLE 263 Rest of Europe Computer Vision Market, By Component, 2019-2028 (USD Million)

TABLE 264 Asia-Pacific Computer Vision Market, By Country, 2019-2028 (USD Million)

TABLE 265 Asia-Pacific Computer Vision Market, By Component, 2019-2028 (USD Million)

TABLE 266 Asia-Pacific Software in Computer Vision Market, By Component, 2019-2028 (USD Million)

TABLE 267 Asia-Pacific Hardware in Computer Vision Market, By Component, 2019-2028 (USD Million)

TABLE 268 Asia-Pacific Cameras in Computer Vision Market, By Interface Standards, 2019-2028 (USD Million)

TABLE 269 Asia-Pacific Cameras in Computer Vision Market, By Frame Rate, 2019-2028 (USD Million)

TABLE 270 Asia-Pacific Cameras in Computer Vision Market, By Format, 2019-2028 (USD Million)

TABLE 271 Asia-Pacific Cameras in Computer Vision Market, By Sensor Type, 2019-2028 (USD Million)

TABLE 272 Asia-Pacific Processors in Computer Vision Market, By Component, 2019-2028 (USD Million)

TABLE 273 Asia-Pacific Computer Vision Market, By Application, 2019-2028 (USD Million)

TABLE 274 Asia-Pacific Computer Vision Market, By Vertical, 2019-2028 (USD Million)

TABLE 275 Asia-Pacific Industrial in Computer Vision Market, By Vertical, 2019-2028 (USD Million)

TABLE 276 Asia-Pacific Non Industrial in Computer Vision Market, By Vertical, 2019-2028 (USD Million)

TABLE 277 Asia-Pacific Computer Vision Market, By Product, 2019-2028 (USD Million)

TABLE 278 China Computer Vision Market, By Component, 2019-2028 (USD Million)

TABLE 279 China Software in Computer Vision Market, By Component, 2019-2028 (USD Million)

TABLE 280 China Hardware in Computer Vision Market, By Component, 2019-2028 (USD Million)

TABLE 281 China Cameras in Computer Vision Market, By Interface Standards, 2019-2028 (USD Million)

TABLE 282 China Cameras in Computer Vision Market, By Frame Rate, 2019-2028 (USD Million)

TABLE 283 China Cameras in Computer Vision Market, By Format, 2019-2028 (USD Million)

TABLE 284 China Cameras in Computer Vision Market, By Sensor Type, 2019-2028 (USD Million)

TABLE 285 China Processors in Computer Vision Market, By Component, 2019-2028 (USD Million)

TABLE 286 China Computer Vision Market, By Application, 2019-2028 (USD Million)

TABLE 287 China Computer Vision Market, By Vertical, 2019-2028 (USD Million)

TABLE 288 China Industrial in Computer Vision Market, By Vertical, 2019-2028 (USD Million)

TABLE 289 China Non Industrial in Computer Vision Market, By Vertical, 2019-2028 (USD Million)

TABLE 290 China Computer Vision Market, By Product, 2019-2028 (USD Million)

TABLE 291 Japan Computer Vision Market, By Component, 2019-2028 (USD Million)

TABLE 292 Japan Software in Computer Vision Market, By Component, 2019-2028 (USD Million)

TABLE 293 Japan Hardware in Computer Vision Market, By Component, 2019-2028 (USD Million)

TABLE 294 Japan Cameras in Computer Vision Market, By Interface Standards, 2019-2028 (USD Million)

TABLE 295 Japan Cameras in Computer Vision Market, By Frame Rate, 2019-2028 (USD Million)

TABLE 296 Japan Cameras in Computer Vision Market, By Format, 2019-2028 (USD Million)

TABLE 297 Japan Cameras in Computer Vision Market, By Sensor Type, 2019-2028 (USD Million)

TABLE 298 Japan Processors in Computer Vision Market, By Component, 2019-2028 (USD Million)

TABLE 299 Japan Computer Vision Market, By Application, 2019-2028 (USD Million)

TABLE 300 Japan Computer Vision Market, By Vertical, 2019-2028 (USD Million)

TABLE 301 Japan Industrial in Computer Vision Market, By Vertical, 2019-2028 (USD Million)

TABLE 302 Japan Non Industrial in Computer Vision Market, By Vertical, 2019-2028 (USD Million)

TABLE 303 Japan Computer Vision Market, By Product, 2019-2028 (USD Million)

TABLE 304 South Korea Computer Vision Market, By Component, 2019-2028 (USD Million)

TABLE 305 South Korea Software in Computer Vision Market, By Component, 2019-2028 (USD Million)

TABLE 306 South Korea Hardware in Computer Vision Market, By Component, 2019-2028 (USD Million)

TABLE 307 South Korea Cameras in Computer Vision Market, By Interface Standards, 2019-2028 (USD Million)

TABLE 308 South Korea Cameras in Computer Vision Market, By Frame Rate, 2019-2028 (USD Million)

TABLE 309 South Korea Cameras in Computer Vision Market, By Format, 2019-2028 (USD Million)

TABLE 310 South Korea Cameras in Computer Vision Market, By Sensor Type, 2019-2028 (USD Million)

TABLE 311 South Korea Processors in Computer Vision Market, By Component, 2019-2028 (USD Million)

TABLE 312 South Korea Computer Vision Market, By Application, 2019-2028 (USD Million)

TABLE 313 South Korea Computer Vision Market, By Vertical, 2019-2028 (USD Million)

TABLE 314 South Korea Industrial in Computer Vision Market, By Vertical, 2019-2028 (USD Million)

TABLE 315 South Korea Non Industrial in Computer Vision Market, By Vertical, 2019-2028 (USD Million)

TABLE 316 South Korea Computer Vision Market, By Product, 2019-2028 (USD Million)

TABLE 317 India Computer Vision Market, By Component, 2019-2028 (USD Million)

TABLE 318 India Software in Computer Vision Market, By Component, 2019-2028 (USD Million)

TABLE 319 India Hardware in Computer Vision Market, By Component, 2019-2028 (USD Million)

TABLE 320 India Cameras in Computer Vision Market, By Interface Standards, 2019-2028 (USD Million)

TABLE 321 India Cameras in Computer Vision Market, By Frame Rate, 2019-2028 (USD Million)

TABLE 322 India Cameras in Computer Vision Market, By Format, 2019-2028 (USD Million)

TABLE 323 India Cameras in Computer Vision Market, By Sensor Type, 2019-2028 (USD Million)

TABLE 324 India Processors in Computer Vision Market, By Component, 2019-2028 (USD Million)

TABLE 325 India Computer Vision Market, By Application, 2019-2028 (USD Million)

TABLE 326 India Computer Vision Market, By Vertical, 2019-2028 (USD Million)

TABLE 327 India Industrial in Computer Vision Market, By Vertical, 2019-2028 (USD Million)

TABLE 328 India Non Industrial in Computer Vision Market, By Vertical, 2019-2028 (USD Million)

TABLE 329 India Computer Vision Market, By Product, 2019-2028 (USD Million)

TABLE 330 Australia Computer Vision Market, By Component, 2019-2028 (USD Million)

TABLE 331 Australia Software in Computer Vision Market, By Component, 2019-2028 (USD Million)

TABLE 332 Australia Hardware in Computer Vision Market, By Component, 2019-2028 (USD Million)

TABLE 333 Australia Cameras in Computer Vision Market, By Interface Standards, 2019-2028 (USD Million)

TABLE 334 Australia Cameras in Computer Vision Market, By Frame Rate, 2019-2028 (USD Million)

TABLE 335 Australia Cameras in Computer Vision Market, By Format, 2019-2028 (USD Million)

TABLE 336 Australia Cameras in Computer Vision Market, By Sensor Type, 2019-2028 (USD Million)

TABLE 337 Australia Processors in Computer Vision Market, By Component, 2019-2028 (USD Million)

TABLE 338 Australia Computer Vision Market, By Application, 2019-2028 (USD Million)

TABLE 339 Australia Computer Vision Market, By Vertical, 2019-2028 (USD Million)

TABLE 340 Australia Industrial in Computer Vision Market, By Vertical, 2019-2028 (USD Million)

TABLE 341 Australia Non Industrial in Computer Vision Market, By Vertical, 2019-2028 (USD Million)

TABLE 342 Australia Computer Vision Market, By Product, 2019-2028 (USD Million)

TABLE 343 Singapore Computer Vision Market, By Component, 2019-2028 (USD Million)

TABLE 344 Singapore Software in Computer Vision Market, By Component, 2019-2028 (USD Million)

TABLE 345 Singapore Hardware in Computer Vision Market, By Component, 2019-2028 (USD Million)

TABLE 346 Singapore Cameras in Computer Vision Market, By Interface Standards, 2019-2028 (USD Million)

TABLE 347 Singapore Cameras in Computer Vision Market, By Frame Rate, 2019-2028 (USD Million)

TABLE 348 Singapore Cameras in Computer Vision Market, By Format, 2019-2028 (USD Million)

TABLE 349 Singapore Cameras in Computer Vision Market, By Sensor Type, 2019-2028 (USD Million)

TABLE 350 Singapore Processors in Computer Vision Market, By Component, 2019-2028 (USD Million)

TABLE 351 Singapore Computer Vision Market, By Application, 2019-2028 (USD Million)

TABLE 352 Singapore Computer Vision Market, By Vertical, 2019-2028 (USD Million)

TABLE 353 Singapore Industrial in Computer Vision Market, By Vertical, 2019-2028 (USD Million)

TABLE 354 Singapore Non Industrial in Computer Vision Market, By Vertical, 2019-2028 (USD Million)

TABLE 355 Singapore Computer Vision Market, By Product, 2019-2028 (USD Million)

TABLE 356 Indonesia Computer Vision Market, By Component, 2019-2028 (USD Million)

TABLE 357 Indonesia Software in Computer Vision Market, By Component, 2019-2028 (USD Million)

TABLE 358 Indonesia Hardware in Computer Vision Market, By Component, 2019-2028 (USD Million)

TABLE 359 Indonesia Cameras in Computer Vision Market, By Interface Standards, 2019-2028 (USD Million)

TABLE 360 Indonesia Cameras in Computer Vision Market, By Frame Rate, 2019-2028 (USD Million)

TABLE 361 Indonesia Cameras in Computer Vision Market, By Format, 2019-2028 (USD Million)

TABLE 362 Indonesia Cameras in Computer Vision Market, By Sensor Type, 2019-2028 (USD Million)

TABLE 363 Indonesia Processors in Computer Vision Market, By Component, 2019-2028 (USD Million)

TABLE 364 Indonesia Computer Vision Market, By Application, 2019-2028 (USD Million)

TABLE 365 Indonesia Computer Vision Market, By Vertical, 2019-2028 (USD Million)

TABLE 366 Indonesia Industrial in Computer Vision Market, By Vertical, 2019-2028 (USD Million)

TABLE 367 Indonesia Non Industrial in Computer Vision Market, By Vertical, 2019-2028 (USD Million)

TABLE 368 Indonesia Computer Vision Market, By Product, 2019-2028 (USD Million)

TABLE 369 Malaysia Computer Vision Market, By Component, 2019-2028 (USD Million)

TABLE 370 Malaysia Software in Computer Vision Market, By Component, 2019-2028 (USD Million)

TABLE 371 Malaysia Hardware in Computer Vision Market, By Component, 2019-2028 (USD Million)

TABLE 372 Malaysia Cameras in Computer Vision Market, By Interface Standards, 2019-2028 (USD Million)

TABLE 373 Malaysia Cameras in Computer Vision Market, By Frame Rate, 2019-2028 (USD Million)

TABLE 374 Malaysia Cameras in Computer Vision Market, By Format, 2019-2028 (USD Million)

TABLE 375 Malaysia Cameras in Computer Vision Market, By Sensor Type, 2019-2028 (USD Million)

TABLE 376 Malaysia Processors in Computer Vision Market, By Component, 2019-2028 (USD Million)

TABLE 377 Malaysia Computer Vision Market, By Application, 2019-2028 (USD Million)

TABLE 378 Malaysia Computer Vision Market, By Vertical, 2019-2028 (USD Million)

TABLE 379 Malaysia Industrial in Computer Vision Market, By Vertical, 2019-2028 (USD Million)

TABLE 380 Malaysia Non Industrial in Computer Vision Market, By Vertical, 2019-2028 (USD Million)

TABLE 381 Malaysia Computer Vision Market, By Product, 2019-2028 (USD Million)

TABLE 382 Thailand Computer Vision Market, By Component, 2019-2028 (USD Million)

TABLE 383 Thailand Software in Computer Vision Market, By Component, 2019-2028 (USD Million)

TABLE 384 Thailand Hardware in Computer Vision Market, By Component, 2019-2028 (USD Million)

TABLE 385 Thailand Cameras in Computer Vision Market, By Interface Standards, 2019-2028 (USD Million)

TABLE 386 Thailand Cameras in Computer Vision Market, By Frame Rate, 2019-2028 (USD Million)

TABLE 387 Thailand Cameras in Computer Vision Market, By Format, 2019-2028 (USD Million)

TABLE 388 Thailand Cameras in Computer Vision Market, By Sensor Type, 2019-2028 (USD Million)

TABLE 389 Thailand Processors in Computer Vision Market, By Component, 2019-2028 (USD Million)

TABLE 390 Thailand Computer Vision Market, By Application, 2019-2028 (USD Million)

TABLE 391 Thailand Computer Vision Market, By Vertical, 2019-2028 (USD Million)

TABLE 392 Thailand Industrial in Computer Vision Market, By Vertical, 2019-2028 (USD Million)

TABLE 393 Thailand Non Industrial in Computer Vision Market, By Vertical, 2019-2028 (USD Million)

TABLE 394 Thailand Computer Vision Market, By Product, 2019-2028 (USD Million)

TABLE 395 Philippines Computer Vision Market, By Component, 2019-2028 (USD Million)

TABLE 396 Philippines Software in Computer Vision Market, By Component, 2019-2028 (USD Million)

TABLE 397 Philippines Hardware in Computer Vision Market, By Component, 2019-2028 (USD Million)

TABLE 398 Philippines Cameras in Computer Vision Market, By Interface Standards, 2019-2028 (USD Million)

TABLE 399 Philippines Cameras in Computer Vision Market, By Frame Rate, 2019-2028 (USD Million)

TABLE 400 Philippines Cameras in Computer Vision Market, By Format, 2019-2028 (USD Million)

TABLE 401 Philippines Cameras in Computer Vision Market, By Sensor Type, 2019-2028 (USD Million)

TABLE 402 Philippines Processors in Computer Vision Market, By Component, 2019-2028 (USD Million)

TABLE 403 Philippines Computer Vision Market, By Application, 2019-2028 (USD Million)

TABLE 404 Philippines Computer Vision Market, By Vertical, 2019-2028 (USD Million)

TABLE 405 Philippines Industrial in Computer Vision Market, By Vertical, 2019-2028 (USD Million)

TABLE 406 Philippines Non Industrial in Computer Vision Market, By Vertical, 2019-2028 (USD Million)

TABLE 407 Philippines Computer Vision Market, By Product, 2019-2028 (USD Million)

TABLE 408 Rest of Asia-Pacific Computer Vision Market, By Component, 2019-2028 (USD Million)

TABLE 409 Middle East & Africa Computer Vision Market, By Country, 2019-2028 (USD Million)

TABLE 410 Middle East & Africa Computer Vision Market, By Component, 2019-2028 (USD Million)

TABLE 411 Middle East & Africa Software in Computer Vision Market, By Component, 2019-2028 (USD Million)

TABLE 412 Middle East & Africa Hardware in Computer Vision Market, By Component, 2019-2028 (USD Million)

TABLE 413 Middle East & Africa Cameras in Computer Vision Market, By Interface Standards, 2019-2028 (USD Million)

TABLE 414 Middle East & Africa Cameras in Computer Vision Market, By Frame Rate, 2019-2028 (USD Million)

TABLE 415 Middle East & Africa Cameras in Computer Vision Market, By Format, 2019-2028 (USD Million)

TABLE 416 Middle East & Africa Cameras in Computer Vision Market, By Sensor Type, 2019-2028 (USD Million)

TABLE 417 Middle East & Africa Processors in Computer Vision Market, By Component, 2019-2028 (USD Million)

TABLE 418 Middle East & Africa Computer Vision Market, By Application, 2019-2028 (USD Million)

TABLE 419 Middle East & Africa Computer Vision Market, By Vertical, 2019-2028 (USD Million)

TABLE 420 Middle East & Africa Industrial in Computer Vision Market, By Vertical, 2019-2028 (USD Million)

TABLE 421 Middle East & Africa Non Industrial in Computer Vision Market, By Vertical, 2019-2028 (USD Million)

TABLE 422 Middle East & Africa Computer Vision Market, By Product, 2019-2028 (USD Million)

TABLE 423 Saudi Arabia Computer Vision Market, By Component, 2019-2028 (USD Million)

TABLE 424 Saudi Arabia Software in Computer Vision Market, By Component, 2019-2028 (USD Million)

TABLE 425 Saudi Arabia Hardware in Computer Vision Market, By Component, 2019-2028 (USD Million)

TABLE 426 Saudi Arabia Cameras in Computer Vision Market, By Interface Standards, 2019-2028 (USD Million)

TABLE 427 Saudi Arabia Cameras in Computer Vision Market, By Frame Rate, 2019-2028 (USD Million)

TABLE 428 Saudi Arabia Cameras in Computer Vision Market, By Format, 2019-2028 (USD Million)

TABLE 429 Saudi Arabia Cameras in Computer Vision Market, By Sensor Type, 2019-2028 (USD Million)

TABLE 430 Saudi Arabia Processors in Computer Vision Market, By Component, 2019-2028 (USD Million)

TABLE 431 Saudi Arabia Computer Vision Market, By Application, 2019-2028 (USD Million)

TABLE 432 Saudi Arabia Computer Vision Market, By Vertical, 2019-2028 (USD Million)

TABLE 433 Saudi Arabia Industrial in Computer Vision Market, By Vertical, 2019-2028 (USD Million)

TABLE 434 Saudi Arabia Non Industrial in Computer Vision Market, By Vertical, 2019-2028 (USD Million)

TABLE 435 Saudi Arabia Computer Vision Market, By Product, 2019-2028 (USD Million)

TABLE 436 U.A.E. Computer Vision Market, By Component, 2019-2028 (USD Million)

TABLE 437 U.A.E. Software in Computer Vision Market, By Component, 2019-2028 (USD Million)

TABLE 438 U.A.E. Hardware in Computer Vision Market, By Component, 2019-2028 (USD Million)

TABLE 439 U.A.E. Cameras in Computer Vision Market, By Interface Standards, 2019-2028 (USD Million)

TABLE 440 U.A.E. Cameras in Computer Vision Market, By Frame Rate, 2019-2028 (USD Million)

TABLE 441 U.A.E. Cameras in Computer Vision Market, By Format, 2019-2028 (USD Million)

TABLE 442 U.A.E. Cameras in Computer Vision Market, By Sensor Type, 2019-2028 (USD Million)

TABLE 443 U.A.E. Processors in Computer Vision Market, By Component, 2019-2028 (USD Million)

TABLE 444 U.A.E. Computer Vision Market, By Application, 2019-2028 (USD Million)

TABLE 445 U.A.E. Computer Vision Market, By Vertical, 2019-2028 (USD Million)

TABLE 446 U.A.E. Industrial in Computer Vision Market, By Vertical, 2019-2028 (USD Million)

TABLE 447 U.A.E. Non Industrial in Computer Vision Market, By Vertical, 2019-2028 (USD Million)

TABLE 448 U.A.E. Computer Vision Market, By Product, 2019-2028 (USD Million)

TABLE 449 Israel Computer Vision Market, By Component, 2019-2028 (USD Million)

TABLE 450 Israel Software in Computer Vision Market, By Component, 2019-2028 (USD Million)

TABLE 451 Israel Hardware in Computer Vision Market, By Component, 2019-2028 (USD Million)

TABLE 452 Israel Cameras in Computer Vision Market, By Interface Standards, 2019-2028 (USD Million)

TABLE 453 Israel Cameras in Computer Vision Market, By Frame Rate, 2019-2028 (USD Million)

TABLE 454 Israel Cameras in Computer Vision Market, By Format, 2019-2028 (USD Million)

TABLE 455 Israel Cameras in Computer Vision Market, By Sensor Type, 2019-2028 (USD Million)

TABLE 456 Israel Processors in Computer Vision Market, By Component, 2019-2028 (USD Million)

TABLE 457 Israel Computer Vision Market, By Application, 2019-2028 (USD Million)

TABLE 458 Israel Computer Vision Market, By Vertical, 2019-2028 (USD Million)

TABLE 459 Israel Industrial in Computer Vision Market, By Vertical, 2019-2028 (USD Million)

TABLE 460 Israel Non Industrial in Computer Vision Market, By Vertical, 2019-2028 (USD Million)

TABLE 461 Israel Computer Vision Market, By Product, 2019-2028 (USD Million)

TABLE 462 South Africa Computer Vision Market, By Component, 2019-2028 (USD Million)

TABLE 463 South Africa Software in Computer Vision Market, By Component, 2019-2028 (USD Million)

TABLE 464 South Africa Hardware in Computer Vision Market, By Component, 2019-2028 (USD Million)

TABLE 465 South Africa Cameras in Computer Vision Market, By Interface Standards, 2019-2028 (USD Million)

TABLE 466 South Africa Cameras in Computer Vision Market, By Frame Rate, 2019-2028 (USD Million)

TABLE 467 South Africa Cameras in Computer Vision Market, By Format, 2019-2028 (USD Million)

TABLE 468 South Africa Cameras in Computer Vision Market, By Sensor Type, 2019-2028 (USD Million)

TABLE 469 South Africa Processors in Computer Vision Market, By Component, 2019-2028 (USD Million)

TABLE 470 South Africa Computer Vision Market, By Application, 2019-2028 (USD Million)

TABLE 471 South Africa Computer Vision Market, By Vertical, 2019-2028 (USD Million)

TABLE 472 South Africa Industrial in Computer Vision Market, By Vertical, 2019-2028 (USD Million)

TABLE 473 South Africa Non Industrial in Computer Vision Market, By Vertical, 2019-2028 (USD Million)

TABLE 474 South Africa Computer Vision Market, By Product, 2019-2028 (USD Million)

TABLE 475 Egypt Computer Vision Market, By Component, 2019-2028 (USD Million)

TABLE 476 Egypt Software in Computer Vision Market, By Component, 2019-2028 (USD Million)

TABLE 477 Egypt Hardware in Computer Vision Market, By Component, 2019-2028 (USD Million)

TABLE 478 Egypt Cameras in Computer Vision Market, By Interface Standards, 2019-2028 (USD Million)

TABLE 479 Egypt Cameras in Computer Vision Market, By Frame Rate, 2019-2028 (USD Million)

TABLE 480 Egypt Cameras in Computer Vision Market, By Format, 2019-2028 (USD Million)

TABLE 481 Egypt Cameras in Computer Vision Market, By Sensor Type, 2019-2028 (USD Million)

TABLE 482 Egypt Processors in Computer Vision Market, By Component, 2019-2028 (USD Million)

TABLE 483 Egypt Computer Vision Market, By Application, 2019-2028 (USD Million)

TABLE 484 Egypt Computer Vision Market, By Vertical, 2019-2028 (USD Million)

TABLE 485 Egypt Industrial in Computer Vision Market, By Vertical, 2019-2028 (USD Million)

TABLE 486 Egypt Non Industrial in Computer Vision Market, By Vertical, 2019-2028 (USD Million)

TABLE 487 Egypt Computer Vision Market, By Product, 2019-2028 (USD Million)

TABLE 488 Rest of Middle East and Africa Computer Vision Market, By Component, 2019-2028 (USD Million)

図表一覧

FIGURE 1 GLOBAL COMPUTER VISION MARKET: segmentation

FIGURE 2 Global computer vision market: data triangulation

FIGURE 3 Global computer vision market: DROC ANALYSIS

FIGURE 4 Global computer vision market: GLOBAL VS REGIONAL MARKET ANALYSIS

FIGURE 5 Global COMPUTER VISION market: COMPANY RESEARCH ANALYSIS

FIGURE 6 Global COMPUTER VISION market: INTERVIEW DEMOGRAPHICS

FIGURE 7 Global COMPUTER VISION market: DBMR MARKET POSITION GRID

FIGURE 8 Global computer vision market: vendor share analysis

FIGURE 9 GLOBAL computer vision Market: MARKET APPLICATION COVERAGE GRID

FIGURE 10 Global computer vision market: SEGMENTATION

FIGURE 11 Rising adoption of AI using computer vision is EXPECTED TO DRIVE GLOBAL computer vision MARKET IN THE FORECAST PERIOD OF 2021 TO 2028

FIGURE 12 hardware segment is expected to account for the largest share of Global computer vision market in 2021 & 2028

FIGURE 13 North America is expected to DOMINATE THE global computer vision mARKET and growing with the highest cagr IN the forecast period of 2021 to 2028

FIGURE 14 north america is the fastest growing market for computer vision manufacturers in the forecast period of 2021 to 2028

FIGURE 15 DRIVERS, RESTRAINTS, OPPORTUNITIES, AND CHALLENGES OF global computer vision Market

FIGURE 16 Global computer vision MARKET, BY Component, 2020

FIGURE 17 Global Computer vision MARKET, BY Application, 2020

FIGURE 18 Global Computer vision MARKET, BY Vertical, 2020

FIGURE 19 Global Computer vision MARKET: BY product, 2020

FIGURE 20 Global Computer Vision market: SNAPSHOT (2020)

FIGURE 21 Global Computer Vision market: by region (2020)

FIGURE 22 Global Computer Vision market: by Region (2021 & 2028)

FIGURE 23 Global Computer Vision market: by region (2020 & 2028)

FIGURE 24 Global Computer Vision market: by component (2021-2028)

FIGURE 25 NORTH AMERICA computer vision MARKET: SNAPSHOT (2020)

FIGURE 26 NORTH AMERICA computer vision MARKET: by Country (2020)

FIGURE 27 NORTH AMERICA computer vision MARKET: by Country (2021 & 2028)

FIGURE 28 NORTH AMERICA computer vision MARKET: by Country (2020 & 2028)

FIGURE 29 NORTH AMERICA computer vision MARKET: BY COMPONENT (2021-2028)

FIGURE 30 South AMERICA computer vision MARKET: SNAPSHOT (2020)

FIGURE 31 South AMERICA computer vision MARKET: by Country (2020)

FIGURE 32 South AMERICA computer vision MARKET: by Country (2021 & 2028)

FIGURE 33 South AMERICA computer vision MARKET: by Country (2020 & 2028)

FIGURE 34 South AMERICA computer vision MARKET: BY COMPONENT(2021-2028)

FIGURE 35 Europe computer vision MARKET: SNAPSHOT (2020)

FIGURE 36 Europe computer vision MARKET: by Country (2020)

FIGURE 37 Europe computer vision MARKET: by Country (2021 & 2028)

FIGURE 38 Europe computer vision MARKET: by Country (2020 & 2028)

FIGURE 39 EUROPE COMPUTER vision MARKET: BY COMPONENT (2021-2028)

FIGURE 40 Asia-Pacific computer vision MARKET: SNAPSHOT (2020)

FIGURE 41 Asia-Pacific computer vision MARKET: by Country (2020)

FIGURE 42 Asia-Pacific computer vision MARKET: by Country (2021 & 2028)

FIGURE 43 Asia-Pacific computer vision MARKET: by Country (2020 & 2028)

FIGURE 44 Asia-Pacific COMPUTER vision MARKET: BY COMPONENT (2021-2028)

FIGURE 45 Middle East & Africa computer vision MARKET: SNAPSHOT (2020)

FIGURE 46 Middle East & Africa computer vision MARKET: by Country (2020)

FIGURE 47 Middle East & Africa computer vision MARKET: by Country (2021 & 2028)

FIGURE 48 Middle East & Africa computer vision MARKET: by Country (2020 & 2028)

FIGURE 49 Middle East & Africa COMPUTER vision MARKET: BY COMPONENT(2021-2028)

FIGURE 50 global Computer Vision Market: company share 2020 (%)

FIGURE 51 NORTH AMERICA Computer Vision Market: company share 2020 (%)

FIGURE 52 Europe Computer Vision Market: company share 2020 (%)

FIGURE 53 Asia-Pacific Computer Vision Market: company share 2020 (%)

詳細情報を見る Right Arrow

調査方法

データ収集と基準年分析は、大規模なサンプル サイズのデータ​​収集モジュールを使用して行われます。この段階では、さまざまなソースと戦略を通じて市場情報または関連データを取得します。過去に取得したすべてのデータを事前に調査および計画することも含まれます。また、さまざまな情報ソース間で見られる情報の不一致の調査も含まれます。市場データは、市場統計モデルと一貫性モデルを使用して分析および推定されます。また、市場シェア分析と主要トレンド分析は、市場レポートの主要な成功要因です。詳細については、アナリストへの電話をリクエストするか、お問い合わせをドロップダウンしてください。

DBMR 調査チームが使用する主要な調査方法は、データ マイニング、データ変数が市場に与える影響の分析、および一次 (業界の専門家) 検証を含むデータ三角測量です。データ モデルには、ベンダー ポジショニング グリッド、市場タイムライン分析、市場概要とガイド、企業ポジショニング グリッド、特許分析、価格分析、企業市場シェア分析、測定基準、グローバルと地域、ベンダー シェア分析が含まれます。調査方法について詳しくは、お問い合わせフォームから当社の業界専門家にご相談ください。

カスタマイズ可能

Data Bridge Market Research は、高度な形成的調査のリーダーです。当社は、既存および新規のお客様に、お客様の目標に合致し、それに適したデータと分析を提供することに誇りを持っています。レポートは、対象ブランドの価格動向分析、追加国の市場理解 (国のリストをお問い合わせください)、臨床試験結果データ、文献レビュー、リファービッシュ市場および製品ベース分析を含めるようにカスタマイズできます。対象競合他社の市場分析は、技術ベースの分析から市場ポートフォリオ戦略まで分析できます。必要な競合他社のデータを、必要な形式とデータ スタイルでいくつでも追加できます。当社のアナリスト チームは、粗い生の Excel ファイル ピボット テーブル (ファクト ブック) でデータを提供したり、レポートで利用可能なデータ セットからプレゼンテーションを作成するお手伝いをしたりすることもできます。

Frequently Asked Questions

The market is segmented based on , By Components (Hardware, Software, and Service), Product (Smart Camera-based Computer Vision Systems and PC-based Computer Vision Systems), Offering (Deep Learning and Traditional Computer Vision), Application (Quality Assurance and Inspection, Positioning and Guidance, Identification, and Predictive Maintenance), Vertical (Industrial and Non Industrial) – Industry Trends and Forecast to 2031. .
The Global Computer Vision Market size was valued at USD 14.06 USD Billion in 2023.
The Global Computer Vision Market is projected to grow at a CAGR of 8.32% during the forecast period of 2024 to 2031.
The major players operating in the market include Cognex Corporation , Basler AG , OMRON Corporation , KEYENCE CORPORATION , National Instruments Corp , Sony Corporation , Teledyne Technologies , Allied Vision Technologies GmbH , Texas Instruments ,orporated , Intel Corporation , Baumer , JAI , MediaTek, Cadence Design Systems, CEVA, and Synopsys, .
The market report covers data from the U.S., Canada, Mexico, Germany, France, U.K., Netherlands, Switzerland, Belgium, Russia, Italy, Spain, Turkey, Rest of Europe, China, Japan, India, South Korea, Singapore, Malaysia, Australia, Thailand, Indonesia, Philippines, Rest of Asia-Pacific, Saudi Arabia, U.A.E., South Africa, Egypt, Israel, Rest of Middle East and Africa, Brazil, Argentina, and Rest of South America.