

世界の生理活性成分市場規模、シェア、トレンド分析レポート
Market Size in USD Billion
CAGR :
% 
 USD
47.41 Billion
USD
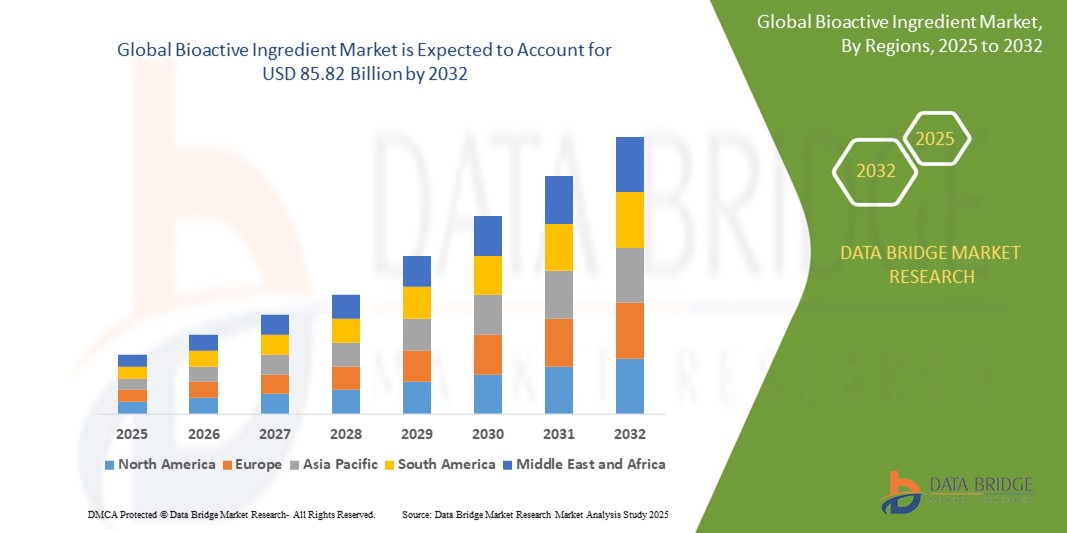
85.82 Billion
2024
2032
USD
47.41 Billion
USD
85.82 Billion
2024
2032
| 2025 –2032 | |
| USD 47.41 Billion | |
| USD 85.82 Billion | |
| % | |
|
世界の生理活性成分市場、成分タイプ別(プレバイオティクス、プロバイオティクス、アミノ酸、ペプチド、オメガ3および構造脂質、植物化学物質および植物抽出物、ミネラル、ビタミン、繊維および特殊炭水化物、カロテノイドおよび抗酸化物質、その他)、用途別(機能性食品、栄養補助食品、グミサプリメント、動物栄養、パーソナルケア、医薬品、その他)、供給源別(植物、動物、微生物) - 2032年までの業界動向および予測。
生理活性成分市場規模
- 世界の生物活性成分市場規模は2024年に474.1億米ドルと評価され、予測期間中に7.70%のCAGRで成長し、2032年までに858.2億米ドル に達すると予想されています。
- 市場の成長は、主に消費者の健康とウェルネスに対する意識の高まり、機能性食品や栄養補助食品の需要の増加、生理活性化合物の抽出および配合技術の進歩によって推進されています。
- パーソナルケアや医薬品用途における天然および持続可能な原料への嗜好の高まりにより、生物活性原料の採用がさらに促進され、健康志向の製品の基礎として位置付けられています。
生理活性成分市場分析
- 健康促進特性を持つ化合物を含む生物活性成分は、機能性食品、栄養補助食品、パーソナルケア製品に不可欠であり、免疫力の向上、消化器系の健康、抗老化効果などのメリットをもたらします。
- 生物活性成分の需要の急増は、予防医療への消費者の関心の高まり、慢性疾患の罹患率の増加、植物由来製品やクリーンラベル製品の採用の増加によって促進されている。
- 北米は、健康・ウェルネス製品への高い消費者支出、主要業界プレーヤーの強力なプレゼンス、そして高度な研究開発インフラに牽引され、2024年には38.5%という最大の市場シェアを獲得しました。米国は、特に機能性食品や栄養補助食品における生物活性成分の採用においてリードしています。
- アジア太平洋地域は、健康意識の高まり、可処分所得の増加、中国やインドなどの国々における急速な都市化によって、予測期間中に最も急速に成長する地域になると予想されています。
- 繊維と特殊炭水化物セグメントは、消化器系の健康、心臓病予防、機能性食品や栄養補助食品などの用途における多用途性における重要な役割により、2024年に24.95%という最大の市場収益シェアを占めました。
レポートの範囲と生理活性成分市場のセグメンテーション
|
属性 |
生理活性成分の主要市場洞察 |
|
対象セグメント |
|
|
対象国 |
北米
ヨーロッパ
アジア太平洋
中東およびアフリカ
南アメリカ
|
|
主要な市場プレーヤー |
|
|
市場機会 |
|
|
付加価値データ情報セット |
データブリッジマーケットリサーチがまとめた市場レポートには、市場価値、成長率、セグメンテーション、地理的範囲、主要プレーヤーなどの市場シナリオに関する洞察に加えて、専門家による詳細な分析、価格設定分析、ブランドシェア分析、消費者調査、人口統計分析、サプライチェーン分析、バリューチェーン分析、原材料/消耗品の概要、ベンダー選択基準、PESTLE分析、ポーター分析、規制の枠組みも含まれています。 |
生理活性成分市場の動向
「AIとビッグデータ分析の統合の拡大」
- 世界の生物活性成分市場では、人工知能(AI)とビッグデータ分析の統合に向けた顕著な傾向が見られます。
- これらの技術により、消費者の健康データ、成分の効能、市場動向の高度な分析が可能になり、製品開発やパーソナライズされた栄養ソリューションに関するより深い洞察が得られます。
- AIを活用したプラットフォームは、消費者の嗜好や健康状態を分析するために開発されており、メーカーは腸の健康や免疫サポートなど、特定の健康効果に合わせて生理活性成分をカスタマイズできるようになっている。
- 例えば、企業はAIを活用して、消費者の食生活パターンや健康データを分析することで、機能性食品や栄養補助食品の配合を最適化し、パーソナライズされた製品を開発しています。
- この傾向により、生理活性成分の価値提案が強化され、健康志向の消費者や栄養補助食品やパーソナルケアなどの業界にとってより魅力的なものになります。
- AIアルゴリズムは、成分の相互作用、バイオアベイラビリティ、消費者のフィードバックに関する膨大なデータセットを処理し、製品の有効性と革新性を向上させることができます。
生理活性成分市場の動向
ドライバ
「機能性食品と予防医療の需要の高まり」
- プロバイオティクス、オメガ3脂肪酸、植物エキスなどの生理活性成分を豊富に含む機能性食品、栄養補助食品、パーソナルケア製品に対する消費者の需要の高まりは、世界の生理活性成分市場の重要な推進力となっています。
- 生理活性成分は、免疫力をサポートし、腸の健康を改善し、炎症を軽減し、肥満や心血管疾患などの慢性疾患に対処することで、健康効果を高めます。
- 特にアジア太平洋やヨーロッパなどの地域では、健康とウェルネスを促進する政府の取り組みにより、食品や医薬品への生物活性成分の採用が奨励されています。
- IoTの普及とサプライチェーン技術の進歩により、生物活性成分の生産と流通が迅速化され、メーカーの拡張性がサポートされています。
- 企業は、消費者の自然で健康増進的なソリューションへの期待に応えるために、植物化学物質や抗酸化物質などの生理活性成分を製品の標準またはプレミアム成分として取り入れるようになっています。
抑制/挑戦
「開発コストの高さと規制遵守への懸念」
- 抽出、配合、試験を含む生物活性成分の研究、開発、生産に必要な多額の初期投資は、特に新興市場の小規模メーカーにとって市場参入の障壁となる可能性がある。
- 機能性食品、サプリメント、パーソナルケア製品に生理活性成分を開発して統合することは、マイクロカプセル化などの高度な技術が必要となるため、複雑でコストがかかる場合があります。
- データセキュリティと規制遵守は大きな課題です。生物活性成分のアプリケーションには、消費者の健康に関する機密データの収集と分析が含まれるため、プライバシー、データ侵害、および欧州のGDPRなどの厳格な規制の遵守に関する懸念が生じます。
- 各国の規制環境は断片化しており、生物活性成分の安全性、有効性、ラベル表示に関する基準が異なっているため、世界中の製造業者やサービスプロバイダーの業務は複雑化しています。
- これらの要因は、特にコストに対する敏感性が高い地域や規制環境が厳しい地域では市場拡大を阻み、価格に敏感な消費者やメーカーによる導入を制限する可能性がある。
生理活性成分市場の展望
市場は、成分タイプ、用途、およびソースに基づいて分類されています。
- 材料の種類別
成分の種類に基づいて、市場はプレバイオティクス、プロバイオティクス、アミノ酸、ペプチド、オメガ3脂肪酸および構造脂質、ファイトケミカルおよび植物抽出物、ミネラル、ビタミン、食物繊維および特殊炭水化物、カロテノイドおよび抗酸化物質、その他に分類されます。食物繊維および特殊炭水化物セグメントは、消化器系の健康、心臓病予防における重要な役割、そして機能性食品や栄養補助食品などの用途における汎用性により、2024年には24.95%という最大の市場収益シェアを獲得しました。2型糖尿病などの慢性疾患リスクを軽減する能力も、需要をさらに押し上げています。
プロバイオティクス分野は、腸内環境への効果に対する消費者の意識の高まりと、機能性食品、飲料、サプリメントへの組み込みの増加を背景に、2025年から2032年にかけて最も高い成長率を達成すると予想されています。微生物技術の進歩と免疫力向上製品の需要が、プロバイオティクスの普及を加速させています。
- アプリケーション別
用途別に見ると、市場は機能性食品、栄養補助食品、グミサプリメント、動物栄養、パーソナルケア、医薬品、その他に分類されます。栄養補助食品セグメントは、予防医療とパーソナライズされた栄養に対する消費者の需要の高まりを背景に、2024年には31.2%の収益シェアで市場を牽引する見込みです。ビタミン、ミネラル、プロバイオティクスを配合したサプリメントは、免疫や消化など、多様な健康ニーズに応えます。
機能性食品セグメントは、健康意識の高まりと、エナジーバー、強化飲料、スナック菓子といった栄養強化製品への需要の高まりを背景に、2025年から2032年にかけて8.1%という最も高い成長率を達成すると予想されています。生理活性化合物の統合におけるイノベーションは、製品の魅力を高め、市場拡大を促進します。
- 出典別
市場は、原料に基づいて植物、動物、微生物の3つに分類されます。植物由来セグメントは、植物性食生活、ビーガン主義、そして果物、野菜、穀物に含まれるファイトケミカルやポリフェノールなどの生理活性化合物の豊富さの人気の高まりにより、2024年には58.7%という最大の市場収益シェアを獲得しました。消費者の天然およびオーガニック原料への嗜好も、このセグメントの成長を牽引しています。
微生物由来原料セグメントは、発酵技術の進歩と、機能性食品やサプリメントにおけるプロバイオティクスなどの微生物由来化合物の利用増加に牽引され、2025年から2032年にかけて大幅な成長が見込まれています。健康用途におけるそれらの拡張性と有効性が市場の成長を牽引しています。
生理活性成分市場の地域分析
- 北米は、健康・ウェルネス製品への高い消費者支出、主要業界プレーヤーの強力なプレゼンス、そして高度な研究開発インフラに牽引され、2024年には38.5%という最大の市場シェアを獲得しました。米国は、特に機能性食品や栄養補助食品における生物活性成分の採用においてリードしています。
- 特に健康意識の高い地域では、消費者は免疫力の向上、消化器系の健康、慢性疾患の予防などの健康上の利点のために、プロバイオティクス、オメガ3脂肪酸、植物抽出物などの生理活性成分を優先しています。
- 成長は、バイオアベイラビリティの向上や新規処方などの成分抽出技術の進歩、機能性食品とパーソナルケア分野での採用の増加によって支えられています。
米国バイオアクティブ成分市場インサイト
米国の生理活性成分市場は、紫外線カットや免疫サポートといった健康効果に対する消費者意識の高まりに牽引され、2024年には北米最大の売上高シェア(75%)を獲得しました。パーソナライズされた栄養補助食品やクリーンラベル製品へのトレンドが市場拡大をさらに後押ししています。ビタミンやプロバイオティクスなどの生理活性成分が小売・医薬品分野の両方で活用されていることも、市場の成長を後押ししています。
欧州の生理活性成分市場に関する洞察
欧州の生理活性成分市場は、食品および化粧品における健康と安全を促進する厳格な規制に支えられ、急速な成長が見込まれています。消費者は、健康増進やアンチエイジング効果をもたらすファイトケミカルや抗酸化物質といった成分を求めています。機能性食品とパーソナルケア製品の成長は顕著で、ドイツやフランスなどの国では、環境問題への関心の高まりや健康志向のライフスタイルの高まりにより、これらの成分の採用が著しく増加しています。
英国の生物活性成分市場に関する洞察
英国の生物活性成分市場は、都市部および郊外における健康と美観を向上させる機能性食品やパーソナルケア製品の需要に牽引され、力強い成長が見込まれています。消化器系の健康や皮膚の保護といったメリットに対する認知度の高まりが、その導入を促進しています。健康に関する主張とコンプライアンスのバランスを取る規制の進化は、消費者の嗜好をさらに形成するでしょう。
ドイツの生理活性成分市場に関する洞察
ドイツでは、食品・医薬品セクターの先進性と、予防医療と健康志向の高い消費者意識により、生理活性成分市場の大幅な成長が見込まれています。ドイツの消費者は、免疫力を高め、慢性疾患のリスクを軽減するペプチドやカロテノイドといった、技術的に高度な成分を好んでいます。これらの成分がプレミアム機能性食品やアフターマーケットサプリメントに取り入れられることで、市場の持続的な成長が期待されます。
アジア太平洋地域の生理活性成分市場に関する洞察
アジア太平洋地域は、中国、インド、日本などの国々における食品・飲料生産の拡大と可処分所得の増加に牽引され、最も高い成長率を達成すると予想されています。免疫サポートや認知機能の向上といった健康効果への意識の高まりにより、プロバイオティクスや植物エキスなどの原料の需要が高まっています。栄養面の健康促進と持続可能な調達を促進する政府の取り組みは、高度な生理活性原料の使用をさらに促進しています。
日本における生理活性成分市場の洞察
日本の生理活性成分市場は、健康とウェルネスを高める高品質で科学的に裏付けられた成分に対する消費者の強い嗜好により、急速な成長が見込まれています。大手食品・医薬品メーカーの存在、そして生理活性ペプチドなどの成分が機能性食品に取り入れられていることが、市場への浸透を加速させています。また、内側から美しくなるサプリメントへの関心の高まりも、成長に貢献しています。
中国バイオアクティブ成分市場インサイト
中国は、急速な都市化、健康意識の高まり、機能性食品や栄養補助食品の需要増加に支えられ、アジア太平洋地域の生理活性成分市場で最大のシェアを占めています。中流階級の増加と予防医療への関心の高さは、食物繊維やオメガ3脂肪酸などの成分の採用を後押ししています。強力な国内製造能力と競争力のある価格設定は、市場へのアクセスを向上させています。
生理活性成分市場シェア
生物活性成分業界は、主に、次のような定評のある企業によって牽引されています。
- DSM(オランダ)
- BASF SE(ドイツ)
- ケリーグループ(アイルランド)
- デュポン(米国)
- ADM(米国)
- エボニック インダストリーズ AG(ドイツ)
- カーギル社(米国)
- Arla Food Ingredients Group P/S(デンマーク)
- FMCコーポレーション(米国)
- サンライズニュートラケムグループ(中国)
- アディセオ(フランス)
- Chr. Hansen A/S(デンマーク)
- サビンサ(米国)
- 味の素株式会社(日本)
- イングレディオン(米国)
世界の生物活性成分市場における最近の動向は何ですか?
- 2025年5月、ジボダン社はアミリス社のバイオテクノロジー資産を買収し、持続可能な原料の開発と事業拡大における専門知識を強化しました。この戦略的買収により、発酵を通じた生理活性原料の創出におけるジボダン社の能力が強化され、自然派で環境に優しい製品に対する消費者の需要の高まりに対応します。この買収には、美容、健康、ウェルネス市場向けの高性能なバイオ発酵原料の製造を可能にするアミリスの高度なバイオ製造技術も含まれます。ジボダン社は、このパートナーシップを活用し、持続可能なソリューションにおけるイノベーションを推進することを目指しています。
- ロンザグループAGは、2025年3月、スイスのフィスプに高活性医薬品有効成分(HPAPI)専用の新施設を開設し、バイオ医薬品の製造能力を強化しました。この拡張は、特に腫瘍学および特殊治療薬における複雑な生理活性分子の需要の高まりに対応します。フィスプの施設には高度な製造設備が備えられており、効率的な医薬品開発と商業供給を可能にします。ロンザのこの投資は、医薬品製造における世界的なリーダーシップを強化し、進化する医療ニーズに対応する最先端のソリューションを確実に提供します。
- 2025年2月、Royal DSMはフランスの大手農業関連企業グループであるAvrilと提携し、食品・飲料業界向けの持続可能なタンパク質原料の開発・商品化を目指します。この提携は、DSMのバイオテクノロジーの専門知識とAvrilの油糧種子加工における伝統を融合させ、革新的な植物由来の生理活性タンパク質の導入を目指します。この提携は、より健康的で環境に優しい食品ソリューションへの高まる需要に対応し、代替タンパク質源の進歩を支援します。DSMとAvrilは、両社の強みを結集することで、栄養価の高い製品を提供するとともに、食品生産における持続可能性の促進を目指します。
- 2023年3月、シムライズは成長を続けるニュートリコスメティクス市場に対応し、「Beauty from Within(内側から美白)」製品ラインに新たなバイオアクティブ成分シリーズを発売しました。このコレクションには、I型コラーゲン、ビタミンCとA、様々な果物由来のポリフェノールなど、天然由来のバイオアクティブ成分が含まれており、肌のアンチエイジング、ブライトニング、ヘアケア、ネイルケアをサポートするように設計されています。これらの成分は、従来のスキンケアルーティンを補完し、内側から外側への美容効果を高めることを目指しています。シムライズのイノベーションは、ホリスティックで持続可能な美容ソリューションを求める消費者のニーズに合致しています。
- 2023年1月、FrieslandCampina IngredientsはTriplebar Bio Inc.と提携し、精密発酵を用いた細胞由来タンパク質の開発と生産拡大を目指します。この協業は、持続可能なタンパク質ソリューションを推進し、高まる栄養イノベーションの需要に応えることを目的としています。FrieslandCampinaは乳タンパク質加工の専門知識を活用し、Triplebarはバイオテクノロジーの力を活かして、人間の健康と栄養をサポートする生理活性タンパク質を創出します。この提携は、将来を見据えた食品技術への両社のコミットメントを強化し、環境への影響を最小限に抑えながら高品質なタンパク質生産を実現します。
SKU-
世界初のマーケットインテリジェンスクラウドに関するレポートにオンラインでアクセスする

- インタラクティブなデータ分析ダッシュボード
- 成長の可能性が高い機会のための企業分析ダッシュボード
- カスタマイズとクエリのためのリサーチアナリストアクセス
- インタラクティブなダッシュボードによる競合分析
- 最新ニュース、更新情報、トレンド分析
- 包括的な競合追跡のためのベンチマーク分析のパワーを活用
調査方法
データ収集と基準年分析は、大規模なサンプル サイズのデータ収集モジュールを使用して行われます。この段階では、さまざまなソースと戦略を通じて市場情報または関連データを取得します。過去に取得したすべてのデータを事前に調査および計画することも含まれます。また、さまざまな情報ソース間で見られる情報の不一致の調査も含まれます。市場データは、市場統計モデルと一貫性モデルを使用して分析および推定されます。また、市場シェア分析と主要トレンド分析は、市場レポートの主要な成功要因です。詳細については、アナリストへの電話をリクエストするか、お問い合わせをドロップダウンしてください。
DBMR 調査チームが使用する主要な調査方法は、データ マイニング、データ変数が市場に与える影響の分析、および一次 (業界の専門家) 検証を含むデータ三角測量です。データ モデルには、ベンダー ポジショニング グリッド、市場タイムライン分析、市場概要とガイド、企業ポジショニング グリッド、特許分析、価格分析、企業市場シェア分析、測定基準、グローバルと地域、ベンダー シェア分析が含まれます。調査方法について詳しくは、お問い合わせフォームから当社の業界専門家にご相談ください。
カスタマイズ可能
Data Bridge Market Research は、高度な形成的調査のリーダーです。当社は、既存および新規のお客様に、お客様の目標に合致し、それに適したデータと分析を提供することに誇りを持っています。レポートは、対象ブランドの価格動向分析、追加国の市場理解 (国のリストをお問い合わせください)、臨床試験結果データ、文献レビュー、リファービッシュ市場および製品ベース分析を含めるようにカスタマイズできます。対象競合他社の市場分析は、技術ベースの分析から市場ポートフォリオ戦略まで分析できます。必要な競合他社のデータを、必要な形式とデータ スタイルでいくつでも追加できます。当社のアナリスト チームは、粗い生の Excel ファイル ピボット テーブル (ファクト ブック) でデータを提供したり、レポートで利用可能なデータ セットからプレゼンテーションを作成するお手伝いをしたりすることもできます。

