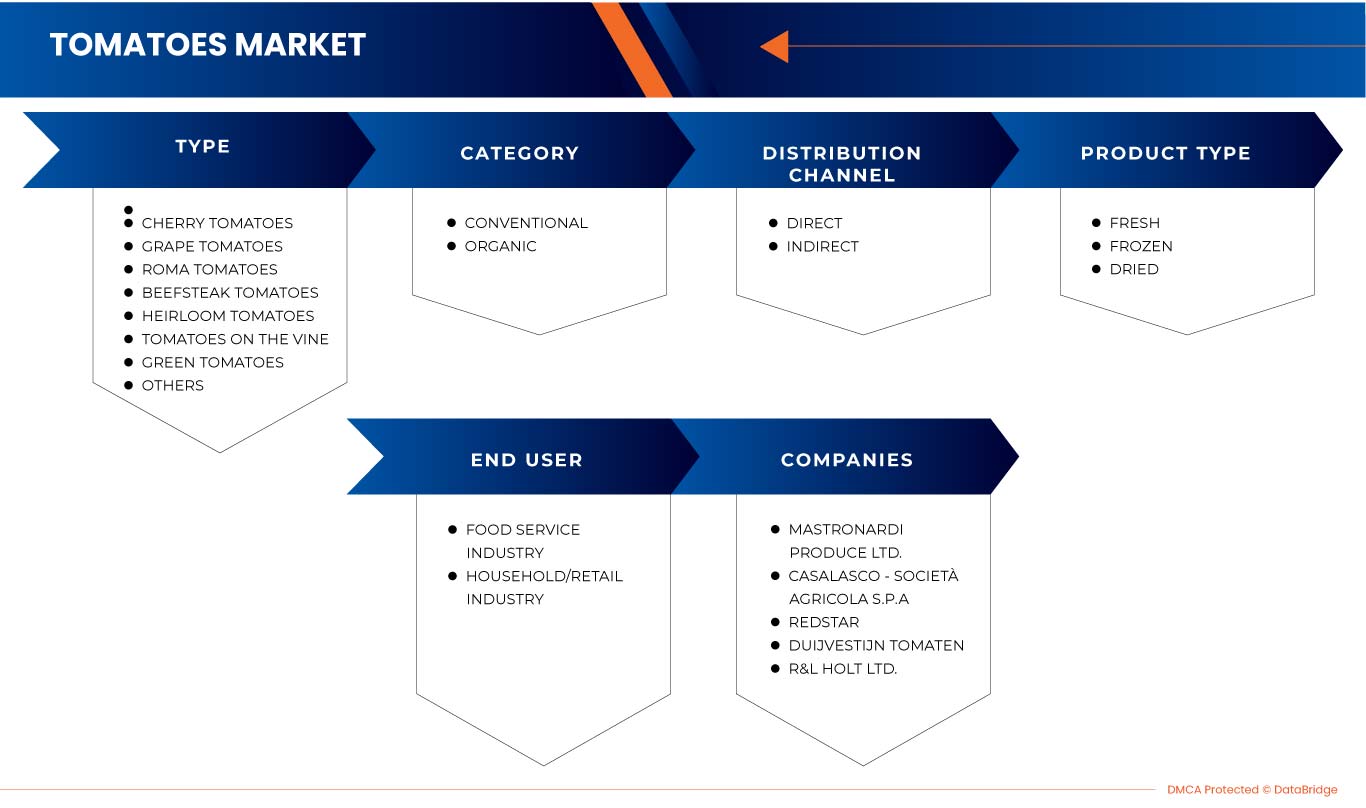
ヨーロッパのトマト市場、タイプ別(チェリートマト、グレープトマト、ローマトマト、つるトマト、ビーフステーキトマト、エアルームトマト、グリーントマトなど)、製品タイプ別(生鮮、冷凍、乾燥)、カテゴリー別(従来型およびオーガニック)、エンドユーザー別(食品サービス業界および家庭/小売業界)、流通チャネル別(直接および間接) - 2030年までの業界動向と予測。
ヨーロッパのトマト市場の分析と規模
ヨーロッパのトマト市場は、企業と従業員の両方に提供する数多くのメリットによって牽引されています。トマト市場は、食品加工業界でのトマトの需要増加によっても牽引されています。B2B市場では、トマトが他の加工トマト製品の原料として利用されるため、トマトが必要です。トマトは、ジュース、ペースト、ピューレ、角切り/皮むきトマト、トマトケチャップ、ピクルス、ソース、すぐに食べられるカレーなど、さまざまな形で使用されており、最終的には市場の成長の原動力となっています。働くグループの増加とミレニアル世代のトマトとそのさまざまな形の需要が大幅に増加しています。トマト生産における技術の進歩の高まりは、この拡大する市場に参入するチャンスです。ただし、トマトの価格変動は、市場の成長を制限する主な抑制要因の1つです。
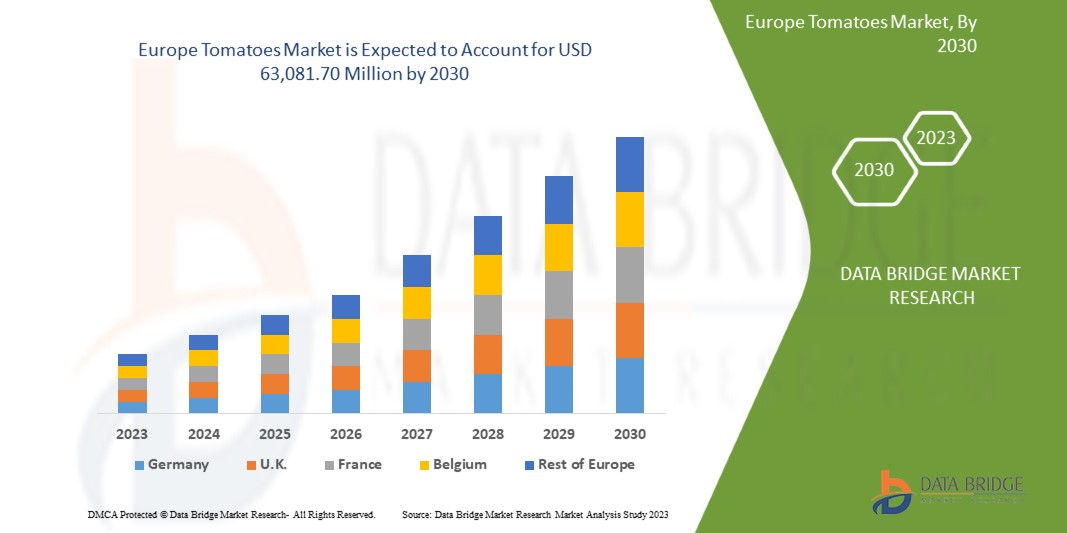
データブリッジマーケットリサーチは、ヨーロッパのトマト市場は2023年から2030年の予測期間中に3.4%のCAGRで成長し、2030年までに630億8,170万米ドルの価値に達すると予測しています。
|
レポートメトリック |
詳細 |
|
予測期間 |
2023年から2030年 |
|
基準年 |
2022 |
|
歴史的な年 |
2021 (2015~2020年にカスタマイズ可能) |
|
定量単位 |
売上高(百万ドル)、価格(米ドル)、販売数量(個数) |
|
対象セグメント |
タイプ(ミニトマト、グレープトマト、ローマトマト、つるトマト、ビーフステーキトマト、エアルームトマト、グリーントマトなど)、製品タイプ(生鮮、冷凍、乾燥)、カテゴリー(従来型およびオーガニック)、エンドユーザー(食品サービス業界および家庭/小売業界)、流通チャネル(直接および間接) |
|
対象国 |
トルコ、ロシア、スペイン、イタリア、フランス、ドイツ、ポーランド、イギリス、ベルギー、オランダ、スウェーデン、スイス、フィンランド、デンマーク、ノルウェー、その他ヨーロッパ諸国 |
|
対象となる市場プレーヤー |
CASALASCO - SOCIETÀ AGRICOLA SpA(イタリア、クレモナ)、Duijvestijn Tomatoes(オランダ、ピナッカー)、R&L Holt Ltd.(ヨーロッパ、イヴシャム)、REDSTAR Sales BV(オランダ、デ・リール)、MASTRONARDI PRODUCE LTD(カナダ、オンタリオ)など |
市場の定義
トマトは基本的に丸い形の野菜で、調理しても生でも食べられます。トマトは、ソラナム・リコペルシウムというハーブの食用果肉入りの果実です。トマトには、赤、黄、オレンジなど、さまざまな色があります。トマトにはさまざまな味と用途を持つ多くの品種があります。
トマトは食品・飲料業界で幅広く利用されています。スープ、ソース、ピューレ、ジュース、ケチャップなどの製造に使用されています。また、ハンバーガー、サンドイッチ、サラダ、ピザなどの生野菜としても使用されています。
トマトは、食品加工産業において幅広い用途を持つ重要な原料であり、人体に有用な必須成分も含んでいます。血圧や健康な皮膚の維持に役立ち、抗炎症作用もあります。
ヨーロッパのトマト市場の動向
このセクションでは、市場の推進要因、利点、機会、制約、課題について理解します。これらについては、以下で詳しく説明します。
ドライバー
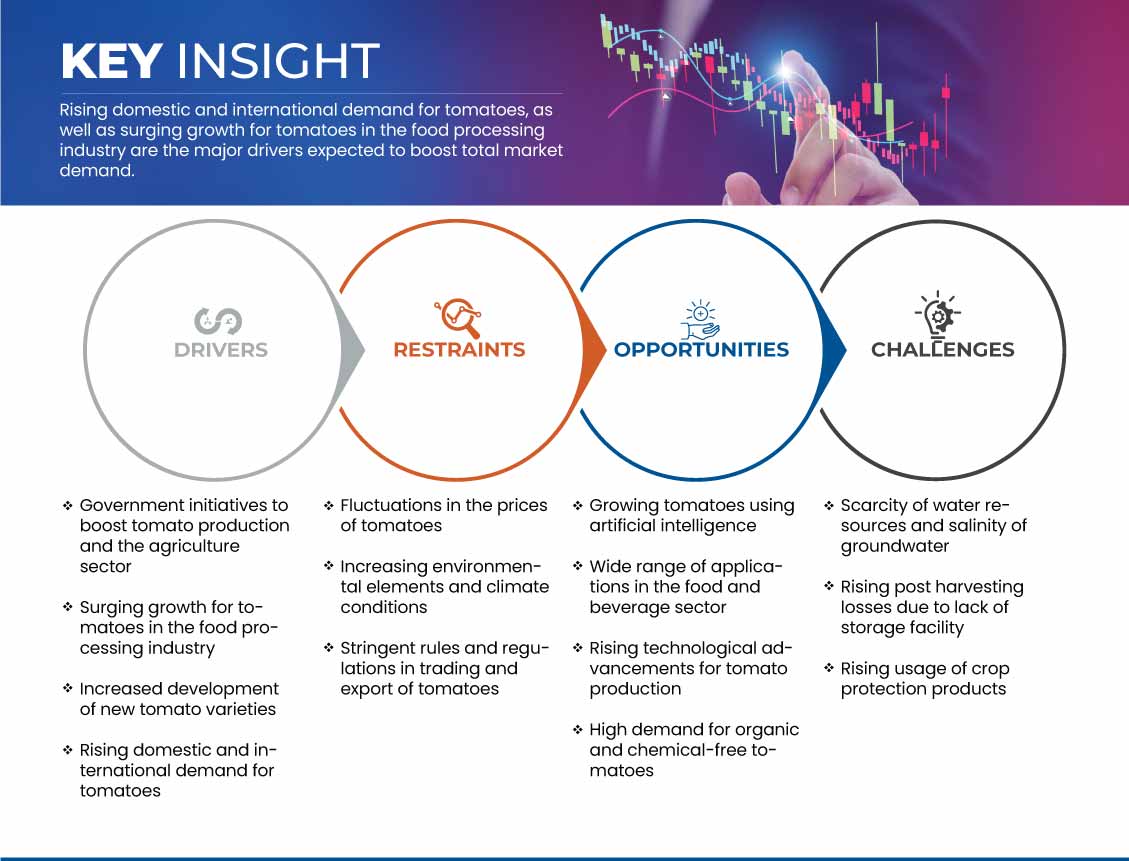
- トマトの生産と農業部門の促進に向けた政府の取り組み
人口が増加し、果物や新鮮な野菜の需要が高まる中、政府は作物の生産と加工を増やすためにさまざまな努力をしてきました。科学技術の多くの研究開発を通じて、政府はトマトやその他の農産物の需要を満たすためにトマトの生産を増やすための多くの取り組みを考案しました。政府はカリフォルニアトマト研究所、農業研究サービス(ARS)、インドのICAR-IIHRなどの研究機関に資金を提供し、プサルビー、プサガウラヴ、チュハラなどの新しい品種を開発しています。これらの高収量品種は収量が多く、病気や害虫に対する耐性も高く、これは生産性の向上に非常に重要であり、自然災害の影響を受けにくくなります。
政府はまた、農産物の輸出入に重点を置いた輸出入政策を策定しており、これは農家と供給者がトマトや市場の成長を牽引すると予想される他の農産物の国際需要に追いつくのに役立つだろう。このように、政府機関がトマトの生産と加工を促進するために講じるさまざまな取り組みは、市場の成長を加速させるだろう。
- 食品加工業界におけるトマトの急成長
B2B 市場では、トマトが他の加工トマト製品の原料として利用されるため、トマトが必要です。トマトは、ジュース、ペースト、ピューレ、角切り/皮むきトマト、ケチャップ、ピクルス、ソース、すぐに食べられるカレーなど、さまざまな形で使用されます。食品分野では、スナック、料理、ホテル、レストラン、ファーストフード小売チェーンなど、加工トマト製品がさまざまな用途で使用されています。トマト製品は調理済みでも生でも食べられ、ヨーロッパ市場で高い需要があります。急速な都市化により、新興国と先進国の消費者は、すぐに食べられる食品やトマト加工製品を食べるように誘われています。高まる需要を満たすために、加工食品メーカーとトマトペースト加工業者は、すぐに食べられる製品に注力しています。
Additionally, the range of tomato processed foods is expanding with the introduction of various tomato products, including powder-based products. Tomato paste and tomato puree are the primary processed tomato products. Secondary processed products for tomatoes are made possible by processing primary products. The main market for tomato paste and puree is the ketchup and sauce sector. The beverage and food industry is the second largest user of tomato paste and puree.
With the growing number of working groups and millennial populations, the demand for tomatoes and their various forms has increased massively in the fast food sector, resulting and café, university dining halls, hotels, inns, catering, and food processing industries, which ultimately contribute towards the market growth.
Restraint
- Fluctuations in the Prices of Tomatoes
Volatile and unpredictable Europe marketplaces have far-reaching consequences for industrial companies. Unanticipated barriers such as rising energy costs and unexpected variations in raw material pricing are disrupting supply chains and making it harder for businesses to stay profitable. Variations in the prices of raw materials for making sauces, dressings, and condiments hot fill bottle packaging put up additional costs on the price of the finished product. A bumper crop or crop disaster in a major production region can change tomato prices quickly.
The prices of tomatoes are volatile as it depends on various factors such as seasonality in production, unseasonal rains, and prolonged drought. It also depends on location, preferences, consumers' age, and consumer buying power. Due to its seasonality, prices increase when the product is out of season and decreases when it is in season.
In India, around 70% of tomato is produced and harvested between December and June, that is, when the prices decrease and the supply increases. Between July and November, only 30% of the total production is harvested, where the prices rise due to limited supply.
Farmers, suppliers, and companies dealing in the tomato market find it difficult to correctly judge the risk of large fluctuations in tomato costs. Highly fluctuating costs and ineffective price management can seriously jeopardize the success of companies. The growers utilize many greenhouse facilities to grow tomatoes to lessen the impact of weather on tomato growing and increase the yield per acre. Tomatoes grown in greenhouses require different seeds than those grown in their natural environment. As a result, the cost of seeds used to grow tomatoes in greenhouses is higher than those used to grow tomatoes in natural conditions.
For instance,
- In July 2022, according to an article published in The Economic Times, every year from July to November, seasonal factors tend to push tomato prices up, with the pressure being highest in July. However, in March, the seasonal component exerts the most downward pressure on pricing. Given that around 70% of tomatoes are produced during the Rabi season. This seasonality in prices results from the seasonal pattern of tomato production
Moreover, increased Europe trade, urbanization, transportation needs, and energy demands put further pressure on the cost of the intermediaries required for the tomato market. Therefore, changes in the costs of tomatoes affect the demand for the product and are, thus, expected to hinder market growth.
Challenge
- Rising Post Harvesting Losses Due to Lack of Storage Facility
Despite the driving factors and the opportunities available in the market for tomato demand Europe, there is a certain challenge faced by the farmer and the supplier that would affect the supply of tomatoes. The challenge is post-harvest losses because of the perishable nature of tomatoes and the lack of storage facilities after harvesting and during transportation. Post-harvest losses are primarily caused by rotting, mechanical damage, poor handling, inappropriate temperature, relative humidity management, and hygiene issues during handling. Post-harvest losses cause the product's quality to decline, eventually lowering its price and negatively influencing market expansion.
However, post-harvest losses and other issues represent a serious market expansion challenge. In most nations, the tomato business is steadily disintegrating due to post-harvest issues, both on and off the farm. Most emerging nations cannot produce enough tomatoes on their own, as evidenced by the importation of completed tomato products. Even while there is always an oversupply on the market, this is only temporary because unprocessed tomatoes are difficult to preserve and highly perishable. Because of the inefficiencies in the post-harvest processing of tomatoes, there is a demand gap being supplied by imported processed goods. These post-harvest losses lower the market value of the product and act as a barrier to market expansion.
Post-harvest loss covers food lost along the entire food supply chain, from when a crop is harvested until it is consumed. The losses fall into several categories: weight loss from rotting, quality loss, nutritional loss, seed viability loss, and commercial loss. A shortage of storage facilities mostly causes these post-harvest losses on and off farms, which will be a key challenge to the market expansion.
Opportunities
- Growing Tomatoes Using Artificial Intelligence
人工知能 (AI) は、一般的に人間の知能を必要とするタスクを実行できるスマート マシンの構築に取り組む、コンピュータ サイエンスの幅広い分野です。AI は日常生活でますます重要になっており、農業分野でも使用されています。AI テクノロジーは、生産および運用プロセスの向上と最適化のためにさまざまな問題を解決することに重点を置いています。
人工知能では、現実世界の多くの問題を解決するために高度な計算手法が使用されています。これらの方法は、農業業界で、種類、速度、新しい品種、保護を強化する独自の研究を行うために使用できます。AI は、作物の品質、収穫量、pH 値、栄養素の割合、必要な水、湿度、酸素成分の量を自動的にチェックできます。多くの国では、ミニボットを使用して農業の作物の品質と熟度を評価しています。ミニボットは、トマトの繊細な皮を傷つけることなく、熟した果物や野菜を収穫します。
AI を活用したソリューションは、農家が効率、量、品質を向上させ、作物の市場投入を早めるのに役立ちます。AI は、最大の利益を得るために作物の収穫量予測と価格予測に使用されます。AI センサーは、雑草の影響を受けた領域を検出して除草剤を散布することで、インテリジェントな散布技術に役立ちます。予測的な洞察により、さまざまな気象条件で最大の生産性を得るために、種をまく適切な時期を早めることができます。農業ロボットは、大量の作物をより速いペースで収穫するのに役立ちます。AI/ML の助けを借りて、作物の健康状態を監視し、土壌の欠陥を検出できます。適切な戦略を通じて植物の病気を診断し、農家を支援します。
したがって、人工知能を使用してトマトを栽培すると、単位面積あたりの高品質と高収量が得られるため、ヨーロッパのトマト市場の成長の機会がもたらされると期待されています。
最近の動向
- 2022年4月、CASALASCO - SOCIETÀ AGRICOLA SpAはオーストラリアのロゼラブランドとの提携を発表しました。この提携により、トマトローストピーマンスープ、おいしいニンジンとポテトのスープ、クリーミーなパンプキンスープなど、さまざまな種類の新製品が開発され、市場と会社の成長に確実に貢献するでしょう。
- 2021年12月、CASALASCO - SOCIETÀ AGRICOLA SpAは、同社の農業活動および栽培実践基準に焦点を当てたGRASPという認証を取得しました。これにより、同社が安全で健康的な製品を提供しているという消費者の信頼を得ることができ、同社の成長につながりました。
ヨーロッパのトマト市場の範囲
ヨーロッパのトマト市場は、タイプ、製品タイプ、カテゴリ、エンドユーザー、流通チャネルに基づいて 5 つの主要なセグメントに分割されています。これらのセグメントの成長は、業界の主要な成長セグメントを分析し、コア市場アプリケーションを特定するための戦略的な決定を下すための貴重な市場概要と市場洞察をユーザーに提供するのに役立ちます。
タイプ
- チェリートマト
- グレープトマト
- ローマトマト
- 木の上のトマト
- ビーフステーキトマト
- 伝統品種のトマト
- グリーントマト
- その他
種類に基づいて、市場は、チェリートマト、グレープトマト、ローマトマト、つるトマト、ビーフステーキトマト、エアルームトマト、グリーントマトなどに分類されます。
製品タイプ
- 新鮮な
- 凍った
- 乾燥
製品タイプに基づいて、市場は生鮮、冷凍、乾燥に分類されます。
カテゴリ
- 従来の
- オーガニック
カテゴリーに基づいて、市場は従来型とオーガニックに分類されます。
エンドユーザー
- 食品サービス業界
- 家庭・小売業界
エンドユーザーに基づいて、市場は食品サービス業界と家庭/小売業界に分類されます。
流通チャネル
- 直接
- 間接的
流通チャネルに基づいて、市場は直接と間接に分割されます。
ヨーロッパのトマト市場の地域分析/洞察
ヨーロッパのトマト市場が分析され、上記のように国、タイプ、製品タイプ、カテゴリ、エンドユーザー、流通チャネル別に市場規模の洞察と傾向が提供されます。
このレポートで取り上げられている国は、トルコ、ロシア、スペイン、イタリア、フランス、ドイツ、ポーランド、英国、ベルギー、オランダ、スウェーデン、スイス、フィンランド、デンマーク、ノルウェー、およびその他のヨーロッパ諸国です。
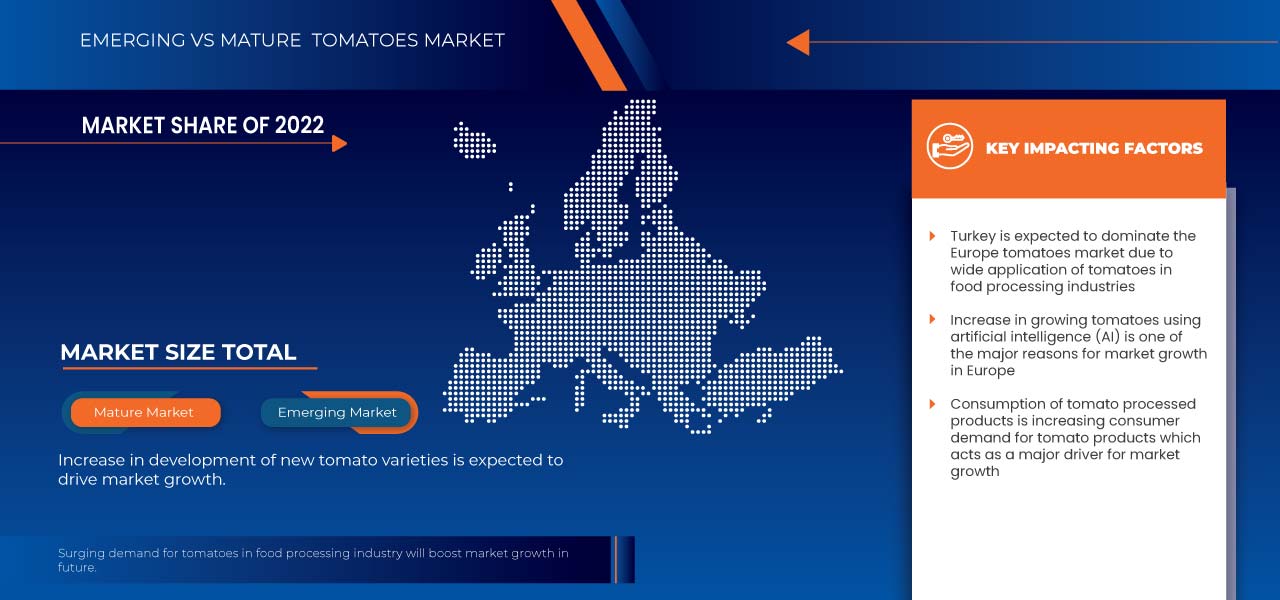
トルコはヨーロッパのトマト市場を独占しています。加工業界からのトマト加工品に対する需要が世界中でますます高まっていることが、トルコの市場成長の大きな理由です。しかし、優れた原材料の高コストが市場の成長を制限する可能性があります。
レポートの国別セクションでは、市場の現在および将来の傾向に影響を与える個別の市場影響要因と市場規制の変更も提供しています。下流および上流のバリュー チェーン分析、技術動向、ポーターの 5 つの力の分析、ケース スタディなどのデータ ポイントは、個々の国の市場シナリオを予測するために使用される指標の一部です。また、国別データの予測分析を提供する際には、ヨーロッパ ブランドの存在と可用性、および地元および国内ブランドとの競争が激しいか少ないために直面する課題、国内関税の影響、貿易ルートも考慮されます。
競争環境とヨーロッパのトマト市場シェア分析
ヨーロッパのトマト市場の競争状況は、競合他社ごとに詳細を提供します。含まれる詳細には、会社概要、会社の財務状況、収益、市場の可能性、研究開発への投資、新しい市場への取り組み、ヨーロッパでのプレゼンス、生産拠点と施設、生産能力、会社の強みと弱み、製品の発売、製品の幅と広さ、アプリケーションの優位性などがあります。提供されている上記のデータ ポイントは、市場に対する会社の重点にのみ関連しています。
ヨーロッパのトマト市場で事業を展開している主要企業としては、CASALASCO - SOCIETÀ AGRICOLA SpA、Duijvestijn Tomatoes、R&L Holt Ltd.、REDSTAR Sales BV、MASTRONARDI PRODUCE LTD などがあります。
SKU-
世界初のマーケットインテリジェンスクラウドに関するレポートにオンラインでアクセスする
- インタラクティブなデータ分析ダッシュボード
- 成長の可能性が高い機会のための企業分析ダッシュボード
- カスタマイズとクエリのためのリサーチアナリストアクセス
- インタラクティブなダッシュボードによる競合分析
- 最新ニュース、更新情報、トレンド分析
- 包括的な競合追跡のためのベンチマーク分析のパワーを活用
目次
1 INTRODUCTION
1.1 OBJECTIVES OF THE STUDY
1.2 MARKET DEFINITION
1.3 OVERVIEW OF THE EUROPE TOMATOES MARKET
1.4 LIMITATIONS
1.5 MARKETS COVERED
2 MARKET SEGMENTATION
2.1 MARKETS COVERED
2.2 GEOGRAPHICAL SCOPE
2.3 YEARS CONSIDERED FOR THE STUDY
2.4 CURRENCY AND PRICING
2.5 DBMR TRIPOD DATA VALIDATION MODEL
2.6 MULTIVARIATE MODELLING
2.7 TYPE LIFELINE CURVE
2.8 MARKET END USER COVERAGE GRID
2.9 PRIMARY INTERVIEWS WITH KEY OPINION LEADERS
2.1 DBMR MARKET POSITION GRID
2.11 SECONDARY SOURCES
2.12 ASSUMPTIONS
3 EXECUTIVE SUMMARY
4 PREMIUM INSIGHTS
4.1 TOP 5 EXPORTER OF EUROPE TOMATOES MARKET
4.2 TOP 5 IMPORTER OF EUROPE TOMATOES MARKET
4.3 NEW PRODUCT LAUNCH STRATEGIES
4.3.1 PROMOTING LAUNCH BY PACKAGING STRATEGIES
4.3.2 LAUNCHING ORGANIC PRODUCTS
4.3.3 CONCLUSION
5 REGULATION COVERAGES
6 SUPPLY CHAIN OF THE EUROPE TOMATOES MARKET
6.1 RAW MATERIAL PROCUREMENT
6.2 PROCESSING
6.3 MARKETING AND DISTRIBUTION
6.4 END USERS
7 MARKET OVERVIEW
7.1 DRIVERS
7.1.1 GOVERNMENT INITIATIVES TO BOOST TOMATO PRODUCTION AND THE AGRICULTURAL SECTOR
7.1.2 SURGING GROWTH FOR TOMATOES IN THE FOOD PROCESSING INDUSTRY
7.1.3 INCREASED DEVELOPMENT OF NEW TOMATO VARIETIES
7.1.4 RISING DOMESTIC AND INTERNATIONAL DEMAND FOR TOMATOES
7.2 RESTRAINTS
7.2.1 FLUCTUATIONS IN THE PRICES OF TOMATOES
7.2.2 INCREASING ENVIRONMENTAL ELEMENTS AND CLIMATE CONDITIONS
7.2.3 STRINGENT RULES AND REGULATIONS IN TRADING AND EXPORT OF TOMATOES
7.3 OPPORTUNITY
7.3.1 GROWING TOMATOES USING ARTIFICIAL INTELLIGENCE
7.3.2 WIDE RANGE OF APPLICATIONS IN THE FOOD AND BEVERAGE SECTOR
7.3.3 RISING TECHNOLOGICAL ADVANCEMENTS FOR TOMATO PRODUCTION
7.3.4 HIGH DEMAND FOR ORGANIC AND CHEMICAL-FREE TOMATOES
7.4 CHALLENGES
7.4.1 SCARCITY OF WATER RESOURCES AND SALINITY OF GROUNDWATER
7.4.2 RISING POST HARVESTING LOSSES DUE TO LACK OF STORAGE FACILITY
7.4.3 RISING USAGE OF CROP PROTECTION PRODUCTS
8 EUROPE TOMATOES MARKET, BY TYPE
8.1 OVERVIEW
8.2 CHERRY TOMATOES
8.3 GRAPE TOMATOES
8.4 ROMA TOMATOES
8.5 TOMATOES ON THE VINE
8.6 BEEFSTEAK TOMATOES
8.7 HEIRLOOM TOMATOES
8.8 GREEN TOMATOES
8.9 OTHERS
9 EUROPE TOMATOES MARKET, BY PRODUCT TYPE
9.1 OVERVIEW
9.2 FRESH
9.3 FROZEN
9.4 DRIED
10 EUROPE TOMATOES MARKET, BY CATEGORY
10.1 OVERVIEW
10.2 CONVENTIONAL
10.3 ORGANIC
11 EUROPE TOMATOES MARKET, BY END USER
11.1 OVERVIEW
11.2 FOOD SERVICE INDUSTRY
11.2.1 FOOD SERVICE INDUSTRY, BY TYPE
11.2.1.1 HOTELS
11.2.1.2 RESTAURANTS
11.2.1.3 CAFES
11.2.1.4 OTHERS
11.3 HOUSEHOLD/RETAIL INDUSTRY
12 EUROPE TOMATOES MARKET, BY DISTRIBUTION CHANNEL
12.1 OVERVIEW
12.2 DIRECT
12.3 INDIRECT
13 EUROPE TOMATOES MARKET : BY COUNTRIES
13.1 TURKEY
13.2 RUSSIA
13.3 SPAIN
13.4 ITALY
13.5 FRANCE
13.6 GERMANY
13.7 POLAND
13.8 U.K.
13.9 BELGIUM
13.1 NETHERLANDS
13.11 SWEDEN
13.12 SWITZERLAND
13.13 FINLAND
13.14 DENMARK
13.15 NORWAY
13.16 REST OF EUROPE
14 EUROPE TOMATOES MARKET, COMPANY LANDSCAPE
14.1 COMPANY SHARE ANALYSIS: EUROPE
15 SWOT ANALYSIS
16 COMPANY PROFILE
16.1 CASALASCO - SOCIETÀ AGRICOLA S.P.A.
16.1.1 COMPANY SNAPSHOT
16.1.2 PRODUCT PORTFOLIO
16.1.3 RECENT DEVELOPMENTS
16.2 MASTRONARDI PRODUCE LTD.
16.2.1 COMPANY SNAPSHOT
16.2.2 PRODUCT PORTFOLIO
16.2.3 RECENT DEVELOPMENTS
16.3 REDSTAR SALES BV
16.3.1 COMPANY SNAPSHOT
16.3.2 PRODUCT PORTFOLIO
16.3.3 RECENT DEVELOPMENT
16.4 DUIJVESTIJN TOMATEN
16.4.1 COMPANY SNAPSHOT
16.4.2 PRODUCT PORTFOLIO
16.4.3 RECENT DEVELOPMENT
16.5 R&L HOLT LTD.
16.5.1 COMPANY SNAPSHOT
16.5.2 PRODUCT PORTFOLIO
16.5.3 RECENT DEVELOPMENT
17 QUESTIONNAIRE
18 RELATED REPORTS
表のリスト
TABLE 1 TOP 5 EXPORTER OF FRESH AND CHILLED TOMATOES, HS CODE: 0702 2017-2021, VOLUME IN TONS
TABLE 2 TOP 5 IMPORTER OF FRESH AND CHILLED TOMATOES, HS CODE: 0702 2017-2021, VOLUME IN TONS
TABLE 3 IN CASE SIZE CODES ARE APPLIED, THE CODES AND RANGES IN THE FOLLOWING TABLE HAVE TO BE RESPECTED:
TABLE 4 EUROPE TOMATOES MARKET, BY TYPE, 2021-2030 (USD MILLION)
TABLE 5 EUROPE TOMATOES MARKET, BY PRODUCT TYPE, 2021-2030 (USD MILLION)
TABLE 6 EUROPE TOMATOES MARKET, BY CATEGORY, 2021-2030 (USD MILLION)
TABLE 7 EUROPE TOMATOES MARKET, BY END USER, 2021-2030 (USD MILLION)
TABLE 8 EUROPE FOOD SERVICE INDUSTRY IN TOMATOES MARKET, BY TYPE, 2021-2030 (USD MILLION)
TABLE 9 EUROPE TOMATOES MARKET, BY DISTRIBUTION CHANNEL, 2021-2030 (USD MILLION)
TABLE 10 EUROPE TOMATOES MARKET, BY COUNTRY, 2021-2030 (USD MILLION)
TABLE 11 TURKEY TOMATOES MARKET, BY TYPE 2021-2030 (USD MILLION)
TABLE 12 TURKEY TOMATOES MARKET, BY PRODUCT TYPE, 2021-2030 (USD MILLION)
TABLE 13 TURKEY TOMATOES MARKET, BY CATEGORY, 2021-2030 (USD MILLION)
TABLE 14 TURKEY TOMATOES MARKET, BY END USER, 2021-2030 (USD MILLION)
TABLE 15 TURKEY FOOD SERVICE INDUSTRY IN TOMATOES MARKET, BY TYPE, 2021-2030 (USD MILLION)
TABLE 16 TURKEY TOMATOES MARKET, BY DISTRIBUTION CHANNEL, 2021-2030 (USD MILLION)
TABLE 17 RUSSIA TOMATOES MARKET, BY TYPE 2021-2030 (USD MILLION)
TABLE 18 RUSSIA TOMATOES MARKET, BY PRODUCT TYPE, 2021-2030 (USD MILLION)
TABLE 19 RUSSIA TOMATOES MARKET, BY CATEGORY, 2021-2030 (USD MILLION)
TABLE 20 RUSSIA TOMATOES MARKET, BY END USER, 2021-2030 (USD MILLION)
TABLE 21 RUSSIA FOOD SERVICE INDUSTRY IN TOMATOES MARKET, BY TYPE, 2021-2030 (USD MILLION)
TABLE 22 RUSSIA TOMATOES MARKET, BY DISTRIBUTION CHANNEL, 2021-2030 (USD MILLION)
TABLE 23 SPAIN TOMATOES MARKET, BY TYPE 2021-2030 (USD MILLION)
TABLE 24 SPAIN TOMATOES MARKET, BY PRODUCT TYPE, 2021-2030 (USD MILLION)
TABLE 25 SPAIN TOMATOES MARKET, BY CATEGORY, 2021-2030 (USD MILLION)
TABLE 26 SPAIN TOMATOES MARKET, BY END USER, 2021-2030 (USD MILLION)
TABLE 27 SPAIN FOOD SERVICE INDUSTRY IN TOMATOES MARKET, BY TYPE, 2021-2030 (USD MILLION)
TABLE 28 SPAIN TOMATOES MARKET, BY DISTRIBUTION CHANNEL, 2021-2030 (USD MILLION)
TABLE 29 ITALY TOMATOES MARKET, BY TYPE 2021-2030 (USD MILLION)
TABLE 30 ITALY TOMATOES MARKET, BY PRODUCT TYPE, 2021-2030 (USD MILLION)
TABLE 31 ITALY TOMATOES MARKET, BY CATEGORY, 2021-2030 (USD MILLION)
TABLE 32 ITALY TOMATOES MARKET, BY END USER, 2021-2030 (USD MILLION)
TABLE 33 ITALY FOOD SERVICE INDUSTRY IN TOMATOES MARKET, BY TYPE, 2021-2030 (USD MILLION)
TABLE 34 ITALY TOMATOES MARKET, BY DISTRIBUTION CHANNEL, 2021-2030 (USD MILLION)
TABLE 35 FRANCE TOMATOES MARKET, BY TYPE 2021-2030 (USD MILLION)
TABLE 36 FRANCE TOMATOES MARKET, BY PRODUCT TYPE, 2021-2030 (USD MILLION)
TABLE 37 FRANCE TOMATOES MARKET, BY CATEGORY, 2021-2030 (USD MILLION)
TABLE 38 FRANCE TOMATOES MARKET, BY END USER, 2021-2030 (USD MILLION)
TABLE 39 FRANCE FOOD SERVICE INDUSTRY IN TOMATOES MARKET, BY TYPE, 2021-2030 (USD MILLION)
TABLE 40 FRANCE TOMATOES MARKET, BY DISTRIBUTION CHANNEL, 2021-2030 (USD MILLION)
TABLE 41 GERMANY TOMATOES MARKET, BY TYPE 2021-2030 (USD MILLION)
TABLE 42 GERMANY TOMATOES MARKET, BY PRODUCT TYPE, 2021-2030 (USD MILLION)
TABLE 43 GERMANY TOMATOES MARKET, BY CATEGORY, 2021-2030 (USD MILLION)
TABLE 44 GERMANY TOMATOES MARKET, BY END USER, 2021-2030 (USD MILLION)
TABLE 45 GERMANY FOOD SERVICE INDUSTRY IN TOMATOES MARKET, BY TYPE, 2021-2030 (USD MILLION)
TABLE 46 GERMANY TOMATOES MARKET, BY DISTRIBUTION CHANNEL, 2021-2030 (USD MILLION)
TABLE 47 POLAND TOMATOES MARKET, BY TYPE 2021-2030 (USD MILLION)
TABLE 48 POLAND TOMATOES MARKET, BY PRODUCT TYPE, 2021-2030 (USD MILLION)
TABLE 49 POLAND TOMATOES MARKET, BY CATEGORY, 2021-2030 (USD MILLION)
TABLE 50 POLAND TOMATOES MARKET, BY END USER, 2021-2030 (USD MILLION)
TABLE 51 POLAND FOOD SERVICE INDUSTRY IN TOMATOES MARKET, BY TYPE, 2021-2030 (USD MILLION)
TABLE 52 POLAND TOMATOES MARKET, BY DISTRIBUTION CHANNEL, 2021-2030 (USD MILLION)
TABLE 53 U.K. TOMATOES MARKET, BY TYPE 2021-2030 (USD MILLION)
TABLE 54 U.K. TOMATOES MARKET, BY PRODUCT TYPE, 2021-2030 (USD MILLION)
TABLE 55 U.K. TOMATOES MARKET, BY CATEGORY, 2021-2030 (USD MILLION)
TABLE 56 U.K. TOMATOES MARKET, BY END USER, 2021-2030 (USD MILLION)
TABLE 57 U.K. FOOD SERVICE INDUSTRY IN TOMATOES MARKET, BY TYPE, 2021-2030 (USD MILLION)
TABLE 58 U.K. TOMATOES MARKET, BY DISTRIBUTION CHANNEL, 2021-2030 (USD MILLION)
TABLE 59 BELGIUM TOMATOES MARKET, BY TYPE 2021-2030 (USD MILLION)
TABLE 60 BELGIUM TOMATOES MARKET, BY PRODUCT TYPE, 2021-2030 (USD MILLION)
TABLE 61 BELGIUM TOMATOES MARKET, BY CATEGORY, 2021-2030 (USD MILLION)
TABLE 62 BELGIUM TOMATOES MARKET, BY END USER, 2021-2030 (USD MILLION)
TABLE 63 BELGIUM FOOD SERVICE INDUSTRY IN TOMATOES MARKET, BY TYPE, 2021-2030 (USD MILLION)
TABLE 64 BELGIUM TOMATOES MARKET, BY DISTRIBUTION CHANNEL, 2021-2030 (USD MILLION)
TABLE 65 NETHERLANDS TOMATOES MARKET, BY TYPE 2021-2030 (USD MILLION)
TABLE 66 NETHERLANDS TOMATOES MARKET, BY PRODUCT TYPE, 2021-2030 (USD MILLION)
TABLE 67 NETHERLANDS TOMATOES MARKET, BY CATEGORY, 2021-2030 (USD MILLION)
TABLE 68 NETHERLANDS TOMATOES MARKET, BY END USER, 2021-2030 (USD MILLION)
TABLE 69 NETHERLANDS FOOD SERVICE INDUSTRY IN TOMATOES MARKET, BY TYPE, 2021-2030 (USD MILLION)
TABLE 70 NETHERLANDS TOMATOES MARKET, BY DISTRIBUTION CHANNEL, 2021-2030 (USD MILLION)
TABLE 71 SWEDEN TOMATOES MARKET, BY TYPE 2021-2030 (USD MILLION)
TABLE 72 SWEDEN TOMATOES MARKET, BY PRODUCT TYPE, 2021-2030 (USD MILLION)
TABLE 73 SWEDEN TOMATOES MARKET, BY CATEGORY, 2021-2030 (USD MILLION)
TABLE 74 SWEDEN TOMATOES MARKET, BY END USER, 2021-2030 (USD MILLION)
TABLE 75 SWEDEN FOOD SERVICE INDUSTRY IN TOMATOES MARKET, BY TYPE, 2021-2030 (USD MILLION)
TABLE 76 SWEDEN TOMATOES MARKET, BY DISTRIBUTION CHANNEL, 2021-2030 (USD MILLION)
TABLE 77 SWITZERLAND TOMATOES MARKET, BY TYPE 2021-2030 (USD MILLION)
TABLE 78 SWITZERLAND TOMATOES MARKET, BY PRODUCT TYPE, 2021-2030 (USD MILLION)
TABLE 79 SWITZERLAND TOMATOES MARKET, BY CATEGORY, 2021-2030 (USD MILLION)
TABLE 80 SWITZERLAND TOMATOES MARKET, BY END USER, 2021-2030 (USD MILLION)
TABLE 81 SWITZERLAND FOOD SERVICE INDUSTRY IN TOMATOES MARKET, BY TYPE, 2021-2030 (USD MILLION)
TABLE 82 SWITZERLAND TOMATOES MARKET, BY DISTRIBUTION CHANNEL, 2021-2030 (USD MILLION)
TABLE 83 FINLAND TOMATOES MARKET, BY TYPE 2021-2030 (USD MILLION)
TABLE 84 FINLAND TOMATOES MARKET, BY PRODUCT TYPE, 2021-2030 (USD MILLION)
TABLE 85 FINLAND TOMATOES MARKET, BY CATEGORY, 2021-2030 (USD MILLION)
TABLE 86 FINLAND TOMATOES MARKET, BY END USER, 2021-2030 (USD MILLION)
TABLE 87 FINLAND FOOD SERVICE INDUSTRY IN TOMATOES MARKET, BY TYPE, 2021-2030 (USD MILLION)
TABLE 88 FINLAND TOMATOES MARKET, BY DISTRIBUTION CHANNEL, 2021-2030 (USD MILLION)
TABLE 89 DENMARK TOMATOES MARKET, BY TYPE 2021-2030 (USD MILLION)
TABLE 90 DENMARK TOMATOES MARKET, BY PRODUCT TYPE, 2021-2030 (USD MILLION)
TABLE 91 DENMARK TOMATOES MARKET, BY CATEGORY, 2021-2030 (USD MILLION)
TABLE 92 DENMARK TOMATOES MARKET, BY END USER, 2021-2030 (USD MILLION)
TABLE 93 DENMARK FOOD SERVICE INDUSTRY IN TOMATOES MARKET, BY TYPE, 2021-2030 (USD MILLION)
TABLE 94 DENMARK TOMATOES MARKET, BY DISTRIBUTION CHANNEL, 2021-2030 (USD MILLION)
TABLE 95 NORWAY TOMATOES MARKET, BY TYPE 2021-2030 (USD MILLION)
TABLE 96 NORWAY TOMATOES MARKET, BY PRODUCT TYPE, 2021-2030 (USD MILLION)
TABLE 97 NORWAY TOMATOES MARKET, BY CATEGORY, 2021-2030 (USD MILLION)
TABLE 98 NORWAY TOMATOES MARKET, BY END USER, 2021-2030 (USD MILLION)
TABLE 99 NORWAY FOOD SERVICE INDUSTRY IN TOMATOES MARKET, BY TYPE, 2021-2030 (USD MILLION)
TABLE 100 NORWAY TOMATOES MARKET, BY DISTRIBUTION CHANNEL, 2021-2030 (USD MILLION)
TABLE 101 REST OF EUROPE TOMATOES MARKET, BY TYPE 2021-2030 (USD MILLION)
図表一覧
FIGURE 1 EUROPE TOMATOES MARKET: SEGMENTATION
FIGURE 2 EUROPE TOMATOES MARKET: DATA TRIANGULATION
FIGURE 3 EUROPE TOMATOES MARKET: DROC ANALYSIS
FIGURE 4 EUROPE TOMATOES MARKET: GLOBAL VS REGIONAL ANALYSIS
FIGURE 5 EUROPE TOMATOES MARKET: COMPANY RESEARCH ANALYSIS
FIGURE 6 THE EUROPE TOMATOES MARKET: MARKET END USER COVERAGE GRID
FIGURE 7 EUROPE TOMATOES MARKET: INTERVIEW DEMOGRAPHICS
FIGURE 8 EUROPE TOMATOES MARKET: DBMR POSITION GRID
FIGURE 9 EUROPE TOMATOES MARKET: SEGMENTATION
FIGURE 10 SURGING GROWTH FOR TOMATOES IN THE FOOD PROCESSING INDUSTRY IS EXPECTED TO DRIVE THE EUROPE TOMATOES MARKET IN THE FORECAST PERIOD OF 2023 TO 2030
FIGURE 11 THE CHERRY TOMATO SEGMENT IS EXPECTED TO ACCOUNT FOR THE LARGEST SHARE OF THE EUROPE TOMATOES MARKET IN THE FORECAST PERIOD OF 2023 TO 2030
FIGURE 12 SUPPLY CHAIN OF THE EUROPE TOMATOES MARKET
FIGURE 13 DRIVERS, RESTRAINTS, OPPORTUNITIES, AND CHALLENGES OF THE EUROPE TOMATOES MARKET
FIGURE 14 EUROPE TOMATOES MARKET: BY TYPE, 2022
FIGURE 15 EUROPE TOMATOES MARKET: BY PRODUCT TYPE, 2022
FIGURE 16 EUROPE TOMATOES MARKET: BY CATEGORY, 2022
FIGURE 17 EUROPE TOMATOES MARKET: BY END USER, 2022
FIGURE 18 EUROPE TOMATOES MARKET: BY DISTRIBUTION CHANNEL, 2022
FIGURE 19 EUROPE TOMATOES MARKET: SNAPSHOT (2022)
FIGURE 20 EUROPE TOMATOES MARKET: BY COUNTRY (2022)
FIGURE 21 EUROPE TOMATOES MARKET: BY COUNTRY (2023 & 2030)
FIGURE 22 EUROPE TOMATOES MARKET: BY COUNTRY (2022 & 2030)
FIGURE 23 EUROPE TOMATOES MARKET: BY TYPE (2023 - 2030)
FIGURE 24 EUROPE TOMATOES MARKET: COMPANY SHARE 2022 (%)

調査方法
データ収集と基準年分析は、大規模なサンプル サイズのデータ収集モジュールを使用して行われます。この段階では、さまざまなソースと戦略を通じて市場情報または関連データを取得します。過去に取得したすべてのデータを事前に調査および計画することも含まれます。また、さまざまな情報ソース間で見られる情報の不一致の調査も含まれます。市場データは、市場統計モデルと一貫性モデルを使用して分析および推定されます。また、市場シェア分析と主要トレンド分析は、市場レポートの主要な成功要因です。詳細については、アナリストへの電話をリクエストするか、お問い合わせをドロップダウンしてください。
DBMR 調査チームが使用する主要な調査方法は、データ マイニング、データ変数が市場に与える影響の分析、および一次 (業界の専門家) 検証を含むデータ三角測量です。データ モデルには、ベンダー ポジショニング グリッド、市場タイムライン分析、市場概要とガイド、企業ポジショニング グリッド、特許分析、価格分析、企業市場シェア分析、測定基準、グローバルと地域、ベンダー シェア分析が含まれます。調査方法について詳しくは、お問い合わせフォームから当社の業界専門家にご相談ください。
カスタマイズ可能
Data Bridge Market Research は、高度な形成的調査のリーダーです。当社は、既存および新規のお客様に、お客様の目標に合致し、それに適したデータと分析を提供することに誇りを持っています。レポートは、対象ブランドの価格動向分析、追加国の市場理解 (国のリストをお問い合わせください)、臨床試験結果データ、文献レビュー、リファービッシュ市場および製品ベース分析を含めるようにカスタマイズできます。対象競合他社の市場分析は、技術ベースの分析から市場ポートフォリオ戦略まで分析できます。必要な競合他社のデータを、必要な形式とデータ スタイルでいくつでも追加できます。当社のアナリスト チームは、粗い生の Excel ファイル ピボット テーブル (ファクト ブック) でデータを提供したり、レポートで利用可能なデータ セットからプレゼンテーションを作成するお手伝いをしたりすることもできます。


