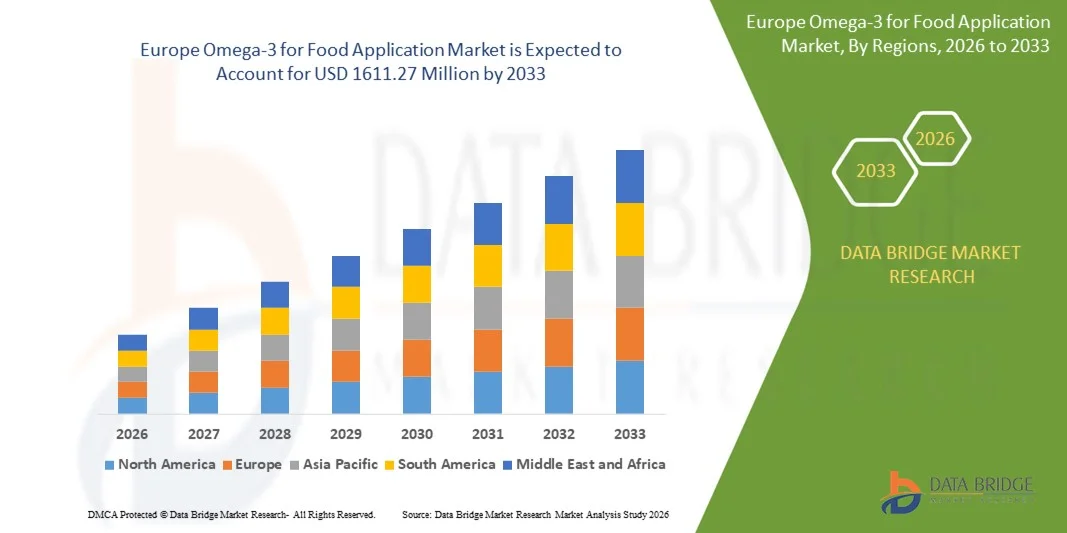
>欧州の食品用途向けオメガ3市場、タイプ別(α-リノレン酸(ALA)、エイコサペンタエン酸(EPA)、ドコサヘキサエン酸(DHA)、エイコサペンタエン酸(EPA)+、ドコサヘキサエン酸(DHA))、供給源(海洋ベース、藻類ベース、植物ベース)、形態(油と粉末)、用途(機能性食品、菓子およびチョコレート製品、スポーツ栄養、栄養補助食品、乳児用調合乳など)、機能(食品強化、骨と関節の健康、皮膚の健康、髪の健康、爪の健康など)、国別(ドイツ、英国、イタリア、フランス、スペイン、スイス、オランダ、ベルギー、ロシア、デンマーク、スウェーデン、ポーランド、トルコ、その他の欧州諸国)業界動向と2028年までの予測。
市場分析と洞察:ヨーロッパの食品用途向けオメガ 3 市場
食品用途のオメガ3市場は、2020年から2028年の予測期間に市場が成長すると予想されています。データブリッジマーケットリサーチは、市場は2020年から2028年の予測期間に10.2%のCAGRで成長し、2028年までに991,430.59千米ドルに達すると分析しています。オメガ3生産用の原材料が豊富に利用できることで、食品用途のオメガ3市場の成長が促進されると予測されています。
オメガ 3 は、分子の末端から 3 番目と 4 番目の炭素原子の間にある炭化水素鎖の最後の二重結合を持つ多価不飽和脂肪酸で、カルボキシル基の反対側にあります。オメガ 3 脂肪酸は、体内で生成できない必須脂肪酸のグループです。オメガ 3 は、体の機能を維持する上で重要な役割を果たし、目、心臓血管の健康など、さまざまな健康効果をもたらします。
オメガ 3 脂肪酸は、健康維持に大きな役割を果たしており、食品用途のオメガ 3 市場の成長を促進すると予測されています。オメガ 3 の最も効果的な供給源である魚からのオメガ 3 脂肪酸の増加は、食品用途のオメガ 3 市場の成長を制限すると予測されています。技術のさまざまな進歩により、原材料の生産能力が向上し、食品用途のオメガ 3 市場におけるオメガ 3 メーカーにとってのチャンスになる可能性があります。オメガ 3 の複雑な処理は、食品用途のオメガ 3 市場にとって課題となる可能性があります。
この食品用途向けオメガ 3 市場レポートでは、市場シェア、新開発、製品パイプライン分析、国内および現地の市場プレーヤーの影響の詳細、新たな収益源、市場規制の変更、製品承認、戦略的決定、製品発売、地理的拡大、市場における技術革新の観点から見た機会の分析が提供されます。分析と市場シナリオを理解するには、アナリスト概要についてお問い合わせください。当社のチームが、希望する目標を達成するための収益影響ソリューションの作成をお手伝いします。
欧州の食品用途向けオメガ3市場の範囲と市場規模
食品用途のオメガ 3 市場は、種類、ソース、形態、用途、機能に基づいて 5 つの主要なセグメントに分割されています。セグメント間の成長は、ニッチな成長分野と市場へのアプローチ戦略を分析し、コア アプリケーション領域とターゲット市場の違いを決定するのに役立ちます。
- タイプに基づいて、食品用途のオメガ3市場は、α-リノレン酸(ALA)、エイコサペンタエン酸(EPA)、ドコサヘキサエン酸(DHA)、エイコサペンタエン酸(EPA)+、ドコサヘキサエン酸(DHA)に分類されます。2021年には、エイコサペンタエン酸(EPA)+ドコサヘキサエン酸(DHA)セグメントが最大の市場シェアを占めています。これは、EPAとDHAの摂取に関連する健康上の利点の数が多いなどの要因により、多くのメーカーがEPAとDHAの組み合わせを使用しているためです。
- 供給源に基づいて、食品用途のオメガ3市場は、海洋ベース、藻類ベース、植物ベースに分類されます。2021年には、魚や魚油によるオメガ3の生産効率の高さなどの要因により、海洋ベースのセグメントが最大の市場シェアを占めています。
- 形態に基づいて、食品用途のオメガ3市場は、オイルとパウダーに分類されます。2021年には、ソフトジェルなどの食品および栄養補助食品製品におけるオイルの高用途などの要因により、オイルセグメントが最大の市場シェアを占めています。
- 用途に基づいて、食品用途のオメガ3市場は、機能性食品、菓子およびチョコレート製品、スポーツ栄養、栄養補助食品、乳児用調合乳などに分類されます。2021年には、世界中で健康志向の消費者が増加していることや、消費者のオメガ3欠乏症率が増加していることなどの要因により、栄養補助食品セグメントが最大の市場シェアを占めています。
- 機能に基づいて、食品用途のオメガ3市場は、食品強化、骨と関節の健康、皮膚の健康、髪の健康、爪の健康などに分類されます。2021年には、骨と関節の健康におけるオメガ3の高適用や、あらゆる年齢層での骨粗しょう症の発生率の増加などの要因により、骨と関節の健康セグメントが最大の市場シェアを占めています。
食品用途向けオメガ3市場の国別分析
食品用途のオメガ 3 市場が分析され、上記の国、タイプ、ソース、形式、用途、機能別に市場規模の情報が提供されます。
欧州の食品用途向けオメガ 3 市場に含まれる国は、ドイツ、英国、イタリア、フランス、スペイン、スイス、オランダ、ベルギー、ロシア、デンマーク、スウェーデン、ポーランド、トルコ、その他の欧州諸国です。
ドイツは、食品用途の原料としてオメガ3を使用した新製品を開発するドイツの大手企業の増加により、2021年から2028年の予測期間に市場を支配し、最高の成長率で成長すると予想されています。フランスは、オメガ3成分を含む食品を選択する健康志向の消費者の増加により、市場を支配しています。英国では、消費者がオメガ3の健康上の利点を認識しているため、市場が支配的です。
レポートの国別セクションでは、市場の現在および将来の傾向に影響を与える国内市場における個別の市場影響要因と規制の変更も提供しています。新規販売、交換販売、国の人口統計、規制法、輸出入関税などのデータ ポイントは、各国の市場シナリオを予測するために使用される主要な指標の一部です。また、グローバル ブランドの存在と可用性、および地元および国内ブランドとの競争が激しいか少ないために生じる課題は、国別データの予測分析を提供しながら、販売チャネルに影響を与えます。
食品用途におけるオメガ3の需要増加
食品用途のオメガ 3 市場では、売上、コンポーネント売上、食品用途のオメガ 3 における技術開発の影響、食品用途のオメガ 3 市場へのサポートに関する規制シナリオの変化など、各国の産業成長に関する詳細な市場分析も提供されます。データは 2010 年から 2019 年までの履歴期間で利用可能です。
食品用途におけるオメガ3の競争環境と市場シェア分析
食品用途向けオメガ 3 市場の競争状況では、競合他社ごとに詳細が提供されます。含まれる詳細には、会社概要、会社の財務状況、収益、市場の可能性、研究開発への投資、新しい市場への取り組み、世界的なプレゼンス、生産拠点と施設、会社の強みと弱み、製品の発売、製品試験パイプライン、製品の承認、特許、製品の幅と広さ、アプリケーションの優位性、技術ライフライン曲線などがあります。提供されている上記のデータ ポイントは、ヨーロッパの食品用途向けオメガ 3 市場に関連する会社の焦点にのみ関連しています。
ヨーロッパの食品用途向けオメガ 3 市場レポートで取り上げられている主要企業には、Solutex、Algaecytes、DSM、BASF SE、Croda International Plc、AlaskOmega、Aker BioMarine、Sanmark LLC、ADM、Polaris、Pharma Marine AS、GC Rieber VivoMega AS、Biosearch life など、国内企業が含まれます。DBMR アナリストは、競争力を理解し、各競合他社の競合分析を個別に提供します。
世界中の企業によって多くの製品開発も開始されており、食品用途市場におけるオメガ3の成長も加速しています。
例えば、
- 2017 年 3 月、DSM は DSM の栄養脂質ポートフォリオにオメガ 3 脂肪酸である MEG-3 ウルトラを導入しました。これは、クリーンな天然海洋魚油由来のオメガ 3 を最大 85% 含む EPA と DHA の組み合わせです。これにより、同社は市場での製品ポートフォリオを拡大することができました。
パートナーシップ、ジョイントベンチャー、その他の戦略により、カバレッジとプレゼンスが拡大し、企業の市場シェアが高まります。また、組織は規模の拡大により、食品用途のオメガ 3 の提供を強化できるというメリットも得られます。
SKU-
世界初のマーケットインテリジェンスクラウドに関するレポートにオンラインでアクセスする
- インタラクティブなデータ分析ダッシュボード
- 成長の可能性が高い機会のための企業分析ダッシュボード
- カスタマイズとクエリのためのリサーチアナリストアクセス
- インタラクティブなダッシュボードによる競合分析
- 最新ニュース、更新情報、トレンド分析
- 包括的な競合追跡のためのベンチマーク分析のパワーを活用
目次
- introduction
- OBJECTIVES OF THE STUDY
- MARKET DEFINITION
- OVERVIEW of Europe omega-3 for food application market
- LIMITATIONs
- MARKETS COVERED
- MARKET SEGMENTATION
- MARKETS COVERED
- geographical scope
- years considered for the study
- currency and pricing
- DBMR TRIPOD DATA VALIDATION MODEL
- MULTIVARIATE MODELLING
- Type LIFELINE CURVE
- primary interviews with key opinion leaders
- DBMR MARKET POSITION GRID
- vendor share analysis
- MARKET APPLICATIONS COVERAGE GRID
- secondary sourcEs
- assumptions
- EXECUTIVE SUMMARY
- premium insights
- production & CONSUMPTION
- EUROPE OMEGA-3 FOR FOOD APPLICATION MARKET: PRODUCT PRICING ANALYSIS
- EUROPE OMEGA-3 FOR FOOD APPLICATION MARKET: RAW MATERIAL PRICING ANALYSIS
- EUROPE OMEGA-3 FOR FOOD Application MARKET: REGULATORY FRAMEWORK
- LAW OF NUTRITIONAL & SUPPLEMENTAL FOOD PRODUCTS IN INDIA
- SUPPLY CHAIN OF EUROPE OMEGA-3 FOR FOOD APPLICATION MARKET
- RAW MATERIAL PRODUCTION & PROCUREMENT
- MARINE SOURCE
- PLANTS
- ALGAE
- MANUFACTURING, MARKETING AND DISTRIBUTION
- END USERS
- market overview
- drivers
- abundant availability of raw materials such as algae, fish oil and plant-based sources
- Health benefits associated with the omega-3 consumption
- Changing lifestyle of people around the globe
- advancements in food technology and high demand for fortified food products
- RESTRAINTS
- High chances of contamination of heavy metals from fish sources
- Lack of clarity among consumers about the daily recommended intake
- Highly Unstable Prices of raw materials
- opportunities
- Technological advancements in the production of omega-3 from different sources
- increasing Research AND development in the field of omega-3 sources
- challenges
- Complex purification process of omega-3 from raw materials
- stringent government regulations
- COVID-19 IMPACT ON EUROPE OMEGA-3 FOR FOOD APPLICATION MARKET IN FOOD & BEVERAGE INDUSTRY
- CONSUMERS WITH HIGH CHOLESTEROL AT HIGH RISK OF COVID-19
- INCREASED DEMAND FOR OMEGA-3 FOOD APPLICATION
- IMPACT OF COVID-19 IN OIL INDUSTRY
- DISRUPTION IN THE SUPPLY CHAIN
- OMEGA-3 MANUFACTURERS: PERSPECTIVE & INITIATIVES
- CONCLUSION
- Europe Omega-3 for Food Application Market, by type
- overview
- Eicosapentaenoic Acid (EPA) + Docosahexaenoic Acid (DHA)
- Docosahexaenoic Acid (DHA)
- Eicosapentaenoic Acid (EPA)
- Alpha-Linolenic Acid (ALA)
- Europe Omega-3 for Food Application Market, by Source
- overview
- MARINE Based
- Mackerel Oil
- Salmon oil
- Sardine oil
- Cod liver oil
- Tuna oil
- menhaden oil
- krill oil
- hoki oil
- Pollock oil
- Mussel oil
- Calanus oil
- Others
- Plant -based
- Flax seed
- walnut
- Soybean
- Canola
- pumpkin seeds
- chia seeds
- hemp seeds
- OTHERS
- Algae- based
- Macro algae
- Micro algae
- Europe Omega-3 for Food Application Market, by form
- overview
- oil
- powder
- Europe Omega-3 for Food Application Market, by Application
- overview
- Dietary Supplements
- Soft Gel
- Capsule
- Tablet
- Powder
- Gummies
- Others
- Eicosapentaenoic Acid (EPA) + Docosahexaenoic Acid (DHA)
- Docosahexaenoic Acid (DHA)
- Eicosapentaenoic Acid (EPA)
- Alpha-Linolenic Acid (ALA)
- Infant Formula
- Standard Formula
- Growing Up Formula
- Follow-On Formula
- Specialty Formula
- Docosahexaenoic Acid (DHA)
- Alpha-Linolenic Acid (ALA)
- Eicosapentaenoic Acid (EPA) + Docosahexaenoic Acid (DHA)
- Eicosapentaenoic Acid (EPA)
- Sports Nutrition
- Eicosapentaenoic Acid (EPA) + Docosahexaenoic Acid (DHA)
- Docosahexaenoic Acid (DHA)
- Eicosapentaenoic Acid (EPA)
- Alpha-Linolenic Acid (ALA)
- Functional Food
- Bakery Products
- Nutritional Bars
- PROTEIN BARS
- ENERGY BARS
- YOGA BARS
- PRE WORK OUT BARS
- OTHERS
- Dairy Products
- Snacks
- Eicosapentaenoic Acid (EPA) + Docosahexaenoic Acid (DHA)
- Docosahexaenoic Acid (DHA)
- Eicosapentaenoic Acid (EPA)
- Alpha-Linolenic Acid (ALA)
- Confectionery And Chocolate Products
- Eicosapentaenoic Acid (EPA) + Docosahexaenoic Acid (DHA)
- Docosahexaenoic Acid (DHA)
- Eicosapentaenoic Acid (EPA)
- Alpha-Linolenic Acid (ALA)
- Europe Omega-3 for Food Application Market, BY Function
- overview
- Bone and Joint Health
- Skin Health
- FOOD FORTIFICATION
- Hair Health
- Nails Health
- others
- Europe Omega-3 for Food Application Market, BY region
- Overview
- Europe
- Germany
- France
- U.K.
- Spain
- Italy
- Netherlands
- russia
- switzerland
- Poland
- belgium
- sweden
- Denmark
- turkey
- rest of europe
- Europe OMEGA-3 FOR FOOD APPLICATION Market: COMPANY landscape
- company share analysis: Europe
- SWOT
- Company profile
- DSM
- COMPANY SNAPSHOT
- REVENUE ANALYSIS
- company share analysis
- Product PORTFOLIO
- RECENT DEVELOPMENT
- adm
- COMPANY SNAPSHOT
- revenue analysis
- company share analysis
- product portfolio
- recent development
- Croda International Plc
- COMPANY SNAPSHOT
- RECENT FINANCIALS
- company share analysis
- PRODUCT PORTFOLIO
- RECENT DEVELOPMENT
- BASF SE
- COMPANY SNAPSHOT
- RECENT FINANCIALS
- company share analysis
- PRODUCT PORTFOLIO
- RECENT DEVELOPMENT
- AKER BIOMARINE
- COMPANY SNAPSHOT
- revenue analysis
- company share analysis
- product Portfolio
- RECENT DEVELOPMENT
- AlaskOmega
- COMPANY SNAPSHOT
- PRODUCT PORTFOLIO
- RECENT DEVELOPMENTS
- Algaecytes
- COMPANY SNAPSHOT
- PRODUCT PORTFOLIO
- RECENT DEVELOPMENT
- Biosearch life
- COMPANY SNAPSHOT
- PRODUCT PORTFOLIO
- RECENT DEVELOPMENTS
- GC Rieber VivoMega AS
- COMPANY SNAPSHOT
- product PORTFOLIO
- RECENT DEVELOPMENTS
- Pharma Marine AS
- COMPANY SNAPSHOT
- PRODUCT PORTFOLIO
- RECENT DEVELOPMENT
- Polaris
- COMPANY SNAPSHOT
- product Portfolio
- RECENT DEVELOPMENT
- Sanmark LLC
- COMPANY SNAPSHOT
- PRODUCT PORTFOLIO
- RECENT DEVELOPMENT
- Solutex
- COMPANY SNAPSHOT
- PRODUCT PORTFOLIO
- RECENT DEVELOPMENTS
- questionnaire
- related reports
表のリスト
TABLE 1 OMEGA-3 CONTENT OF THE DIFFERENT FISHES
TABLE 2 AVAILABILITY OF OMEGA-3 IN THE DIFFERENT PLANT SOURCES
TABLE 3 As per the USDA, the adequate intake of omega-3 (ALA) is:
TABLE 4 Europe Omega-3 for Food Application Market, By Type, 2019-2028 (USD Thousands)
TABLE 5 Europe omega-3 for food application Market, By Source, 2019-2028 (USD Thousands)
TABLE 6 Europe Marine Based in Omega-3 for Food Application Market, By Source, 2019-2028 (USD Thousands)
TABLE 7 Fatty acid composition (%) of plant oils
TABLE 8 Europe Plant-Based in Omega-3 for Food Application Market, By Source, 2019-2028 (USD Thousands)
TABLE 9 Algae based segment is further divided into further sub segments and they are macroalgae and microalgae.
TABLE 10 Europe omega-3 for food application Market, By form, 2019-2028 (USD Thousands)
TABLE 11 Europe omega-3 for food application Market, By APPLICATION, 2019-2028 (USD Thousands)
TABLE 12 Europe Dietary Supplements in Omega-3 for Food Application Market, By Product Type, 2019-2028 (USD Thousands)
TABLE 13 Europe Dietary Supplements in Omega-3 for Food Application Market, By Product Type, 2019-2028 (USD Thousands)
TABLE 14 Europe Infant Formula in omega-3 for food application Market, By product type, 2019-2028 (USD Thousands)
TABLE 15 Europe Infant Formula in omega-3 for food application Market, By type, 2019-2028 (USD Thousands)
TABLE 16 Europe Sports Nutrition in omega-3 for food application Market, By type, 2019-2028 (USD Thousands)
TABLE 17 Europe Functional Food in omega-3 for food application Market, By type, 2019-2028 (USD Thousands)
TABLE 18 Europe Functional Food in omega-3 for food application Market, By type, 2019-2028 (USD Thousands)
TABLE 19 Europe Functional Food in omega-3 for food application Market, By type, 2019-2028 (USD Thousands)
TABLE 20 Europe Confectionery And Chocolate Products in omega-3 for food application Market, By type, 2019-2028 (USD Thousands)
TABLE 21 Europe Omega-3 for Food Application Market, By Function, 2019-2028 (USD Thousands)
TABLE 22 Europe Omega-3 for food application Market, By Country, 2019-2028 (USD Thousands)
TABLE 23 Europe Omega-3 for Food Application Market, By Type, 2019-2028 (USD Thousands)
TABLE 24 Europe Omega-3 for Food Application Market, By Source, 2019-2028 (USD Thousands)
TABLE 25 Europe Marine Based in Omega-3 for Food Application Market, By Source, 2019-2028 (USD Thousands)
TABLE 26 Europe Algae -Based in Omega-3 for Food Application Market, By Source, 2019-2028 (USD Thousands)
TABLE 27 Europe Plant-Based in Omega-3 for Food Application Market, By Source, 2019-2028 (USD Thousands)
TABLE 28 Europe Omega-3 for Food Application Market, By Form, 2019-2028 (USD Thousands)
TABLE 29 Europe Omega-3 for Food Application Market, By Application, 2019-2028 (USD Thousands)
TABLE 30 Europe Functional Food in Omega-3 for Food Application Market, By Product Type, 2019-2028 (USD Thousands)
TABLE 31 Europe Nutritional Bars in Omega-3 for Food Application Market, By Product Type, 2019-2028 (USD Thousands)
TABLE 32 Europe Functional Food in Omega-3 for Food Application Market, By Type, 2019-2028 (USD Thousands)
TABLE 33 Europe Confectionery And Chocolate Products in Omega-3 for Food Application Market, By Type, 2019-2028 (USD Thousands)
TABLE 34 Europe Sports Nutrition in Omega-3 for Food Application Market, By Type, 2019-2028 (USD Thousands)
TABLE 35 Europe Dietary Supplements in Omega-3 for Food Application Market, By Product Type, 2019-2028 (USD Thousands)
TABLE 36 Europe Dietary Supplements in Omega-3 for Food Application Market, By Type, 2019-2028 (USD Thousands)
TABLE 37 Europe Infant Formula in Omega-3 for Food Application Market, By Product Type, 2019-2028 (USD Thousands)
TABLE 38 Europe Infant Formula in Omega-3 for Food Application Market, By Type, 2019-2028 (USD Thousands)
TABLE 39 Europe Omega-3 for Food Application Market, By Function, 2019-2028 (USD Thousands)
TABLE 40 Germany Omega-3 for Food Application Market, By Type, 2019-2028 (USD Thousands)
TABLE 41 Germany Omega-3 for Food Application Market, By Source, 2019-2028 (USD Thousands)
TABLE 42 Germany Marine Based in Omega-3 for Food Application Market, By Source, 2019-2028 (USD Thousands)
TABLE 43 Germany Algae -Based in Omega-3 for Food Application Market, By Source, 2019-2028 (USD Thousands)
TABLE 44 Germany Plant-Based in Omega-3 for Food Application Market, By Source, 2019-2028 (USD Thousands)
TABLE 45 Germany Omega-3 for Food Application Market, By Form, 2019-2028 (USD Thousands)
TABLE 46 Germany Omega-3 for Food Application Market, By Application, 2019-2028 (USD Thousands)
TABLE 47 Germany Functional Food in Omega-3 for Food Application Market, By Product Type, 2019-2028 (USD Thousands)
TABLE 48 Germany Nutritional Bars in Omega-3 for Food Application Market, By Product Type, 2019-2028 (USD Thousands)
TABLE 49 Germany Functional Food in Omega-3 for Food Application Market, By Type, 2019-2028 (USD Thousands)
TABLE 50 Germany Confectionery And Chocolate Products in Omega-3 for Food Application Market, By Type, 2019-2028 (USD Thousands)
TABLE 51 Germany Sports Nutrition in Omega-3 for Food Application Market, By Type, 2019-2028 (USD Thousands)
TABLE 52 Germany Dietary Supplements in Omega-3 for Food Application Market, By Product Type, 2019-2028 (USD Thousands)
TABLE 53 Germany Dietary Supplements in Omega-3 for Food Application Market, By Type, 2019-2028 (USD Thousands)
TABLE 54 Germany Infant Formula in Omega-3 for Food Application Market, By Product Type, 2019-2028 (USD Thousands)
TABLE 55 Germany Infant Formula in Omega-3 for Food Application Market, By Type, 2019-2028 (USD Thousands)
TABLE 56 Germany Omega-3 for Food Application Market, By Function, 2019-2028 (USD Thousands)
TABLE 57 France Omega-3 for Food Application Market, By Type, 2019-2028 (USD Thousands)
TABLE 58 France Omega-3 for Food Application Market, By Source, 2019-2028 (USD Thousands)
TABLE 59 France Marine Based in Omega-3 for Food Application Market, By Source, 2019-2028 (USD Thousands)
TABLE 60 France Algae -Based in Omega-3 for Food Application Market, By Source, 2019-2028 (USD Thousands)
TABLE 61 France Plant-Based in Omega-3 for Food Application Market, By Source, 2019-2028 (USD Thousands)
TABLE 62 France Omega-3 for Food Application Market, By Form, 2019-2028 (USD Thousands)
TABLE 63 France Omega-3 for Food Application Market, By Application, 2019-2028 (USD Thousands)
TABLE 64 France Functional Food in Omega-3 for Food Application Market, By Product Type, 2019-2028 (USD Thousands)
TABLE 65 France Nutritional Bars in Omega-3 for Food Application Market, By Product Type, 2019-2028 (USD Thousands)
TABLE 66 France Functional Food in Omega-3 for Food Application Market, By Type, 2019-2028 (USD Thousands)
TABLE 67 France Confectionery And Chocolate Products in Omega-3 for Food Application Market, By Type, 2019-2028 (USD Thousands)
TABLE 68 France Sports Nutrition in Omega-3 for Food Application Market, By Type, 2019-2028 (USD Thousands)
TABLE 69 France Dietary Supplements in Omega-3 for Food Application Market, By Product Type, 2019-2028 (USD Thousands)
TABLE 70 France Dietary Supplements in Omega-3 for Food Application Market, By Type, 2019-2028 (USD Thousands)
TABLE 71 France Infant Formula in Omega-3 for Food Application Market, By Product Type, 2019-2028 (USD Thousands)
TABLE 72 France Infant Formula in Omega-3 for Food Application Market, By Type, 2019-2028 (USD Thousands)
TABLE 73 France Omega-3 for Food Application Market, By Function, 2019-2028 (USD Thousands)
TABLE 74 U.K. Omega-3 for Food Application Market, By Type, 2019-2028 (USD Thousands)
TABLE 75 U.K. Omega-3 for Food Application Market, By Source, 2019-2028 (USD Thousands)
TABLE 76 U.K. Marine Based in Omega-3 for Food Application Market, By Source, 2019-2028 (USD Thousands)
TABLE 77 U.K. Algae -Based in Omega-3 for Food Application Market, By Source, 2019-2028 (USD Thousands)
TABLE 78 U.K. Plant-Based in Omega-3 for Food Application Market, By Source, 2019-2028 (USD Thousands)
TABLE 79 U.K. Omega-3 for Food Application Market, By Form, 2019-2028 (USD Thousands)
TABLE 80 U.K. Omega-3 for Food Application Market, By Application, 2019-2028 (USD Thousands)
TABLE 81 U.K. Functional Food in Omega-3 for Food Application Market, By Product Type, 2019-2028 (USD Thousands)
TABLE 82 U.K. Nutritional Bars in Omega-3 for Food Application Market, By Product Type, 2019-2028 (USD Thousands)
TABLE 83 U.K. Functional Food in Omega-3 for Food Application Market, By Type, 2019-2028 (USD Thousands)
TABLE 84 U.K. Confectionery And Chocolate Products in Omega-3 for Food Application Market, By Type, 2019-2028 (USD Thousands)
TABLE 85 U.K. Sports Nutrition in Omega-3 for Food Application Market, By Type, 2019-2028 (USD Thousands)
TABLE 86 U.K. Dietary Supplements in Omega-3 for Food Application Market, By Product Type, 2019-2028 (USD Thousands)
TABLE 87 U.K. Dietary Supplements in Omega-3 for Food Application Market, By Type, 2019-2028 (USD Thousands)
TABLE 88 U.K. Infant Formula in Omega-3 for Food Application Market, By Product Type, 2019-2028 (USD Thousands)
TABLE 89 U.K. Infant Formula in Omega-3 for Food Application Market, By Type, 2019-2028 (USD Thousands)
TABLE 90 U.K. Omega-3 for Food Application Market, By Function, 2019-2028 (USD Thousands)
TABLE 91 spain Omega-3 for Food Application Market, By Type, 2019-2028 (USD Thousands)
TABLE 92 Spain Omega-3 for Food Application Market, By Source, 2019-2028 (USD Thousands)
TABLE 93 Spain Marine Based in Omega-3 for Food Application Market, By Source, 2019-2028 (USD Thousands)
TABLE 94 Spain Algae -Based in Omega-3 for Food Application Market, By Source, 2019-2028 (USD Thousands)
TABLE 95 Spain Plant-Based in Omega-3 for Food Application Market, By Source, 2019-2028 (USD Thousands)
TABLE 96 Spain Omega-3 for Food Application Market, By Form, 2019-2028 (USD Thousands)
TABLE 97 Spain Omega-3 for Food Application Market, By Application, 2019-2028 (USD Thousands)
TABLE 98 Spain Functional Food in Omega-3 for Food Application Market, By Product Type, 2019-2028 (USD Thousands)
TABLE 99 Spain Nutritional Bars in Omega-3 for Food Application Market, By Product Type, 2019-2028 (USD Thousands)
TABLE 100 Spain Functional Food in Omega-3 for Food Application Market, By Type, 2019-2028 (USD Thousands)
TABLE 101 Spain Confectionery And Chocolate Products in Omega-3 for Food Application Market, By Type, 2019-2028 (USD Thousands)
TABLE 102 Spain Sports Nutrition in Omega-3 for Food Application Market, By Type, 2019-2028 (USD Thousands)
TABLE 103 Spain Dietary Supplements in Omega-3 for Food Application Market, By Product Type, 2019-2028 (USD Thousands)
TABLE 104 Spain Dietary Supplements in Omega-3 for Food Application Market, By Type, 2019-2028 (USD Thousands)
TABLE 105 Spain Infant Formula in Omega-3 for Food Application Market, By Product Type, 2019-2028 (USD Thousands)
TABLE 106 Spain Infant Formula in Omega-3 for Food Application Market, By Type, 2019-2028 (USD Thousands)
TABLE 107 Spain Omega-3 for Food Application Market, By Function, 2019-2028 (USD Thousands)
TABLE 108 Italy Omega-3 for Food Application Market, By Type, 2019-2028 (USD Thousands)
TABLE 109 Italy Omega-3 for Food Application Market, By Source, 2019-2028 (USD Thousands)
TABLE 110 Italy Marine Based in Omega-3 for Food Application Market, By Source, 2019-2028 (USD Thousands)
TABLE 111 Italy Algae -Based in Omega-3 for Food Application Market, By Source, 2019-2028 (USD Thousands)
TABLE 112 Italy Plant-Based in Omega-3 for Food Application Market, By Source, 2019-2028 (USD Thousands)
TABLE 113 Italy Omega-3 for Food Application Market, By Form, 2019-2028 (USD Thousands)
TABLE 114 Italy Omega-3 for Food Application Market, By Application, 2019-2028 (USD Thousands)
TABLE 115 Italy Functional Food in Omega-3 for Food Application Market, By Product Type, 2019-2028 (USD Thousands)
TABLE 116 Italy Nutritional Bars in Omega-3 for Food Application Market, By Product Type, 2019-2028 (USD Thousands)
TABLE 117 Italy Functional Food in Omega-3 for Food Application Market, By Type, 2019-2028 (USD Thousands)
TABLE 118 Italy Confectionery And Chocolate Products in Omega-3 for Food Application Market, By Type, 2019-2028 (USD Thousands)
TABLE 119 Italy Sports Nutrition in Omega-3 for Food Application Market, By Type, 2019-2028 (USD Thousands)
TABLE 120 Italy Dietary Supplements in Omega-3 for Food Application Market, By Product Type, 2019-2028 (USD Thousands)
TABLE 121 Italy Dietary Supplements in Omega-3 for Food Application Market, By Type, 2019-2028 (USD Thousands)
TABLE 122 Italy Infant Formula in Omega-3 for Food Application Market, By Product Type, 2019-2028 (USD Thousands)
TABLE 123 Italy Infant Formula in Omega-3 for Food Application Market, By Type, 2019-2028 (USD Thousands)
TABLE 124 Italy Omega-3 for Food Application Market, By Function, 2019-2028 (USD Thousands)
TABLE 125 Netherlands Omega-3 for Food Application Market, By Type, 2019-2028 (USD Thousands)
TABLE 126 Netherlands Omega-3 for Food Application Market, By Source, 2019-2028 (USD Thousands)
TABLE 127 Netherlands Marine Based in Omega-3 for Food Application Market, By Source, 2019-2028 (USD Thousands)
TABLE 128 Netherlands Algae -Based in Omega-3 for Food Application Market, By Source, 2019-2028 (USD Thousands)
TABLE 129 Netherlands Plant-Based in Omega-3 for Food Application Market, By Source, 2019-2028 (USD Thousands)
TABLE 130 Netherlands Omega-3 for Food Application Market, By Form, 2019-2028 (USD Thousands)
TABLE 131 Netherlands Omega-3 for Food Application Market, By Application, 2019-2028 (USD Thousands)
TABLE 132 Netherlands Functional Food in Omega-3 for Food Application Market, By Product Type, 2019-2028 (USD Thousands)
TABLE 133 Netherlands Nutritional Bars in Omega-3 for Food Application Market, By Product Type, 2019-2028 (USD Thousands)
TABLE 134 Netherlands Functional Food in Omega-3 for Food Application Market, By Type, 2019-2028 (USD Thousands)
TABLE 135 Netherlands Confectionery And Chocolate Products in Omega-3 for Food Application Market, By Type, 2019-2028 (USD Thousands)
TABLE 136 Netherlands Sports Nutrition in Omega-3 for Food Application Market, By Type, 2019-2028 (USD Thousands)
TABLE 137 Netherlands Dietary Supplements in Omega-3 for Food Application Market, By Product Type, 2019-2028 (USD Thousands)
TABLE 138 Netherlands Dietary Supplements in Omega-3 for Food Application Market, By Type, 2019-2028 (USD Thousands)
TABLE 139 Netherlands Infant Formula in Omega-3 for Food Application Market, By Product Type, 2019-2028 (USD Thousands)
TABLE 140 Netherlands Infant Formula in Omega-3 for Food Application Market, By Type, 2019-2028 (USD Thousands)
TABLE 141 Netherlands Omega-3 for Food Application Market, By Function, 2019-2028 (USD Thousands)
TABLE 142 Russia Omega-3 for Food Application Market, By Type, 2019-2028 (USD Thousands)
TABLE 143 Russia Omega-3 for Food Application Market, By Source, 2019-2028 (USD Thousands)
TABLE 144 Russia Marine Based in Omega-3 for Food Application Market, By Source, 2019-2028 (USD Thousands)
TABLE 145 Russia Algae -Based in Omega-3 for Food Application Market, By Source, 2019-2028 (USD Thousands)
TABLE 146 Russia Plant-Based in Omega-3 for Food Application Market, By Source, 2019-2028 (USD Thousands)
TABLE 147 Russia Omega-3 for Food Application Market, By Form, 2019-2028 (USD Thousands)
TABLE 148 Russia Omega-3 for Food Application Market, By Application, 2019-2028 (USD Thousands)
TABLE 149 Russia Functional Food in Omega-3 for Food Application Market, By Product Type, 2019-2028 (USD Thousands)
TABLE 150 Russia Nutritional Bars in Omega-3 for Food Application Market, By Product Type, 2019-2028 (USD Thousands)
TABLE 151 Russia Functional Food in Omega-3 for Food Application Market, By Type, 2019-2028 (USD Thousands)
TABLE 152 Russia Confectionery And Chocolate Products in Omega-3 for Food Application Market, By Type, 2019-2028 (USD Thousands)
TABLE 153 Russia Sports Nutrition in Omega-3 for Food Application Market, By Type, 2019-2028 (USD Thousands)
TABLE 154 Russia Dietary Supplements in Omega-3 for Food Application Market, By Product Type, 2019-2028 (USD Thousands)
TABLE 155 Russia Dietary Supplements in Omega-3 for Food Application Market, By Type, 2019-2028 (USD Thousands)
TABLE 156 Russia Infant Formula in Omega-3 for Food Application Market, By Product Type, 2019-2028 (USD Thousands)
TABLE 157 Russia Infant Formula in Omega-3 for Food Application Market, By Type, 2019-2028 (USD Thousands)
TABLE 158 Russia Omega-3 for Food Application Market, By Function, 2019-2028 (USD Thousands)
TABLE 159 Switzerland Omega-3 for Food Application Market, By Type, 2019-2028 (USD Thousands)
TABLE 160 Switzerland Omega-3 for Food Application Market, By Source, 2019-2028 (USD Thousands)
TABLE 161 Switzerland Marine Based in Omega-3 for Food Application Market, By Source, 2019-2028 (USD Thousands)
TABLE 162 Switzerland Algae -Based in Omega-3 for Food Application Market, By Source, 2019-2028 (USD Thousands)
TABLE 163 Switzerland Plant-Based in Omega-3 for Food Application Market, By Source, 2019-2028 (USD Thousands)
TABLE 164 Switzerland Omega-3 for Food Application Market, By Form, 2019-2028 (USD Thousands)
TABLE 165 Switzerland Omega-3 for Food Application Market, By Application, 2019-2028 (USD Thousands)
TABLE 166 Switzerland Functional Food in Omega-3 for Food Application Market, By Product Type, 2019-2028 (USD Thousands)
TABLE 167 Switzerland Nutritional Bars in Omega-3 for Food Application Market, By Product Type, 2019-2028 (USD Thousands)
TABLE 168 Switzerland Functional Food in Omega-3 for Food Application Market, By Type, 2019-2028 (USD Thousands)
TABLE 169 Switzerland Confectionery And Chocolate Products in Omega-3 for Food Application Market, By Type, 2019-2028 (USD Thousands)
TABLE 170 Switzerland Sports Nutrition in Omega-3 for Food Application Market, By Type, 2019-2028 (USD Thousands)
TABLE 171 Switzerland Dietary Supplements in Omega-3 for Food Application Market, By Product Type, 2019-2028 (USD Thousands)
TABLE 172 Switzerland Dietary Supplements in Omega-3 for Food Application Market, By Type, 2019-2028 (USD Thousands)
TABLE 173 Switzerland Infant Formula in Omega-3 for Food Application Market, By Product Type, 2019-2028 (USD Thousands)
TABLE 174 Switzerland Infant Formula in Omega-3 for Food Application Market, By Type, 2019-2028 (USD Thousands)
TABLE 175 Switzerland Omega-3 for Food Application Market, By Function, 2019-2028 (USD Thousands)
TABLE 176 poland Omega-3 for Food Application Market, By Type, 2019-2028 (USD Thousands)
TABLE 177 poland Omega-3 for Food Application Market, By Source, 2019-2028 (USD Thousands)
TABLE 178 poland Marine Based in Omega-3 for Food Application Market, By Source, 2019-2028 (USD Thousands)
TABLE 179 poland Algae -Based in Omega-3 for Food Application Market, By Source, 2019-2028 (USD Thousands)
TABLE 180 poland Plant-Based in Omega-3 for Food Application Market, By Source, 2019-2028 (USD Thousands)
TABLE 181 poland Omega-3 for Food Application Market, By Form, 2019-2028 (USD Thousands)
TABLE 182 poland Omega-3 for Food Application Market, By Application, 2019-2028 (USD Thousands)
TABLE 183 poland Functional Food in Omega-3 for Food Application Market, By Product Type, 2019-2028 (USD Thousands)
TABLE 184 poland Nutritional Bars in Omega-3 for Food Application Market, By Product Type, 2019-2028 (USD Thousands)
TABLE 185 poland Functional Food in Omega-3 for Food Application Market, By Type, 2019-2028 (USD Thousands)
TABLE 186 poland Confectionery And Chocolate Products in Omega-3 for Food Application Market, By Type, 2019-2028 (USD Thousands)
TABLE 187 poland Sports Nutrition in Omega-3 for Food Application Market, By Type, 2019-2028 (USD Thousands)
TABLE 188 poland Dietary Supplements in Omega-3 for Food Application Market, By Product Type, 2019-2028 (USD Thousands)
TABLE 189 poland Dietary Supplements in Omega-3 for Food Application Market, By Type, 2019-2028 (USD Thousands)
TABLE 190 poland Infant Formula in Omega-3 for Food Application Market, By Product Type, 2019-2028 (USD Thousands)
TABLE 191 poland Infant Formula in Omega-3 for Food Application Market, By Type, 2019-2028 (USD Thousands)
TABLE 192 poland Omega-3 for Food Application Market, By Function, 2019-2028 (USD Thousands)
TABLE 193 Belgium Omega-3 for Food Application Market, By Type, 2019-2028 (USD Thousands)
TABLE 194 Belgium Omega-3 for Food Application Market, By Source, 2019-2028 (USD Thousands)
TABLE 195 Belgium Marine Based in Omega-3 for Food Application Market, By Source, 2019-2028 (USD Thousands)
TABLE 196 Belgium Algae -Based in Omega-3 for Food Application Market, By Source, 2019-2028 (USD Thousands)
TABLE 197 Belgium Plant-Based in Omega-3 for Food Application Market, By Source, 2019-2028 (USD Thousands)
TABLE 198 Belgium Omega-3 for Food Application Market, By Form, 2019-2028 (USD Thousands)
TABLE 199 Belgium Omega-3 for Food Application Market, By Application, 2019-2028 (USD Thousands)
TABLE 200 Belgium Functional Food in Omega-3 for Food Application Market, By Product Type, 2019-2028 (USD Thousands)
TABLE 201 Belgium Nutritional Bars in Omega-3 for Food Application Market, By Product Type, 2019-2028 (USD Thousands)
TABLE 202 Belgium Functional Food in Omega-3 for Food Application Market, By Type, 2019-2028 (USD Thousands)
TABLE 203 Belgium Confectionery And Chocolate Products in Omega-3 for Food Application Market, By Type, 2019-2028 (USD Thousands)
TABLE 204 Belgium Sports Nutrition in Omega-3 for Food Application Market, By Type, 2019-2028 (USD Thousands)
TABLE 205 Belgium Dietary Supplements in Omega-3 for Food Application Market, By Product Type, 2019-2028 (USD Thousands)
TABLE 206 Belgium Dietary Supplements in Omega-3 for Food Application Market, By Type, 2019-2028 (USD Thousands)
TABLE 207 Belgium Infant Formula in Omega-3 for Food Application Market, By Product Type, 2019-2028 (USD Thousands)
TABLE 208 Belgium Infant Formula in Omega-3 for Food Application Market, By Type, 2019-2028 (USD Thousands)
TABLE 209 Belgium Omega-3 for Food Application Market, By Function, 2019-2028 (USD Thousands)
TABLE 210 sweden Omega-3 for Food Application Market, By Type, 2019-2028 (USD Thousands)
TABLE 211 sweden Omega-3 for Food Application Market, By Source, 2019-2028 (USD Thousands)
TABLE 212 sweden Marine Based in Omega-3 for Food Application Market, By Source, 2019-2028 (USD Thousands)
TABLE 213 sweden Algae -Based in Omega-3 for Food Application Market, By Source, 2019-2028 (USD Thousands)
TABLE 214 sweden Plant-Based in Omega-3 for Food Application Market, By Source, 2019-2028 (USD Thousands)
TABLE 215 sweden Omega-3 for Food Application Market, By Form, 2019-2028 (USD Thousands)
TABLE 216 sweden Omega-3 for Food Application Market, By Application, 2019-2028 (USD Thousands)
TABLE 217 sweden Functional Food in Omega-3 for Food Application Market, By Product Type, 2019-2028 (USD Thousands)
TABLE 218 sweden Nutritional Bars in Omega-3 for Food Application Market, By Product Type, 2019-2028 (USD Thousands)
TABLE 219 sweden Functional Food in Omega-3 for Food Application Market, By Type, 2019-2028 (USD Thousands)
TABLE 220 sweden Confectionery And Chocolate Products in Omega-3 for Food Application Market, By Type, 2019-2028 (USD Thousands)
TABLE 221 sweden Sports Nutrition in Omega-3 for Food Application Market, By Type, 2019-2028 (USD Thousands)
TABLE 222 sweden Dietary Supplements in Omega-3 for Food Application Market, By Product Type, 2019-2028 (USD Thousands)
TABLE 223 sweden Dietary Supplements in Omega-3 for Food Application Market, By Type, 2019-2028 (USD Thousands)
TABLE 224 sweden Infant Formula in Omega-3 for Food Application Market, By Product Type, 2019-2028 (USD Thousands)
TABLE 225 sweden Infant Formula in Omega-3 for Food Application Market, By Type, 2019-2028 (USD Thousands)
TABLE 226 sweden Omega-3 for Food Application Market, By Function, 2019-2028 (USD Thousands)
TABLE 227 denmark Omega-3 for Food Application Market, By Type, 2019-2028 (USD Thousands)
TABLE 228 denmark Omega-3 for Food Application Market, By Source, 2019-2028 (USD Thousands)
TABLE 229 denmark Marine Based in Omega-3 for Food Application Market, By Source, 2019-2028 (USD Thousands)
TABLE 230 denmark Algae -Based in Omega-3 for Food Application Market, By Source, 2019-2028 (USD Thousands)
TABLE 231 denmark Plant-Based in Omega-3 for Food Application Market, By Source, 2019-2028 (USD Thousands)
TABLE 232 denmark Omega-3 for Food Application Market, By Form, 2019-2028 (USD Thousands)
TABLE 233 denmark Omega-3 for Food Application Market, By Application, 2019-2028 (USD Thousands)
TABLE 234 denmark Functional Food in Omega-3 for Food Application Market, By Product Type, 2019-2028 (USD Thousands)
TABLE 235 denmark Nutritional Bars in Omega-3 for Food Application Market, By Product Type, 2019-2028 (USD Thousands)
TABLE 236 denmark Functional Food in Omega-3 for Food Application Market, By Type, 2019-2028 (USD Thousands)
TABLE 237 denmark Confectionery And Chocolate Products in Omega-3 for Food Application Market, By Type, 2019-2028 (USD Thousands)
TABLE 238 denmark Sports Nutrition in Omega-3 for Food Application Market, By Type, 2019-2028 (USD Thousands)
TABLE 239 denmark Dietary Supplements in Omega-3 for Food Application Market, By Product Type, 2019-2028 (USD Thousands)
TABLE 240 denmark Dietary Supplements in Omega-3 for Food Application Market, By Type, 2019-2028 (USD Thousands)
TABLE 241 denmark Infant Formula in Omega-3 for Food Application Market, By Product Type, 2019-2028 (USD Thousands)
TABLE 242 denmark Infant Formula in Omega-3 for Food Application Market, By Type, 2019-2028 (USD Thousands)
TABLE 243 denmark Omega-3 for Food Application Market, By Function, 2019-2028 (USD Thousands)
TABLE 244 turkey Omega-3 for Food Application Market, By Type, 2019-2028 (USD Thousands)
TABLE 245 turkey Omega-3 for Food Application Market, By Source, 2019-2028 (USD Thousands)
TABLE 246 turkey Marine Based in Omega-3 for Food Application Market, By Source, 2019-2028 (USD Thousands)
TABLE 247 turkey Algae -Based in Omega-3 for Food Application Market, By Source, 2019-2028 (USD Thousands)
TABLE 248 turkey Plant-Based in Omega-3 for Food Application Market, By Source, 2019-2028 (USD Thousands)
TABLE 249 turkey Omega-3 for Food Application Market, By Form, 2019-2028 (USD Thousands)
TABLE 250 turkey Omega-3 for Food Application Market, By Application, 2019-2028 (USD Thousands)
TABLE 251 turkey Functional Food in Omega-3 for Food Application Market, By Product Type, 2019-2028 (USD Thousands)
TABLE 252 turkey Nutritional Bars in Omega-3 for Food Application Market, By Product Type, 2019-2028 (USD Thousands)
TABLE 253 turkey Functional Food in Omega-3 for Food Application Market, By Type, 2019-2028 (USD Thousands)
TABLE 254 turkey Confectionery And Chocolate Products in Omega-3 for Food Application Market, By Type, 2019-2028 (USD Thousands)
TABLE 255 turkey Sports Nutrition in Omega-3 for Food Application Market, By Type, 2019-2028 (USD Thousands)
TABLE 256 turkey Dietary Supplements in Omega-3 for Food Application Market, By Product Type, 2019-2028 (USD Thousands)
TABLE 257 turkey Dietary Supplements in Omega-3 for Food Application Market, By Type, 2019-2028 (USD Thousands)
TABLE 258 turkey Infant Formula in Omega-3 for Food Application Market, By Product Type, 2019-2028 (USD Thousands)
TABLE 259 turkey Infant Formula in Omega-3 for Food Application Market, By Type, 2019-2028 (USD Thousands)
TABLE 260 turkey Omega-3 for Food Application Market, By Function, 2019-2028 (USD Thousands)
TABLE 261 Rest of europe Omega-3 for Food Application Market, By Type, 2019-2028 (USD Thousands)
図表一覧
FIGURE 1 Europe omega-3 for food application MARKET: segmentation
FIGURE 2 EUROPE OMEGA-3 FOR FOOD APPLICATION MARKET : data triangulation
FIGURE 3 Europe omega-3 for food application MARKET: DROC ANALYSIS
FIGURE 4 Europe omega-3 for food application MARKET: EUROPE VS REGIONAL MARKET ANALYSIS
FIGURE 5 EUROPE OMEGA-3 FOR FOOD APPLICATION MARKET: COMPANY RESEARCH ANALYSIS
FIGURE 6 EUROPE OMEGA-3 FOR FOOD APPLICATION MARKET: INTERVIEW DEMOGRAPHICS
FIGURE 7 Europe omega-3 for food application MARKET: DBMR MARKET POSITION GRID
FIGURE 8 EUROPE OMEGA-3 FOR FOOD APPLICATION MARKET: vendor share analysis
FIGURE 9 Europe omega-3 for food application market: MARKET APPLICATIONS COVERAGE GRID
FIGURE 10 Europe omega-3 for food application MARKET: SEGMENTATION
FIGURE 11 Abundant availability of raw material and Health benefits associated with the omega-3 consumption are leading the growth of the Europe omega-3 for food application market IN THE FORECAST PERIOD of 2021 To 2028
FIGURE 12 EICOSAPENTAENOIC ACID (EPA)+ DOCOSAHEXAENOIC ACID (DHA) SEGMENT IS EXPECTED TO ACCOUNT FOR THE LARGEST SHARE OF EUROPE OMEGA-3 FOR FOOD APPLICATION MARKETIN 2021 & 2028
FIGURE 13 Fish Oil Production in Thousand Tonnes (2017-2020)
FIGURE 14 Europe Seaweed Production in Million Tonnes (2011-2015)
FIGURE 15 CONSUMPTION OF FISH OIL IN THOUSAND TONNES (2016-2020)
FIGURE 16 Supply chain of Europe omega-3 for food APPLICATION market
FIGURE 17 DRIVERS, RESTRAINTS, OPPORTUNITIES AND CHALLENGES OF EUROPE omega-3 for food application market
FIGURE 18 World prices of fish oil from 2017-2026 in USD / Tonnes
FIGURE 19 PREVALENCE OF HYPERTENSION AMONG ADULTS AGED 18 AND OVER, BY SEX AND AGE IN THE U.S. (2017–2018)
FIGURE 20 Europe Omega-3 for Food Application Market, By Type
FIGURE 21 Europe omega-3 for food application, By form, 2019-2028 (USD Thousands)
FIGURE 22 Europe omega-3 for food application, By form
FIGURE 23 Europe omega-3 for food application, By APPLICATION, 2019-2028 (USD Thousands)
FIGURE 24 Europe Omega-3 for Food Application Market, BY Function
FIGURE 25 Europe Omega-3 for food application market: SNAPSHOT (2020)
FIGURE 26 Europe Omega-3 for food application market: BY COUNTRY (2020)
FIGURE 27 Europe Omega-3 for food application market: BY COUNTRY (2021 & 2028)
FIGURE 28 Europe Omega-3 for food application market: BY COUNTRY (2020 & 2028)
FIGURE 29 Europe Omega-3 for food application market: BY TYPE (2021-2028)
FIGURE 30 Europe omega-3 for food application market: company share 2020 (%)
調査方法
データ収集と基準年分析は、大規模なサンプル サイズのデータ収集モジュールを使用して行われます。この段階では、さまざまなソースと戦略を通じて市場情報または関連データを取得します。過去に取得したすべてのデータを事前に調査および計画することも含まれます。また、さまざまな情報ソース間で見られる情報の不一致の調査も含まれます。市場データは、市場統計モデルと一貫性モデルを使用して分析および推定されます。また、市場シェア分析と主要トレンド分析は、市場レポートの主要な成功要因です。詳細については、アナリストへの電話をリクエストするか、お問い合わせをドロップダウンしてください。
DBMR 調査チームが使用する主要な調査方法は、データ マイニング、データ変数が市場に与える影響の分析、および一次 (業界の専門家) 検証を含むデータ三角測量です。データ モデルには、ベンダー ポジショニング グリッド、市場タイムライン分析、市場概要とガイド、企業ポジショニング グリッド、特許分析、価格分析、企業市場シェア分析、測定基準、グローバルと地域、ベンダー シェア分析が含まれます。調査方法について詳しくは、お問い合わせフォームから当社の業界専門家にご相談ください。
カスタマイズ可能
Data Bridge Market Research は、高度な形成的調査のリーダーです。当社は、既存および新規のお客様に、お客様の目標に合致し、それに適したデータと分析を提供することに誇りを持っています。レポートは、対象ブランドの価格動向分析、追加国の市場理解 (国のリストをお問い合わせください)、臨床試験結果データ、文献レビュー、リファービッシュ市場および製品ベース分析を含めるようにカスタマイズできます。対象競合他社の市場分析は、技術ベースの分析から市場ポートフォリオ戦略まで分析できます。必要な競合他社のデータを、必要な形式とデータ スタイルでいくつでも追加できます。当社のアナリスト チームは、粗い生の Excel ファイル ピボット テーブル (ファクト ブック) でデータを提供したり、レポートで利用可能なデータ セットからプレゼンテーションを作成するお手伝いをしたりすることもできます。