ヨーロッパの漏水検知市場 – 業界動向と2028年までの予測

Request for TOC TOC のリクエスト Speak to Analyst アナリストに相談する Buy Now今すぐ購入 Inquire Before Buying 事前に問い合わせる Free Sample Report 無料サンプルレポート

ヨーロッパの漏水検知市場 – 業界動向と2028年までの予測

  • Semiconductors and Electronics
  • Published Report
  • Apr 2021
  • Europe
  • 350 ページ
  • テーブル数: 162
  • 図の数: 22

ヨーロッパのリーク検知市場、タイプ別(上流、中流、下流)、製品タイプ(ハンドヘルドガス検知器、UAVベースの検知器、有人航空機検知器、車両ベースの検知器)、技術(音響/超音波、圧力流量偏差法、拡張リアルタイム過渡モデル(E-RTTM)、熱画像、質量/体積バランス、蒸気検知、レーザー吸収およびライダー、油圧リーク検知、負圧バルブなど)、エンドユーザー(石油およびガス、化学プラント、水処理プラント、火力発電所、鉱業およびスラリーなど)、国別(ドイツ、フランス、英国、イタリア、スペイン、ロシア、トルコ、ベルギー、オランダ、スイス、その他のヨーロッパ)2028年までの業界動向と予測

ヨーロッパの漏水検知市場

市場分析と洞察:ヨーロッパの漏水検知市場

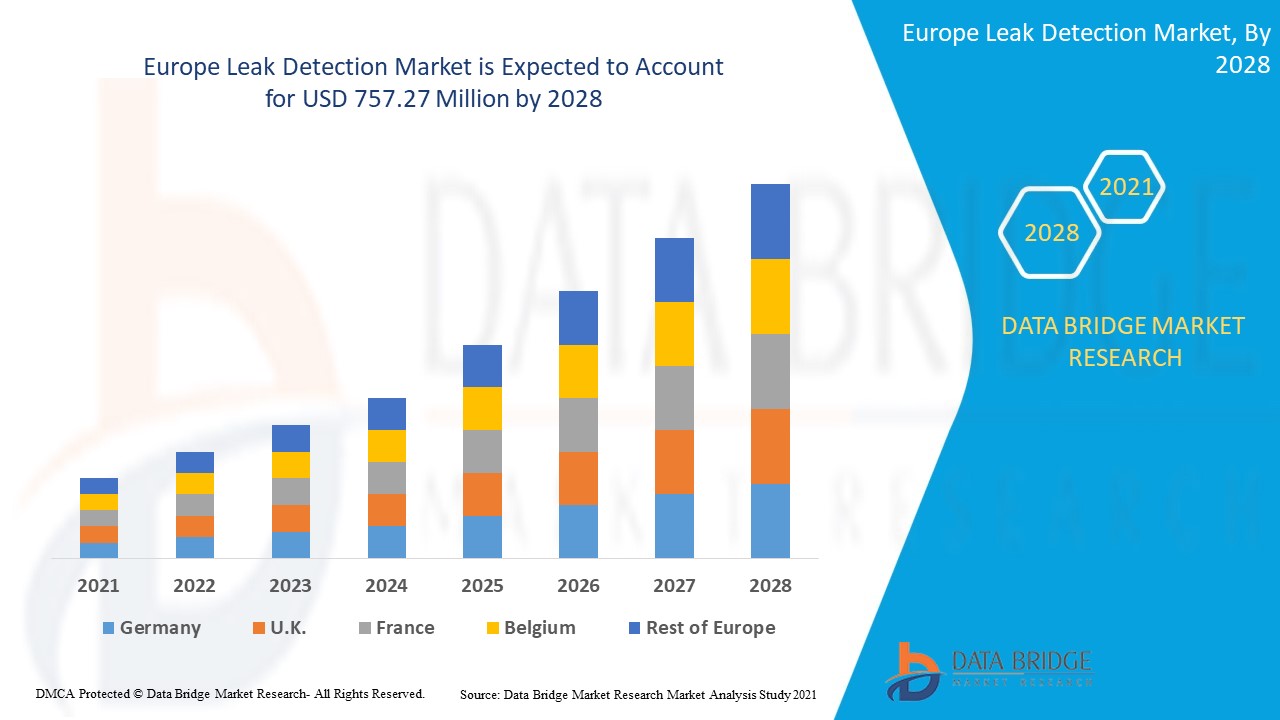
ヨーロッパの漏れ検出市場は、2021年から2028年の予測期間に市場の成長が見込まれています。データブリッジマーケットリサーチは、市場は2021年から2028年の予測期間に7.4%のCAGRで成長し、2028年までに7億5,727万米ドルに達すると分析しています。石油とガスのパイプラインと貯蔵プラントのインフラストラクチャの成長の増加は、市場の成長を牽引する主な要因です。

漏れまたは漏出という用語は、さまざまな液体やガスを収容/移送する必要があるパイプ、バッテリー、密封製品、チャンバー、または保管容器の包囲壁または接合部における意図しない亀裂、穴、または多孔性を意味します。これらの亀裂または穴により、密閉された媒体から液体やガスが漏れ出します。環境への損失や被害を減らすために、漏れはできるだけ早く特定する必要があり、そのためにさまざまな漏れ検出センサーと機器が使用されます。漏れ検出システムの主な機能は、密封された製品の漏れの位置を特定し、サイズを測定することです。

パイプライン漏れ事故の多発と、漏れ検知器への高度な技術の統合の増加により、漏れ検知市場が拡大しています。たとえば、2020 年 1 月、FLIR Systems Inc. は、メタンやその他の産業ガスを検知するための初の非冷却型固定マウント接続サーマル カメラ FLIR GF77a を発売しました。この光学ガス イメージング (OGI) シリーズ製品の新発売により、同社は製品ポートフォリオを拡張し、顧客ベースを拡大します。

このリーク検出市場レポートでは、市場シェア、新開発、製品パイプライン分析、国内および現地の市場プレーヤーの影響の詳細を提供し、新たな収益源、市場規制の変更、製品承認、戦略的決定、製品発売、地理的拡大、市場における技術革新の観点からの機会を分析します。分析と市場シナリオを理解するには、アナリスト概要についてお問い合わせください。当社のチームが、希望する目標を達成するための収益影響ソリューションの作成をお手伝いします。

ヨーロッパの漏水検知市場

ヨーロッパの漏水検知市場の範囲と市場規模

リーク検出市場は、タイプ、製品タイプ、テクノロジー、エンドユーザーに基づいてセグメント化されています。セグメント間の成長は、ニッチな成長分野と市場へのアプローチ戦略を分析し、コアアプリケーション領域とターゲット市場の違いを決定するのに役立ちます。

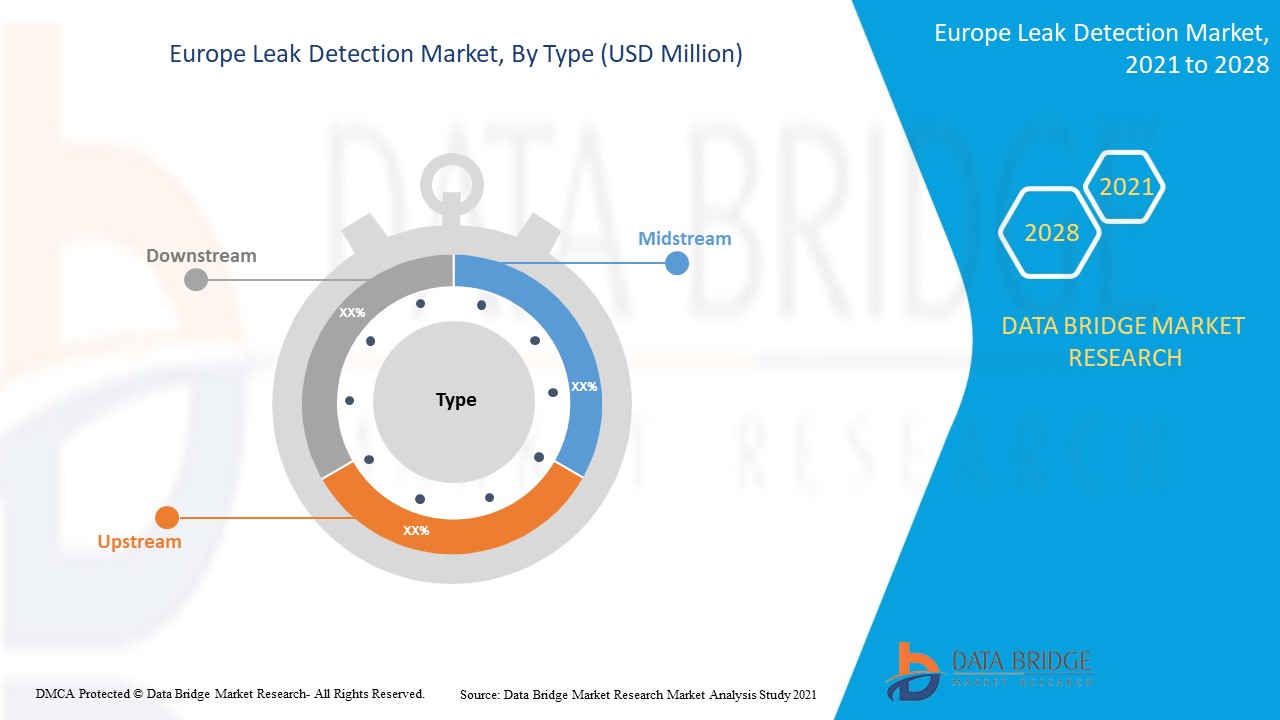
  • タイプに基づいて、リーク検出市場は上流、中流、下流に分割されます。2021年には、中流セグメントが最大の市場シェアを占めました。これは、中流セグメントが基本的にパイプラインなどのさまざまな輸送モードを介した原油と天然ガスの輸送を扱っているためです。これらのパイプラインは、漏れ事故を回避して人命や財産の損失を引き起こすために、漏れから保護する必要があります。したがって、中流がタイプセグメントを支配しています。
  • 製品タイプに基づいて、漏れ検出市場は、ハンドヘルドガス検出器、UAVベースの検出器、有人航空機検出器、車両ベースの検出器に分類されます。2021年には、車両ベースの検出器が最大の市場シェアを占めました。これは、車両に簡単に取り付けることができ、移動中の車両を通じてパイプラインを監視するために使用できるためです。これは、漏れを検出する最も経済的で迅速な方法であるため、製品タイプセグメントを支配しています。
  • 技術に基づいて、漏れ検出市場は、音響/超音波、光ファイバー、圧力流量偏差法、拡張リアルタイム過渡モデル(E-RTTM)、熱画像、質量/体積バランス、蒸気センシング、レーザー吸収およびLIDAR、油圧漏れ検出、負圧波などに分類されます。 2021年には、音響/超音波が最大の市場シェアを占めました。これは、漏れの検出が速く、低コストのソリューションであるだけでなく、早期検出が可能で、損失を早い段階で防ぐことができるためです。これらの要因により、技術セグメントでは音響/超音波が最も高い成長を遂げています。
  • エンドユーザーに基づいて、漏れ検出市場は、石油とガス、化学プラント、水処理プラント、火力発電所、鉱業とスラリーなどに分類されます。 2021年には、石油とガスが最大の市場シェアを占めました。この業界は、原油とガスの漏れやメタン排出を防ぐための漏れ検出システムの主要なユーザーであるためです。漏れは、重大な人命と財産の損失につながる可能性があります。さらに、漏れ事故を防ぐためのいくつかの政府規制により、石油とガス業界での漏れ検出の需要が高まっています。

ヨーロッパの漏水検知市場の国別分析

漏れ検出市場が分析され、市場規模の情報が国、タイプ、製品タイプ、技術、エンドユーザー別に提供されます。

ヨーロッパの漏れ検出市場レポートで取り上げられている国は、ドイツ、イギリス、フランス、スイス、イタリア、スペイン、オランダ、ロシア、ベルギー、トルコ、その他のヨーロッパ諸国です。

ロシアは、この地域における多数の石油・ガス生産およびパイプライン移送プロジェクトにより、最大の市場シェアを占めた。

レポートの国別セクションでは、市場の現在および将来の傾向に影響を与える国内市場における個別の市場影響要因と規制の変更も提供しています。新規販売、交換販売、国の人口統計、規制行為、輸出入関税などのデータ ポイントは、各国の市場シナリオを予測するために使用される主要な指標の一部です。また、国別データの予測分析を提供する際には、ヨーロッパ ブランドの存在と可用性、および地元および国内ブランドとの競争が激しいか少ないために直面​​する課題、販売チャネルの影響も考慮されます。

パイプライン漏洩事故の多発

リーク検出市場では、販売、コンポーネント販売、リーク検出の技術開発の影響、リーク検出市場へのサポートに関する規制シナリオの変化など、各国の産業成長に関する詳細な市場分析も提供されます。データは、2011 年から 2019 年までの履歴期間で利用できます。

競争環境とリーク検出市場シェア分析

リーク検出市場の競争状況は、競合他社ごとに詳細を提供します。含まれる詳細には、会社概要、会社の財務状況、収益、市場の可能性、研究開発への投資、新しい市場への取り組み、ヨーロッパでのプレゼンス、生産拠点と施設、会社の強みと弱み、製品の発売、製品試験パイプライン、製品の承認、特許、製品の幅と広さ、アプリケーションの優位性、技術ライフライン曲線などがあります。提供されている上記のデータ ポイントは、リーク検出市場に関連する会社の焦点にのみ関連しています。

このレポートで取り上げられている主要企業には、FLIR SYSTEMS、Inc.、ABB、Honeywell International Inc.、Siemens Energy、Pentair、ClampOn AS、Schneider Electric、Atmos International、Xylem、Emerson Electric Co.、KROHNE Messtechnik GmbH、PERMA-PIPE International Holdings、Inc.、TTK、PSI Software AG、MSA、HIMA、AVEVA Group plc、Yokogawa Electric Corporation、INFICON、Fotech Group Ltd.、Asel-Tech Inc.、MAGNUM Pirex AG / MAGNUM LEO-Pipe GmbH、OptaSense Ltd. などがあります。DBMR のアナリストは、競争力を理解し、各競合他社の競合分析を個別に提供します。

世界中の企業によって多くの製品開発も開始されており、漏れ検出市場の成長も加速しています。

例えば、

  • 2020年10月、ABBは都市住民の安全を守るために公益事業業界向けの初の総合ガス漏れ検知システムソリューションである新しいABB MicroGuardを発売しました。MicroGuardはABBのMobileGuardと連携して、危険なガス漏れをより迅速かつ容易に特定します。この新製品の発売により、同社は製品ラインを拡大しました。
  • 2019年12月、ハネウェル・インターナショナル社は、石油・ガス、石油化学、電力産業における安全性、運用パフォーマンス、排出削減の最大化に役立つ革新的でインテリジェントな視覚的ガス監視ソリューションのプロバイダーであるRebellion Photonics社を買収したことを発表しました。この買収により、同社は製品ポートフォリオを拡大することができます。

生産拡大、新製品開発、その他の戦略により、カバレッジとプレゼンスが拡大し、企業の市場シェアが高まります。また、組織にとって、漏れ検出の提供を改善するメリットももたらされます。


SKU-

世界初のマーケットインテリジェンスクラウドに関するレポートにオンラインでアクセスする

  • インタラクティブなデータ分析ダッシュボード
  • 成長の可能性が高い機会のための企業分析ダッシュボード
  • カスタマイズとクエリのためのリサーチアナリストアクセス
  • インタラクティブなダッシュボードによる競合分析
  • 最新ニュース、更新情報、トレンド分析
  • 包括的な競合追跡のためのベンチマーク分析のパワーを活用
デモのリクエスト

目次

  1. introduction
    1. OBJECTIVES OF THE STUDY
    2. MARKET DEFINITION
    3. OVERVIEW of EUROPE LEAK DETECTION MARKET
    4. LIMITATIONs
    5. MARKETS COVERED
  2. MARKET SEGMENTATION
    1. MARKETS COVERED
    2. geographical scope
    3. years considered for the study
    4. currency and pricing
    5. DBMR TRIPOD DATA VALIDATION MODEL
    6. primary interviews with key opinion leaders
    7. DBMR MARKET POSITION GRID
    8. vendor share analysis
    9. MULTIVARIATE MODELLING
    10. type LIFELINE CURVE
    11. secondary sourcEs
    12. assumptions
  3. EXECUTIVE SUMMARY
  4. premium insights
    1. Oil and gas Projects incorporating Leak detection products
    2. Upcoming Leak detection Tenders for Various End-Users
  5. market overview
    1. drivers
      1. Increasing growth in oil and gas pipeline and storage plant infrastructure
      2. High number of pipeline leakages incidents
      3. Rising Government initiatives to prevent methane leak detection
      4. Aging water infrastructure in developed countries
      5. Increasing need of leak detectors in chemical plants
    2. RESTRAINT
      1. technical complications with leak detectors
    3. OPPoRTUNITies
      1. Rising oil and gas production Europely
      2. Increasing Europe oil and natural gas consumption
      3. Increasing integration of advanced technology in leak detectors
      4. increasing GROWTH IN INVESTMENTS AND EXPANSIONS MADE BY the MARKET PLAYERS
      5. Emergence of new product developments
    4. CHALLENGES
      1. challenge associated with large diameter pipelines for effective leak detection
      2. rising focus on the development of renewable energy generation
      3. Europe economic crisis
  6. Impact of Covid-19 on Europe Leak Detection Market
    1. ANALYSIS ON IMPACT OF COVID-19 ON THE MARKET
    2. AFTERMATH OF COVID-19 AND GOVERNMENT INITIATIVE TO BOOST THE MARKET
    3. STRATEGIC DECISIONS FOR MANUFACTURERS AFTER COVID-19 TO GAIN COMPETITIVE MARKET SHARE
    4. IMPACT ON DEMAND
    5. IMPACT ON SUPPLY CHAIN
    6. CONCLUSION
  7. Europe leak detection MARKET, BY type
    1. overview
    2. Midstream
    3. Downstream
    4. upstream
  8. Europe leak detection MARKET, BY product type
    1. overview
    2. Vehicle-Based Detectors
    3. UAV-Based Detectors
    4. Handheld Gas Detectors
    5. Manned Aircraft Detectors
    6. others
  9. Europe leak detection MARKET, BY technology
    1. overview
    2. Acoustic/Ultrasound
    3. Extended Real-Time Transient Model (E-RTTM)
    4. Negative Pressure Waves
    5. Thermal Imaging
    6. Fiber Optic
    7. Laser Absorption and LIDAR
    8. Pressure-Flow Deviation Method
    9. Mass/Volume Balance
    10. Vapor Sensing
    11. Hydraulic Leak Detection
    12. others
  10. Europe leak detection MARKET, BY end-user
    1. overview
    2. Oil and Gas
      1. By loCation
        1. onshore
        2. Offshore
      2. By Medium
        1. Oil and Condensate
        2. Natural Gas
      3. By Technology
        1. Acoustic/Ultrasound
        2. Negative Pressure Waves
        3. Extended Real-Time Transient Model (E-RTTM)
        4. Thermal Imaging
        5. Laser Absorption and LIDAR
        6. Hydraulic Leak Detection
        7. Fiber Optic
        8. Pressure-Flow Deviation Method
        9. Mass/Volume Balance
        10. Vapor Sensing
        11. Others
    3. chemical plant
      1. By technology
        1. Acoustic/Ultrasound
        2. Thermal Imaging
        3. Pressure-Flow Deviation Method
        4. Extended Real-Time Transient Model (E-RTTM)
        5. Fiber Optic
        6. Mass/Volume Balance
        7. Vapor Sensing
        8. Laser Absorption and LIDAR
        9. Hydraulic Leak Detection
        10. Negative Pressure Waves
        11. Others
    4. water treatment Plant
      1. By technology
        1. Acoustic/Ultrasound
        2. Pressure-Flow Deviation Method
        3. Extended Real-Time Transient Model (E-RTTM)
        4. Vapor Sensing
        5. Negative Pressure Waves
        6. Mass/Volume Balance
        7. Thermal Imaging
        8. Laser Absorption and LIDAR
        9. Hydraulic Leak Detection
        10. Fiber Optic
        11. Others
    5. THERMAL POWER PLANT
      1. By technology
        1. Acoustic/Ultrasound
        2. Pressure-Flow Deviation Method
        3. Extended Real-Time Transient Model (E-RTTM)
        4. Vapor Sensing
        5. Negative Pressure Waves
        6. Mass/Volume Balance
      2. Thermal Imaging
        1. Laser Absorption and LIDAR
        2. Hydraulic Leak Detection
        3. Fiber Optic
        4. Others
    6. Mining and Slurry
      1. By technology
        1. Acoustic/Ultrasound
        2. Fiber Optic
        3. Pressure-Flow Deviation Method
        4. Extended Real-Time Transient Model (E-RTTM)
        5. Thermal Imaging
        6. Mass/Volume Balance
        7. Vapor Sensing
        8. Laser Absorption and LIDAR
        9. Hydraulic Leak Detection
        10. Negative Pressure Waves
        11. Others
    7. others
  11. EUROPE Leak detection market, by geography
    1. Europe
      1. Russia
      2. U.K.
      3. Italy
      4. Turkey
      5. Germany
      6. Netherlands
      7. Spain
      8. france
      9. belgium
      10. switzerland
      11. Rest of Europe
  12. Europe leak detection Market: COMPANY landscape
    1. Company share analysis: Europe
  13. swot
  14. company profiles
    1. flir systems, inc.
      1. COMPANY snapshot
      2. Revenue Analysis
      3. company share analysis
      4. product PORTFOLIO
      5. recent DEVELOPMENTS
    2. honeywell international inc.
      1. COMPANY snapshot
      2. revenue analysis
      3. company share analysis
      4. PRODUCT PORTFOLIO
      5. recent DEVELOPMENTS
    3. siemens energy
      1. COMPANY snapshot
      2. revenue analysis
      3. company share analysis
      4. PRODUCT PORTFOLIO
      5. recent DEVELOPMENT
    4. schneider electric
      1. COMPANY snapshot
      2. revenue analysis
      3. company share analysis
      4. PRODUCT PORTFOLIO
      5. recent DEVELOPMENTS
    5. inficon
      1. COMPANY snapshot
      2. Revenue analysis
      3. company share analysis
      4. PRODUCT PORTFOLIO
      5. recent DEVELOPMENTS
    6. ABB
      1. COMPANY snapshot
      2. Revenue Analysis
      3. company share analysis
      4. product PORTFOLIO
      5. recent DEVELOPMENTs
    7. asel-tech inc.
      1. COMPANY snapshot
      2. PRODUCT PORTFOLIO
      3. recent DEVELOPMENT
    8. atmos international
      1. COMPANY snapshot
      2. PRODUCT PORTFOLIO
      3. recent DEVELOPMENT
    9. aveva group plc
      1. COMPANY snapshot
      2. Revenue Analysis
      3. product PORTFOLIO
      4. recent DEVELOPMENT
    10. clampon as
      1. COMPANY snapshot
      2. PRODUCT PORTFOLIO
      3. recent DEVELOPMENT
    11. emerson electric co.
      1. COMPANY snapshot
      2. Revenue Analysis
      3. company share analysis
      4. product PORTFOLIO
      5. recent DEVELOPMENTS
    12. fotech group ltd.
      1. COMPANY snapshot
      2. PRODUCT PORTFOLIO
      3. recent DEVELOPMENT
    13. hawk measurement systems
      1. COMPANY snapshot
      2. PRODUCT PORTFOLIO
      3. recent DEVELOPMENTS
    14. hima
      1. COMPANY snapshot
      2. PRODUCT PORTFOLIO
      3. recent DEVELOPMENTS
    15. krohne messtechnik gmbh
      1. COMPANY snapshot
      2. PRODUCT PORTFOLIO
      3. recent DEVELOPMENTS
    16. magnum pirex ag / magnum leo-pipe gmbh
      1. COMPANY snapshot
      2. PRODUCT PORTFOLIO
      3. recent DEVELOPMENT
    17. msa
      1. COMPANY snapshot
      2. revenue analysis
      3. PRODUCT PORTFOLIO
      4. recent DEVELOPMENTS
    18. optasense ltd
      1. COMPANY snapshot
      2. PRODUCT PORTFOLIO
      3. recent DEVELOPMENTS
    19. pentair
      1. COMPANY snapshot
      2. revenue analysis
      3. PRODUCT PORTFOLIO
      4. recent DEVELOPMENT
    20. perma-pipe international holdings, inc.
      1. COMPANY snapshot
      2. revenue analysis
      3. PRODUCT PORTFOLIO
      4. recent DEVELOPMENTS
    21. psi software ag
      1. COMPANY snapshot
      2. revenue analysis
      3. PRODUCT PORTFOLIO
      4. recent DEVELOPMENT
    22. ttk - Leak Detection System
      1. COMPANY snapshot
      2. PRODUCT PORTFOLIO
      3. recent DEVELOPMENTS
    23. xylem
      1. COMPANY snapshot
      2. Revenue Analysis
      3. brand PORTFOLIO
      4. recent DEVELOPMENTS
    24. yokogawa electric corporation
      1. COMPANY snapshot
      2. Revenue Analysis
      3. Product PORTFOLIO
      4. recent developments
  15. questionnaire
  16. related reports

表のリスト

TABLE 1 SUMMARY OF PIPELINE INCIDENTS FROM JANUARY 2010 TO DECEMBER 2019

TABLE 2 THE 10 LARGEST OIL PRODUCERS AND SHARE OF TOTAL WORLD OIL PRODUCTION IN 2019

TABLE 3 THE 10 LARGEST OIL CONSUMERS AND SHARE OF TOTAL WORLD OIL CONSUMPTION IN 2018

TABLE 4 Europe Leak Detection Market, By Type, 2019-2028 (USD Million)

TABLE 5 Europe Midstream in Leak Detection Market, By Region,2019-2028, (USD Million)

TABLE 6 Europe Downstream in Leak Detection Market, By Region,2019-2028, (USD Million)

TABLE 7 Europe Upstream in Leak Detection Market, By Region,2019-2028, (USD Million)

TABLE 8 Europe LEAK Detection Market, By Product Type, 2019-2028 (USD Million)

TABLE 9 Europe Vehicle Based-Detectors in Leak Detection Market, By Region,2019-2028, (USD Million)

TABLE 10 Europe UAV-Based Detectors in Leak Detection Market, By Region,2019-2028, (USD Million)

TABLE 11 Europe Handheld Gas Detectors in Leak Detection Market, By Region,2019-2028, (USD Million)

TABLE 12 Europe Manned Aircraft Detectors in Leak Detection Market, By Region,2019-2028, (USD Million)

TABLE 13 Europe Others in Leak Detection Market, By Region,2019-2028, (USD Million)

TABLE 14 Europe LEAK Detection Market, By Technology, 2019-2028 (USD Million)

TABLE 15 Europe Acoustic/Ultrasound in Leak Detection Market, By Region,2019-2028, (USD Million)

TABLE 16 Europe Extended Real-Time Transient Model (E-RTTM) in Leak Detection Market, By Region,2019-2028, (USD Million)

TABLE 17 Europe Negative Pressure Waves in Leak Detection Market, By Region,2019-2028, (USD Million)

TABLE 18 Europe Thermal Imaging in Leak Detection Market, By Region,2019-2028, (USD Million)

TABLE 19 Europe Fibre Optic in Leak Detection Market, By Region,2019-2028, (USD Million)

TABLE 20 Europe Laser Absorption and LIDAR in Leak Detection Market, By Region,2019-2028, (USD Million)

TABLE 21 Europe Pressure-Flow Deviation Method in Leak Detection Market, By Region,2019-2028, (USD Million)

TABLE 22 Europe Mass/Volume Balance in Leak Detection Market, By Region,2019-2028, (USD Million)

TABLE 23 Europe Vapor Sensing in Leak Detection Market, By Region,2019-2028, (USD Million)

TABLE 24 Europe Hydraulic Leak Detection in Leak Detection Market, By Region,2019-2028, (USD Million)

TABLE 25 Europe Others in Leak Detection Market, By Region,2019-2028, (USD Million)

TABLE 26 Europe Leak Detection Market, By End User, 2019-2028 (USD Million)

TABLE 27 Europe Oil and Gas in Leak Detection Market, By Region,2019-2028, (USD Million)

TABLE 28 Europe Oil and Gas in Leak Detection Market, By Location, 2019-2028 (USD Million)

TABLE 29 Europe Oil and Gas Leak Detection Market, By Medium, 2019-2028 (USD Million)

TABLE 30 Europe Oil and Gas Leak Detection Market, By Technology, 2019-2028 (USD Million)

TABLE 31 Europe Chemical Plant in Leak Detection Market, By Region,2019-2028, (USD Million)

TABLE 32 Europe Chemical Plant Leak Detection Market, By Technology, 2019-2028 (USD Million)

TABLE 33 Europe Water Treatment Plant in Leak Detection Market, By Region,2019-2028, (USD Million)

TABLE 34 Europe Water Treatment Plant Leak Detection Market, By Technology, 2019-2028 (USD Million)

TABLE 35 Europe Thermal Power Plant in Leak Detection Market, By Region,2019-2028, (USD Million)

TABLE 36 Europe Thermal Power Plant Leak Detection Market, By Technology, 2019-2028 (USD Million)

TABLE 37 Europe Mining and Slurry in Leak Detection Market, By Region,2019-2028, (USD Million)

TABLE 38 Europe Mining and Slurry in Leak Detection Market, By technology, Market Forecast 2021-2028 (USD Million)

TABLE 39 Europe Mining and Slurry in Leak detection market, By region, Market Forecast 2021-2028 (USD Million)

TABLE 40 Europe leak detection MARKET, BY COUNTRY, 2019-2028 (USD Million)

TABLE 41 Europe Leak Detection Market, By Type, 2019-2028 (USD Million)

TABLE 42 Europe Leak Detection Market, By Product Type, 2019-2028 (USD Million)

TABLE 43 Europe Leak Detection Market, By Technology, 2019-2028 (USD Million)

TABLE 44 Europe leak detection Market, By end user, 2019-2028 (USD Million)

TABLE 45 Europe Oil and Gas in Leak Detection Market, By Location, 2019-2028 (USD Million)

TABLE 46 Europe Oil and Gas Leak Detection Market, By Medium, 2019-2028 (USD Million)

TABLE 47 Europe Oil and Gas Leak Detection Market, By Technology, 2019-2028 (USD Million)

TABLE 48 Europe Chemical Plant Leak Detection Market, By Technology, 2019-2028 (USD Million)

TABLE 49 Europe Water Treatment Plant Leak Detection Market, By Technology, 2019-2028 (USD Million)

TABLE 50 Europe Thermal Power Plant Leak Detection Market, By Technology, 2019-2028 (USD Million)

TABLE 51 Europe Mining and Slurry Leak Detection Market, By Technology, 2019-2028 (USD Million)

TABLE 52 Russia Leak Detection Market, By Type, 2019-2028 (USD Million)

TABLE 53 Russia Leak Detection Market, By Product Type, 2019-2028 (USD Million)

TABLE 54 Russia Leak Detection Market, By Technology, 2019-2028 (USD Million)

TABLE 55 Russia leak detection Market, By end user, 2019-2028 (USD Million)

TABLE 56 Russia Oil and Gas in Leak Detection Market, By Location, 2019-2028 (USD Million)

TABLE 57 Russia Oil and Gas Leak Detection Market, By Medium, 2019-2028 (USD Million)

TABLE 58 Russia Oil and Gas Leak Detection Market, By Technology, 2019-2028 (USD Million)

TABLE 59 Russia Chemical Plant Leak Detection Market, By Technology, 2019-2028 (USD Million)

TABLE 60 Russia Water Treatment Plant Leak Detection Market, By Technology, 2019-2028 (USD Million)

TABLE 61 Russia Thermal Power Plant Leak Detection Market, By Technology, 2019-2028 (USD Million)

TABLE 62 Russia Mining and Slurry Leak Detection Market, By Technology, 2019-2028 (USD Million)

TABLE 63 U.K. Leak Detection Market, By Type, 2019-2028 (USD Million)

TABLE 64 U.K. Leak Detection Market, By Product Type, 2019-2028 (USD Million)

TABLE 65 U.K. Leak Detection Market, By Technology, 2019-2028 (USD Million)

TABLE 66 U.K. leak detection Market, By end user, 2019-2028 (USD Million)

TABLE 67 U.K. Oil and Gas in Leak Detection Market, By Location, 2019-2028 (USD Million)

TABLE 68 U.K. Oil and Gas Leak Detection Market, By Medium, 2019-2028 (USD Million)

TABLE 69 U.K. Oil and Gas Leak Detection Market, By Technology, 2019-2028 (USD Million)

TABLE 70 U.K. Chemical Plant Leak Detection Market, By Technology, 2019-2028 (USD Million)

TABLE 71 U.K. Water Treatment Plant Leak Detection Market, By Technology, 2019-2028 (USD Million)

TABLE 72 U.K. Thermal Power Plant Leak Detection Market, By Technology, 2019-2028 (USD Million)

TABLE 73 U.K. Mining and Slurry Leak Detection Market, By Technology, 2019-2028 (USD Million)

TABLE 74 Italy Leak Detection Market, By Type, 2019-2028 (USD Million)

TABLE 75 Italy Leak Detection Market, By Product Type, 2019-2028 (USD Million)

TABLE 76 Italy Leak Detection Market, By Technology, 2019-2028 (USD Million)

TABLE 77 Italy leak detection Market, By end user, 2019-2028 (USD Million)

TABLE 78 Italy Oil and Gas in Leak Detection Market, By Location, 2019-2028 (USD Million)

TABLE 79 Italy Oil and Gas Leak Detection Market, By Medium, 2019-2028 (USD Million)

TABLE 80 Italy Oil and Gas Leak Detection Market, By Technology, 2019-2028 (USD Million)

TABLE 81 Italy Chemical Plant Leak Detection Market, By Technology, 2019-2028 (USD Million)

TABLE 82 Italy Water Treatment Plant Leak Detection Market, By Technology, 2019-2028 (USD Million)

TABLE 83 Italy Thermal Power Plant Leak Detection Market, By Technology, 2019-2028 (USD Million)

TABLE 84 Italy Mining and Slurry Leak Detection Market, By Technology, 2019-2028 (USD Million)

TABLE 85 Turkey Leak Detection Market, By Type, 2019-2028 (USD Million)

TABLE 86 Turkey Leak Detection Market, By Product Type, 2019-2028 (USD Million)

TABLE 87 Turkey Leak Detection Market, By Technology, 2019-2028 (USD Million)

TABLE 88 Turkey leak detection Market, By end user, 2019-2028 (USD Million)

TABLE 89 Turkey Oil and Gas in Leak Detection Market, By Location, 2019-2028 (USD Million)

TABLE 90 Turkey Oil and Gas Leak Detection Market, By Medium, 2019-2028 (USD Million)

TABLE 91 Turkey Oil and Gas Leak Detection Market, By Technology, 2019-2028 (USD Million)

TABLE 92 Turkey Chemical Plant Leak Detection Market, By Technology, 2019-2028 (USD Million)

TABLE 93 Turkey Water Treatment Plant Leak Detection Market, By Technology, 2019-2028 (USD Million)

TABLE 94 Turkey Thermal Power Plant Leak Detection Market, By Technology, 2019-2028 (USD Million)

TABLE 95 Turkey Mining and Slurry Leak Detection Market, By Technology, 2019-2028 (USD Million)

TABLE 96 Germany Leak Detection Market, By Type, 2019-2028 (USD Million)

TABLE 97 Germany Leak Detection Market, By Product Type, 2019-2028 (USD Million)

TABLE 98 Germany Leak Detection Market, By Technology, 2019-2028 (USD Million)

TABLE 99 Germany leak detection Market, By end user, 2019-2028 (USD Million)

TABLE 100 Germany Oil and Gas in Leak Detection Market, By Location, 2019-2028 (USD Million)

TABLE 101 Germany Oil and Gas Leak Detection Market, By Medium, 2019-2028 (USD Million)

TABLE 102 Germany Oil and Gas Leak Detection Market, By Technology, 2019-2028 (USD Million)

TABLE 103 Germany Chemical Plant Leak Detection Market, By Technology, 2019-2028 (USD Million)

TABLE 104 Germany Water Treatment Plant Leak Detection Market, By Technology, 2019-2028 (USD Million)

TABLE 105 Germany Thermal Power Plant Leak Detection Market, By Technology, 2019-2028 (USD Million)

TABLE 106 Germany Mining and Slurry Leak Detection Market, By Technology, 2019-2028 (USD Million)

TABLE 107 Netherlands Leak Detection Market, By Type, 2019-2028 (USD Million)

TABLE 108 Netherlands Leak Detection Market, By Product Type, 2019-2028 (USD Million)

TABLE 109 Netherlands Leak Detection Market, By Technology, 2019-2028 (USD Million)

TABLE 110 Netherlands leak detection Market, By end user, 2019-2028 (USD Million)

TABLE 111 Netherlands Oil and Gas in Leak Detection Market, By Location, 2019-2028 (USD Million)

TABLE 112 Netherlands Oil and Gas Leak Detection Market, By Medium, 2019-2028 (USD Million)

TABLE 113 Netherlands Oil and Gas Leak Detection Market, By Technology, 2019-2028 (USD Million)

TABLE 114 Netherlands Chemical Plant Leak Detection Market, By Technology, 2019-2028 (USD Million)

TABLE 115 Netherlands Water Treatment Plant Leak Detection Market, By Technology, 2019-2028 (USD Million)

TABLE 116 Netherlands Thermal Power Plant Leak Detection Market, By Technology, 2019-2028 (USD Million)

TABLE 117 Netherlands Mining and Slurry Leak Detection Market, By Technology, 2019-2028 (USD Million)

TABLE 118 Spain Leak Detection Market, By Type, 2019-2028 (USD Million)

TABLE 119 Spain Leak Detection Market, By Product Type, 2019-2028 (USD Million)

TABLE 120 Spain Leak Detection Market, By Technology, 2019-2028 (USD Million)

TABLE 121 spain leak detection Market, By end user, 2019-2028 (USD Million)

TABLE 122 spain Oil and Gas in Leak Detection Market, By Location, 2019-2028 (USD Million)

TABLE 123 spain Oil and Gas Leak Detection Market, By Medium, 2019-2028 (USD Million)

TABLE 124 spain Oil and Gas Leak Detection Market, By Technology, 2019-2028 (USD Million)

TABLE 125 spain Chemical Plant Leak Detection Market, By Technology, 2019-2028 (USD Million)

TABLE 126 spain Water Treatment Plant Leak Detection Market, By Technology, 2019-2028 (USD Million)

TABLE 127 spain Thermal Power Plant Leak Detection Market, By Technology, 2019-2028 (USD Million)

TABLE 128 spain Mining and Slurry Leak Detection Market, By Technology, 2019-2028 (USD Million)

TABLE 129 france Leak Detection Market, By Type, 2019-2028 (USD Million)

TABLE 130 france Leak Detection Market, By Product Type, 2019-2028 (USD Million)

TABLE 131 france Leak Detection Market, By Technology, 2019-2028 (USD Million)

TABLE 132 france leak detection Market, By end user, 2019-2028 (USD Million)

TABLE 133 france Oil and Gas in Leak Detection Market, By Location, 2019-2028 (USD Million)

TABLE 134 france Oil and Gas Leak Detection Market, By Medium, 2019-2028 (USD Million)

TABLE 135 france Oil and Gas Leak Detection Market, By Technology, 2019-2028 (USD Million)

TABLE 136 france Chemical Plant Leak Detection Market, By Technology, 2019-2028 (USD Million)

TABLE 137 france Water Treatment Plant Leak Detection Market, By Technology, 2019-2028 (USD Million)

TABLE 138 france Thermal Power Plant Leak Detection Market, By Technology, 2019-2028 (USD Million)

TABLE 139 france Mining and Slurry Leak Detection Market, By Technology, 2019-2028 (USD Million)

TABLE 140 belgium Leak Detection Market, By Type, 2019-2028 (USD Million)

TABLE 141 belgium Leak Detection Market, By Product Type, 2019-2028 (USD Million)

TABLE 142 belgium Leak Detection Market, By Technology, 2019-2028 (USD Million)

TABLE 143 belgium leak detection Market, By end user, 2019-2028 (USD Million)

TABLE 144 belgium Oil and Gas in Leak Detection Market, By Location, 2019-2028 (USD Million)

TABLE 145 belgium Oil and Gas Leak Detection Market, By Medium, 2019-2028 (USD Million)

TABLE 146 belgium Oil and Gas Leak Detection Market, By Technology, 2019-2028 (USD Million)

TABLE 147 belgium Chemical Plant Leak Detection Market, By Technology, 2019-2028 (USD Million)

TABLE 148 belgium Water Treatment Plant Leak Detection Market, By Technology, 2019-2028 (USD Million)

TABLE 149 belgium Thermal Power Plant Leak Detection Market, By Technology, 2019-2028 (USD Million)

TABLE 150 belgium Mining and Slurry Leak Detection Market, By Technology, 2019-2028 (USD Million)

TABLE 151 Switzerland Leak Detection Market, By Type, 2019-2028 (USD Million)

TABLE 152 Switzerland Leak Detection Market, By Product Type, 2019-2028 (USD Million)

TABLE 153 Switzerland Leak Detection Market, By Technology, 2019-2028 (USD Million)

TABLE 154 Switzerland leak detection Market, By end user, 2019-2028 (USD Million)

TABLE 155 Switzerland Oil and Gas in Leak Detection Market, By Location, 2019-2028 (USD Million)

TABLE 156 Switzerland Oil and Gas Leak Detection Market, By Medium, 2019-2028 (USD Million)

TABLE 157 Switzerland Oil and Gas Leak Detection Market, By Technology, 2019-2028 (USD Million)

TABLE 158 Switzerland Chemical Plant Leak Detection Market, By Technology, 2019-2028 (USD Million)

TABLE 159 Switzerland Water Treatment Plant Leak Detection Market, By Technology, 2019-2028 (USD Million)

TABLE 160 Switzerland Thermal Power Plant Leak Detection Market, By Technology, 2019-2028 (USD Million)

TABLE 161 Switzerland Mining and Slurry Leak Detection Market, By Technology, 2019-2028 (USD Million)

TABLE 162 Rest of Europe Leak detection MARKET, BY type, 2019-2028 (USD Million)

図表一覧

FIGURE 1 Europe Leak Detection market: segmentation

FIGURE 2 EUROPE LEAK DETECTION MARKET: data triangulation

FIGURE 3 Europe Leak Detection market: DROC ANALYSIS

FIGURE 4 Europe Leak Detection market: EUROPE VS regional MARKET ANALYSIS

FIGURE 5 EUROPE LEAK DETECTION MARKET: COMPANY RESEARCH ANALYSIS

FIGURE 6 EUROPE LEAK DETECTION MARKET: INTERVIEW DEMOGRAPHICS

FIGURE 7 Europe Leak Detection market: DBMR MARKET POSITION GRID

FIGURE 8 Europe leak detection market: vendor share analysis

FIGURE 9 Europe Leak Detection market: SEGMENTATION

FIGURE 10 increasing growth in oil and gas pipeline and storage plant infrastructure is expected to DRIVe Europe Leak Detection MARKET IN THE FORECAST PERIOD of 2021 to 2028

FIGURE 11 midstream segment is expected to account for the largest share of Europe Leak Detection market in 2021 & 2028

FIGURE 12 DRIVERS, RESTRAINT, OPPORTUNITIES AND CHALLENGES OF EUROPE LEAK DETECTION MARKET

FIGURE 13 Europe leak detection MARKET: BY type, 2020

FIGURE 14 Europe leak detection MARKET: BY product type, 2020

FIGURE 15 Europe leak detection MARKET: BY technology, 2020

FIGURE 16 Europe leak detection MARKET: BY end user, 2020

FIGURE 17 Europe leak detection market: SNAPSHOT (2020)

FIGURE 18 Europe leak detection market: BY COUNTRY (2020)

FIGURE 19 Europe leak detection market: BY COUNTRY (2021& 2028)

FIGURE 20 Europe leak detection market: BY COUNTRY (2020& 2028)

FIGURE 21 Europe leak detection market: BY type (2021-2028)

FIGURE 22 EUROPE LEAK DETECTION market: COMPANY SHARE 2020 (%)

詳細情報を見る Right Arrow

調査方法

データ収集と基準年分析は、大規模なサンプル サイズのデータ​​収集モジュールを使用して行われます。この段階では、さまざまなソースと戦略を通じて市場情報または関連データを取得します。過去に取得したすべてのデータを事前に調査および計画することも含まれます。また、さまざまな情報ソース間で見られる情報の不一致の調査も含まれます。市場データは、市場統計モデルと一貫性モデルを使用して分析および推定されます。また、市場シェア分析と主要トレンド分析は、市場レポートの主要な成功要因です。詳細については、アナリストへの電話をリクエストするか、お問い合わせをドロップダウンしてください。

DBMR 調査チームが使用する主要な調査方法は、データ マイニング、データ変数が市場に与える影響の分析、および一次 (業界の専門家) 検証を含むデータ三角測量です。データ モデルには、ベンダー ポジショニング グリッド、市場タイムライン分析、市場概要とガイド、企業ポジショニング グリッド、特許分析、価格分析、企業市場シェア分析、測定基準、グローバルと地域、ベンダー シェア分析が含まれます。調査方法について詳しくは、お問い合わせフォームから当社の業界専門家にご相談ください。

カスタマイズ可能

Data Bridge Market Research は、高度な形成的調査のリーダーです。当社は、既存および新規のお客様に、お客様の目標に合致し、それに適したデータと分析を提供することに誇りを持っています。レポートは、対象ブランドの価格動向分析、追加国の市場理解 (国のリストをお問い合わせください)、臨床試験結果データ、文献レビュー、リファービッシュ市場および製品ベース分析を含めるようにカスタマイズできます。対象競合他社の市場分析は、技術ベースの分析から市場ポートフォリオ戦略まで分析できます。必要な競合他社のデータを、必要な形式とデータ スタイルでいくつでも追加できます。当社のアナリスト チームは、粗い生の Excel ファイル ピボット テーブル (ファクト ブック) でデータを提供したり、レポートで利用可能なデータ セットからプレゼンテーションを作成するお手伝いをしたりすることもできます。

Frequently Asked Questions

The Europe Leak Detection Market is projected to grow at a CAGR of 7.4% during the forecast period by 2028.
The future market value of the Europe Leak Detection Market is expected to reach USD 757.27 million by 2028.
The major players in the Europe Leak Detection Market are Textron Inc., Embraer, Gulfstream Aerospace Corporation., Pilatus Aircraft., Boeing, Airbus S.A.S., Bombardier, Dassault Aviation, Honda Aircraft Company, Volocopter GmbH., Zunum Aero., etc.
The countries covered in the Europe Leak Detection Market are Germany, U.K., France, Switzerland, Italy, Spain, Netherlands, Russia, Belgium, Turkey and Rest of Europe.