ヨーロッパの生物農薬市場 – 業界動向と2028年までの予測

Request for TOC TOC のリクエスト Speak to Analyst アナリストに相談する Buy Now今すぐ購入 Inquire Before Buying 事前に問い合わせる Free Sample Report 無料サンプルレポート

ヨーロッパの生物農薬市場 – 業界動向と2028年までの予測

  • Agriculture And Animal Feed
  • Published Report
  • Jul 2021
  • Europe
  • 350 ページ
  • テーブル数: 323
  • 図の数: 25

ヨーロッパの生物農薬市場、タイプ別(生物殺虫剤、生物殺菌剤、生物殺線虫剤、生物除草剤、その他)、供給源(微生物、生化学、昆虫)、形態(乾燥、液体)、用途(葉面散布、種子処理、土壌処理、施肥、その他)、カテゴリー(農業、園芸)、作物(果物と野菜、穀類と穀物、油糧種子と豆類、芝生と観賞用、その他の作物)、国別(ドイツ、フランス、スペイン、トルコ、英国、オランダ、ロシア、スイス、ベルギー、ルクセンブルク、イタリア、その他のヨーロッパ諸国)業界動向と2028年までの予測。

ヨーロッパの生物農薬市場

市場分析と洞察:ヨーロッパの生物農薬市場

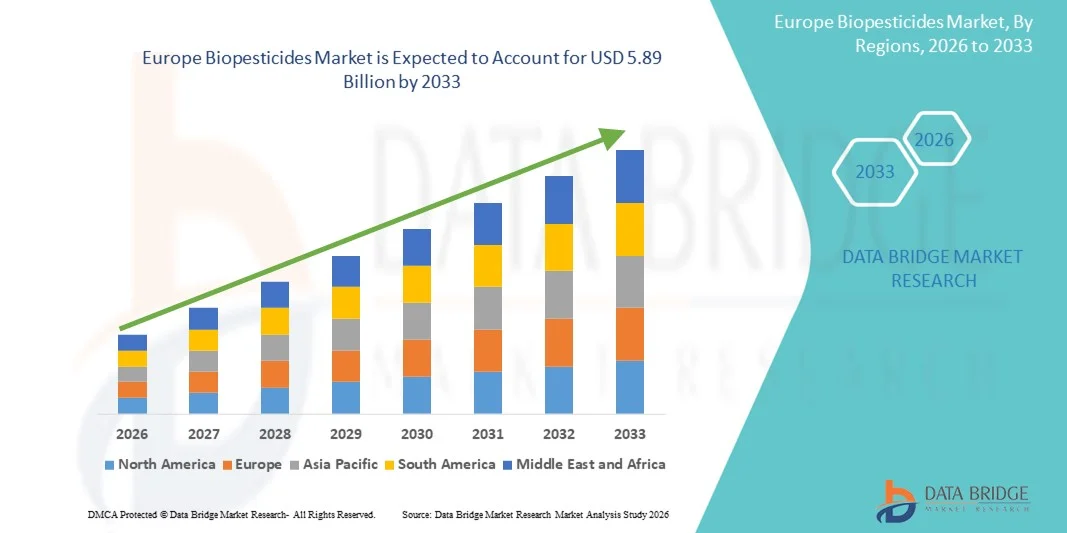
ヨーロッパのバイオ農薬 市場は、2021年から2028年の予測期間に市場が成長すると予想されています。データブリッジマーケットリサーチは、市場は2021年から2028年の予測期間に13.5%のCAGRで成長し、2028年までに31億3,564万米ドルに達すると分析しています。バイオ農薬の有機生産方法の革新と、残留物のない食品に対する意識の高まりが、この市場の成長を牽引しています。

生物農薬は、植物、動物、細菌、特定の鉱物などの天然物質から抽出されるタイプの農薬です。たとえば、キャノーラ油や重曹は殺虫剤として使用され、生物農薬と見なされています。

生物農薬には、生化学農薬、微生物農薬、植物組み込み保護剤 (PIP) の 3 つの主要なカテゴリがあります。これらの生物農薬は通常、化学農薬よりも毒性が低く、標的の害虫とそれに近縁の生物にのみ影響を及ぼします。従来の農薬と比較して、作用の点ではより効果的で正確です。生物農薬の使用には、環境や人間に対する毒性が低いなど、さまざまな利点があります。また、有害な残留物を残さず、標的の害虫にのみ影響を及ぼします。

環境へのダメージを減らし、分解しやすい農産物に対する需要の高まりは、農家の間でのバイオ農薬市場の成長を世界的に促進するでしょう。また、昆虫に対して高い特異性を持つ環境に優しいバイオ殺虫剤の入手可能性に関する認識の高まりも、市場の成長を後押しするでしょう。農家の間での天然で環境に優しいバイオ殺虫剤に対する需要の高まりは、メーカーが世界中の市場で新製品を発売することを促しています。

しかし、生物農薬に対する厳しい規制と高価格は、ヨーロッパの生物農薬市場の成長を抑制する要因となっています。

このヨーロッパのバイオ農薬市場レポートでは、市場シェア、新開発、製品パイプライン分析、国内および現地の市場プレーヤーの影響の詳細、新たな収益源、市場規制の変更、製品承認、戦略的決定、製品発売、地理的拡大、市場における技術革新の観点から見た機会の分析が提供されます。分析と市場シナリオを理解するには、アナリスト概要についてお問い合わせください。当社のチームが、希望する目標を達成するための収益影響ソリューションの作成をお手伝いします。

ヨーロッパの生物農薬市場

ヨーロッパの生物農薬市場の範囲と市場規模

ヨーロッパのバイオ農薬市場は、タイプ、ソース、形態、用途、カテゴリ、作物に基づいて 6 つの主要なセグメントに分割されています。セグメント間の成長は、ニッチな成長分野と市場へのアプローチ戦略を分析し、コア アプリケーション領域とターゲット市場の違いを決定するのに役立ちます。

  • タイプに基づいて、バイオ農薬市場は、バイオ殺虫剤、バイオ殺菌剤、バイオ殺線虫剤、バイオ除草剤、その他に分類されます。2021年には、幅広い病原性作用を持つ天然で環境に優しい農薬の需要が高まっているため、バイオ殺虫剤セグメントが市場を支配すると予想されます。
  • バイオ農薬市場は、その供給源に基づいて、微生物、生化学、昆虫に分類されます。微生物セグメントはさらに、細菌、真菌、ウイルスに分けられます。2021年には、農家の間で人間の健康と環境に対する懸念が高まり、汚染を減らすために生物ベースの農薬の需要が高まっているため、微生物セグメントが市場を支配すると予想されます。
  • 形態に基づいて、バイオ農薬市場は乾燥型と液体型に分けられます。バイオ農薬は、畑、苗床、保護栽培システムなどのさまざまな栽培環境で、さまざまな植物病原体から作物を保護するために使用できるため、2021年には液体セグメントが市場を支配すると予想されます。
  • 用途に基づいて、生物農薬市場は、葉面散布、施肥、土壌処理、種子処理、その他に分類されます。 2021年には、土壌との相互作用が少ないため、葉面散布セグメントが市場を支配すると予想されます。 さらに、葉面散布は栄養素の潜在的な拘束を回避するため、好ましい散布方法です。
  • カテゴリーに基づいて、生物農薬市場は農業と園芸に分類されます。2021年には、農家が農作業での合成化学物質の使用を避けて有機農業に重点を移しているため、農業セグメントが市場を支配すると予想されます。
  • 作物に基づいて、生物農薬市場は、果物と野菜、穀類と穀物、油糧種子と豆類、芝生と観賞用植物、その他の作物に分類されます。2021年には、健康志向の消費者の間でこれらの製品の需要が高まっているため、果物と野菜のセグメントが市場を支配すると予想されます。さらに、ビーガン消費者の増加により、市場はさらに成長すると予想されます。

ヨーロッパの生物農薬市場

ヨーロッパの生物農薬市場の国別分析

ヨーロッパの生物農薬市場が分析され、市場規模の情報が、上記のように国、タイプ、ソース、形式、用途、カテゴリ、作物別に提供されます。

ヨーロッパの生物農薬市場レポートで取り上げられている国は、ドイツ、フランス、イギリス、イタリア、スペイン、ロシア、トルコ、ベルギー、オランダ、スイス、ルクセンブルク、およびその他のヨーロッパ諸国です。

  • 欧州では、害虫耐性の増大と作物の復活により、ドイツが生物農薬市場を独占すると予想されており、これにより同地域で生物農薬などの持続可能なソリューションの採用が進むとみられています。
  • ドイツでは、環境被害の減少により、ソースセグメントが主流となっています。一方、フランスでは、生産者のリスク低減に関連する的を絞った行動の必要性により、ソースセグメントが主流となっています。英国では、生物農薬の効果的な分解に対する意識が高まっているため、ソースセグメントが主流となっています。

レポートの国別セクションでは、市場の現在および将来の傾向に影響を与える国内市場における個別の市場影響要因と規制の変更も提供しています。新規販売、交換販売、国の人口統計、規制行為、輸出入関税などのデータ ポイントは、各国の市場シナリオを予測するために使用される主要な指標の一部です。また、国別データの予測分析を提供する際には、北米ブランドの存在と可用性、地元および国内ブランドとの競争が激しいか少ないために直面​​する課題、販売チャネルの影響も考慮されます。

農業業界における生物農薬の需要増加

ヨーロッパのバイオ農薬市場では、販売、コンポーネント販売、バイオ農薬の技術開発の影響、バイオ農薬市場へのサポートに関する規制シナリオの変化など、各国の産業成長に関する詳細な市場分析も提供しています。データは、2010 年から 2019 年までの履歴期間について入手できます。

競争環境と欧州の生物農薬市場シェア分析

ヨーロッパのバイオ農薬市場の競争状況は、競合他社ごとに詳細を提供します。詳細には、会社概要、会社の財務状況、収益、市場の可能性、研究開発への投資、新しい市場への取り組み、インドでのプレゼンス、生産拠点と施設、会社の強みと弱み、製品の発売、製品試験パイプライン、製品の承認、特許、製品の幅と広さ、アプリケーションの優位性、技術ライフライン曲線が含まれます。上記のデータ ポイントは、ヨーロッパのバイオ農薬市場に関連する企業の焦点にのみ関連しています。

バイオ農薬市場で活動している主要企業としては、Syngenta Crop Protection AG、Bionema、Vegalab SA、STK bio-ag technologies、Andermatt Biocontrol AG、Koppert Biological Systems、Corteva、Bayer AG、Biobest Group NV、Certis USA LLC、Valent BioSciences LLC、Novozymes、BASF SE、IPL Biologicals Limited、Terramera Inc.、Khandelwal Bio Fertilizer、Isagro、Gowan Company、Parry America, Inc.、Barrix Agro Sciences Pvt Ltd、BioWorks Inc.、Marrone Bio Innovations、FMC Corporation、UPL、Nufarm、Bioline AgriSciences ltd、Biofa GmbH、BioConsortia, Inc.、McLaughlin Gormley King Company、W. Neudorff GmbH KG などがあります。

ヨーロッパの生物農薬市場の成長を加速させている企業によっても多くの拡張が開始されています。

例えば、

  • 2021年3月、Meister Media Worldwideによると、Boatnical Solution Inc.とSyngentaは、ボトリティス・シネレアの防除に役立つBotriStopという生物殺菌剤製品をメキシコで発売した。
  • 2019年3月、重慶スタンレー情報技術有限公司によると、シンジェンタはポルトガルでバチルス・チューリンゲンシスをベースとした生物殺虫剤「Costar」を発売した。

パートナーシップ、新製品開発、その他の戦略により、対象範囲と存在感が高まり、企業の市場シェアが高まります。また、組織にとって、バイオ農薬の提供を改善するメリットも得られます。


SKU-

世界初のマーケットインテリジェンスクラウドに関するレポートにオンラインでアクセスする

  • インタラクティブなデータ分析ダッシュボード
  • 成長の可能性が高い機会のための企業分析ダッシュボード
  • カスタマイズとクエリのためのリサーチアナリストアクセス
  • インタラクティブなダッシュボードによる競合分析
  • 最新ニュース、更新情報、トレンド分析
  • 包括的な競合追跡のためのベンチマーク分析のパワーを活用
デモのリクエスト

目次

  1. introduction
    1. OBJECTIVES OF THE STUDY
    2. MARKET DEFINITION
    3. OVERVIEW of Europe biopesticides market
    4. LIMITATIONs
    5. MARKETS COVERED
  2. MARKET SEGMENTATION
    1. MARKETS COVERED
    2. geographical scope
    3. years considered for the study
    4. currency and pricing
    5. DBMR TRIPOD DATA VALIDATION MODEL
    6. MULTIVARIATE MODELLING
    7. Type LIFELINE CURVE
    8. primary interviews with key opinion leaders
    9. DBMR MARKET POSITION GRID
    10. vendor share analysis
    11. secondary sourcEs
    12. assumptions
  3. EXECUTIVE SUMMARY
  4. premium insights
  5. market overvieW
    1. DRIVERS
      1. INCREASE IN NUMBER OF APPROVALS FOR BIOPESTICIDES BY GOVERNMENTAL BODIES
      2. RISE IN FUNDING FOR BIOPESTICIDE PRODUCTS
      3. INCREASE IN LAUNCHES OF BIOLOGICAL PRODUCTS FOR AGRICULTURE
      4. INCREASE IN DEMAND FOR SUSTAINABLE AGRICULTURE
      5. GROWING ADOPTION OF ORGANIC FARMING BOOSTS THE DEMAND FOR BIOPESTICIDES
    2. RESTRAINTS:
      1. STRINGENT REGULATIONS ON BIOPESTICIDES:
      2. LACK OF AWARENESS AMONG THE CONSUMERS
    3. OPPORTUNITIES
      1. RISE IN ENVIRONMENTAL POLLUTION CAUSED BY CHEMICAL PESTICIDES
      2. INCREASE IN INITIATIVES TAKEN BY GOVERNMENTAL BODIES TO FOSTER THE ADOPTION OF BIOPESTICIDES
    4. CHALLENGES:
      1. HIGH PRICES OF BIOPESTICIDES
      2. INCREASED USAGE OF CHEMICAL OR SYNTHETIC PESTICIDES
  6. IMPACT OF COVID-19 ON THE EUROPE BIO-PESTICIDES MARKET
    1. AFTERMATH OF COVID-19
    2. LIMITED SUPPLY AND AVAILABILITY OF BIO-PESTICIDES
    3. THE RISE IN ORGANIC FARMING AND USE OF BIOPESTICIDES
    4. CONCLUSION
  7. Europe Biopesticides market, by type
    1. overview
    2. bioinsecticides
      1. bacillus Thuringiensis
      2. beauveria Bassiana
      3. verticillium Lecanii
      4. metarhizium Anisoplia
      5. baculovirus
      6. others
    3. biofungicides
      1. trichoderma viride
      2. bacillus
      3. pseudomonas
      4. streptomyces
      5. trichoderma Harzianum
      6. others
    4. bionematicides
      1. bacillus firmus
      2. Purpureocillium lilacinus
      3. others
    5. bioherbicides
    6. others
  8. Europe Biopesticides market, by Source
    1. overview
    2. microbial
      1. Bacteria
      2. fungi
      3. virus
    3. biochemical
      1. plant extracts
      2. pheromones
      3. others
    4. insects
      1. phytoseiulus macropilis
      2. neoseiulus californicus
      3. others
  9. Europe Biopesticides market, by form
    1. overview
    2. liquid
      1. Suspension Concentrate
      2. Emulsifiable concentrate
      3. Soluble liquid Concentrate
    3. dry
      1. WETTABLE POWDER
      2. DRY GRANULES
      3. WATER DISP
  10. Europe Biopesticides market, by application
    1. overview
    2. Foliar application
    3. Soil treatment
    4. Seed treatment
    5. fertigation
    6. OtherS
  11. Europe Biopesticides market, by cropS
    1. overview
    2. Fruits & vegetables
      1. Potatoes
      2. tomatoes
      3. Apples
      4. oranges
      5. CABBAGES
      6. Strawberries
      7. Grape fruit
      8. broccoli
      9. Others
    3. cereals & Grains
      1. Maize
      2. wheat
      3. rice
      4. barley
      5. sorghum
      6. oats
      7. others
    4. oilseed & pulses
      1. soybean
      2. sunflower
      3. lentils
      4. peas
      5. graM
      6. sesame seed
      7. others
    5. Turf & ornamental
    6. Other
  12. Europe Biopesticides market, by category
    1. overview
    2. agriculture
    3. horticulture
  13. EUROPE BIOPESTICIDES MARKET, BY REGION
    1. overview
    2. EUROPE
      1. Germany
      2. France
      3. u.k.
      4. Italy
      5. Spain
      6. Russia
      7. Turkey
      8. Belgium
      9. Netherlands
      10. Switzerland
      11. Luxemburg
      12. Rest of Europe
  14. Europe Biopesticides Market company landscape
    1. company share analysis: Europe
  15. swot analysis
  16. company profile
    1. BAYER AG
      1. COMPANY SNAPSHOT
      2. Revenue Analysis
      3. company share analysis
      4. PRODUCT PORTFOLIO
      5. RECENT DEVELOPMENTs
      6. Swot analysis
    2. CORTEVA
      1. COMPANY SNAPSHOT
      2. REVENUE ANALYSIS
      3. company share analysis
      4. PRODUCT POrTFOLIO
      5. RECENT DEVELOPMENTS
      6. Swot analysis
    3. FMC Corporation
      1. COMPANY SNAPSHOT
      2. revenue analysis
      3. company share analysis
      4. PRODUCT PORTFOLIO
      5. RECENT DEVELOPMENTS
      6. Swot analysis
    4. Bioline AgroSciences Ltd
      1. COMPANY SNAPSHOT
      2. company share analysis
      3. PRODUCT PORTFOLIO
      4. RECENT DEVELOPMENTS
      5. Swot analysis
    5. Nufarm
      1. COMPANY SNAPSHOT
      2. revenue analysis
      3. company share analysis
      4. PRODUCT PORTFOLIO
      5. RECENT DEVELOPMENTS
      6. recent development
      7. Swot analysis
    6. ANDERMATT BIOCONTROL AG
      1. COMPANY SNAPSHOT
      2. PRODUCT PORTFOLIO
      3. RECENT DEVELOPMENTs
      4. SWOT analysis
    7. BASF SE
      1. COMPANY SNAPSHOT
      2. Revenue Analysis
      3. PRODUCT PORTFOLIO
      4. RECENT DEVELOPMENT
      5. Swot Analysis
    8. biobest GROUP NV
      1. COMPANY SNAPSHOT
      2. PRODUCT POrTFOLIO
      3. RECENT DEVELOPMENTS
      4. Swot analysis
    9. BIOFA GMBH
      1. COMPANY SNAPSHOT
      2. PRODUCT PORTFOLIO
      3. RECENT DEVELOPMENT
      4. Swot analysis
    10. BIONEMA
      1. COMPANY snapshot
      2. PRODUCT PORTFOLIO
      3. RECENT Developments
      4. SWOT analysis
    11. gowan company
      1. COMPANY snapshot
      2. PRODUCT PORTFOLIO
      3. RECENT development
      4. SWOT ANALYSIS
    12. ipl biologicals limited
      1. COMPANY SNAPSHOT
      2. PRODUCT PORTFOLIO
      3. RECENT DEVELOPMENT
      4. Swot Analysis
    13. isagro
      1. COMPANY snapshot
      2. Revenue analysis
      3. PRODUCT PORTFOLIO
      4. RECENT Development
      5. SWOT ANALYSIS
    14. KOPPERT BIOLOGICAL SYSTEMS
      1. COMPANY SNAPSHOT
      2. PRODUCT POrTFOLIO
      3. RECENT DEVELOPMENTS
      4. SWOT analysis
    15. Novozymes
      1. COMPANY SNAPSHOT
      2. REVENUE ANALYSIS
      3. PRODUCT POrTFOLIO
      4. RECENT DEVELOPMENTS
      5. Swot analysis
    16. STK BIO- AG TECHNOLOGIES
      1. COMPANY snapshot
      2. PRODUCT PORTFOLIO
      3. RECENT development
      4. SWOT analysis
    17. Syngenta Crop Protection AG
      1. COMPANY SNAPSHOT
      2. REVENUE ANALYSIS
      3. PRODUCT PORTFOLIO
      4. RECENT DEVELOPMENTs
      5. SWOT analysis
    18. UPL
      1. COMPANY SNAPSHOT
      2. revenue analysis
      3. PRODUCT PORTFOLIO
      4. RECENT DEVELOPMENTS
      5. Swot analysis
    19. valent biosciences llc
      1. COMPANY SNAPSHOT
      2. PRODUCT POrTFOLIO
      3. RECENT DEVELOPMENT
      4. Swot analysis
    20. VEGALAB SA
      1. COMPANY snapshot
      2. PRODUCT PORTFOLIO
      3. RECENT development
      4. SWOT analysis
    21. W. Neudorff GmbH KG
      1. COMPANY SNAPSHOT
      2. PRODUCT PORTFOLIO
      3. RECENT DEVELOPMENT
      4. swot analysis
  17. questionnaire
  18. related reports

表のリスト

TABLE 1 PRICES OF BIOPESTICIDES

TABLE 2 Europe biopesticides Market, type, 2019-2028 (USD million)

TABLE 3 Europe biopesticides Market, type, 2019-2028 (TONS)

TABLE 4 Europe Bioinsecticides in biopesticides Market, BY type, 2019-2028 (USD million)

TABLE 5 Europe Bioinsecticides in biopesticides Market, BY type, 2019-2028 (Tons)

TABLE 6 Europe biofungicideS in biopesticides Market, BY type, 2019-2028 (USD million)

TABLE 7 Europe BIOFUNGICIDES in biopesticides Market, BY type, 2019-2028 (tons)

TABLE 8 Europe bionematicides in biopesticides Market, BY type, 2019-2028 (USD million)

TABLE 9 Europe bionematicides in biopesticides Market, BY type, 2019-2028 (tonS)

TABLE 10 Europe biopesticides Market, BY source, 2019-2028 (USD million)

TABLE 11 Europe biopesticides Market, BY source, 2019-2028 (tons)

TABLE 12 Europe microbial in biopesticides MARKET, BY SOURCE, 2019-2028 (usd million)

TABLE 13 Europe microbial in biopesticides Market, BY source, 2019-2028 (tons)

TABLE 14 Europe biochemical in biopesticides market, BY source, 2019-2028 (usd million)

TABLE 15 Europe biochemical in biopesticides market, BY source, 2019-2028 (tons)

TABLE 16 Europe insect in biopesticides market, BY source, 2019-2028 (usd million)

TABLE 17 Europe insect in biopesticides market, BY source, 2019-2028 (tons)

TABLE 18 Europe Biopesticides Market, By form, 2019-2028 (USD Million)

TABLE 19 Europe Biopesticides Market, By FORM, 2019-2028 (tons)

TABLE 20 Europe LIQUID IN Biopesticides Market, By form, 2019-2028 (USD Million)

TABLE 21 Europe LIQUID IN Biopesticides Market, By form, 2019-2028 (TONS)

TABLE 22 Europe DRY IN Biopesticides Market, By form, 2019-2028 (USD MILLION)

TABLE 23 Europe DRY IN Biopesticides Market, By form, 2019-2028 (TONS)

TABLE 24 Europe biopesticides MARKET, By application, 2019-2028 (USD Million)

TABLE 25 Europe biopesticides MARKET, By application, 2019-2028 (TONS)

TABLE 26 Instances of Biopesticides used through foliar applications

TABLE 27 Several biopesticides are used to control plant pathogens by using soil treatment are as follow-

TABLE 28 Europe biopesticides market, By crop, 2019-2028 (USD Million)

TABLE 29 Europe biopesticides market, By crop, 2019-2028 (TONS)

TABLE 30 Europe Fruits & vegetables in biopesticides market, By crop, 2019-2028 (USD Million)

TABLE 31 Europe Fruits & vegetables in biopesticides market, By crop, 2019-2028 (TONS)

TABLE 32 Europe CEREAL & GRAINS in biopesticides market, By CROP, 2019-2028 (USD Million)

TABLE 33 Europe CEREAL & GRAINS in biopesticides market, By CROP, 2019-2028 (tons)

TABLE 34 Europe Oilseed & Pulses in biopesticides market, By CROP, 2019-2028 (USD Million)

TABLE 35 Europe Oilseed & Pulses in biopesticides market, By CROP 2019-2028 (TONS)

TABLE 36 Europe biopesticides Market, Category, 2019-2028 (USD million)

TABLE 37 Europe biopesticides Market, Category, 2019-2028 (TONS)

TABLE 38 The following are some of the key players offering biopesticides for horticulture to the consumers

TABLE 39 Europe Biopesticides Market, By Country, 2019-2028 (USD Million)

TABLE 40 Europe Biopesticides Market, By Country, 2019-2028 (TONs)

TABLE 41 Europe Biopesticides Market, By TYPE, 2019-2028 (USD Million)

TABLE 42 Europe Biopesticides Market, By TYPE, 2019-2028 (TONs)

TABLE 43 Europe Bioinsecticides in Biopesticides Market, By TYPE, 2019-2028 (USD Million)

TABLE 44 Europe Bioinsecticides in Biopesticides Market, By TYPE, 2019-2028 (TON)

TABLE 45 Europe Biofungicides in Biopesticides Market, By TYPE, 2019-2028 (USD Million)

TABLE 46 Europe Biofungicides in Biopesticides Market, By TYPE, 2019-2028 (TON)

TABLE 47 Europe Bionematicides in Biopesticides Market, By TYPE, 2019-2028 (USD Million)

TABLE 48 Europe Bionematicides in Biopesticides Market, By TYPE, 2019-2028 (TONs)

TABLE 49 Europe Biopesticides Market, By Source, 2019-2028 (USD Million)

TABLE 50 Europe Biopesticides Market, By Source, 2019-2028 (TONs)

TABLE 51 Europe Microbial in Biopesticides Market, By Source, 2019-2028 (USD Million)

TABLE 52 Europe Microbial in Biopesticides Market, By Source, 2019-2028 (TONs)

TABLE 53 Europe Biochemical in Biopesticides Market, By Source, 2019-2028 (USD Million)

TABLE 54 Europe Biochemical in Biopesticides Market, By Source, 2019-2028 (TON)

TABLE 55 Europe Insect in Biopesticides Market, By Source, 2019-2028 (USD Million)

TABLE 56 Europe Insect in Biopesticides Market, By Source, 2019-2028 (TONs)

TABLE 57 Europe Biopesticides Market, By FORM, 2019-2028 (USD Million)

TABLE 58 Europe Biopesticides Market, By FORM, 2019-2028 (TONs)

TABLE 59 Europe Liquid in Biopesticides Market, By FORM, 2019-2028 (USD Million)

TABLE 60 Europe Liquid in Biopesticides Market, By FORM, 2019-2028 (USD Million)

TABLE 61 Europe Dry in Biopesticides Market, By FORM, 2019-2028 (USD Million)

TABLE 62 Europe Dry in Biopesticides Market, By FORM, 2019-2028 (TONs)

TABLE 63 Europe Biopesticides Market, By Application, 2019-2028 (USD Million)

TABLE 64 Europe Biopesticides Market, By Application, 2019-2028 (TON)

TABLE 65 Europe Biopesticides Market, By Category, 2019-2028 (USD Million)

TABLE 66 Europe Biopesticides Market, By Category, 2019-2028 (TONs)

TABLE 67 Europe Biopesticides Market, By Crops, 2019-2028 (USD Million)

TABLE 68 Europe Biopesticides Market, By Crops, 2019-2028 (TONs)

TABLE 69 Europe Fruits & Vegetables in Biopesticides Market, By Crops, 2019-2028 (USD Million)

TABLE 70 Europe Fruits & Vegetables in Biopesticides Market, By Crops, 2019-2028 (TONs)

TABLE 71 Europe Cereal & Grains in Biopesticides Market, By Crops, 2019-2028 (USD Million)

TABLE 72 Europe Cereal & Grains in Biopesticides Market, By Crops, 2019-2028 (TONs)

TABLE 73 Europe Oilseed & Pulses in Biopesticides Market, By Crops, 2019-2028 (USD Million)

TABLE 74 Europe Oilseed & Pulses in Biopesticides Market, By Crops, 2019-2028 (TONs)

TABLE 75 Germany Biopesticides Market, By TYPE, 2019-2028 (USD Million)

TABLE 76 Germany Biopesticides Market, By TYPE, 2019-2028 (ton)

TABLE 77 Germany Bioinsecticides in Biopesticides Market, By TYPE, 2019-2028 (USD Million)

TABLE 78 Germany Bioinsecticides in Biopesticides Market, By TYPE, 2019-2028 (tons)

TABLE 79 Germany Biofungicides in Biopesticides Market, By TYPE, 2019-2028 (USD Million)

TABLE 80 Germany Biofungicides in Biopesticides Market, By TYPE, 2019-2028 (tons)

TABLE 81 Germany Bionematicides in Biopesticides Market, By TYPE, 2019-2028 (USD Million)

TABLE 82 Germany Bionematicides in Biopesticides Market, By TYPE, 2019-2028 (ton)

TABLE 83 Germany Biopesticides Market, By Source, 2019-2028 (USD Million)

TABLE 84 Germany Microbial in Biopesticides Market, By Source, 2019-2028 (USD Million)

TABLE 85 Germany Biochemical in Biopesticides Market, By Source, 2019-2028 (USD Million)

TABLE 86 Germany Insect in Biopesticides Market, By Source, 2019-2028 (USD Million)

TABLE 87 Germany Biopesticides Market, By FORM, 2019-2028 (USD Million)

TABLE 88 Germany Liquid in Biopesticides Market, By FORM, 2019-2028 (USD Million)

TABLE 89 Germany Dry in Biopesticides Market, By FORM, 2019-2028 (USD Million)

TABLE 90 Germany Biopesticides Market, By Application, 2019-2028 (USD Million)

TABLE 91 Germany Biopesticides Market, By Category, 2019-2028 (USD Million)

TABLE 92 Germany Biopesticides Market, By Crops, 2019-2028 (USD Million)

TABLE 93 Germany Fruits & Vegetables in Biopesticides Market, By Crops, 2019-2028 (USD Million)

TABLE 94 Germany Cereal & Grains in Biopesticides Market, By Crops, 2019-2028 (USD Million)

TABLE 95 Germany Oilseed & Pulses in Biopesticides Market, By Crops, 2019-2028 (USD Million)

TABLE 96 France Biopesticides Market, By TYPE, 2019-2028 (USD Million)

TABLE 97 France Biopesticides Market, By TYPE, 2019-2028 (tons)

TABLE 98 France Bioinsecticides in Biopesticides Market, By TYPE, 2019-2028 (USD Million)

TABLE 99 France Bioinsecticides in Biopesticides Market, By TYPE, 2019-2028 (tons)

TABLE 100 France Biofungicides in Biopesticides Market, By TYPE, 2019-2028 (USD Million)

TABLE 101 France Biofungicides in Biopesticides Market, By TYPE, 2019-2028 (tons)

TABLE 102 france bionematicides in biopesticides market, By type, 2019-2028 (USD million)

TABLE 103 france bionematicides in biopesticides market, By type, 2019-2028 (tons)

TABLE 104 France Biopesticides Market, By Source, 2019-2028 (USD Million)

TABLE 105 France Microbial in Biopesticides Market, By Source, 2019-2028 (USD Million)

TABLE 106 France Biochemical in Biopesticides Market, By Source, 2019-2028 (USD Million)

TABLE 107 France Insect in Biopesticides Market, By Source, 2019-2028 (USD Million)

TABLE 108 France Biopesticides Market, By FORM, 2019-2028 (USD Million)

TABLE 109 France Liquid in Biopesticides Market, By FORM, 2019-2028 (USD Million)

TABLE 110 France Dry in Biopesticides Market, By FORM, 2019-2028 (USD Million)

TABLE 111 France Biopesticides Market, By Application, 2019-2028 (USD Million)

TABLE 112 France Biopesticides Market, By Category, 2019-2028 (USD Million)

TABLE 113 France Biopesticides Market, By Crops, 2019-2028 (USD Million)

TABLE 114 France Fruits & Vegetables in Biopesticides Market, By Crops, 2019-2028 (USD Million)

TABLE 115 France Cereal & Grains in Biopesticides Market, By Crops, 2019-2028 (USD Million)

TABLE 116 France Oilseed & Pulses in Biopesticides Market, By Crops, 2019-2028 (USD Million)

TABLE 117 U.K. Biopesticides Market, By TYPE, 2019-2028 (USD Million)

TABLE 118 U.K. Biopesticides Market, By TYPE, 2019-2028 (tons)

TABLE 119 U.K. Bioinsecticides in Biopesticides Market, By TYPE, 2019-2028 (USD Million)

TABLE 120 U.K. Bioinsecticides in Biopesticides Market, By TYPE, 2019-2028 (tons)

TABLE 121 U.K. Biofungicides in Biopesticides Market, By TYPE, 2019-2028 (USD Million)

TABLE 122 U.K. Biofungicides in Biopesticides Market, By TYPE, 2019-2028 (ton)

TABLE 123 U.K. Bionematicides in Biopesticides Market, By TYPE, 2019-2028 (USD Million)

TABLE 124 U.K. Bionematicides in Biopesticides Market, By TYPE, 2019-2028 (tons)

TABLE 125 U.K. Biopesticides Market, By Source, 2019-2028 (USD Million)

TABLE 126 U.K. Microbial in Biopesticides Market, By Source, 2019-2028 (USD Million)

TABLE 127 U.K. Biochemical in Biopesticides Market, By Source, 2019-2028 (USD Million)

TABLE 128 U.K. Insect in Biopesticides Market, By Source, 2019-2028 (USD Million)

TABLE 129 U.K. Biopesticides Market, By FORM, 2019-2028 (USD Million)

TABLE 130 U.K. Liquid in Biopesticides Market, By FORM, 2019-2028 (USD Million)

TABLE 131 U.K. Dry in Biopesticides Market, By FORM, 2019-2028 (USD Million)

TABLE 132 U.K. Biopesticides Market, By Application, 2019-2028 (USD Million)

TABLE 133 U.K. Biopesticides Market, By Category, 2019-2028 (USD Million)

TABLE 134 U.K. Biopesticides Market, By Crops, 2019-2028 (USD Million)

TABLE 135 U.K. Fruits & Vegetables in Biopesticides Market, By Crops, 2019-2028 (USD Million)

TABLE 136 U.K. Cereal & Grains in Biopesticides Market, By Crops, 2019-2028 (USD Million)

TABLE 137 U.K. Oilseed & Pulses in Biopesticides Market, By Crops, 2019-2028 (USD Million)

TABLE 138 Italy Biopesticides Market, By TYPE, 2019-2028 (USD Million)

TABLE 139 Italy Biopesticides Market, By TYPE, 2019-2028 (tons)

TABLE 140 Italy Bioinsecticides in Biopesticides Market, By TYPE, 2019-2028 (USD Million)

TABLE 141 Italy Bioinsecticides in Biopesticides Market, By TYPE, 2019-2028 (tons)

TABLE 142 Italy Biofungicides in Biopesticides Market, By TYPE, 2019-2028 (USD Million)

TABLE 143 Italy Biofungicides in Biopesticides Market, By TYPE, 2019-2028 (tons)

TABLE 144 Italy Bionematicides in Biopesticides Market, By TYPE, 2019-2028 (USD Million)

TABLE 145 Italy Bionematicides in Biopesticides Market, By TYPE, 2019-2028 (tons)

TABLE 146 Italy Biopesticides Market, By Source, 2019-2028 (USD Million)

TABLE 147 Italy Microbial in Biopesticides Market, By Source, 2019-2028 (USD Million)

TABLE 148 Italy Biochemical in Biopesticides Market, By Source, 2019-2028 (USD Million)

TABLE 149 Italy Insect in Biopesticides Market, By Source, 2019-2028 (USD Million)

TABLE 150 Italy Biopesticides Market, By FORM, 2019-2028 (USD Million)

TABLE 151 Italy Liquid in Biopesticides Market, By FORM, 2019-2028 (USD Million)

TABLE 152 Italy Dry in Biopesticides Market, By FORM, 2019-2028 (USD Million)

TABLE 153 Italy Biopesticides Market, By Application, 2019-2028 (USD Million)

TABLE 154 Italy Biopesticides Market, By Category, 2019-2028 (USD Million)

TABLE 155 Italy Biopesticides Market, By Crops, 2019-2028 (USD Million)

TABLE 156 Italy Fruits & Vegetables in Biopesticides Market, By Crops, 2019-2028 (USD Million)

TABLE 157 Italy Cereal & Grains in Biopesticides Market, By Crops, 2019-2028 (USD Million)

TABLE 158 Italy Oilseed & Pulses in Biopesticides Market, By Crops, 2019-2028 (USD Million)

TABLE 159 Spain Biopesticides Market, By TYPE, 2019-2028 (USD Million)

TABLE 160 Spain Biopesticides Market, By TYPE, 2019-2028 (tons)

TABLE 161 Spain Bioinsecticides in Biopesticides Market, By TYPE, 2019-2028 (USD Million)

TABLE 162 Spain Bioinsecticides in Biopesticides Market, By TYPE, 2019-2028 (tons)

TABLE 163 Spain Biofungicides in Biopesticides Market, By TYPE, 2019-2028 (USD Million)

TABLE 164 Spain Biofungicides in Biopesticides Market, By TYPE, 2019-2028 (tons)

TABLE 165 Spain Bionematicides in Biopesticides Market, By TYPE, 2019-2028 (USD Million)

TABLE 166 Spain Bionematicides in Biopesticides Market, By TYPE, 2019-2028 (Tons)

TABLE 167 Spain Biopesticides Market, By Source, 2019-2028 (USD Million)

TABLE 168 Spain Microbial in Biopesticides Market, By Source, 2019-2028 (USD Million)

TABLE 169 Spain Biochemical in Biopesticides Market, By Source, 2019-2028 (USD Million)

TABLE 170 Spain Insect in Biopesticides Market, By Source, 2019-2028 (USD Million)

TABLE 171 Spain Biopesticides Market, By FORM, 2019-2028 (USD Million)

TABLE 172 Spain Liquid in Biopesticides Market, By FORM, 2019-2028 (USD Million)

TABLE 173 Spain Dry in Biopesticides Market, By FORM, 2019-2028 (USD Million)

TABLE 174 Spain Biopesticides Market, By Application, 2019-2028 (USD Million)

TABLE 175 Spain Biopesticides Market, By Category, 2019-2028 (USD Million)

TABLE 176 Spain Biopesticides Market, By Crops, 2019-2028 (USD Million)

TABLE 177 Spain Fruits & Vegetables in Biopesticides Market, By Crops, 2019-2028 (USD Million)

TABLE 178 Spain Cereal & Grains in Biopesticides Market, By Crops, 2019-2028 (USD Million)

TABLE 179 Spain Oilseed & Pulses in Biopesticides Market, By Crops, 2019-2028 (USD Million)

TABLE 180 Russia Biopesticides Market, By TYPE, 2019-2028 (USD Million)

TABLE 181 Russia Biopesticides Market, By TYPE, 2019-2028 (tons)

TABLE 182 Russia Bioinsecticides in Biopesticides Market, By TYPE, 2019-2028 (USD Million)

TABLE 183 Russia Bioinsecticides in Biopesticides Market, By TYPE, 2019-2028 (tons)

TABLE 184 Russia Biofungicides in Biopesticides Market, By TYPE, 2019-2028 (USD Million)

TABLE 185 Russia Biofungicides in Biopesticides Market, By TYPE, 2019-2028 (tons)

TABLE 186 Russia Bionematicides in Biopesticides Market, By TYPE, 2019-2028 (USD Million)

TABLE 187 Russia Bionematicides in Biopesticides Market, By TYPE, 2019-2028 (tons)

TABLE 188 Russia Biopesticides Market, By Source, 2019-2028 (USD Million)

TABLE 189 Russia Microbial in Biopesticides Market, By Source, 2019-2028 (USD Million)

TABLE 190 Russia Biochemical in Biopesticides Market, By Source, 2019-2028 (USD Million)

TABLE 191 Russia Insect in Biopesticides Market, By Source, 2019-2028 (USD Million)

TABLE 192 Russia Biopesticides Market, By FORM, 2019-2028 (USD Million)

TABLE 193 Russia Liquid in Biopesticides Market, By FORM, 2019-2028 (USD Million)

TABLE 194 Russia Dry in Biopesticides Market, By FORM, 2019-2028 (USD Million)

TABLE 195 Russia Biopesticides Market, By Application, 2019-2028 (USD Million)

TABLE 196 Russia Biopesticides Market, By Category, 2019-2028 (USD Million)

TABLE 197 Russia Biopesticides Market, By Crops, 2019-2028 (USD Million)

TABLE 198 Russia Fruits & Vegetables in Biopesticides Market, By Crops, 2019-2028 (USD Million)

TABLE 199 Russia Cereal & Grains in Biopesticides Market, By Crops, 2019-2028 (USD Million)

TABLE 200 Russia Oilseed & Pulses in Biopesticides Market, By Crops, 2019-2028 (USD Million)

TABLE 201 Turkey Biopesticides Market, By TYPE, 2019-2028 (USD Million)

TABLE 202 Turkey Biopesticides Market, By TYPE, 2019-2028 (tons)

TABLE 203 Turkey Bioinsecticides in Biopesticides Market, By TYPE, 2019-2028 (USD Million)

TABLE 204 Turkey Bioinsecticides in Biopesticides Market, By TYPE, 2019-2028 (tons)

TABLE 205 Turkey Biofungicides in Biopesticides Market, By TYPE, 2019-2028 (USD Million)

TABLE 206 Turkey Biofungicides in Biopesticides Market, By TYPE, 2019-2028 (tons)

TABLE 207 Turkey Bionematicides in Biopesticides Market, By TYPE, 2019-2028 (USD Million)

TABLE 208 Turkey Bionematicides in Biopesticides Market, By TYPE, 2019-2028 (tons)

TABLE 209 Turkey Biopesticides Market, By Source, 2019-2028 (USD Million)

TABLE 210 Turkey Microbial in Biopesticides Market, By Source, 2019-2028 (USD Million)

TABLE 211 TurkEy Biochemical in Biopesticides Market, By Source, 2019-2028 (USD Million)

TABLE 212 Turkey Insect in Biopesticides Market, By Source, 2019-2028 (USD Million)

TABLE 213 Turkey Biopesticides Market, By FORM, 2019-2028 (USD Million)

TABLE 214 Turkey Liquid in Biopesticides Market, By FORM, 2019-2028 (USD Million)

TABLE 215 Turkey Dry in Biopesticides Market, By FORM, 2019-2028 (USD Million)

TABLE 216 Turkey Biopesticides Market, By Application, 2019-2028 (USD Million)

TABLE 217 Turkey Biopesticides Market, By Category, 2019-2028 (USD Million)

TABLE 218 Turkey Biopesticides Market, By Crops, 2019-2028 (USD Million)

TABLE 219 Turkey Fruits & Vegetables in Biopesticides Market, By Crops, 2019-2028 (USD Million)

TABLE 220 Turkey Cereal & Grains in Biopesticides Market, By Crops, 2019-2028 (USD Million)

TABLE 221 Turkey Oilseed & Pulses in Biopesticides Market, By Crops, 2019-2028 (USD Million)

TABLE 222 Belgium Biopesticides Market, By TYPE, 2019-2028 (USD Million)

TABLE 223 Belgium Biopesticides Market, By TYPE, 2019-2028 (tons)

TABLE 224 Belgium Bioinsecticides in Biopesticides Market, By TYPE, 2019-2028 (USD Million)

TABLE 225 Belgium Bioinsecticides in Biopesticides Market, By TYPE, 2019-2028 (tons)

TABLE 226 Belgium Biofungicides in Biopesticides Market, By TYPE, 2019-2028 (USD Million)

TABLE 227 Belgium Biofungicides in Biopesticides Market, By TYPE, 2019-2028 (tons)

TABLE 228 Belgium Bionematicides in Biopesticides Market, By TYPE, 2019-2028 (USD Million)

TABLE 229 Belgium Bionematicides in Biopesticides Market, By TYPE, 2019-2028 (tons)

TABLE 230 Belgium Biopesticides Market, By Source, 2019-2028 (USD Million)

TABLE 231 Belgium Microbial in Biopesticides Market, By Source, 2019-2028 (USD Million)

TABLE 232 Belgium Biochemical in Biopesticides Market, By Source, 2019-2028 (USD Million)

TABLE 233 Belgium Insect in Biopesticides Market, By Source, 2019-2028 (USD Million)

TABLE 234 Belgium Biopesticides Market, By FORM, 2019-2028 (USD Million)

TABLE 235 Belgium Liquid in Biopesticides Market, By FORM, 2019-2028 (USD Million)

TABLE 236 Belgium Dry in Biopesticides Market, By FORM, 2019-2028 (USD Million)

TABLE 237 Belgium Biopesticides Market, By Application, 2019-2028 (USD Million)

TABLE 238 Belgium Biopesticides Market, By Category, 2019-2028 (USD Million)

TABLE 239 Belgium Biopesticides Market, By Crops, 2019-2028 (USD Million)

TABLE 240 Belgium Fruits & Vegetables in Biopesticides Market, By Crops, 2019-2028 (USD Million)

TABLE 241 Belgium Cereal & Grains in Biopesticides Market, By Crops, 2019-2028 (USD Million)

TABLE 242 Belgium Oilseed & Pulses in Biopesticides Market, By Crops, 2019-2028 (USD Million)

TABLE 243 Netherlands Biopesticides Market, By TYPE, 2019-2028 (USD Million)

TABLE 244 Netherlands Biopesticides Market, By TYPE, 2019-2028 (tons)

TABLE 245 Netherlands Bioinsecticides in Biopesticides Market, By TYPE, 2019-2028 (USD Million)

TABLE 246 Netherlands Bioinsecticides in Biopesticides Market, By TYPE, 2019-2028 (tons)

TABLE 247 Netherlands Biofungicides in Biopesticides Market, By TYPE, 2019-2028 (USD Million)

TABLE 248 Netherlands Biofungicides in Biopesticides Market, By TYPE, 2019-2028 (tons)

TABLE 249 Netherland Bionematicides in Biopesticides Market, By TYPE, 2019-2028 (USD Million)

TABLE 250 Netherland Bionematicides in Biopesticides Market, By TYPE, 2019-2028 (tons)

TABLE 251 Netherlands Biopesticides Market, By Source, 2019-2028 (USD Million)

TABLE 252 Netherlands Microbial in Biopesticides Market, By Source, 2019-2028 (USD Million)

TABLE 253 Netherlands Biochemical in Biopesticides Market, By Source, 2019-2028 (USD Million)

TABLE 254 Netherlands Insect in Biopesticides Market, By Source, 2019-2028 (USD Million)

TABLE 255 Netherlands Biopesticides Market, By FORM, 2019-2028 (USD Million)

TABLE 256 Netherlands Liquid in Biopesticides Market, By FORM, 2019-2028 (USD Million)

TABLE 257 Netherlands Dry in Biopesticides Market, By FORM, 2019-2028 (USD Million)

TABLE 258 Netherlands Biopesticides Market, By Application, 2019-2028 (USD Million)

TABLE 259 Netherlands Biopesticides Market, By Category, 2019-2028 (USD Million)

TABLE 260 Netherlands Biopesticides Market, By Crops, 2019-2028 (USD Million)

TABLE 261 Netherlands Fruits & Vegetables in Biopesticides Market, By Crops, 2019-2028 (USD Million)

TABLE 262 Netherlands Cereal & Grains in Biopesticides Market, By Crops, 2019-2028 (USD Million)

TABLE 263 Netherlands Oilseed & Pulses in Biopesticides Market, By Crops, 2019-2028 (USD Million)

TABLE 264 Switzerland Biopesticides Market, By TYPE, 2019-2028 (USD Million)

TABLE 265 Switzerland Biopesticides Market, By TYPE, 2019-2028 (tons)

TABLE 266 Switzerland Bioinsecticides in Biopesticides Market, By TYPE, 2019-2028 (USD Million)

TABLE 267 Switzerland Bioinsecticides in Biopesticides Market, By TYPE, 2019-2028 (tons)

TABLE 268 Switzerland Biofungicides in Biopesticides Market, By TYPE, 2019-2028 (USD Million)

TABLE 269 Switzerland Biofungicides in Biopesticides Market, By TYPE, 2019-2028 (tons)

TABLE 270 Switzerland Bionematicides in Biopesticides Market, By TYPE, 2019-2028 (USD Million)

TABLE 271 Switzerland Bionematicides in Biopesticides Market, By TYPE, 2019-2028 (tons)

TABLE 272 Switzerland Biopesticides Market, By Source, 2019-2028 (USD Million)

TABLE 273 Switzerland Microbial in Biopesticides Market, By Source, 2019-2028 (USD Million)

TABLE 274 Switzerland Biochemical in Biopesticides Market, By Source, 2019-2028 (USD Million)

TABLE 275 Switzerland Insect in Biopesticides Market, By Source, 2019-2028 (USD Million)

TABLE 276 Switzerland Biopesticides Market, By FORM, 2019-2028 (USD Million)

TABLE 277 Switzerland Liquid in Biopesticides Market, By FORM, 2019-2028 (USD Million)

TABLE 278 Switzerland Dry in Biopesticides Market, By FORM, 2019-2028 (USD Million)

TABLE 279 Switzerland Biopesticides Market, By Application, 2019-2028 (USD Million)

TABLE 280 Switzerland Biopesticides Market, By Category, 2019-2028 (USD Million)

TABLE 281 Switzerland Biopesticides Market, By Crops, 2019-2028 (USD Million)

TABLE 282 Switzerland Fruits & Vegetables in Biopesticides Market, By Crops, 2019-2028 (USD Million)

TABLE 283 Switzerland Cereal & Grains in Biopesticides Market, By Crops, 2019-2028 (USD Million)

TABLE 284 Switzerland Oilseed & Pulses in Biopesticides Market, By Crops, 2019-2028 (USD Million)

TABLE 285 Luxemburg Biopesticides Market, By TYPE, 2019-2028 (USD Million)

TABLE 286 Luxemburg Biopesticides Market, By TYPE, 2019-2028 (tons)

TABLE 287 Luxemburg Bioinsecticides in Biopesticides Market, By TYPE, 2019-2028 (USD Million)

TABLE 288 Luxemburg Bioinsecticides in Biopesticides Market, By TYPE, 2019-2028 (tons)

TABLE 289 Luxemburg Biofungicides in Biopesticides Market, By TYPE, 2019-2028 (USD Million)

TABLE 290 Luxemburg Biofungicides in Biopesticides Market, By TYPE, 2019-2028 (tons)

TABLE 291 Luxemburg Bionematicides in Biopesticides Market, By TYPE, 2019-2028 (USD Million)

TABLE 292 Luxemburg Bionematicides in Biopesticides Market, By TYPE, 2019-2028 (tons)

TABLE 293 Luxemburg Biopesticides Market, By Source, 2019-2028 (USD Million)

TABLE 294 Luxemburg Microbial in Biopesticides Market, By Source, 2019-2028 (USD Million)

TABLE 295 Luxemburg Biochemical in Biopesticides Market, By Source, 2019-2028 (USD Million)

TABLE 296 Luxemburg Insect in Biopesticides Market, By Source, 2019-2028 (USD Million)

TABLE 297 Luxemburg Biopesticides Market, By FORM, 2019-2028 (USD Million)

TABLE 298 Luxemburg Liquid in Biopesticides Market, By FORM, 2019-2028 (USD Million)

TABLE 299 Luxemburg Biopesticides Market, By Application, 2019-2028 (USD Million)

TABLE 300 Luxemburg Biopesticides Market, By Category, 2019-2028 (USD Million)

TABLE 301 Luxemburg Biopesticides Market, By Category, 2019-2028 (USD Million)

TABLE 302 Luxemburg Biopesticides Market, By Crops, 2019-2028 (USD Million)

TABLE 303 Luxemburg Fruits & Vegetables in Biopesticides Market, By Crops, 2019-2028 (USD Million)

TABLE 304 Luxemburg Cereal & Grains in Biopesticides Market, By Crops, 2019-2028 (USD Million)

TABLE 305 Luxemburg Oilseed & Pulses in Biopesticides Market, By Crops, 2019-2028 (USD Million)

TABLE 306 Rest of Europe Biopesticides Market, By TYPE, 2019-2028 (USD Million)

TABLE 307 Rest of Europe Biopesticides Market, By TYPE, 2019-2028 (tons)

TABLE 308 rest of europe Bioinsecticides in Biopesticides Market, By TYPE, 2019-2028 (USD Million)

TABLE 309 rest of europe Biofungicides in Biopesticides Market, By TYPE, 2019-2028 (USD Million)

TABLE 310 rest of europe Bionematicides in Biopesticides Market, By TYPE, 2019-2028 (tons)

TABLE 311 rest of europe Biopesticides Market, By Source, 2019-2028 (USD Million)

TABLE 312 rest of europe Microbial in Biopesticides Market, By Source, 2019-2028 (USD Million)

TABLE 313 rest of europe Biochemical in Biopesticides Market, By Source, 2019-2028 (USD Million)

TABLE 314 rest of europe Insect in Biopesticides Market, By Source, 2019-2028 (USD Million)

TABLE 315 rest of europe Biopesticides Market, By FORM, 2019-2028 (USD Million)

TABLE 316 rest of europe Liquid in Biopesticides Market, By FORM, 2019-2028 (USD Million)

TABLE 317 rest of europe dry in Biopesticides Market, By FORM, 2019-2028 (USD Million)

TABLE 318 Luxemburg Biopesticides Market, By Application, 2019-2028 (USD Million)

TABLE 319 rest of europe Biopesticides Market, By Category, 2019-2028 (USD Million)

TABLE 320 rest of europe Biopesticides Market, By Crops, 2019-2028 (USD Million)

TABLE 321 rest of europe Fruits & Vegetables in Biopesticides Market, By Crops, 2019-2028 (USD Million)

TABLE 322 rest of europe Cereal & Grains in Biopesticides Market, By Crops, 2019-2028 (USD Million)

TABLE 323 rest of europe Oilseed & Pulses in Biopesticides Market, By Crops, 2019-2028 (USD Million)

図表一覧

FIGURE 1 Europe biopesticides MARKET: segmentation

FIGURE 2 EUROPE BIOPESTICIDES MARKET: data triangulation

FIGURE 3 Europe biopesticides MARKET: DROC ANALYSIS

FIGURE 4 Europe biopesticides MARKET: EUROPE VS REGIONAL MARKET ANALYSIS

FIGURE 5 EUROPE BIOPESTICIDES MARKET: COMPANY RESEARCH ANALYSIS

FIGURE 6 EUROPE BIOPESTICIDES MARKET: INTERVIEW DEMOGRAPHICS

FIGURE 7 Europe biopesticides MARKET: DBMR MARKET POSITION GRID

FIGURE 8 EUROPE BIOPESTICIDES MARKET: vendor share analysis

FIGURE 9 Europe biopesticides MARKET: SEGMENTATION

FIGURE 10 RISE IN FUNDING FOR BIOPESTICIDEs PRODUCTS is expected to drive the growth of the Europe biopesticides market IN THE FORECAST PERIOD of 2021 To 2028

FIGURE 11 bioinsecticides segment is expected to account for the largest share of the Europe biopesticides market in 2021 & 2028

FIGURE 12 DRIVERS, RESTRAINTS, OPPORTUNITIES AND CHALLENGES OF Europe Biopesticides Market

FIGURE 13 Europe biopesticides Market, By type, 2020

FIGURE 14 Europe biopesticides Market, By source, 2020

FIGURE 15 Europe Biopesticides Market, By FORM, 2020

FIGURE 16 Europe biopesticides market, By Application, 2020

FIGURE 17 The procedure for seed treatment is as follows-

FIGURE 18 Europe biopesticides market, By crop, 2020

FIGURE 19 Europe biopesticides Market, By Category, 2020

FIGURE 20 europe biopesticides market: SNAPSHOT (2020)

FIGURE 21 europe biopesticides market: BY COUNTRY (2020)

FIGURE 22 europe biopesticides market: BY COUNTRY (2021 & 2028)

FIGURE 23 europe biopesticides market: BY COUNTRY (2020 & 2028)

FIGURE 24 europe biopesticides market: BY TYPE, 2019-2028 (2021 & 2028)

FIGURE 25 Europe Biopesticides Market: company share 2020 (%)

詳細情報を見る Right Arrow

調査方法

データ収集と基準年分析は、大規模なサンプル サイズのデータ​​収集モジュールを使用して行われます。この段階では、さまざまなソースと戦略を通じて市場情報または関連データを取得します。過去に取得したすべてのデータを事前に調査および計画することも含まれます。また、さまざまな情報ソース間で見られる情報の不一致の調査も含まれます。市場データは、市場統計モデルと一貫性モデルを使用して分析および推定されます。また、市場シェア分析と主要トレンド分析は、市場レポートの主要な成功要因です。詳細については、アナリストへの電話をリクエストするか、お問い合わせをドロップダウンしてください。

DBMR 調査チームが使用する主要な調査方法は、データ マイニング、データ変数が市場に与える影響の分析、および一次 (業界の専門家) 検証を含むデータ三角測量です。データ モデルには、ベンダー ポジショニング グリッド、市場タイムライン分析、市場概要とガイド、企業ポジショニング グリッド、特許分析、価格分析、企業市場シェア分析、測定基準、グローバルと地域、ベンダー シェア分析が含まれます。調査方法について詳しくは、お問い合わせフォームから当社の業界専門家にご相談ください。

カスタマイズ可能

Data Bridge Market Research は、高度な形成的調査のリーダーです。当社は、既存および新規のお客様に、お客様の目標に合致し、それに適したデータと分析を提供することに誇りを持っています。レポートは、対象ブランドの価格動向分析、追加国の市場理解 (国のリストをお問い合わせください)、臨床試験結果データ、文献レビュー、リファービッシュ市場および製品ベース分析を含めるようにカスタマイズできます。対象競合他社の市場分析は、技術ベースの分析から市場ポートフォリオ戦略まで分析できます。必要な競合他社のデータを、必要な形式とデータ スタイルでいくつでも追加できます。当社のアナリスト チームは、粗い生の Excel ファイル ピボット テーブル (ファクト ブック) でデータを提供したり、レポートで利用可能なデータ セットからプレゼンテーションを作成するお手伝いをしたりすることもできます。

Frequently Asked Questions

Europe Biopesticides Market to grow at a rate of CAGR of 13.5% by forecast 2028
Europe Biopesticides Market expected value of USD 3,135.64 million by forecast 2028
The major players operating in the biopesticides market are Syngenta Crop Protection AG, Bionema, Vegalab SA, STK bio-ag technologies, Andermatt Biocontrol AG, Koppert Biological Systems, Corteva, Bayer AG, Biobest Group NV, Certis USA L.L.C., Valent BioSciences LLC, Novozymes, BASF SE, IPL Biologicals Limited, Terramera Inc., Khandelwal Bio Fertilizer, Isagro, Gowan Company, Parry America, Inc., Barrix Agro Sciences Pvt Ltd, BioWorks Inc., Marrone Bio Innovations, FMC Corporation, UPL, Nufarm, Bioline AgriSciences ltd, Biofa GmbH, BioConsortia, Inc., McLaughlin Gormley King Company, and W. Neudorff GmbH KG among others.
Europe Biopesticides Market segmented By Application such as Foliar Application, Seed Treatment, Soil Treatment, Fertigation, Others.