

欧州の生理活性成分市場規模、シェア、トレンド分析レポート
Market Size in USD Billion
CAGR :
% 
 USD
10.34 Billion
USD
17.90 Billion
2025
2033
USD
10.34 Billion
USD
17.90 Billion
2025
2033
| 2026 –2033 | |
| USD 10.34 Billion | |
| USD 17.90 Billion | |
| % | |
|
ヨーロッパの生物活性成分市場セグメンテーション、成分タイプ別(プレバイオティクス、プロバイオティクス、アミノ酸、ペプチド、オメガ3および構造化脂質、植物化学物質および植物抽出物、ミネラル、ビタミン、繊維および特殊炭水化物、カロテノイドおよび抗酸化物質など)、用途別(機能性食品、栄養補助食品、グミサプリメント、動物栄養、パーソナルケアなど)、およびソース別(植物、動物、微生物) - 業界動向と2033年までの予測
欧州の生理活性成分市場規模
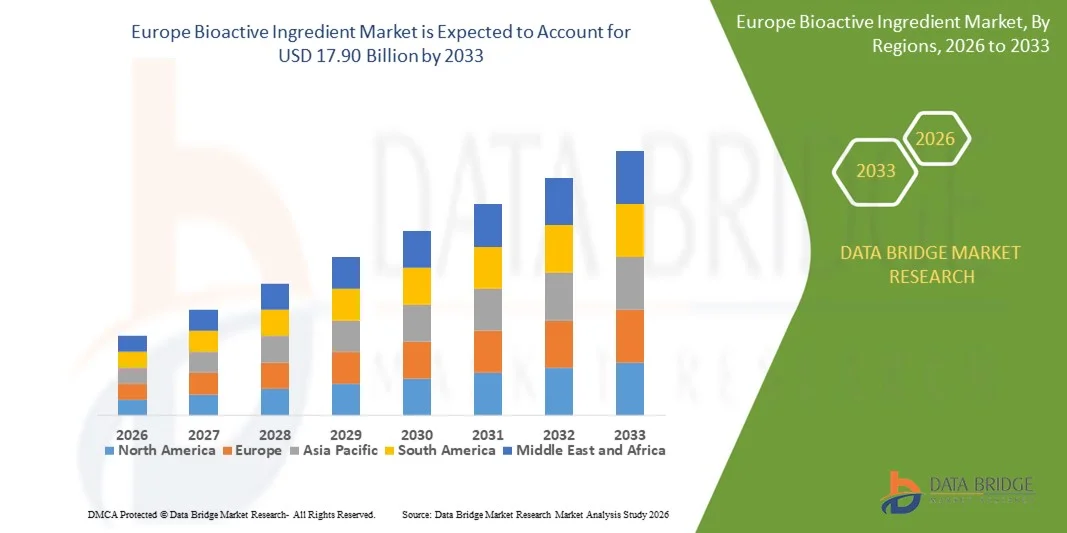
- ヨーロッパの生物活性成分市場規模は2025年に103.4億米ドルと評価され、予測期間中に7.10%のCAGRで成長し、2033年までに179億米ドル に達すると予想されています。
- 市場の成長は、予防医療、機能性栄養、生活習慣病の管理における生理活性化合物の役割に関する消費者の意識の高まりによって主に促進されている。
- 機能性食品、栄養補助食品、栄養補助食品、パーソナルケア製品への生物活性成分の配合増加は、持続的な市場拡大をさらに後押ししている。
欧州の生理活性成分市場分析
- 生物活性化合物のバイオアベイラビリティ、安定性、および有効性を高める抽出、製剤、および送達技術の継続的な革新により、市場は力強い勢いを見せています。
- さらに、天然、植物由来、クリーンラベルの原料への嗜好が高まり、食品、飲料、医薬品、化粧品業界での用途が拡大していることから、市場全体の魅力が高まっています。
- ドイツの生理活性成分市場は、消費者の健康と栄養に対する強い意識に牽引され、2025年も依然として市場をリードする地位を維持しました。確立された食品、栄養補助食品、医薬品産業が、生理活性化合物に対する安定した需要を支えています。
- 英国は、健康意識の高まり、栄養補助食品や機能性食品の需要増加、植物由来製品やクリーンラベル製品への嗜好増加、小売およびオンライン流通チャネルの拡大により、欧州の生物活性成分市場において最も高い複合年間成長率(CAGR)を達成すると予想されています。
- ビタミンセグメントは、機能性食品、栄養補助食品、強化飲料における広範な利用に加え、免疫力、エネルギー、そして健康全般に対する消費者の関心の高まりにより、2025年には最大の市場収益シェアを獲得しました。ビタミンは、その確立された健康効果、処方の容易さ、そして幅広い年齢層の消費者の高い認知度により、広く利用されています。
レポートの範囲とヨーロッパの生物活性成分市場のセグメンテーション
|
属性 |
欧州における生物活性成分の主要市場分析 |
|
対象セグメント |
|
|
対象国 |
ヨーロッパ
|
|
主要な市場プレーヤー |
|
|
市場機会 |
|
|
付加価値データ情報セット |
データブリッジマーケットリサーチがまとめた市場レポートには、市場価値、成長率、セグメンテーション、地理的範囲、主要プレーヤーなどの市場シナリオに関する洞察に加えて、専門家による詳細な分析、価格設定分析、ブランドシェア分析、消費者調査、人口統計分析、サプライチェーン分析、バリューチェーン分析、原材料/消耗品の概要、ベンダー選択基準、PESTLE分析、ポーター分析、規制の枠組みも含まれています。 |
欧州の生理活性成分市場動向
予防医療と機能性栄養の需要の高まり
- 健康維持と疾病予防への関心の高まりは、消費者が基本的な栄養摂取を超えた生理学的効果を提供する成分を求める傾向を強めており、バイオアクティブ成分市場を大きく変化させています。バイオアクティブ成分は、免疫力、消化器系の健康、心血管の健康、認知能力の向上といった効果が実証されていることから、大きな注目を集めています。この傾向は、機能性食品、栄養補助食品、ニュートラシューティカルズ、パーソナルケア製品などへのバイオアクティブ成分の採用を促進し、メーカーによる健康志向の消費パターンに合わせた革新的な処方の開発を促しています。
- 生活習慣病、高齢化、そして長期的な健康への意識の高まりにより、機能性食品、強化飲料、サプリメント、スポーツ栄養製品における生理活性成分の需要が加速しています。健康志向の高い消費者は、抗酸化物質、プロバイオティクス、オメガ脂肪酸、ポリフェノール、植物エキスなどを配合した製品を積極的に求めており、ブランドは製品開発において科学的検証、クリーンラベルの位置付け、そして機能的有効性を重視しています。
- 予防的健康とウェルネスのトレンドは購買決定に影響を与えており、メーカーは臨床的に裏付けられた効果、天然由来成分の調達、バイオアベイラビリティの向上を強調しています。透明性のあるラベル表示、研究に裏付けられた健康強調表示、そして持続可能性への配慮は、ブランドが製品を差別化し、消費者の信頼を築くのに役立ち、同時に研究開発や高度なデリバリーシステムへの投資を促進しています。
- 例えば、2024年には、大手栄養・ウェルネスブランドが、プロバイオティクス、オメガ3脂肪酸、植物由来の抗酸化物質などの生理活性化合物を強化した機能性食品やサプリメントを発売し、ポートフォリオを拡大しました。これらの発売は、免疫力向上、腸内環境の改善、エネルギーサポート製品に対する消費者の需要の高まりを背景に、小売、eコマース、健康志向の流通チャネルで大きな牽引力を発揮しました。
- 生理活性成分の需要は増加し続けていますが、持続的な市場成長は、継続的な研究、規制遵守、そして処方全体にわたる一貫した有効性の確保にかかっています。メーカーは、より広範な普及を支援するために、コスト、品質、科学的根拠のバランスを取りながら、バイオアベイラビリティ、安定性、拡張性の向上に注力しています。
欧州の生物活性成分市場の動向
ドライバ
予防医療と機能性食品の消費への注目の高まり
- 予防医療への消費者の関心の高まりは、生理活性成分市場の主要な推進力となっています。消費者は、長期的な健康維持、慢性疾患の管理、そして全体的な健康増進のために、生理活性化合物を豊富に含む機能性食品、サプリメント、栄養補助食品への関心を高めています。この変化は、メーカーが従来の成分を、科学的根拠に基づいた機能性生理活性物質に置き換えることを促しています。
- 機能性食品、飲料、栄養補助食品、医薬品、パーソナルケア製品など、用途の拡大が市場の成長に貢献しています。生理活性成分は、栄養価、機能的パフォーマンス、そして健康ポジショニングの向上に役立ち、メーカーは健康志向の製品に対する消費者の変化する期待に応えることができます。
- 食品、サプリメント、パーソナルケアメーカーは、製品イノベーション、臨床研究、健康志向のマーケティングキャンペーンを通じて、生理活性成分をベースとした処方を積極的に推進しています。これらの取り組みは、天然由来、科学的根拠に基づいた、多機能性成分に対する消費者の嗜好の高まりと、成分サプライヤー、研究機関、ブランド間のパートナーシップの促進によって支えられています。
- 例えば、2023年には、世界の大手栄養・サプリメント企業は、機能性食品やサプリメントの配合におけるプロバイオティクス、植物エキス、オメガ脂肪酸の配合増加を報告しました。この増加は、免疫、消化器系の健康、認知機能サポートソリューションに対する消費者の需要の高まりを受けて、製品の差別化とリピート購入を促進しました。
- 予防医療のトレンドは市場の成長を強く後押ししているものの、長期的な成功は、規制の整合性、一貫した原料の品質、そして世界的な需要を満たし競争力を維持するための研究と配合技術への継続的な投資にかかっています。
抑制/挑戦
高い開発コストと規制の複雑さ
- 生物活性成分の開発と商業化に伴う比較的高いコストは、特に広範な研究、臨床検証、そして高度な処理要件のために、依然として大きな課題となっています。抽出、精製、安定化プロセスはしばしば生産コストを増加させ、価格に敏感なメーカーによる採用を制限しています。
- 健康強調表示や機能性成分に関する規制の複雑さと多様な承認要件は、さらなる課題となっています。製造業者は厳格な安全性、有効性、および表示基準を遵守する必要があり、製品の発売が遅れ、コンプライアンスコストが増加する可能性があります。特定の新規生理活性化合物に関する規制の明確性が限られているため、市場参入がさらに制限されています。
- 一部の生理活性成分は熱、光、酸化に敏感であるため、サプライチェーンと製剤の課題も市場の成長に影響を与えます。異なる製品形態における安定性、バイオアベイラビリティ、そして一貫した性能を確保するには、製剤の複雑さと運用コストが増加します。
- 例えば、2024年に新しい生理活性物質をベースとした機能性食品やサプリメントを発売するメーカーは、承認期間の延長と健康効果を裏付けるための追加の臨床文書の必要性により、遅延が発生していると報告しています。これらの要因により、市場投入までの時間が長くなり、イノベーションサイクルが制約されました。
- これらの課題に対処するには、合理化された規制枠組み、費用対効果の高い抽出技術、そして科学研究への継続的な投資が必要です。長期的な成長機会を創出し、世界の生理活性成分市場の持続的な拡大を確保するためには、原料生産者、規制当局、そして製品メーカー間の連携が不可欠です。
欧州の生理活性成分市場の範囲
市場は、成分の種類、用途、および供給源に基づいて分類されています。
- 材料の種類別
成分の種類に基づいて、欧州の生理活性成分市場は、プレバイオティクス、プロバイオティクス、アミノ酸、ペプチド、オメガ3脂肪酸および構造脂質、植物化学物質および植物抽出物、ミネラル、ビタミン、繊維および特殊炭水化物、カロテノイドおよび抗酸化物質、その他に分類されます。ビタミンセグメントは、機能性食品、栄養補助食品、強化飲料における広範な使用と、免疫力、エネルギー、そして全体的な健康に対する消費者の関心の高まりにより、2025年には最大の市場収益シェアを占めました。ビタミンは、その確立された健康効果、処方の容易さ、そして幅広い年齢層における強い消費者意識により、広く取り入れられています。
プロバイオティクス分野は、腸内環境、消化器系の健康、免疫サポートへの意識の高まりを背景に、2026年から2033年にかけて最も高い成長率を示すと予想されています。発酵食品、機能性飲料、プロバイオティクスサプリメントの消費量の増加が急速な普及を後押ししており、メーカーはより幅広い用途に向けて菌株の革新と安定性の向上に投資しています。
- アプリケーション別
用途別に見ると、欧州の生理活性成分市場は、機能性食品、栄養補助食品、グミサプリメント、動物栄養、パーソナルケア、その他に分類されます。栄養補助食品セグメントは、健康意識の高まり、予防医療のトレンド、そして簡便な栄養摂取形態への需要の高まりを背景に、2025年には最大の市場シェアを占めました。生理活性成分は、免疫力、エネルギー、そしてライフスタイルに関連する健康問題に対処するために、カプセル、錠剤、粉末などの形で広く利用されています。
機能性食品セグメントは、健康効果を高める強化食品・飲料の消費増加に牽引され、2026年から2033年にかけて最も高い成長率を記録すると予想されています。メーカーは、栄養価が高く健康志向の食生活を求める消費者の嗜好の変化に対応するため、日常的な食品に生理活性成分を組み込むことに注力しています。
- 出典別
欧州の生理活性成分市場は、原料の供給源に基づいて、植物、動物、微生物の3つに分類されます。2025年には、天然由来、クリーンラベル、持続可能な方法で調達された原料に対する消費者の強い嗜好に支えられ、植物由来セグメントが市場を席巻しました。ポリフェノール、繊維、植物エキスなどの植物由来の生理活性成分は、その安全性と機能的利点から、食品、サプリメント、パーソナルケア製品など、幅広い用途で使用されています。
微生物セグメントは、プロバイオティクス、酵素、発酵由来成分の利用増加に支えられ、2026年から2033年にかけて最も高い成長率を記録すると予想されています。バイオテクノロジーと発酵プロセスの進歩により、スケーラブルな生産と安定した品質が可能になり、生理活性成分メーカーにとって微生物源はますます魅力的なものとなっています。
欧州の生理活性成分市場地域分析
- ドイツの生理活性成分市場は、消費者の健康と栄養に対する強い意識に牽引され、2025年も依然として市場をリードする地位を維持しました。確立された食品、栄養補助食品、医薬品産業が、生理活性化合物に対する安定した需要を支えています。
- 消費者は機能性食品において、品質、安全性、そして規制遵守を重視しています。ビタミン、ミネラル、植物由来成分の採用率の高さは明らかです。研究開発への継続的な投資が市場リーダーシップを維持しています。
英国の生物活性成分市場の洞察
英国の生理活性成分市場は、健康意識の高まりとライフスタイルに関連したウェルネストレンドに牽引され、2026年から2033年にかけて最も高い成長率を記録すると予想されています。栄養補助食品や機能性食品の需要の高まりが市場の成長を加速させています。消費者は植物由来製品やクリーンラベル製品を好む傾向が高まっています。オンラインおよび小売流通チャネルの拡大により、製品の入手しやすさが向上しています。製品イノベーションとターゲットマーケティングも、製品の普及を後押ししています。
ヨーロッパの生物活性成分市場シェア
ヨーロッパの生物活性成分業界は、主に、次のような定評ある企業によって牽引されています。
• BASF SE(ドイツ)
• DSM-Firmenich AG(オランダ)
• Evonik Industries AG(ドイツ)
• Symrise AG(ドイツ)
• Kerry Group plc(アイルランド)
• Chr. Hansen Holding A/S(デンマーク)
• Arla Foods Ingredients Group P/S(デンマーク)
• Roquette Frères(フランス)
• Lesaffre Group(フランス)
• Tate & Lyle plc(英国)
• Croda International Plc(英国)
• Glanbia plc(アイルランド)
• Novozymes A/S(デンマーク)
• Biosearch Life SA(スペイン)
• Südzucker AG(ドイツ)
欧州の生理活性成分市場の最新動向
- 2021年5月、Chr. Hansen Holding A/Sは、乳牛および肉牛の健康と生産性の向上を目的とした新たなプロバイオティクスソリューションを発売しました。この開発により、様々な飼料用途に柔軟に組み込むことができるプロバイオティクスが実現し、消化、免疫、そして動物全体の成長の改善をサポートします。用途の多様性を提供することで、このソリューションは畜産農家や飼料メーカーが家畜の生産性を最適化しながら、動物の健康状態を維持することを可能にします。このプロバイオティクスの導入は、Chr. Hansenの動物栄養分野における地位を強化し、世界の乳牛および肉牛市場における機能性飼料ソリューションの採用を促進することが期待されます。
SKU-
世界初のマーケットインテリジェンスクラウドに関するレポートにオンラインでアクセスする

- インタラクティブなデータ分析ダッシュボード
- 成長の可能性が高い機会のための企業分析ダッシュボード
- カスタマイズとクエリのためのリサーチアナリストアクセス
- インタラクティブなダッシュボードによる競合分析
- 最新ニュース、更新情報、トレンド分析
- 包括的な競合追跡のためのベンチマーク分析のパワーを活用
調査方法
データ収集と基準年分析は、大規模なサンプル サイズのデータ収集モジュールを使用して行われます。この段階では、さまざまなソースと戦略を通じて市場情報または関連データを取得します。過去に取得したすべてのデータを事前に調査および計画することも含まれます。また、さまざまな情報ソース間で見られる情報の不一致の調査も含まれます。市場データは、市場統計モデルと一貫性モデルを使用して分析および推定されます。また、市場シェア分析と主要トレンド分析は、市場レポートの主要な成功要因です。詳細については、アナリストへの電話をリクエストするか、お問い合わせをドロップダウンしてください。
DBMR 調査チームが使用する主要な調査方法は、データ マイニング、データ変数が市場に与える影響の分析、および一次 (業界の専門家) 検証を含むデータ三角測量です。データ モデルには、ベンダー ポジショニング グリッド、市場タイムライン分析、市場概要とガイド、企業ポジショニング グリッド、特許分析、価格分析、企業市場シェア分析、測定基準、グローバルと地域、ベンダー シェア分析が含まれます。調査方法について詳しくは、お問い合わせフォームから当社の業界専門家にご相談ください。
カスタマイズ可能
Data Bridge Market Research は、高度な形成的調査のリーダーです。当社は、既存および新規のお客様に、お客様の目標に合致し、それに適したデータと分析を提供することに誇りを持っています。レポートは、対象ブランドの価格動向分析、追加国の市場理解 (国のリストをお問い合わせください)、臨床試験結果データ、文献レビュー、リファービッシュ市場および製品ベース分析を含めるようにカスタマイズできます。対象競合他社の市場分析は、技術ベースの分析から市場ポートフォリオ戦略まで分析できます。必要な競合他社のデータを、必要な形式とデータ スタイルでいくつでも追加できます。当社のアナリスト チームは、粗い生の Excel ファイル ピボット テーブル (ファクト ブック) でデータを提供したり、レポートで利用可能なデータ セットからプレゼンテーションを作成するお手伝いをしたりすることもできます。

