アフリカのマラリア治療市場 – 2031 年までの業界動向と予測

Request for TOC TOC のリクエスト Speak to Analyst アナリストに相談する Buy Now今すぐ購入 Inquire Before Buying 事前に問い合わせる Free Sample Report 無料サンプルレポート

アフリカのマラリア治療市場 – 2031 年までの業界動向と予測

  • Pharmaceutical
  • Upcoming Report
  • Jan 2024
  • Country Level
  • 350 ページ
  • テーブル数: 220
  • 図の数: 60

アフリカのマラリア治療市場

Market Size in USD Billion

CAGR :  % Diagram

Diagram 予測期間
2024 –2031
Diagram 市場規模(基準年)
USD 51.35 million
Diagram Market Size (Forecast Year)
USD 64.78 million
Diagram CAGR
%
Diagram 主要市場プレーヤー
  • Dummy1
  • Dummy2
  • Dummy3
  • Dummy4
  • Dummy5

>アフリカのマラリア治療市場、病原体別(熱帯熱マラリア原虫、三日熱マラリア原虫、卵形マラリア原虫、マラリア原虫、ノウルシ原虫)、タイプ別(投薬、予防接種、その他)、治療タイプ別(抑制治療、根治治療)、薬剤タイプ別(ジェネリック、ブランド)、投与経路別(経口、非経口)、エンドユーザー別(病院、専門クリニック、在宅医療、その他)、流通チャネル別(直接入札、病院薬局、小売薬局、オンライン薬局、その他)– 2031年までの業界動向と予測。

アフリカのマラリア治療市場の分析と規模

マラリアは感染症で、感染したメスのハマダラカに刺されることで人体に寄生虫が入り込み、感染が広がります。さらに、これらの寄生虫は肝細胞に留まり、そこで増殖し成長します。アフリカのマラリア治療市場を牽引する主な要因は、政府による啓発活動の増加と、新しい抗マラリア薬の研究の急増です。しかし、発展途上国におけるヘルスケアに対する認識の欠如は、市場の成長を阻害する主な要因です。ヒドロキシクロロキンとクロロキンの生産、輸入、輸出の増加は、市場にとってチャンスとなることが期待されています。抗マラリア薬に関連する副作用とリスクは、市場にとって課題となることが予想されます。                                

データブリッジマーケットリサーチは、2023年に5,135万米ドルだったアフリカのマラリア治療市場は、2031年までに6,478万米ドルに達する可能性があり、予測期間中に6.4%のCAGRを達成すると予測しています。マラリア治療市場のタイプセグメントでは、「ワクチン接種」が主流であり、これはワクチン接種プログラムとキャンペーンへの注目が高まっているためです。データブリッジマーケットリサーチがまとめた市場レポートには、市場価値、成長率、セグメンテーション、地理的範囲、主要プレーヤーなどの市場シナリオに関する洞察に加えて、詳細な専門家分析、患者の疫学、パイプライン分析、価格分析、規制枠組みも含まれています。

レポートの範囲と市場セグメンテーション

レポートメトリック

詳細

予測期間

2024年から2031年

基準年

2023

歴史的な年

2022 (2016~2021年にカスタマイズ可能)

定量単位

売上高(百万米ドル)、販売数量(個数)、価格(米ドル)

対象セグメント

病原体(熱帯熱マラリア原虫、三日熱マラリア原虫、卵形マラリア原虫、マラリア原虫、ノウルシ原虫)、タイプ(投薬、予防接種、その他)、治療タイプ(抑制治療、根治治療)、薬剤タイプ(ジェネリック、ブランド)、投与経路(経口、非経口)、エンドユーザー(病院、専門クリニック、在宅医療、その他)、流通チャネル(直接入札、病院薬局、小売薬局、オンライン薬局、その他)

対象国

ナイジェリア、コンゴ民主共和国、ウガンダ、ニジェール、コートジボワール、ケニア、南アフリカ、エジプト、その他のアフリカ諸国

対象となる市場プレーヤー

Hikma Pharmaceuticals PLC (英国)、Sun Pharmaceutical Industries Ltd. (インド)、Zydus Cadila (インド)、Cipla Inc. (インド)、GlaxoSmithKline plc. (英国)、Bliss GVS Pharma Ltd. (インド)、MMV (スイス)、Novartis AG (スイス)、Taj Pharmaceuticals Limited (インド)、Lupin Pharmaceuticals, Inc. (Lupin Limited の子会社) (インド)、AJANTA PHARMA (インド)、Strides Pharma Science Limited (インド)、sanofi-aventis US LLC (Sanofi の子会社) (フランス)、Viatris Inc. (米国)

市場機会

  • 医薬品開発におけるイノベーション
  • 官民連携の拡大

市場の定義

マラリア治療には、蚊に刺されて感染するマラリア原虫種によって引き起こされる寄生虫感染症と闘うための多面的なアプローチが含まれます。主な目標は、血流から寄生虫を排除し、合併症を防ぐことです。通常、抗マラリア薬は寄生虫の種類と感染の重症度に基づいて使用されます。アルテミシニンベースの併用療法 (ACT) は、寄生虫のライフサイクルを標的とする有効性のため、第一線で使用されることが多い薬です。薬剤耐性パターンに応じて、クロロキン、キニーネ、アトバコンプログアニルなどの他の薬が使用される場合があります。             

アフリカのマラリア治療市場の動向

ドライバー

  • 技術の進歩の高まり

診断ツールの改善や革新的な治療アプローチなどの技術の進歩が、マラリア治療の進歩を促進しています。迅速診断検査 (RDT)、ポイントオブケアデバイス、モバイルヘルスソリューションへのアクセスは、マラリアの診断と管理に革命をもたらす可能性があります。

  • 医療インフラの改善

特に医療サービスが行き届いていない農村地域における医療インフラの強化は、質の高い医療サービスへのアクセスを向上させる機会となります。診療所の建設、医療従事者のトレーニング、必須の医療用品の確保は、マラリア治療の結果に大きな影響を与える可能性があります。

機会

  • 医薬品開発におけるイノベーション

製薬会社や研究者には、より効果的な新しい抗マラリア薬を開発するチャンスがあります。研究開発に投資することで、薬剤耐性菌株に対抗し、副作用の少ない新しい化合物の発見につながり、マラリア治療に革命を起こす可能性があります。

  • 官民パートナーシップの拡大

政府、非政府組織、慈善財団、民間企業間の協力は、リソースと専門知識を共有する機会を提供します。官民パートナーシップは、研究、インフラ開発、医薬品や蚊の駆除対策の配布への資金提供を促進することができます。

拘束

  • 規制承認とコンプライアンス

アフリカ諸国の規制当局は、医薬品の承認と登録を担当し、医薬品が安全性と有効性の基準を満たしていることを確認します。しかし、国によって規制の枠組みが異なるため、複数の市場に同時に新薬を導入しようとする製薬会社にとって障害となる可能性があります。承認の遅れは、潜在的に有益な医薬品の入手可能性に影響を与えます。

  • 薬剤耐性

マラリア原虫の薬剤耐性株の出現は大きな障害となっている。クロロキンやスルファドキシン-ピリメタミンなど、一般的に使用されている抗マラリア薬に対する耐性は治療を複雑にし、より高価で複雑な治療法の導入を必要としている。

チャレンジ

  • 診断の限界

マラリアの正確かつタイムリーな診断は、効果的な治療に不可欠です。しかし、特に遠隔地では、信頼できる診断ツールへのアクセスが課題となっています。迅速診断テスト (RDT) は必ずしも容易に入手できるわけではなく、手頃な価格で入手できるわけでもないため、誤診や治療の遅れにつながります。

このマラリア治療市場レポートは、最近の新しい開発、貿易規制、輸出入分析、生産分析、バリュー チェーンの最適化、市場シェア、国内および現地の市場プレーヤーの影響、新たな収益源の観点から見た機会の分析、市場規制の変更、戦略的市場成長分析、市場規模、カテゴリ市場の成長、アプリケーションのニッチと優位性、製品の承認、製品の発売、地理的拡張、市場における技術革新の詳細を提供します。マラリア治療市場に関する詳細情報を取得するには、アナリスト ブリーフについて Data Bridge Market Research にお問い合わせください。当社のチームが、情報に基づいた市場決定を行い、市場の成長を達成できるようお手伝いします。

最近の動向

  • 2018年2月、シプラ社は世界保健機関(WHO)の事前認定プログラムから、100mgの直腸アルテスネート坐剤(RAS)の承認を確認しました。これは重症マラリアの事前紹介管理用です。これにより、同社の市場成長が促進されました。
  • 2018年7月、ルピン・ファーマシューティカルズ社は、ヒドロキシクロロキン硫酸塩錠が米国食品医薬品局から承認されたと発表しました。この承認により、特に長期的には同社の成長軌道が加速し、市場での地位が強化されると期待されています。

アフリカのマラリア治療市場の範囲

アフリカのマラリア治療市場は、薬剤、タイプ、治療、薬剤タイプ、投与経路、エンドユーザー、流通チャネルに基づいて、7 つの主要なセグメントに分類されています。

エージェント

  • 熱帯熱マラリア原虫
  • 三日熱マラリア原虫
  • P.オバレ
  • P.マラリア
  • P.ノウルシ。

タイプ                                                                     

  • 予防接種
  • その他

処理

  • 抑制治療
  • 根治的治療

薬剤の種類

  • ブランド
  • ジェネリック

投与経路

  • オーラル
  • 非経口

エンドユーザー

  • 病院
  • 専門クリニック
  • 在宅医療
  • その他

流通チャネル

  • 直接入札
  • 病院薬局
  • 小売薬局
  • オンライン薬局
  • その他

マラリア治療市場の国別分析/洞察

アフリカのマラリア治療市場は、薬剤、タイプ、治療、薬剤タイプ、投与経路、エンドユーザー、流通チャネルに基づいて、7 つの主要なセグメントに分類されています。

市場レポートで取り上げられている国は、ナイジェリア、コンゴ民主共和国、ウガンダ、コスタリカ、ニジェール、ケニア、エジプト、南アフリカ、およびその他のアフリカ諸国です。

ナイジェリアは、患者数の急増と技術の進歩により、最も有望な成長を遂げて優位に立つと予想されています。

レポートの国別セクションでは、市場の現在および将来の傾向に影響を与える国内市場における個別の市場影響要因と規制の変更も提供しています。新規販売、交換販売、国の人口統計、規制行為、輸出入関税などのデータ ポイントは、各国の市場シナリオを予測するために使用される主要な指標の一部です。また、アフリカのブランドの存在と可用性、地元および国内ブランドとの競争が激しいか少ないために直面​​する課題、販売チャネルの影響を考慮しながら、国別データの予測分析を提供します。   

競争環境とアフリカのマラリア治療市場シェア分析

アフリカのマラリア治療市場の競争状況は、競合他社の詳細を提供します。含まれる詳細には、会社概要、会社の財務状況、収益、市場の可能性、研究開発への投資、新しい市場への取り組み、生産拠点と施設、会社の強みと弱み、製品の発売、製品試験パイプライン、製品の承認、特許、製品の幅と広さ、アプリケーションの優位性、技術ライフライン曲線などがあります。提供されている上記のデータ ポイントは、アフリカのマラリア治療市場に関連する会社の焦点にのみ関連しています。

アフリカのマラリア治療市場で活動している主要企業は次のとおりです。

  • ヒクマ・ファーマシューティカルズPLC(英国)
  • サン・ファーマシューティカル・インダストリーズ(インド)
  • ジダス・カディラ(インド)
  • シプラ社(インド)
  • グラクソ・スミスクライン社(英国)
  • ブリスGVSファーマ株式会社(インド)
  • MMV(スイス)
  • ノバルティスAG(スイス)
  • タージ・ファーマシューティカルズ・リミテッド(インド)
  • ルピンファーマシューティカルズ社(ルピンリミテッドの子会社)(インド)
  • アジャンタファーマ(インド)
  • ストライド・ファーマ・サイエンス・リミテッド(インド)
  • サノフィ・アベンティスUS LLC(サノフィの子会社)(フランス)
  • ビアトリス社(米国)


SKU-

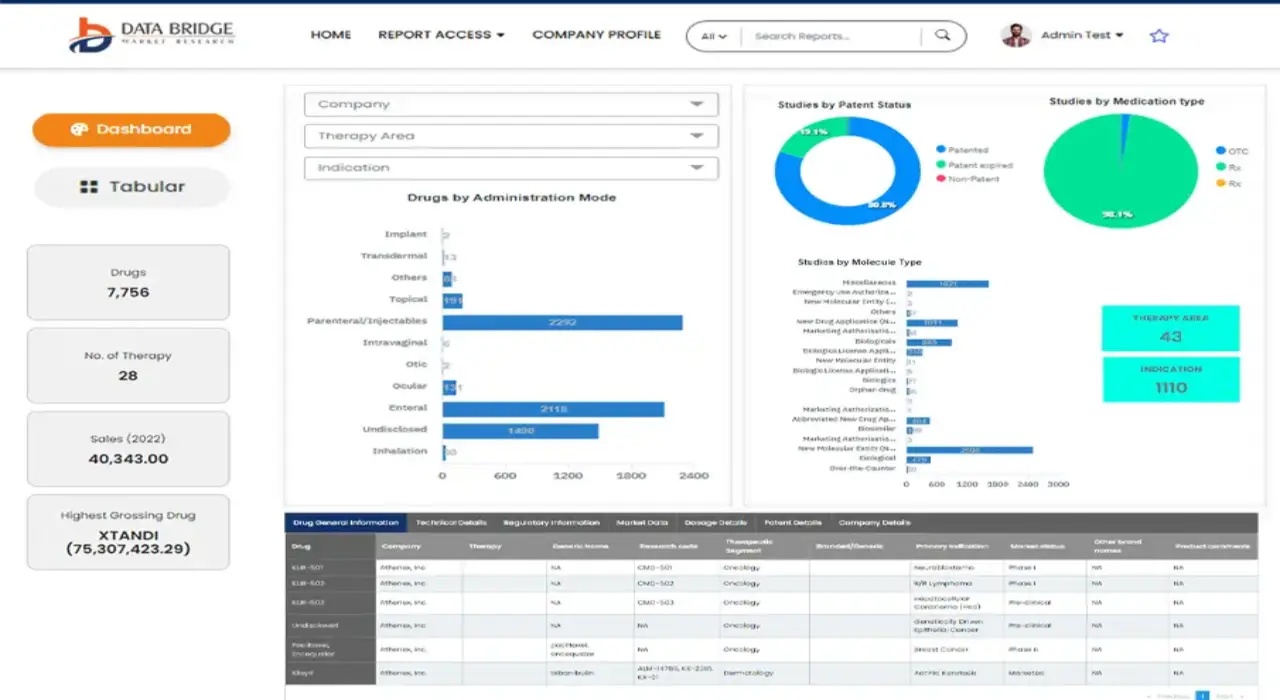
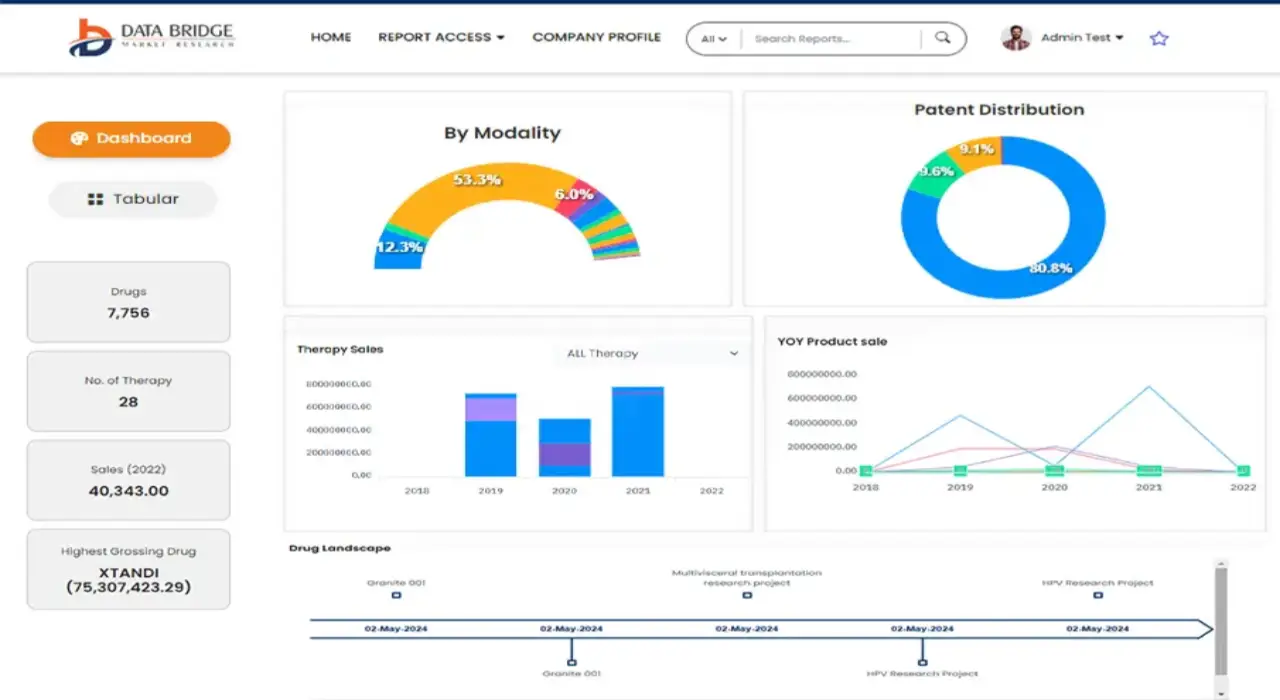
世界初のマーケットインテリジェンスクラウドに関するレポートにオンラインでアクセスする

  • インタラクティブなデータ分析ダッシュボード
  • 成長の可能性が高い機会のための企業分析ダッシュボード
  • カスタマイズとクエリのためのリサーチアナリストアクセス
  • インタラクティブなダッシュボードによる競合分析
  • 最新ニュース、更新情報、トレンド分析
  • 包括的な競合追跡のためのベンチマーク分析のパワーを活用
デモのリクエスト

目次

  1. introduction
    1. OBJECTIVES OF THE STUDY
    2. MARKET DEFINITION
    3. OVERVIEW of AFRICA MALARIA TREATMENT MARKET
    4. LIMITATIONs
    5. MARKETS COVERED
  2. MARKET SEGMENTATION
    1. MARKETS COVERED
    2. geographical scope
    3. years considered for the study
    4. currency and pricing
    5. DBMR TRIPOD DATA VALIDATION MODEL
    6. MULTIVARIATE MODELLING
    7. PRODUCT type LIFELINE CURVE
    8. primary interviews with key opinion leaders
    9. DBMR MARKET POSITION GRID
    10. market end user coverage grid
    11. vendor share analysis
    12. secondary sourcEs
    13. assumptions
  3. EXECUTIVE SUMMARY
  4. premium insights
  5. AFRICA MALARIA TREATMENT MARKET: REGULATIONS
  6. Summary write-up (Africa)
  7. Pipeline analysis
  8. Market Overview
    1. Drivers
      1. High prevalence and disease burden of malaria in Africa
      2. Rise in medical insurance
      3. Humid climatic conditions and rising number of mosquitoES (Anopheles gambiae complex) in certain parts of Africa
    2. Restraints
      1. Adverse effects and risks associated with antimalariaL drugs
      2. Lack of awareness related to symptoms of malaria
      3. Low economic growth, underdeveloped healthcare infrastructure, and lack of access to advanced treatment
    3. OpportunitIES
      1. strategic initiatives by major players
      2. increasing launch of new products
      3. Increase in production and export as well as import of hydroxychloroquine and chloroquine
    4. Challenges
      1. Regulatory challenges to antimalarial drug approval
      2. Achieving universal access
  9. COVID-19 IMPACT ON THE AFRICA MALARIA TREATMENT MARKET
    1. PRICE IMPACT
    2. IMPACT ON SUPPLY CHAIN
    3. IMPACT ON DEMAND
    4. STRATEGIC DECISIONS FOR MANUFACTURERS
    5. CONCLUSION
  10. africa malaria treatment MARKET, By agent
    1. overview
    2. Plasmodium Falciparum
    3. P. Vivax
    4. P. Ovale
    5. P. Malariae
    6. P. Knowlelsi
  11. AFRICA MALARIA TREATMENT MARKET, By type
    1. overview
    2. medication
      1. Chloroquine
      2. Primaquine
      3. Artemisinin-Based Combination Therapy (ACT)
        1. ARTEMETHER–LUMEFANTRINE
        2. ARTESUNATE-AMODIAQUINE
        3. DIHYDROARTEMISININ-PIPERAQUINE
        4. OTHERS
      4. Quinine
      5. Hydroxychloroquine
      6. Mefloquine
      7. Non-Artemisinin Based Combinations (Non-ACTs)
        1. SULFADOXINE-PYRIMETHAMINE WITH CHLOROQUINE
        2. SULFADOXINE-PYRIMETHAMINE WITH AMODIAQUINE
        3. OTHERS
      8. Others
    3. vaccination
      1. Rts,S/As01
      2. Pfspz
      3. Others
  12. AFRICA MALARIA TREATMENT MARKET, By treatment type
    1. overview
    2. Suppressive Treatment
    3. Radical Treatment
  13. AFRICA MALARIA TREATMENT MARKET, By Drug Type
    1. overview
    2. generics
    3. branded
      1. Artefan
      2. Coartem
      3. Riamet
      4. Malarone
      5. Eurartesim
      6. Lonart
      7. Others
  14. AFRICA MALARIA TREATMENT MARKET, By route of administration
    1. overview
    2. oral
    3. Parenteral
      1. Intravenous
      2. Intramuscular
      3. Subcutaneous
  15. AFRICA MALARIA TREATMENT MARKET, By end user
    1. overview
    2. hospitals
    3. Specialty Clinics
    4. Home Healthcare
    5. others
  16. AFRICA MALARIA TREATMENT MARKET, By distribution channel
    1. overview
    2. direct tender
    3. Hospital Pharmacies
    4. Retail Pharmacies
    5. Online Pharmacies
    6. Others
  17. Africa malaria treatment market, BY Country
    1. NIGERIA
    2. DEMOCRATIC REPUBLIC OF THE CONGO
    3. UGANDA
    4. NIGER
    5. CÔTE D’IVOIRE
    6. KENYA
    7. SOUTH AFRICA
    8. EGYPT
    9. REST OF AFRICA
  18. Africa MALARIA TREATMENT Market: COMPANY landscape
    1. company share analysis: Africa
  19. swot analysis
  20. company profile
    1. Novartis AG
      1. COMPANY SNAPSHOT
      2. REVENUE ANALYSIS
      3. company share analysis
      4. PRODUCT PORTFOLIO
      5. RECENT DEVELOPMENTS
    2. cipla inc.
      1. COMPANY SNAPSHOT
      2. Revenue analysis
      3. company share analysis
      4. product portfolio
      5. RECENT DEVELOPMENTS
    3. Strides Pharma Science Limited
      1. COMPANY SNAPSHOT
      2. REVENUE ANALYSIS
      3. company share analysis
      4. PRODUCT PORTFOLIO
      5. RECENT DEVELOPMENT
    4. Hikma Pharmaceuticals PLC
      1. COMPANY SNAPSHOT
      2. revenue analysis
      3. company share analysis
      4. PRODUCT PORTFOLIO
      5. Recent development
    5. Sun Pharmaceutical Industries Ltd.
      1. COMPANY SNAPSHOT
      2. Revenue analysis
      3. company share analysis
      4. PRODUCT PORTFOLIO
      5. RECENT DEVELOPMENT
    6. AJANTA PHARMA.
      1. COMPANY SNAPSHOT
      2. REVENUE ANALYSIS
      3. company share analysis
      4. PRODUCT PORTFOLIO
      5. RECENT DEVELOPMENT
    7. Bliss GVS Pharma Ltd.
      1. COMPANY SNAPSHOT
      2. REVENUE ANALYSIS
      3. company share analysis
      4. PRODUCT PORTFOLIO
      5. RECENT DEVELOPMENT
    8. GlaxoSmithKline plc.
      1. COMPANY SNAPSHOT
      2. REVENUE ANALYSIS
      3. company share analysis
      4. PRODUCT PORTFOLIO
      5. RECENT DEVELOPMENT
    9. Lupin Pharmaceuticals, Inc.
      1. COMPANY SNAPSHOT
      2. REVENUE ANALYSIS
      3. company share analysis
      4. PRODUCT PORTFOLIO
      5. RECENT DEVELOPMENT
    10. MMV
      1. COMPANY SNAPSHOT
      2. REVENUE ANALYSIS
      3. PRODUCT PORTFOLIO
      4. RECENT DEVELOPMENT
    11. sanofi-aventis U.S. LLC.
      1. COMPANY SNAPSHOT
      2. REVENUE ANALYSIS
      3. company share analysis
      4. PRODUCT PORTFOLIO
      5. RECENT DEVELOPMENT
    12. Taj Pharmaceuticals Limited
      1. COMPANY SNAPSHOT
      2. company share analysis
      3. PRODUCT PORTFOLIO
      4. RECENT DEVELOPMENT
    13. Viatris Inc.
      1. COMPANY SNAPSHOT
      2. Revenue analysis
      3. company share analysis
      4. PRODUCT PORTFOLIO
      5. RECENT DEVELOPMENT
    14. Zydus Cadila
      1. COMPANY SNAPSHOT
      2. revenue analysis
      3. company share analysis
      4. PRODUCT PORTFOLIO
      5. Recent development
  21. questionnaire
  22. related reports

表のリスト

TABLE 1 Africa malaria treatment Market, pipeline analysis

TABLE 2 ESTIMATED Malaria Cases and Deaths, by Region, 2018

TABLE 3 Regulatory Challenges to Antimalarial Drug Approval.

TABLE 4 Challenges and problems that drive the R&D framework

TABLE 5 AFRICA MALARIA TREATMENT MARKET, By Agent, 2019-2028 (USD thousand)

TABLE 6 Africa Malaria Treatment Market, By Type, 2019-2028 (USD Thousand)

TABLE 7 Africa Medication in Malaria Treatment Market, By Type, 2019-2028 (USD Thousand)

TABLE 8 Africa Artemisinin-Based Combination Therapy (ACT) Medication in Malaria Treatment Market, By Type, 2019-2028 (USD Thousand)

TABLE 9 Africa Non-Artemisinin Based Combinations (Non-ACTs) Medication in Malaria Treatment Market, By Type, 2019-2028 (USD Thousand)

TABLE 10 Africa Vaccination in Malaria Treatment Market, By Type, 2019-2028 (USD Thousand)

TABLE 11 Africa Malaria Treatment Market, By Treatment Type, 2019-2028 (USD Thousand)

TABLE 12 Africa Malaria Treatment Market, By Drug Type, 2019-2028 (USD Thousand)

TABLE 13 Africa Branded in Malaria Treatment Market, By Drug Type, 2019-2028 (USD Thousand)

TABLE 14 Africa Malaria Treatment Market, By Route of Administration, 2019-2028 (USD Thousand)

TABLE 15 Africa Parenteral in Malaria Treatment Market, By Route of Administration, 2019-2028 (USD Thousand)

TABLE 16 Africa Malaria Treatment Market, By End User, 2019-2028 (USD Thousand)

TABLE 17 Africa Malaria Treatment Market, By Distribution Channel, 2019-2028 (USD Thousand)

TABLE 18 Africa Malaria treatment Market, By country, 2019-2028 (USD Thousand)

TABLE 19 Nigeria Malaria Treatment Market, By Agent, 2019-2028 (USD Thousand)

TABLE 20 Nigeria Malaria Treatment Market, By Type, 2019-2028 (USD Thousand)

TABLE 21 Nigeria Medication in Malaria Treatment Market, By Type, 2019-2028 (USD Thousand)

TABLE 22 Nigeria Artemisinin-Based Combination Therapy (ACT) Medication in Malaria Treatment Market, By Type, 2019-2028 (USD Thousand)

TABLE 23 Nigeria Non-Artemisinin Based Combinations (Non-ACTs) Medication in Malaria Treatment Market, By Type, 2019-2028 (USD Thousand)

TABLE 24 Nigeria Vaccination in Malaria Treatment Market, By Type, 2019-2028 (USD Thousand)

TABLE 25 Nigeria Malaria Treatment Market, By Treatment Type, 2019-2028 (USD Thousand)

TABLE 26 Nigeria Malaria Treatment Market, By Drug Type, 2019-2028 (USD Thousand)

TABLE 27 Nigeria Branded in Malaria Treatment Market, By Drug Type, 2019-2028 (USD Thousand)

TABLE 28 Nigeria Malaria Treatment Market, By Route of Administration, 2019-2028 (USD Thousand)

TABLE 29 Nigeria Parenteral in Malaria Treatment Market, By Route of Administration, 2019-2028 (USD Thousand)

TABLE 30 Nigeria Malaria Treatment Market, By End User 2019-2028 (USD Thousand)

TABLE 31 Nigeria Malaria Treatment Market, By Distribution Channel, 2019-2028 (USD Thousand)

TABLE 32 Democratic Republic of the Congo Malaria Treatment Market, By Agent, 2019-2028 (USD Thousand)

TABLE 33 Democratic Republic of the Congo Malaria Treatment Market, By Type, 2019-2028 (USD Thousand)

TABLE 34 Democratic Republic of the Congo Medication in Malaria Treatment Market, By Type, 2019-2028 (USD Thousand)

TABLE 35 Democratic Republic of the Congo Artemisinin-Based Combination Therapy (ACT) Medication in Malaria Treatment Market, By Type, 2019-2028 (USD Thousand)

TABLE 36 Democratic Republic of the Congo Non-Artemisinin Based Combinations (Non-ACTs) Medication in Malaria Treatment Market, By Type, 2019-2028 (USD Thousand)

TABLE 37 Democratic Republic of the Congo Vaccination in Malaria Treatment Market, By Type, 2019-2028 (USD Thousand)

TABLE 38 Democratic Republic of the Congo Malaria Treatment Market, By Treatment Type, 2019-2028 (USD Thousand)

TABLE 39 Democratic Republic of the Congo Malaria Treatment Market, By Drug Type, 2019-2028 (USD Thousand)

TABLE 40 Democratic Republic of the Congo Branded in Malaria Treatment Market, By Drug Type, 2019-2028 (USD Thousand)

TABLE 41 Democratic Republic of the Congo Malaria Treatment Market, By Route of Administration, 2019-2028 (USD Thousand)

TABLE 42 Democratic Republic of the Congo Parenteral in Malaria Treatment Market, By Route of Administration, 2019-2028 (USD Thousand)

TABLE 43 Democratic Republic of the Congo Malaria Treatment Market, By End User, 2019-2028 (USD Thousand)

TABLE 44 Democratic Republic of the Congo Malaria Treatment Market, By Distribution Channel, 2019-2028 (USD Thousand)

TABLE 45 Uganda Malaria Treatment Market, By Agent, 2019-2028 (USD Thousand)

TABLE 46 Uganda Malaria Treatment Market, By Type, 2019-2028 (USD Thousand)

TABLE 47 Uganda Medication in Malaria Treatment Market, By Type, 2019-2028 (USD Thousand)

TABLE 48 Uganda Artemisinin-Based Combination Therapy (ACT) Medication in Malaria Treatment Market, By Type, 2019-2028 (USD Thousand)

TABLE 49 Uganda Non-Artemisinin Based Combinations (Non-ACTs) Medication in Malaria Treatment Market, By Type, 2019-2028 (USD Thousand)

TABLE 50 Uganda Vaccination in Malaria Treatment Market, By Type, 2019-2028 (USD Thousand)

TABLE 51 Uganda Malaria Treatment Market, By Treatment Type, 2019-2028 (USD Thousand)

TABLE 52 Uganda Malaria Treatment Market, By Drug Type, 2019-2028 (USD Thousand)

TABLE 53 Uganda Branded in Malaria Treatment Market, By Drug Type, 2019-2028 (USD Thousand)

TABLE 54 Uganda Malaria Treatment Market, By Route of Administration, 2019-2028 (USD Thousand)

TABLE 55 Uganda Parenteral in Malaria Treatment Market, By Route of Administration, 2019-2028 (USD Thousand)

TABLE 56 Uganda Malaria Treatment Market, By End User 2019-2028 (USD Thousand)

TABLE 57 Uganda Malaria Treatment Market, By Distribution Channel, 2019-2028 (USD Thousand)

TABLE 58 Niger Malaria Treatment Market, By Agent, 2019-2028 (USD Thousand)

TABLE 59 Niger Malaria Treatment Market, By Type, 2019-2028 (USD Thousand)

TABLE 60 Niger Medication in Malaria Treatment Market, By Type, 2019-2028 (USD Thousand)

TABLE 61 Niger Artemisinin-Based Combination Therapy (ACT) Medication in Malaria Treatment Market, By Type, 2019-2028 (USD Thousand)

TABLE 62 Niger Non-Artemisinin Based Combinations (Non-ACTs) Medication in Malaria Treatment Market, By Type, 2019-2028 (USD Thousand)

TABLE 63 Niger Vaccination in Malaria Treatment Market, By Type, 2019-2028 (USD Thousand)

TABLE 64 Niger Malaria Treatment Market, By Treatment Type, 2019-2028 (USD Thousand)

TABLE 65 Niger Malaria Treatment Market, By Drug Type, 2019-2028 (USD Thousand)

TABLE 66 Niger Branded in Malaria Treatment Market, By Drug Type, 2019-2028 (USD Thousand)

TABLE 67 Niger Malaria Treatment Market, By Route of Administration, 2019-2028 (USD Thousand)

TABLE 68 Niger Parenteral in Malaria Treatment Market, By Route of Administration, 2019-2028 (USD Thousand)

TABLE 69 Niger Malaria Treatment Market, By End User 2019-2028 (USD Thousand)

TABLE 70 Niger Malaria Treatment Market, By Distribution Channel, 2019-2028 (USD Thousand)

TABLE 71 Côte d’Ivoire Malaria Treatment Market, By Agent, 2019-2028 (USD Thousand)

TABLE 72 Côte d’Ivoire Malaria Treatment Market, By Type, 2019-2028 (USD Thousand)

TABLE 73 Côte d’Ivoire Medication in Malaria Treatment Market, By Type, 2019-2028 (USD Thousand)

TABLE 74 Côte d’Ivoire Artemisinin-Based Combination Therapy (ACT) Medication in Malaria Treatment Market, By Type, 2019-2028 (USD Thousand)

TABLE 75 Côte d’Ivoire Non-Artemisinin Based Combinations (Non-ACTs) Medication in Malaria Treatment Market, By Type, 2019-2028 (USD Thousand)

TABLE 76 Côte d’Ivoire Vaccination in Malaria Treatment Market, By Type, 2019-2028 (USD Thousand)

TABLE 77 Côte d’Ivoire Malaria Treatment Market, By Treatment Type, 2019-2028 (USD Thousand)

TABLE 78 Côte d’Ivoire Malaria Treatment Market, By Drug Type, 2019-2028 (USD Thousand)

TABLE 79 Côte d’Ivoire Branded in Malaria Treatment Market, By Drug Type, 2019-2028 (USD Thousand)

TABLE 80 Côte d’Ivoire Malaria Treatment Market, By Route of Administration, 2019-2028 (USD Thousand)

TABLE 81 Côte d’Ivoire Parenteral in Malaria Treatment Market, By Route of Administration, 2019-2028 (USD Thousand)

TABLE 82 Côte d’Ivoire Malaria Treatment Market, By End User 2019-2028 (USD Thousand)

TABLE 83 Côte d’Ivoire Malaria Treatment Market, By Distribution Channel, 2019-2028 (USD Thousand)

TABLE 84 Kenya Malaria Treatment Market, By Agent, 2019-2028 (USD Thousand)

TABLE 85 Kenya Malaria Treatment Market, By Type, 2019-2028 (USD Thousand)

TABLE 86 Kenya Medication in Malaria Treatment Market, By Type, 2019-2028 (USD Thousand)

TABLE 87 Kenya Artemisinin-Based Combination Therapy (ACT) Medication in Malaria Treatment Market, By Type, 2019-2028 (USD Thousand)

TABLE 88 Kenya Non-Artemisinin Based Combinations (Non-ACTs) Medication in Malaria Treatment Market, By Type, 2019-2028 (USD Thousand)

TABLE 89 Kenya Vaccination in Malaria Treatment Market, By Type, 2019-2028 (USD Thousand)

TABLE 90 Kenya Malaria Treatment Market, By Treatment Type, 2019-2028 (USD Thousand)

TABLE 91 Kenya Malaria Treatment Market, By Drug Type, 2019-2028 (USD Thousand)

TABLE 92 Kenya Branded in Malaria Treatment Market, By Drug Type, 2019-2028 (USD Thousand)

TABLE 93 Kenya Malaria Treatment Market, By Route of Administration, 2019-2028 (USD Thousand)

TABLE 94 Kenya Parenteral in Malaria Treatment Market, By Route of Administration, 2019-2028 (USD Thousand)

TABLE 95 Kenya Malaria Treatment Market, By End User 2019-2028 (USD Thousand)

TABLE 96 Kenya Malaria Treatment Market, By Distribution Channel, 2019-2028 (USD Thousand)

TABLE 97 South Africa Malaria Treatment Market, By Agent, 2019-2028 (USD Thousand)

TABLE 98 South Africa Malaria Treatment Market, By Type, 2019-2028 (USD Thousand)

TABLE 99 South Africa Medication in Malaria Treatment Market, By Type, 2019-2028 (USD Thousand)

TABLE 100 South Africa Artemisinin-Based Combination Therapy (ACT) Medication in Malaria Treatment Market, By Type, 2019-2028 (USD Thousand)

TABLE 101 South Africa Non-Artemisinin Based Combinations (Non-ACTs) Medication in Malaria Treatment Market, By Type, 2019-2028 (USD Thousand)

TABLE 102 South Africa Vaccination in Malaria Treatment Market, By Type, 2019-2028 (USD Thousand)

TABLE 103 South Africa Malaria Treatment Market, By Treatment Type, 2019-2028 (USD Thousand)

TABLE 104 South Africa Malaria Treatment Market, By Drug Type, 2019-2028 (USD Thousand)

TABLE 105 South Africa Branded in Malaria Treatment Market, By Drug Type, 2019-2028 (USD Thousand)

TABLE 106 South Africa Malaria Treatment Market, By Route of Administration, 2019-2028 (USD Thousand)

TABLE 107 South Africa Parenteral in Malaria Treatment Market, By Route of Administration, 2019-2028 (USD Thousand)

TABLE 108 South Africa Malaria Treatment Market, By End User 2019-2028 (USD Thousand)

TABLE 109 South Africa Malaria Treatment Market, By Distribution Channel, 2019-2028 (USD Thousand)

TABLE 110 Egypt Malaria Treatment Market, By Agent, 2019-2028 (USD Thousand)

TABLE 111 Egypt Malaria Treatment Market, By Type, 2019-2028 (USD Thousand)

TABLE 112 Egypt Medication in Malaria Treatment Market, By Type, 2019-2028 (USD Thousand)

TABLE 113 Egypt Artemisinin-Based Combination Therapy (ACT) Medication in Malaria Treatment Market, By Type, 2019-2028 (USD Thousand)

TABLE 114 Egypt Non-Artemisinin Based Combinations (Non-ACTs) Medication in Malaria Treatment Market, By Type, 2019-2028 (USD Thousand)

TABLE 115 Egypt Vaccination in Malaria Treatment Market, By Type, 2019-2028 (USD Thousand)

TABLE 116 Egypt Malaria Treatment Market, By Treatment Type, 2019-2028 (USD Thousand)

TABLE 117 Egypt Malaria Treatment Market, By Drug Type, 2019-2028 (USD Thousand)

TABLE 118 Egypt Branded in Malaria Treatment Market, By Drug Type, 2019-2028 (USD Thousand)

TABLE 119 Egypt Malaria Treatment Market, By Route of Administration, 2019-2028 (USD Thousand)

TABLE 120 Egypt Parenteral in Malaria Treatment Market, By Route of Administration, 2019-2028 (USD Thousand)

TABLE 121 Egypt Malaria Treatment Market, By End User 2019-2028 (USD Thousand)

TABLE 122 Egypt Malaria Treatment Market, By Distribution Channel, 2019-2028 (USD Thousand)

TABLE 123 Rest of Africa Malaria Treatment Market, By Agent, 2019-2028 (USD Thousand)

図表一覧

FIGURE 1 Africa malaria treatment MARKET: segmentation

FIGURE 2 AFRICA MALARIA TREATMENT MARKET: data triangulation

FIGURE 3 AFRICA MALARIA TREATMENT MARKET: DROC ANALYSIS

FIGURE 4 AFRICA MALARIA TREATMENT MARKET: REGIONAL vs COUNTRY MARKET ANALYSIS

FIGURE 5 AFRICA MALARIA TREATMENT MARKET: COMPANY RESEARCH ANALYSIS

FIGURE 6 AFRICA MALARIA TREATMENT MARKET: INTERVIEW DEMOGRAPHICS

FIGURE 7 AFRICA MALARIA TREATMENT MARKET: DBMR MARKET POSITION GRID

FIGURE 8 AFRICA MALARIA TREATMENT MARKET: MARKET end user COVERAGE GRID

FIGURE 9 AFRICA MALARIA TREATMENT MARKET: vendor share analysis

FIGURE 10 AFRICA MALARIA TREATMENT MARKET: SEGMENTATION

FIGURE 11 increasing prevalence of MALARIA, RISING MEDICAL HEALTHCARE INSURANCE, AND humid climatic conditions in africa are expected to drive THE AFRICA MALARIA TREATMENT MARKET IN THE FORECAST PERIOD of 2021 to 2028

FIGURE 12 Plasmodium Falciparum segment is expected to account for the largest share of the AFRICA MALARIA TREATMENT MARKET in 2021 and 2028

FIGURE 13 DRIVERS, RESTRAINTS, OPPORTUNITIES, AND CHALLENGES OF AFRICA MALARIA TREATMENT MARKET

FIGURE 14 Malaria Cases in 10 highest-burden countries in Africa, 2010-2017

FIGURE 15 AFRICA MALARIA TREATMENT MARKET: By AGENT, 2020

FIGURE 16 AFRICA MALARIA TREATMENT MARKET: By AGENT, 2019-2028 (USD thousand)

FIGURE 17 AFRICA MALARIA TREATMENT MARKET: By AGENT, CAGR (2021-2028)

FIGURE 18 AFRICA MALARIA TREATMENT MARKET: By AGENT, LIFELINE CURVE

FIGURE 19 AFRICA MALARIA TREATMENT MARKET: By type, 2020

FIGURE 20 AFRICA MALARIA TREATMENT MARKET: By type, 2019-2028 (USD thousand)

FIGURE 21 AFRICA MALARIA TREATMENT MARKET: By type, CAGR (2021-2028)

FIGURE 22 AFRICA MALARIA TREATMENT MARKET: By type, LIFELINE CURVE

FIGURE 23 AFRICA MALARIA TREATMENT MARKET: TREATMENT TYPE, 2020

FIGURE 24 AFRICA MALARIA TREATMENT MARKET: TREATMENT TYPE, 2019-2028 (USD thousand)

FIGURE 25 AFRICA MALARIA TREATMENT MARKET: TREATMENT TYPE, CAGR (2021-2028)

FIGURE 26 AFRICA MALARIA TREATMENT MARKET: TREATMENT TYPE, LIFELINE CURVE

FIGURE 27 AFRICA MALARIA TREATMENT MARKET: By drug type, 2020

FIGURE 28 AFRICA MALARIA TREATMENT MARKET: By drug type, 2019-2028 (USD thousand)

FIGURE 29 AFRICA MALARIA TREATMENT MARKET: By drug type, CAGR (2021-2028)

FIGURE 30 AFRICA MALARIA TREATMENT MARKET: By drug type, LIFELINE CURVE

FIGURE 31 AFRICA MALARIA TREATMENT MARKET: By route of administration, 2020

FIGURE 32 AFRICA MALARIA TREATMENT MARKET: By route of administration, 2019-2028 (USD thousand)

FIGURE 33 AFRICA MALARIA TREATMENT MARKET: By route of administration, CAGR (2021-2028)

FIGURE 34 AFRICA MALARIA TREATMENT MARKET: By route of administration, LIFELINE CURVE

FIGURE 35 AFRICA MALARIA TREATMENT MARKET: By end user, 2020

FIGURE 36 AFRICA MALARIA TREATMENT MARKET: By end user, 2019-2028 (USD thousand)

FIGURE 37 AFRICA MALARIA TREATMENT MARKET: By end user, CAGR (2021-2028)

FIGURE 38 AFRICA MALARIA TREATMENT MARKET: By end user, LIFELINE CURVE

FIGURE 39 AFRICA MALARIA TREATMENT MARKET: By DISTRIBUTION CHANNEL, 2020

FIGURE 40 AFRICA MALARIA TREATMENT MARKET: By DISTRIBUTION CHANNEL, 2019-2028 (USD thousand)

FIGURE 41 AFRICA MALARIA TREATMENT MARKET: By DISTRIBUTION CHANNEL, CAGR (2021-2028)

FIGURE 42 AFRICA MALARIA TREATMENT MARKET: By DISTRIBUTION CHANNEL, LIFELINE CURVE

FIGURE 43 Africa Malaria treatment MARKET: SNAPSHOT (2020)

FIGURE 44 Africa Malaria treatment MARKET: BY COUNTRY (2020)

FIGURE 45 Africa Malaria treatment MARKET: BY COUNTRY (2021 & 2028)

FIGURE 46 Africa Malaria treatment MARKET: BY COUNTRY (2020 & 2028)

FIGURE 47 Africa Malaria treatment MARKET: BY Agent (2021-2028)

FIGURE 48 Africa MALARIA TREATMENT Market: company share 2020 (%)

詳細情報を見る Right Arrow

調査方法

データ収集と基準年分析は、大規模なサンプル サイズのデータ​​収集モジュールを使用して行われます。この段階では、さまざまなソースと戦略を通じて市場情報または関連データを取得します。過去に取得したすべてのデータを事前に調査および計画することも含まれます。また、さまざまな情報ソース間で見られる情報の不一致の調査も含まれます。市場データは、市場統計モデルと一貫性モデルを使用して分析および推定されます。また、市場シェア分析と主要トレンド分析は、市場レポートの主要な成功要因です。詳細については、アナリストへの電話をリクエストするか、お問い合わせをドロップダウンしてください。

DBMR 調査チームが使用する主要な調査方法は、データ マイニング、データ変数が市場に与える影響の分析、および一次 (業界の専門家) 検証を含むデータ三角測量です。データ モデルには、ベンダー ポジショニング グリッド、市場タイムライン分析、市場概要とガイド、企業ポジショニング グリッド、特許分析、価格分析、企業市場シェア分析、測定基準、グローバルと地域、ベンダー シェア分析が含まれます。調査方法について詳しくは、お問い合わせフォームから当社の業界専門家にご相談ください。

カスタマイズ可能

Data Bridge Market Research は、高度な形成的調査のリーダーです。当社は、既存および新規のお客様に、お客様の目標に合致し、それに適したデータと分析を提供することに誇りを持っています。レポートは、対象ブランドの価格動向分析、追加国の市場理解 (国のリストをお問い合わせください)、臨床試験結果データ、文献レビュー、リファービッシュ市場および製品ベース分析を含めるようにカスタマイズできます。対象競合他社の市場分析は、技術ベースの分析から市場ポートフォリオ戦略まで分析できます。必要な競合他社のデータを、必要な形式とデータ スタイルでいくつでも追加できます。当社のアナリスト チームは、粗い生の Excel ファイル ピボット テーブル (ファクト ブック) でデータを提供したり、レポートで利用可能なデータ セットからプレゼンテーションを作成するお手伝いをしたりすることもできます。

Frequently Asked Questions

The Africa Malaria Treatment Market size will be worth USD 64.78 million by 2031 during the forecast period.
The Africa Malaria Treatment Market growth rate is 6.4% during the forecast period.
Improved healthcare infrastructure and Rising technological advancements are the growth drivers of the Africa Malaria Treatment Market.
The agent, type, treatment, drug type, route of administration, end user and distribution channel are the factors on which the Africa Malaria Treatment Market research is based.
The major companies in the Africa Malaria Treatment Market are Hikma Pharmaceuticals PLC (U.K.), Sun Pharmaceutical Industries Ltd. (India), Zydus Cadila (India), Cipla Inc. (India), GlaxoSmithKline plc. (U.K.), Bliss GVS Pharma Ltd. (India), MMV (Switzerland), Novartis AG (Awitzerland), Taj Pharmaceuticals Limited (India), Lupin Pharmaceuticals, Inc. (A Subsidiary of Lupin Limited) (India), AJANTA PHARMA (India), Strides Pharma Science Limited (India), sanofi-aventis U.S. LLC (A Subsidiary of Sanofi) (France), Viatris Inc. (U.S.).