

Marché des logiciels de trésorerie en Amérique latine, par système d'exploitation (Windows, Linux, Mac, Android et iOS), application ( gestion des liquidités et de la trésorerie , gestion des investissements, gestion de la dette , gestion des risques financiers, gestion de la conformité , gestion de la planification fiscale et autres), taille de l'organisation (grandes entreprises, petites entreprises et moyennes entreprises), modèle de déploiement (cloud et sur site), secteurs verticaux (bancaires, services financiers et assurances (BFSI), gouvernement, fabrication, soins de santé, biens de consommation, produits chimiques, énergie et autres), pays (Argentine, Paraguay, Chili, Pérou, Colombie et reste de l'Amérique latine), tendances de l'industrie et prévisions jusqu'en 2029.
Analyse et perspectives du marché des logiciels de trésorerie en Amérique latine
Un système de gestion de trésorerie (TMS) est une application logicielle qui automatise le processus de gestion des opérations financières d'un individu ou d'une entreprise. Il permet de gérer automatiquement les activités financières, telles que les flux de trésorerie, les actifs et les investissements. Ses fonctions sont la gestion de trésorerie en temps réel, la prévision des flux de trésorerie, le rapprochement des paiements, la gestion de la dette et le financement du commerce. Un logiciel de gestion de trésorerie permet d'automatiser les processus de trésorerie répétitifs, souvent manuels. En automatisant ces étapes, les directeurs financiers et les trésoriers d'une entreprise peuvent obtenir une meilleure visibilité sur la trésorerie et les liquidités tout en prenant le contrôle des comptes bancaires, en maintenant la conformité et en gérant les transactions bancaires et financières internes.
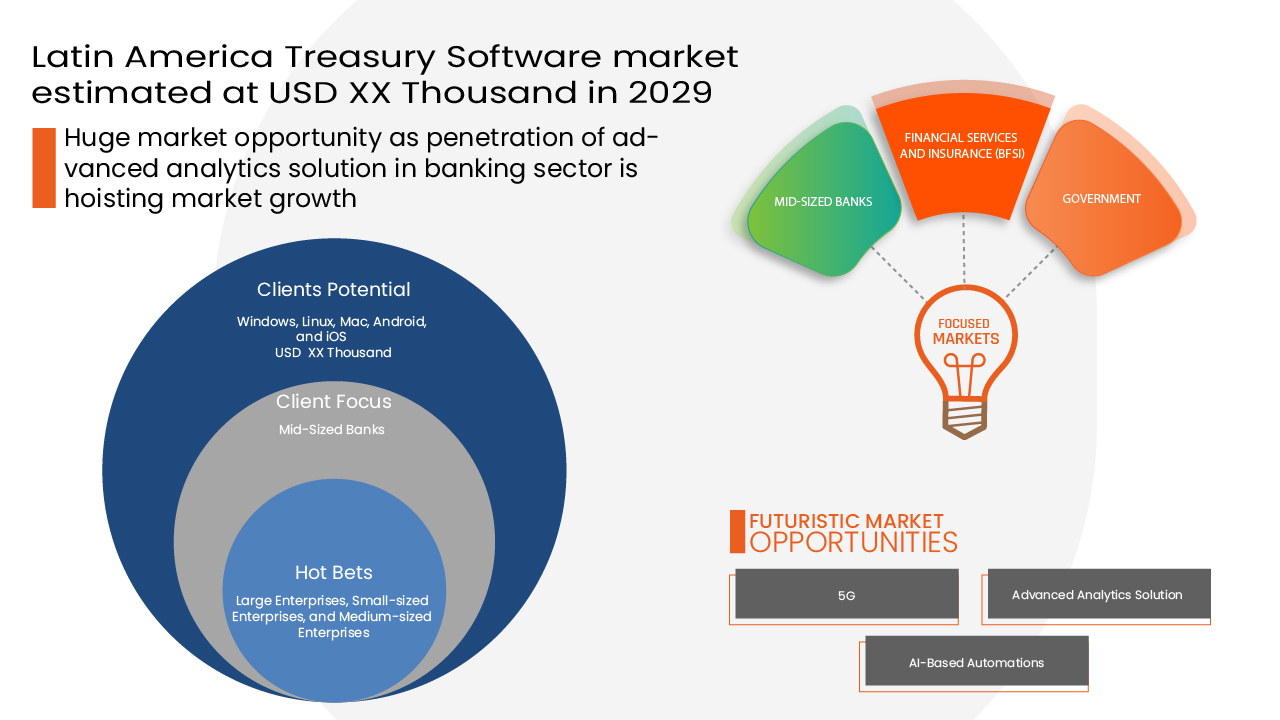
Le logiciel de trésorerie est essentiel car il est devenu une nécessité pour des secteurs tels que les banques et la finance, ainsi que pour le département d'analyse des risques. Data Bridge Market Research analyse que le marché des logiciels de trésorerie en Amérique latine connaîtra une croissance de 2,35 % au cours de la période de prévision de 2022 à 2029.
|
Rapport métrique |
Détails |
|
Période de prévision |
2022 à 2029 |
|
Année de base |
2021 |
|
Années historiques |
2020 (personnalisable de 2019 à 2014) |
|
Unités quantitatives |
Chiffre d'affaires en milliers de dollars américains, volumes en unités, prix en dollars américains |
|
Segments couverts |
Système d'exploitation (Windows, Linux, Mac, Android et iOS), application (gestion des liquidités et de la trésorerie , gestion des investissements, gestion de la dette , gestion des risques financiers, gestion de la conformité , gestion de la planification fiscale et autres), taille de l'organisation (grandes entreprises, petites entreprises et moyennes entreprises), modèle de déploiement (cloud et sur site), secteurs verticaux (bancaires, services financiers et assurances (BFSI), gouvernement, fabrication, soins de santé, biens de consommation, produits chimiques, énergie et autres) |
|
Pays couverts |
Mexique, Chili, Colombie, Argentine, Bolivie, Paraguay, Pérou, Uruguay, Panama, Nicaragua, Costa Rica, Équateur, Honduras, Guatemala, El Salvador, République dominicaine et reste de l'Amérique latine |
|
Acteurs du marché couverts |
Wolters Kluwer NV, Ernst & Young Global Limited, FIS, SAP, Oracle, ION, Conta Azul, Calypso, Finastra, Kyriba Corp., MUREX SAS, entre autres |
Dynamique du marché des logiciels de trésorerie en Amérique latine
Conducteurs
Adoption croissante d'outils intelligents de gestion des paiements électroniques
L'adoption croissante de la gestion intelligente des paiements électroniques parmi toutes les générations de la population a un impact positif. Les gadgets intelligents ont gagné une immense popularité auprès des consommateurs et sont devenus partie intégrante du mode de vie humain. Les consommateurs sont de plus en plus à l'aise avec la gestion de leurs transactions via leurs appareils intelligents et sont plus susceptibles de continuer à gérer leurs finances à partir d'outils de gestion des paiements électroniques, ce qui stimule la croissance du marché.
- Demande croissante de systèmes TMS avancés pour améliorer l'expérience client
Les systèmes avancés de gestion de trésorerie (TMS) sont essentiellement des logiciels en tant que service (SaaS) qui offrent une meilleure visibilité sur la trésorerie et les liquidités tout en permettant de contrôler les comptes bancaires, de maintenir la conformité et de gérer les transactions financières, ce qui contribue à améliorer la satisfaction des clients. Ces derniers temps, les applications de systèmes avancés de gestion de trésorerie (TMS) gagnent en popularité dans la région latino-américaine, ce qui en fait l'un des principaux facteurs de croissance du marché.
- Adoption rapide de l'intelligence artificielle dans la gestion de trésorerie
Ces derniers temps, les secteurs bancaire et financier utilisent les technologies de l’IA dans les banques. Les chatbots pour les services financiers tels que l’efficacité transactionnelle, la surveillance et l’amélioration des capacités de gestion de trésorerie ont gagné en popularité dans la région latino-américaine et constituent l’un des facteurs moteurs de la croissance du marché.
- Adoption d'une solution basée sur le cloud dans la gestion de trésorerie
La technologie cloud permet aux utilisateurs d'accéder au stockage, aux fichiers, aux logiciels et aux serveurs à l'aide de leurs appareils connectés à Internet. Cela signifie également avoir la possibilité de stocker et d'accéder aux données et aux programmes via Internet plutôt que sur un disque dur qui peut être utilisé par les entreprises de toute taille. Cela stimule la croissance du marché.
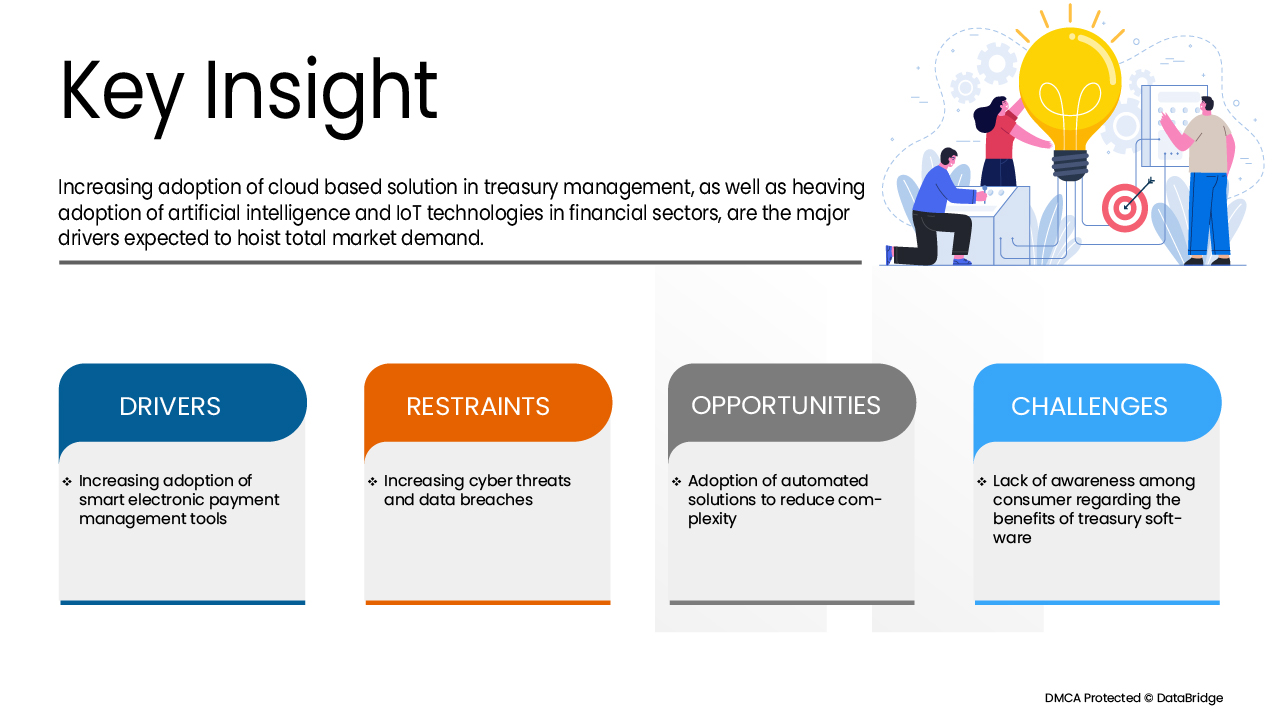
Opportunités
- Pénétration des solutions d'analyse avancée dans le secteur bancaire
L'analytique étant l'analyse informatique systématique de données ou de statistiques, elle est utilisée pour la découverte, l'interprétation et la communication de modèles significatifs dans les données. Elle peut être utilisée dans le secteur bancaire à diverses fins, telles que la sélection de modèles, l'augmentation de l'efficacité et des revenus du service client, qui sera également précis et économe en ressources, offrant ainsi une énorme opportunité de croissance pour le marché des logiciels de trésorerie.
En outre, le lancement de divers nouveaux logiciels de trésorerie offrira des opportunités bénéfiques pour le marché des logiciels de trésorerie au cours de la période de prévision 2022-2029.
Contraintes/Défis
Ces derniers temps, les entreprises et les secteurs d'activité adoptent massivement la numérisation, ce qui ouvre la voie à la cybercriminalité. La cybercriminalité est devenue une véritable menace pour toutes les entreprises, qu'elles soient petites ou grandes. Les failles de sécurité des réseaux sont une faiblesse exploitée par les pirates informatiques pour effectuer des actions non autorisées au sein d'un système. La simple présence de la cybercriminalité entraînera la croissance du marché des logiciels de trésorerie.
Impact du COVID-19 sur le marché des logiciels de trésorerie en Amérique latine
La pandémie de COVID-19 a eu un impact négatif sur le marché des logiciels de trésorerie. Après l'apparition soudaine de la pandémie, de nombreuses usines et unités techniques ont mené des opérations limitées sous la direction des gouvernements. Peu d'entre elles ont même arrêté la production et fermé temporairement leurs unités. C'est la raison pour laquelle l'industrie technologique est toujours confrontée à une pénurie de matériaux, et les retards d'expédition aggravent la situation en raison du fort impact de la COVID-19.
Développement récent
- En décembre 2021, Oracle a acquis Cerner. Cette acquisition a renforcé l'expertise de l'entreprise dans le domaine des solutions logicielles et lui a permis de prendre la tête des applications de services financiers, de cloud, d'IA et d'apprentissage automatique, ce qui a en retour stimulé les revenus de l'entreprise.
Portée du marché des logiciels de trésorerie en Amérique latine
Le marché des logiciels de trésorerie en Amérique latine est segmenté en fonction du système d'exploitation, de l'application, de la taille de l'organisation, du modèle de déploiement et du secteur vertical. La croissance parmi ces segments vous aidera à analyser les segments de croissance faibles dans les industries et à fournir aux utilisateurs un aperçu précieux du marché et des informations sur le marché pour les aider à prendre des décisions stratégiques pour identifier les principales applications du marché.
Système opérateur
- Fenêtres
- Linux
- Mac
- Androïde
- iOS
Sur la base du système d’exploitation, le marché des logiciels de trésorerie d’Amérique latine est segmenté en Windows, Linux, Mac, Android et iOS.
Application
- Liquidité et gestion de trésorerie
- Gestion d'investissement
- Gestion de la dette
- Gestion des risques financiers
- Gestion des plaintes
- Gestion de la planification fiscale
- Autres
Sur la base des applications, le marché des logiciels de trésorerie en Amérique latine est segmenté en gestion des liquidités et de la trésorerie, gestion des investissements, gestion de la dette, gestion des risques financiers, gestion de la conformité, gestion de la planification fiscale et autres.
Taille de l'organisation
- Grandes entreprises
- Petites entreprises
- Entreprises de taille moyenne
Sur la base de la taille de l’organisation, le marché des logiciels de trésorerie d’Amérique latine est segmenté en grandes entreprises, petites entreprises et moyennes entreprises.
Modèle de déploiement
- Nuage
- Sur site
Sur la base du modèle de déploiement, le marché des logiciels de trésorerie en Amérique latine est segmenté en cloud et sur site.
Verticale
- Banques, services financiers et assurances (BFSI)
- Gouvernement
- Fabrication
- Soins de santé
- Biens de consommation
- Produits chimiques
- Énergie
- Autres
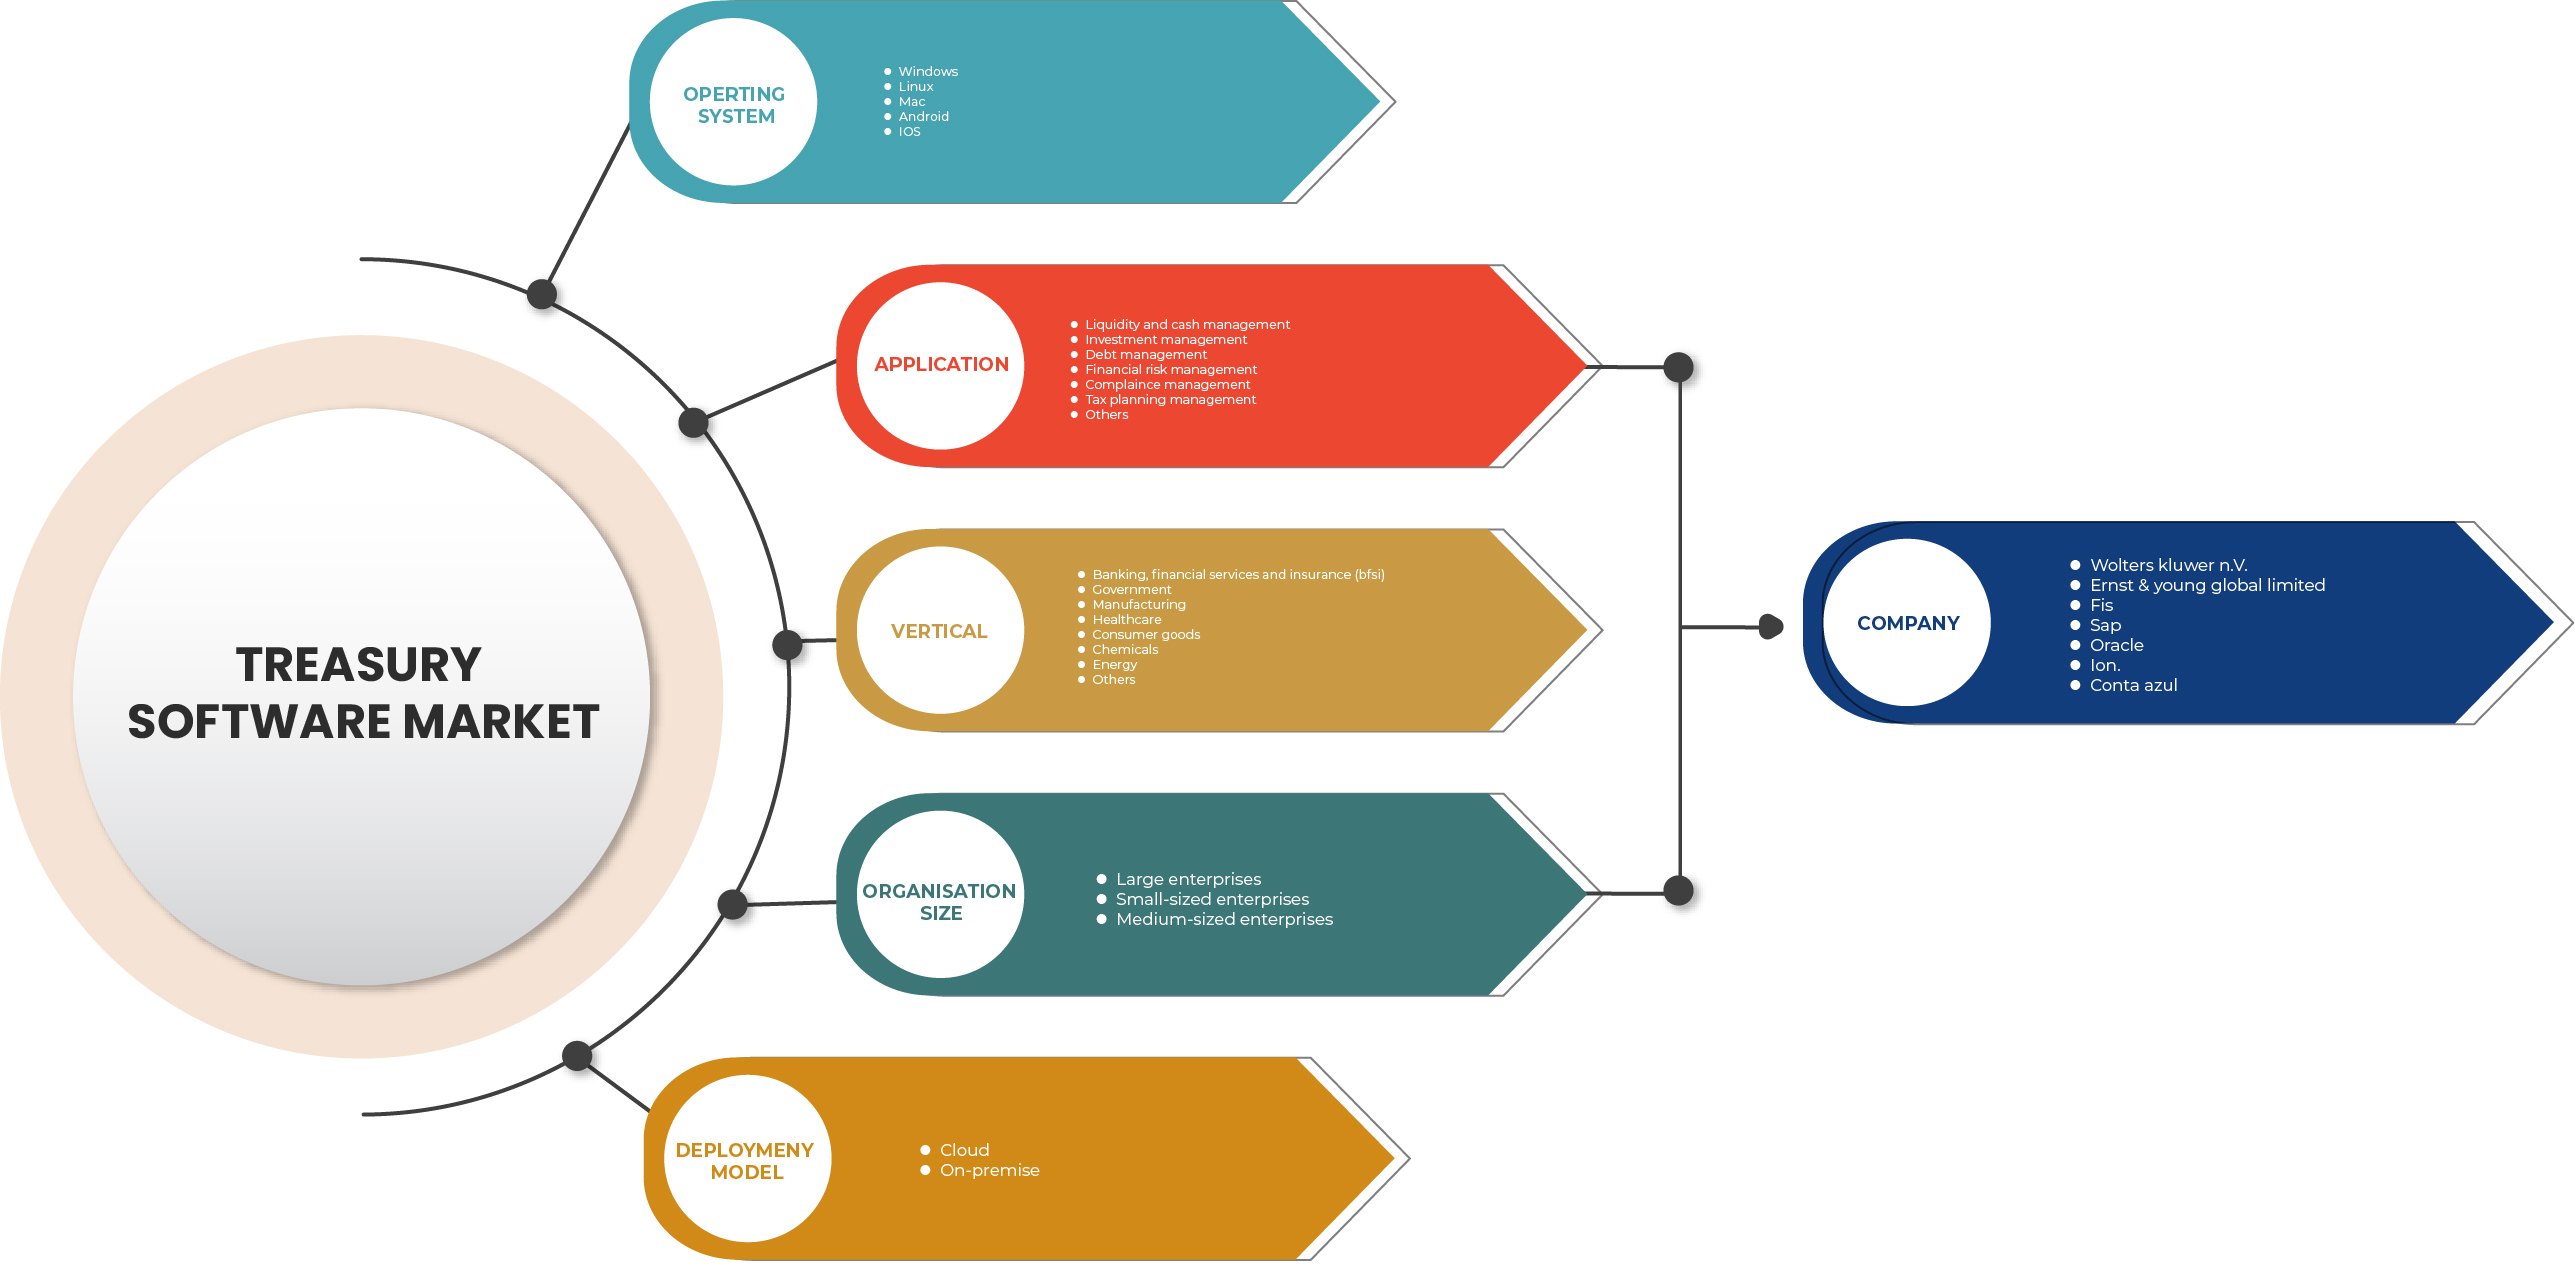
Sur la base de la verticale, le marché des logiciels de trésorerie en Amérique latine est segmenté en banque, services financiers et assurances (BFSI), gouvernement, fabrication, soins de santé, biens de consommation, produits chimiques, énergie et autres.
Analyse/perspectives régionales du marché des logiciels de trésorerie en Amérique latine
Le marché des logiciels de trésorerie d'Amérique latine est analysé et des informations sur la taille et les tendances du marché sont fournies par le système d'exploitation, l'application, la taille de l'organisation, le modèle de déploiement et le secteur vertical comme référencé ci-dessus.
Les pays couverts par le marché des logiciels de trésorerie d'Amérique latine sont le Mexique, le Chili, la Colombie, l'Argentine, la Bolivie, le Paraguay, le Pérou, l'Uruguay, le Panama, le Nicaragua, le Costa Rica, l'Équateur, le Honduras, le Guatemala, le Salvador, la République dominicaine et le reste de l'Amérique latine.
Le Mexique devrait dominer le marché des logiciels de trésorerie en Amérique latine, car le pays possède l'un des systèmes bancaires les plus développés d'Amérique latine, ce qui accroît la demande de logiciels de trésorerie. De plus, au fil des ans, le Mexique a transformé ses processus et politiques de gestion bancaire et de trésorerie pour garantir un environnement bancaire plus sûr et plus efficace.
La section pays du rapport fournit également des facteurs d'impact sur les marchés individuels et des changements de réglementation sur le marché national qui ont un impact sur les tendances actuelles et futures du marché. Des points de données tels que les nouvelles ventes, les ventes de remplacement, la démographie des pays, l'épidémiologie des maladies et les tarifs d'importation et d'exportation sont quelques-uns des principaux indicateurs utilisés pour prévoir le scénario de marché pour les différents pays. En outre, la présence et la disponibilité des marques mondiales et les défis auxquels elles sont confrontées en raison de la concurrence importante ou rare des marques locales et nationales, l'impact des canaux de vente sont pris en compte tout en fournissant une analyse prévisionnelle des données nationales.
Analyse du paysage concurrentiel et des parts de marché des logiciels de trésorerie en Amérique latine
Le paysage concurrentiel du marché des logiciels de trésorerie en Amérique latine fournit des détails par concurrent. Les détails inclus sont la présentation de l'entreprise, les finances de l'entreprise, les revenus générés, le potentiel du marché, les investissements dans la recherche et le développement, les nouvelles initiatives du marché, la présence mondiale, les sites et installations de production, les capacités de production, les forces et les faiblesses de l'entreprise, le lancement du produit, la largeur et l'étendue du produit, la domination des applications. Les points de données ci-dessus fournis ne concernent que l'orientation des entreprises liées au marché des logiciels de trésorerie en Amérique latine.
Certains des principaux acteurs opérant sur le marché des logiciels de trésorerie sont SAP, FIS, MUREX SAS, Finastra, Calypso, Kyriba Corp., Conta Azul, Wolters Kluwer NV, Oracle, ION, Ernst & Young Global Limited, entre autres.
SKU-
Accédez en ligne au rapport sur le premier cloud mondial de veille économique

- Tableau de bord d'analyse de données interactif
- Tableau de bord d'analyse d'entreprise pour les opportunités à fort potentiel de croissance
- Accès d'analyste de recherche pour la personnalisation et les requêtes
- Analyse de la concurrence avec tableau de bord interactif
- Dernières actualités, mises à jour et analyse des tendances
- Exploitez la puissance de l'analyse comparative pour un suivi complet de la concurrence
Table des matières
1 INTRODUCTION
1.1 OBJECTIVES OF THE STUDY
1.2 MARKET DEFINITION
1.3 OVERVIEW OF LATIN AMERICA TREASURY SOFTWARE MARKET
1.4 CURRENCY AND PRICING
1.5 LIMITATIONS
1.6 MARKETS COVERED
2 MARKET SEGMENTATION
2.1 MARKETS COVERED
2.2 YEARS CONSIDERED FOR THE STUDY
2.3 GEOGRAPHIC SCOPE
2.4 DBMR TRIPOD DATA VALIDATION MODEL
2.5 PRIMARY INTERVIEWS WITH KEY OPINION LEADERS
2.6 DBMR MARKET POSITION GRID
2.7 VENDOR SHARE ANALYSIS
2.8 MARKET END-USER COVERAGE GRID
2.9 MULTIVARIATE MODELLING
2.1 OPERATING SYSTEM CURVE
2.11 SECONDARY SOURCES
2.12 ASSUMPTIONS
3 EXECUTIVE SUMMARY
4 PREMIUM INSIGHTS
4.1 LIST OF PROVIDERS FOR MID-SIZED BANKS IN LATIN AMERICA
5 MARKET OVERVIEW
5.1 DRIVERS
5.1.1 INCREASING ADOPTION OF SMART ELECTRONIC PAYMENT MANAGEMENT TOOLS
5.1.2 GROWING DEMAND FOR ADVANCED TMS SYSTEMS FOR ENHANCING CUSTOMER EXPERIENCE
5.1.3 HEAVING ADOPTION OF ARTIFICIAL INTELLIGENCE IN TREASURY MANAGEMENT
5.1.4 ADOPTION OF CLOUD-BASED SOLUTION IN TREASURY MANAGEMENT
5.2 RESTRAINTS
5.2.1 INCREASING CYBER THREATS AND DATA BREACHES
5.2.2 HIGH COST ASSOCIATED WITH TREASURY MANAGEMENT SYSTEMS
5.3 OPPORTUNITIES
5.3.1 PENETRATION OF ADVANCED ANALYTICS SOLUTIONS IN THE BANKING SECTOR
5.3.2 ADOPTION OF AUTOMATED SOLUTIONS TO REDUCE COMPLEXITY
5.4 CHALLENGES
5.4.1 LACK OF AWARENESS AMONG CONSUMERS REGARDING THE BENEFITS OF TREASURY SOFTWARE
5.4.2 INADEQUATE INFRASTRUCTURE AND FX VOLATILITY HAMPER TREASURY MANAGEMENT EFFICIENCY
6 LATIN AMERICA TREASURY SOFTWARE MARKET, BY OPERATING SYSTEM
6.1 OVERVIEW
6.2 WINDOWS
6.3 LINUX
6.4 MAC
6.5 ANDROID
6.6 IOS
7 LATIN AMERICA TREASURY SOFTWARE MARKET, BY APPLICATION
7.1 OVERVIEW
7.2 LIQUIDITY AND CASH MANAGEMENT
7.3 INVESTMENT MANAGEMENT
7.4 DEBT MANAGEMENT
7.5 FINANCIAL RISK MANAGEMENT
7.6 COMPLIANCE MANAGEMENT
7.7 TAX PLANNING
7.8 OTHERS
8 LATIN AMERICA TREASURY SOFTWARE MARKET, BY ORGANIZATION SIZE
8.1 OVERVIEW
8.2 LARGE ENTERPRISES
8.3 MEDIUM-SIZED ENTERPRISES
8.4 SMALL-SIZED ENTERPRISES
9 LATIN AMERICA TREASURY SOFTWARE MARKET, BY DEPLOYMENT MODEL
9.1 OVERVIEW
9.2 CLOUD
9.2.1 PUBLIC
9.2.2 HYBRID
9.2.3 PRIVATE
9.3 ON-PREMISES
10 LATIN AMERICA TREASURY SOFTWARE MARKET, BY VERTICAL
10.1 OVERVIEW
10.2 BANKING, FINANCIAL SERVICES AND INSURANCE (BFSI)
10.2.1 LIQUIDITY AND CASH MANAGEMENT
10.2.2 INVESTMENT MANAGEMENT
10.2.3 DEBT MANAGEMENT
10.2.4 FINANCIAL RISK MANAGEMENT
10.2.5 COMPLIANCE MANAGEMENT
10.2.6 TAX PLANNING MANAGEMENT
10.2.7 OTHERS
10.3 GOVERNMENT
10.3.1 LIQUIDITY AND CASH MANAGEMENT
10.3.2 INVESTMENT MANAGEMENT
10.3.3 DEBT MANAGEMENT
10.3.4 FINANCIAL RISK MANAGEMENT
10.3.5 COMPLIANCE MANAGEMENT
10.3.6 TAX PLANNING MANAGEMENT
10.3.7 OTHERS
10.4 MANUFACTURING
10.4.1 LIQUIDITY AND CASH MANAGEMENT
10.4.2 INVESTMENT MANAGEMENT
10.4.3 DEBT MANAGEMENT
10.4.4 FINANCIAL RISK MANAGEMENT
10.4.5 COMPLIANCE MANAGEMENT
10.4.6 TAX PLANNING MANAGEMENT
10.4.7 OTHERS
10.5 HEALTHCARE
10.5.1 LIQUIDITY AND CASH MANAGEMENT
10.5.2 INVESTMENT MANAGEMENT
10.5.3 DEBT MANAGEMENT
10.5.4 FINANCIAL RISK MANAGEMENT
10.5.5 COMPLIANCE MANAGEMENT
10.5.6 TAX PLANNING MANAGEMENT
10.5.7 OTHERS
10.6 CONSUMER GOODS
10.6.1 LIQUIDITY AND CASH MANAGEMENT
10.6.2 INVESTMENT MANAGEMENT
10.6.3 DEBT MANAGEMENT
10.6.4 FINANCIAL RISK MANAGEMENT
10.6.5 COMPLIANCE MANAGEMENT
10.6.6 TAX PLANNING MANAGEMENT
10.6.7 OTHERS
10.7 CHEMICALS
10.7.1 LIQUIDITY AND CASH MANAGEMENT
10.7.2 INVESTMENT MANAGEMENT
10.7.3 DEBT MANAGEMENT
10.7.4 FINANCIAL RISK MANAGEMENT
10.7.5 COMPLIANCE MANAGEMENT
10.7.6 TAX PLANNING MANAGEMENT
10.7.7 OTHERS
10.8 ENERGY
10.8.1 LIQUIDITY AND CASH MANAGEMENT
10.8.2 INVESTMENT MANAGEMENT
10.8.3 DEBT MANAGEMENT
10.8.4 FINANCIAL RISK MANAGEMENT
10.8.5 COMPLIANCE MANAGEMENT
10.8.6 TAX PLANNING MANAGEMENT
10.8.7 OTHERS
10.9 OTHERS
10.9.1 LIQUIDITY AND CASH MANAGEMENTS
10.9.2 INVESTMENT MANAGEMENT
10.9.3 DEBT MANAGEMENT
10.9.4 FINANCIAL RISK MANAGEMENT
10.9.5 COMPLIANCE MANAGEMENT
10.9.6 TAX PLANNING MANAGEMENT
10.9.7 OTHERS
11 LATIN AMERICA TREASURY SOFTWARE MARKET, COUNTRY
11.1 MEXICO
11.2 CHILE
11.3 COLOMBIA
11.4 ARGENTINA
11.5 BOLIVIA
11.6 PARAGUAY
11.7 PERU
11.8 URUGUAY
11.9 PANAMA
11.1 NICARAGUA
11.11 COSTA RICA
11.12 ECUADOR
11.13 HONDURAS
11.14 GUATEMALA
11.15 EL SALVADOR
11.16 THE DOMINICAN REPUBLIC
11.17 REST OF LATIN AMERICA
12 LATIN AMERICA TREASURY SOFTWARE MARKET: COMPANY LANDSCAPE
12.1 COMPANY SHARE ANALYSIS: LATIN AMERICA
13 SWOT ANALYSIS
14 COMPANY PROFILE
14.1 WOLTERS KLUWER N.V.
14.1.1 COMPANY SNAPSHOT
14.1.2 REVENUE ANALYSIS
14.1.3 SOLUTION PORTFOLIO
14.1.4 RECENT DEVELOPMENTS
14.2 ERNST & YOUNG GLOBAL LIMITED
14.2.1 COMPANY SNAPSHOT
14.2.2 SOLUTION PORTFOLIO
14.2.3 RECENT DEVELOPMENTS
14.3 FIS
14.3.1 COMPANY SNAPSHOT
14.3.2 REVENUE ANALYSIS
14.3.3 SOLUTION PORTFOLIO
14.3.4 RECENT DEVELOPMENTS
14.4 SAP
14.4.1 COMPANY SNAPSHOT
14.4.2 REVENUE ANALYSIS
14.4.3 PRODUCT PORTFOLIO
14.4.4 RECENT DEVELOPMENTS
14.5 ORACLE
14.5.1 COMPANY SNAPSHOT
14.5.2 REVENUE ANALYSIS
14.5.3 SOLUTION PORTFOLIO
14.5.4 RECENT DEVELOPMENTS
14.6 ION
14.6.1 COMPANY SNAPSHOT
14.6.2 SOLUTION PORTFOLIO
14.6.3 RECENT DEVELOPMENTS
14.7 CONTA AZUL
14.7.1 COMPANY SNAPSHOT
14.7.2 SOLUTION PORTFOLIO
14.7.3 RECENT DEVELOPMENTS
14.8 CALYPSO
14.8.1 COMPANY SNAPSHOT
14.8.2 SOLUTION PORTFOLIO
14.8.3 RECENT DEVELOPMENTS
14.9 FINASTRA
14.9.1 COMPANY SNAPSHOT
14.9.2 SOLUTION PORTFOLIO
14.9.3 RECENT DEVELOPMENTS
14.1 KYRIBA CORP.
14.10.1 COMPANY SNAPSHOT
14.10.2 SOLUTION PORTFOLIO
14.10.3 RECENT DEVELOPMENTS
14.11 MUREX S.A.S
14.11.1 COMPANY SNAPSHOT
14.11.2 SOLUTION PORTFOLIO
14.11.3 RECENT DEVELOPMENTS
15 QUESTIONNAIRE
16 RELATED REPORTS
Liste des tableaux
TABLE 1 LATIN AMERICA TREASURY SOFTWARE MARKET, BY OPERATING SYSTEM, 2020-2029 (USD THOUSAND)
TABLE 2 LATIN AMERICA TREASURY SOFTWARE MARKET, BY APPLICATION, 2020-2029 (USD THOUSAND)
TABLE 3 LATIN AMERICA TREASURY SOFTWARE MARKET, BY ORGANIZATION SIZE, 2020-2029 (USD THOUSAND)
TABLE 4 LATIN AMERICA TREASURY SOFTWARE MARKET, BY DEPLOYMENT MODEL, 2020-2029 (USD THOUSAND)
TABLE 5 LATIN AMERICA CLOUD IN TREASURY SOFTWARE MARKET, BY TYPE, 2020-2029 (USD THOUSAND)
TABLE 6 LATIN AMERICA TREASURY SOFTWARE MARKET, BY VERTICAL, 2020-2029 (USD THOUSAND)
TABLE 7 LATIN AMERICA BANKING, FINANCIAL SERVICES AND INSURANCE (BFSI) IN TREASURY SOFTWARE MARKET, BY APPLICATION, 2020-2029 (USD THOUSAND)
TABLE 8 LATIN AMERICA GOVERNMENT IN TREASURY SOFTWARE MARKET, BY APPLICATION, 2020-2029 (USD THOUSAND)
TABLE 9 LATIN AMERICA MANUFACTURING IN TREASURY SOFTWARE MARKET, BY APPLICATION, 2020-2029 (USD THOUSAND)
TABLE 10 LATIN AMERICA HEALTHCARE IN TREASURY SOFTWARE MARKET, BY APPLICATION, 2020-2029 (USD THOUSAND)
TABLE 11 LATIN AMERICA CONSUMER GOODS IN TREASURY SOFTWARE MARKET, BY APPLICATION, 2020-2029 (USD THOUSAND)
TABLE 12 LATIN AMERICA CHEMICALS IN TREASURY SOFTWARE MARKET, BY APPLICATION, 2020-2029 (USD THOUSAND)
TABLE 13 LATIN AMERICA ENERGY IN TREASURY SOFTWARE MARKET, BY APPLICATION, 2020-2029 (USD THOUSAND)
TABLE 14 LATIN AMERICA OTHERS IN TREASURY SOFTWARE MARKET, BY APPLICATION, 2020-2029 (USD THOUSAND)
TABLE 15 LATIN AMERICA TREASURY SOFTWARE MARKET, BY COUNTRY, 2020-2029 (USD THOUSAND)
TABLE 16 MEXICO TREASURY SOFTWARE MARKET, BY OPERATING SYSTEM, 2020-2029 (USD THOUSAND)
TABLE 17 MEXICO TREASURY SOFTWARE MARKET, BY APPLICATION, 2020-2029 (USD THOUSAND)
TABLE 18 MEXICO TREASURY SOFTWARE MARKET, BY DEPLOYMENT MODEL, 2020-2029 (USD THOUSAND)
TABLE 19 MEXICO CLOUD IN TREASURY SOFTWARE MARKET, BY TYPE, 2020-2029 (USD THOUSAND)
TABLE 20 MEXICO TREASURY SOFTWARE MARKET, BY ORGANISATION SIZE, 2020-2029 (USD THOUSAND)
TABLE 21 MEXICO TREASURY SOFTWARE MARKET, BY VERTICAL, 2020-2029 (USD THOUSAND)
TABLE 22 MEXICO BANKING, FINANCIAL SERVICES AND INSURANCE (BFSI) IN TREASURY SOFTWARE MARKET, BY APPLICATION, 2020-2029 (USD THOUSAND)
TABLE 23 MEXICO GOVERNMENT IN TREASURY SOFTWARE MARKET, BY APPLICATION, 2020-2029 (USD THOUSAND)
TABLE 24 MEXICO MANUFACTURING IN TREASURY SOFTWARE MARKET, BY APPLICATION, 2020-2029 (USD THOUSAND)
TABLE 25 MEXICO HEALTHCARE IN TREASURY SOFTWARE MARKET, BY APPLICATION, 2020-2029 (USD THOUSAND)
TABLE 26 MEXICO CONSUMER GOODS IN TREASURY SOFTWARE MARKET, BY APPLICATION, 2020-2029 (USD THOUSAND)
TABLE 27 MEXICO CHEMICALS IN TREASURY SOFTWARE MARKET, BY APPLICATION, 2020-2029 (USD THOUSAND)
TABLE 28 MEXICO ENERGY IN TREASURY SOFTWARE MARKET, BY APPLICATION, 2020-2029 (USD THOUSAND)
TABLE 29 MEXICO OTHERS IN TREASURY SOFTWARE MARKET, BY APPLICATION, 2020-2029 (USD THOUSAND)
TABLE 30 CHILE TREASURY SOFTWARE MARKET, BY OPERATING SYSTEM, 2020-2029 (USD THOUSAND)
TABLE 31 CHILE TREASURY SOFTWARE MARKET, BY APPLICATION, 2020-2029 (USD THOUSAND)
TABLE 32 CHILE TREASURY SOFTWARE MARKET, BY DEPLOYMENT MODEL, 2020-2029 (USD THOUSAND)
TABLE 33 CHILE CLOUD IN TREASURY SOFTWARE MARKET, BY TYPE, 2020-2029 (USD THOUSAND)
TABLE 34 CHILE TREASURY SOFTWARE MARKET, BY ORGANISATION SIZE, 2020-2029 (USD THOUSAND)
TABLE 35 CHILE TREASURY SOFTWARE MARKET, BY VERTICAL, 2020-2029 (USD THOUSAND)
TABLE 36 CHILE BANKING, FINANCIAL SERVICES AND INSURANCE (BFSI) IN TREASURY SOFTWARE MARKET, BY APPLICATION, 2020-2029 (USD THOUSAND)
TABLE 37 CHILE GOVERNMENT IN TREASURY SOFTWARE MARKET, BY APPLICATION, 2020-2029 (USD THOUSAND)
TABLE 38 CHILE MANUFACTURING IN TREASURY SOFTWARE MARKET, BY APPLICATION, 2020-2029 (USD THOUSAND)
TABLE 39 CHILE HEALTHCARE IN TREASURY SOFTWARE MARKET, BY APPLICATION, 2020-2029 (USD THOUSAND)
TABLE 40 CHILE CONSUMER GOODS IN TREASURY SOFTWARE MARKET, BY APPLICATION, 2020-2029 (USD THOUSAND)
TABLE 41 CHILE CHEMICALS IN TREASURY SOFTWARE MARKET, BY APPLICATION, 2020-2029 (USD THOUSAND)
TABLE 42 CHILE ENERGY IN TREASURY SOFTWARE MARKET, BY APPLICATION, 2020-2029 (USD THOUSAND)
TABLE 43 CHILE OTHERS IN TREASURY SOFTWARE MARKET, BY APPLICATION, 2020-2029 (USD THOUSAND)
TABLE 44 COLOMBIA TREASURY SOFTWARE MARKET, BY OPERATING SYSTEM, 2020-2029 (USD THOUSAND)
TABLE 45 COLOMBIA TREASURY SOFTWARE MARKET, BY APPLICATION, 2020-2029 (USD THOUSAND)
TABLE 46 COLOMBIA TREASURY SOFTWARE MARKET, BY DEPLOYMENT MODEL, 2020-2029 (USD THOUSAND)
TABLE 47 COLOMBIA CLOUD IN TREASURY SOFTWARE MARKET, BY TYPE, 2020-2029 (USD THOUSAND)
TABLE 48 COLOMBIA TREASURY SOFTWARE MARKET, BY ORGANISATION SIZE, 2020-2029 (USD THOUSAND)
TABLE 49 COLOMBIA TREASURY SOFTWARE MARKET, BY VERTICAL, 2020-2029 (USD THOUSAND)
TABLE 50 COLOMBIA BANKING, FINANCIAL SERVICES AND INSURANCE (BFSI) IN TREASURY SOFTWARE MARKET, BY APPLICATION, 2020-2029 (USD THOUSAND)
TABLE 51 COLOMBIA GOVERNMENT IN TREASURY SOFTWARE MARKET, BY APPLICATION, 2020-2029 (USD THOUSAND)
TABLE 52 COLOMBIA MANUFACTURING IN TREASURY SOFTWARE MARKET, BY APPLICATION, 2020-2029 (USD THOUSAND)
TABLE 53 COLOMBIA HEALTHCARE IN TREASURY SOFTWARE MARKET, BY APPLICATION, 2020-2029 (USD THOUSAND)
TABLE 54 COLOMBIA CONSUMER GOODS IN TREASURY SOFTWARE MARKET, BY APPLICATION, 2020-2029 (USD THOUSAND)
TABLE 55 COLOMBIA CHEMICALS IN TREASURY SOFTWARE MARKET, BY APPLICATION, 2020-2029 (USD THOUSAND)
TABLE 56 COLOMBIA ENERGY IN TREASURY SOFTWARE MARKET, BY APPLICATION, 2020-2029 (USD THOUSAND)
TABLE 57 COLOMBIA OTHERS IN TREASURY SOFTWARE MARKET, BY APPLICATION, 2020-2029 (USD THOUSAND)
TABLE 58 ARGENTINA TREASURY SOFTWARE MARKET, BY OPERATING SYSTEM, 2020-2029 (USD THOUSAND)
TABLE 59 ARGENTINA TREASURY SOFTWARE MARKET, BY APPLICATION, 2020-2029 (USD THOUSAND)
TABLE 60 ARGENTINA TREASURY SOFTWARE MARKET, BY DEPLOYMENT MODEL, 2020-2029 (USD THOUSAND)
TABLE 61 ARGENTINA CLOUD IN TREASURY SOFTWARE MARKET, BY TYPE, 2020-2029 (USD THOUSAND)
TABLE 62 ARGENTINA TREASURY SOFTWARE MARKET, BY ORGANISATION SIZE, 2020-2029 (USD THOUSAND)
TABLE 63 ARGENTINA TREASURY SOFTWARE MARKET, BY VERTICAL, 2020-2029 (USD THOUSAND)
TABLE 64 ARGENTINA BANKING, FINANCIAL SERVICES AND INSURANCE (BFSI) IN TREASURY SOFTWARE MARKET, BY APPLICATION, 2020-2029 (USD THOUSAND)
TABLE 65 ARGENTINA GOVERNMENT IN TREASURY SOFTWARE MARKET, BY APPLICATION, 2020-2029 (USD THOUSAND)
TABLE 66 ARGENTINA MANUFACTURING IN TREASURY SOFTWARE MARKET, BY APPLICATION, 2020-2029 (USD THOUSAND)
TABLE 67 ARGENTINA HEALTHCARE IN TREASURY SOFTWARE MARKET, BY APPLICATION, 2020-2029 (USD THOUSAND)
TABLE 68 ARGENTINA CONSUMER GOODS IN TREASURY SOFTWARE MARKET, BY APPLICATION, 2020-2029 (USD THOUSAND)
TABLE 69 ARGENTINA CHEMICALS IN TREASURY SOFTWARE MARKET, BY APPLICATION, 2020-2029 (USD THOUSAND)
TABLE 70 ARGENTINA ENERGY IN TREASURY SOFTWARE MARKET, BY APPLICATION, 2020-2029 (USD THOUSAND)
TABLE 71 ARGENTINA OTHERS IN TREASURY SOFTWARE MARKET, BY APPLICATION, 2020-2029 (USD THOUSAND)
TABLE 72 BOLIVIA TREASURY SOFTWARE MARKET, BY OPERATING SYSTEM, 2020-2029 (USD THOUSAND)
TABLE 73 BOLIVIA TREASURY SOFTWARE MARKET, BY APPLICATION, 2020-2029 (USD THOUSAND)
TABLE 74 BOLIVIA TREASURY SOFTWARE MARKET, BY DEPLOYMENT MODEL, 2020-2029 (USD THOUSAND)
TABLE 75 BOLIVIA CLOUD IN TREASURY SOFTWARE MARKET, BY TYPE, 2020-2029 (USD THOUSAND)
TABLE 76 BOLIVIA TREASURY SOFTWARE MARKET, BY ORGANISATION SIZE, 2020-2029 (USD THOUSAND)
TABLE 77 BOLIVIA TREASURY SOFTWARE MARKET, BY VERTICAL, 2020-2029 (USD THOUSAND)
TABLE 78 BOLIVIA BANKING, FINANCIAL SERVICES AND INSURANCE (BFSI) IN TREASURY SOFTWARE MARKET, BY APPLICATION, 2020-2029 (USD THOUSAND)
TABLE 79 BOLIVIA GOVERNMENT IN TREASURY SOFTWARE MARKET, BY APPLICATION, 2020-2029 (USD THOUSAND)
TABLE 80 BOLIVIA MANUFACTURING IN TREASURY SOFTWARE MARKET, BY APPLICATION, 2020-2029 (USD THOUSAND)
TABLE 81 BOLIVIA HEALTHCARE IN TREASURY SOFTWARE MARKET, BY APPLICATION, 2020-2029 (USD THOUSAND)
TABLE 82 BOLIVIA CONSUMER GOODS IN TREASURY SOFTWARE MARKET, BY APPLICATION, 2020-2029 (USD THOUSAND)
TABLE 83 BOLIVIA CHEMICALS IN TREASURY SOFTWARE MARKET, BY APPLICATION, 2020-2029 (USD THOUSAND)
TABLE 84 BOLIVIA ENERGY IN TREASURY SOFTWARE MARKET, BY APPLICATION, 2020-2029 (USD THOUSAND)
TABLE 85 BOLIVIA OTHERS IN TREASURY SOFTWARE MARKET, BY APPLICATION, 2020-2029 (USD THOUSAND)
TABLE 86 PARAGUAY TREASURY SOFTWARE MARKET, BY OPERATING SYSTEM, 2020-2029 (USD THOUSAND)
TABLE 87 PARAGUAY TREASURY SOFTWARE MARKET, BY APPLICATION, 2020-2029 (USD THOUSAND)
TABLE 88 PARAGUAY TREASURY SOFTWARE MARKET, BY DEPLOYMENT MODEL, 2020-2029 (USD THOUSAND)
TABLE 89 PARAGUAY CLOUD IN TREASURY SOFTWARE MARKET, BY TYPE, 2020-2029 (USD THOUSAND)
TABLE 90 PARAGUAY TREASURY SOFTWARE MARKET, BY ORGANISATION SIZE, 2020-2029 (USD THOUSAND)
TABLE 91 PARAGUAY TREASURY SOFTWARE MARKET, BY VERTICAL, 2020-2029 (USD THOUSAND)
TABLE 92 PARAGUAY BANKING, FINANCIAL SERVICES AND INSURANCE (BFSI) IN TREASURY SOFTWARE MARKET, BY APPLICATION, 2020-2029 (USD THOUSAND)
TABLE 93 PARAGUAY GOVERNMENT IN TREASURY SOFTWARE MARKET, BY APPLICATION, 2020-2029 (USD THOUSAND)
TABLE 94 PARAGUAY MANUFACTURING IN TREASURY SOFTWARE MARKET, BY APPLICATION, 2020-2029 (USD THOUSAND)
TABLE 95 PARAGUAY HEALTHCARE IN TREASURY SOFTWARE MARKET, BY APPLICATION, 2020-2029 (USD THOUSAND)
TABLE 96 PARAGUAY CONSUMER GOODS IN TREASURY SOFTWARE MARKET, BY APPLICATION, 2020-2029 (USD THOUSAND)
TABLE 97 PARAGUAY CHEMICALS IN TREASURY SOFTWARE MARKET, BY APPLICATION, 2020-2029 (USD THOUSAND)
TABLE 98 PARAGUAY ENERGY IN TREASURY SOFTWARE MARKET, BY APPLICATION, 2020-2029 (USD THOUSAND)
TABLE 99 PARAGUAY OTHERS IN TREASURY SOFTWARE MARKET, BY APPLICATION, 2020-2029 (USD THOUSAND)
TABLE 100 PERU TREASURY SOFTWARE MARKET, BY OPERATING SYSTEM, 2020-2029 (USD THOUSAND)
TABLE 101 PERU TREASURY SOFTWARE MARKET, BY APPLICATION, 2020-2029 (USD THOUSAND)
TABLE 102 PERU TREASURY SOFTWARE MARKET, BY DEPLOYMENT MODEL, 2020-2029 (USD THOUSAND)
TABLE 103 PERU CLOUD IN TREASURY SOFTWARE MARKET, BY TYPE, 2020-2029 (USD THOUSAND)
TABLE 104 PERU TREASURY SOFTWARE MARKET, BY ORGANISATION SIZE, 2020-2029 (USD THOUSAND)
TABLE 105 PERU TREASURY SOFTWARE MARKET, BY VERTICAL, 2020-2029 (USD THOUSAND)
TABLE 106 PERU BANKING, FINANCIAL SERVICES AND INSURANCE (BFSI) IN TREASURY SOFTWARE MARKET, BY APPLICATION, 2020-2029 (USD THOUSAND)
TABLE 107 PERU GOVERNMENT IN TREASURY SOFTWARE MARKET, BY APPLICATION, 2020-2029 (USD THOUSAND)
TABLE 108 PERU MANUFACTURING IN TREASURY SOFTWARE MARKET, BY APPLICATION, 2020-2029 (USD THOUSAND)
TABLE 109 PERU HEALTHCARE IN TREASURY SOFTWARE MARKET, BY APPLICATION, 2020-2029 (USD THOUSAND)
TABLE 110 PERU CONSUMER GOODS IN TREASURY SOFTWARE MARKET, BY APPLICATION, 2020-2029 (USD THOUSAND)
TABLE 111 PERU CHEMICALS IN TREASURY SOFTWARE MARKET, BY APPLICATION, 2020-2029 (USD THOUSAND)
TABLE 112 PERU ENERGY IN TREASURY SOFTWARE MARKET, BY APPLICATION, 2020-2029 (USD THOUSAND)
TABLE 113 PERU OTHERS IN TREASURY SOFTWARE MARKET, BY APPLICATION, 2020-2029 (USD THOUSAND)
TABLE 114 URUGUAY TREASURY SOFTWARE MARKET, BY OPERATING SYSTEM, 2020-2029 (USD THOUSAND)
TABLE 115 URUGUAY TREASURY SOFTWARE MARKET, BY APPLICATION, 2020-2029 (USD THOUSAND)
TABLE 116 URUGUAY TREASURY SOFTWARE MARKET, BY DEPLOYMENT MODEL, 2020-2029 (USD THOUSAND)
TABLE 117 URUGUAY CLOUD IN TREASURY SOFTWARE MARKET, BY TYPE, 2020-2029 (USD THOUSAND)
TABLE 118 URUGUAY TREASURY SOFTWARE MARKET, BY ORGANISATION SIZE, 2020-2029 (USD THOUSAND)
TABLE 119 URUGUAY TREASURY SOFTWARE MARKET, BY VERTICAL, 2020-2029 (USD THOUSAND)
TABLE 120 URUGUAY BANKING, FINANCIAL SERVICES AND INSURANCE (BFSI) IN TREASURY SOFTWARE MARKET, BY APPLICATION, 2020-2029 (USD THOUSAND)
TABLE 121 URUGUAY GOVERNMENT IN TREASURY SOFTWARE MARKET, BY APPLICATION, 2020-2029 (USD THOUSAND)
TABLE 122 URUGUAY MANUFACTURING IN TREASURY SOFTWARE MARKET, BY APPLICATION, 2020-2029 (USD THOUSAND)
TABLE 123 URUGUAY HEALTHCARE IN TREASURY SOFTWARE MARKET, BY APPLICATION, 2020-2029 (USD THOUSAND)
TABLE 124 URUGUAY CONSUMER GOODS IN TREASURY SOFTWARE MARKET, BY APPLICATION, 2020-2029 (USD THOUSAND)
TABLE 125 URUGUAY CHEMICALS IN TREASURY SOFTWARE MARKET, BY APPLICATION, 2020-2029 (USD THOUSAND)
TABLE 126 URUGUAY ENERGY IN TREASURY SOFTWARE MARKET, BY APPLICATION, 2020-2029 (USD THOUSAND)
TABLE 127 URUGUAY OTHERS IN TREASURY SOFTWARE MARKET, BY APPLICATION, 2020-2029 (USD THOUSAND)
TABLE 128 PANAMA TREASURY SOFTWARE MARKET, BY OPERATING SYSTEM, 2020-2029 (USD THOUSAND)
TABLE 129 PANAMA TREASURY SOFTWARE MARKET, BY APPLICATION, 2020-2029 (USD THOUSAND)
TABLE 130 PANAMA TREASURY SOFTWARE MARKET, BY DEPLOYMENT MODEL, 2020-2029 (USD THOUSAND)
TABLE 131 PANAMA CLOUD IN TREASURY SOFTWARE MARKET, BY TYPE, 2020-2029 (USD THOUSAND)
TABLE 132 PANAMA TREASURY SOFTWARE MARKET, BY ORGANISATION SIZE, 2020-2029 (USD THOUSAND)
TABLE 133 PANAMA TREASURY SOFTWARE MARKET, BY VERTICAL, 2020-2029 (USD THOUSAND)
TABLE 134 PANAMA BANKING, FINANCIAL SERVICES AND INSURANCE (BFSI) IN TREASURY SOFTWARE MARKET, BY APPLICATION, 2020-2029 (USD THOUSAND)
TABLE 135 PANAMA GOVERNMENT IN TREASURY SOFTWARE MARKET, BY APPLICATION, 2020-2029 (USD THOUSAND)
TABLE 136 PANAMA MANUFACTURING IN TREASURY SOFTWARE MARKET, BY APPLICATION, 2020-2029 (USD THOUSAND)
TABLE 137 PANAMA HEALTHCARE IN TREASURY SOFTWARE MARKET, BY APPLICATION, 2020-2029 (USD THOUSAND)
TABLE 138 PANAMA CONSUMER GOODS IN TREASURY SOFTWARE MARKET, BY APPLICATION, 2020-2029 (USD THOUSAND)
TABLE 139 PANAMA CHEMICALS IN TREASURY SOFTWARE MARKET, BY APPLICATION, 2020-2029 (USD THOUSAND)
TABLE 140 PANAMA ENERGY IN TREASURY SOFTWARE MARKET, BY APPLICATION, 2020-2029 (USD THOUSAND)
TABLE 141 PANAMA OTHERS IN TREASURY SOFTWARE MARKET, BY APPLICATION, 2020-2029 (USD THOUSAND)
TABLE 142 NICARAGUA TREASURY SOFTWARE MARKET, BY OPERATING SYSTEM, 2020-2029 (USD THOUSAND)
TABLE 143 NICARAGUA TREASURY SOFTWARE MARKET, BY APPLICATION, 2020-2029 (USD THOUSAND)
TABLE 144 NICARAGUA TREASURY SOFTWARE MARKET, BY DEPLOYMENT MODEL, 2020-2029 (USD THOUSAND)
TABLE 145 NICARAGUA CLOUD IN TREASURY SOFTWARE MARKET, BY TYPE, 2020-2029 (USD THOUSAND)
TABLE 146 NICARAGUA TREASURY SOFTWARE MARKET, BY ORGANISATION SIZE, 2020-2029 (USD THOUSAND)
TABLE 147 NICARAGUA TREASURY SOFTWARE MARKET, BY VERTICAL, 2020-2029 (USD THOUSAND)
TABLE 148 NICARAGUA BANKING, FINANCIAL SERVICES AND INSURANCE (BFSI) IN TREASURY SOFTWARE MARKET, BY APPLICATION, 2020-2029 (USD THOUSAND)
TABLE 149 NICARAGUA GOVERNMENT IN TREASURY SOFTWARE MARKET, BY APPLICATION, 2020-2029 (USD THOUSAND)
TABLE 150 NICARAGUA MANUFACTURING IN TREASURY SOFTWARE MARKET, BY APPLICATION, 2020-2029 (USD THOUSAND)
TABLE 151 NICARAGUA HEALTHCARE IN TREASURY SOFTWARE MARKET, BY APPLICATION, 2020-2029 (USD THOUSAND)
TABLE 152 NICARAGUA CONSUMER GOODS IN TREASURY SOFTWARE MARKET, BY APPLICATION, 2020-2029 (USD THOUSAND)
TABLE 153 NICARAGUA CHEMICALS IN TREASURY SOFTWARE MARKET, BY APPLICATION, 2020-2029 (USD THOUSAND)
TABLE 154 NICARAGUA ENERGY IN TREASURY SOFTWARE MARKET, BY APPLICATION, 2020-2029 (USD THOUSAND)
TABLE 155 NICARAGUA OTHERS IN TREASURY SOFTWARE MARKET, BY APPLICATION, 2020-2029 (USD THOUSAND)
TABLE 156 COSTA RICA TREASURY SOFTWARE MARKET, BY OPERATING SYSTEM, 2020-2029 (USD THOUSAND)
TABLE 157 COSTA RICA TREASURY SOFTWARE MARKET, BY APPLICATION, 2020-2029 (USD THOUSAND)
TABLE 158 COSTA RICA TREASURY SOFTWARE MARKET, BY DEPLOYMENT MODEL, 2020-2029 (USD THOUSAND)
TABLE 159 COSTA RICA CLOUD IN TREASURY SOFTWARE MARKET, BY TYPE, 2020-2029 (USD THOUSAND)
TABLE 160 COSTA RICA TREASURY SOFTWARE MARKET, BY ORGANISATION SIZE, 2020-2029 (USD THOUSAND)
TABLE 161 COSTA RICA TREASURY SOFTWARE MARKET, BY VERTICAL, 2020-2029 (USD THOUSAND)
TABLE 162 COSTA RICA BANKING, FINANCIAL SERVICES AND INSURANCE (BFSI) IN TREASURY SOFTWARE MARKET, BY APPLICATION, 2020-2029 (USD THOUSAND)
TABLE 163 COSTA RICA GOVERNMENT IN TREASURY SOFTWARE MARKET, BY APPLICATION, 2020-2029 (USD THOUSAND)
TABLE 164 COSTA RICA MANUFACTURING IN TREASURY SOFTWARE MARKET, BY APPLICATION, 2020-2029 (USD THOUSAND)
TABLE 165 COSTA RICA HEALTHCARE IN TREASURY SOFTWARE MARKET, BY APPLICATION, 2020-2029 (USD THOUSAND)
TABLE 166 COSTA RICA CONSUMER GOODS IN TREASURY SOFTWARE MARKET, BY APPLICATION, 2020-2029 (USD THOUSAND)
TABLE 167 COSTA RICA CHEMICALS IN TREASURY SOFTWARE MARKET, BY APPLICATION, 2020-2029 (USD THOUSAND)
TABLE 168 COSTA RICA ENERGY IN TREASURY SOFTWARE MARKET, BY APPLICATION, 2020-2029 (USD THOUSAND)
TABLE 169 COSTA RICA OTHERS IN TREASURY SOFTWARE MARKET, BY APPLICATION, 2020-2029 (USD THOUSAND)
TABLE 170 ECUADOR TREASURY SOFTWARE MARKET, BY OPERATING SYSTEM, 2020-2029 (USD THOUSAND)
TABLE 171 ECUADOR TREASURY SOFTWARE MARKET, BY APPLICATION, 2020-2029 (USD THOUSAND)
TABLE 172 ECUADOR TREASURY SOFTWARE MARKET, BY DEPLOYMENT MODEL, 2020-2029 (USD THOUSAND)
TABLE 173 ECUADOR CLOUD IN TREASURY SOFTWARE MARKET, BY TYPE, 2020-2029 (USD THOUSAND)
TABLE 174 ECUADOR TREASURY SOFTWARE MARKET, BY ORGANISATION SIZE, 2020-2029 (USD THOUSAND)
TABLE 175 ECUADOR TREASURY SOFTWARE MARKET, BY VERTICAL, 2020-2029 (USD THOUSAND)
TABLE 176 ECUADOR BANKING, FINANCIAL SERVICES AND INSURANCE (BFSI) IN TREASURY SOFTWARE MARKET, BY APPLICATION, 2020-2029 (USD THOUSAND)
TABLE 177 ECUADOR GOVERNMENT IN TREASURY SOFTWARE MARKET, BY APPLICATION, 2020-2029 (USD THOUSAND)
TABLE 178 ECUADOR MANUFACTURING IN TREASURY SOFTWARE MARKET, BY APPLICATION, 2020-2029 (USD THOUSAND)
TABLE 179 ECUADOR HEALTHCARE IN TREASURY SOFTWARE MARKET, BY APPLICATION, 2020-2029 (USD THOUSAND)
TABLE 180 ECUADOR CONSUMER GOODS IN TREASURY SOFTWARE MARKET, BY APPLICATION, 2020-2029 (USD THOUSAND)
TABLE 181 ECUADOR CHEMICALS IN TREASURY SOFTWARE MARKET, BY APPLICATION, 2020-2029 (USD THOUSAND)
TABLE 182 ECUADOR ENERGY IN TREASURY SOFTWARE MARKET, BY APPLICATION, 2020-2029 (USD THOUSAND)
TABLE 183 ECUADOR OTHERS IN TREASURY SOFTWARE MARKET, BY APPLICATION, 2020-2029 (USD THOUSAND)
TABLE 184 HONDURAS TREASURY SOFTWARE MARKET, BY OPERATING SYSTEM, 2020-2029 (USD THOUSAND)
TABLE 185 HONDURAS TREASURY SOFTWARE MARKET, BY APPLICATION, 2020-2029 (USD THOUSAND)
TABLE 186 HONDURAS TREASURY SOFTWARE MARKET, BY DEPLOYMENT MODEL, 2020-2029 (USD THOUSAND)
TABLE 187 HONDURAS CLOUD IN TREASURY SOFTWARE MARKET, BY TYPE, 2020-2029 (USD THOUSAND)
TABLE 188 HONDURAS TREASURY SOFTWARE MARKET, BY ORGANISATION SIZE, 2020-2029 (USD THOUSAND)
TABLE 189 HONDURAS TREASURY SOFTWARE MARKET, BY VERTICAL, 2020-2029 (USD THOUSAND)
TABLE 190 HONDURAS BANKING, FINANCIAL SERVICES AND INSURANCE (BFSI) IN TREASURY SOFTWARE MARKET, BY APPLICATION, 2020-2029 (USD THOUSAND)
TABLE 191 HONDURAS GOVERNMENT IN TREASURY SOFTWARE MARKET, BY APPLICATION, 2020-2029 (USD THOUSAND)
TABLE 192 HONDURAS MANUFACTURING IN TREASURY SOFTWARE MARKET, BY APPLICATION, 2020-2029 (USD THOUSAND)
TABLE 193 HONDURAS HEALTHCARE IN TREASURY SOFTWARE MARKET, BY APPLICATION, 2020-2029 (USD THOUSAND)
TABLE 194 HONDURAS CONSUMER GOODS IN TREASURY SOFTWARE MARKET, BY APPLICATION, 2020-2029 (USD THOUSAND)
TABLE 195 HONDURAS CHEMICALS IN TREASURY SOFTWARE MARKET, BY APPLICATION, 2020-2029 (USD THOUSAND)
TABLE 196 HONDURAS ENERGY IN TREASURY SOFTWARE MARKET, BY APPLICATION, 2020-2029 (USD THOUSAND)
TABLE 197 HONDURAS OTHERS IN TREASURY SOFTWARE MARKET, BY APPLICATION, 2020-2029 (USD THOUSAND)
TABLE 198 GUATEMALA TREASURY SOFTWARE MARKET, BY OPERATING SYSTEM, 2020-2029 (USD THOUSAND)
TABLE 199 GUATEMALA TREASURY SOFTWARE MARKET, BY APPLICATION, 2020-2029 (USD THOUSAND)
TABLE 200 GUATEMALA TREASURY SOFTWARE MARKET, BY DEPLOYMENT MODEL, 2020-2029 (USD THOUSAND)
TABLE 201 GUATEMALA CLOUD IN TREASURY SOFTWARE MARKET, BY TYPE, 2020-2029 (USD THOUSAND)
TABLE 202 GUATEMALA TREASURY SOFTWARE MARKET, BY ORGANISATION SIZE, 2020-2029 (USD THOUSAND)
TABLE 203 GUATEMALA TREASURY SOFTWARE MARKET, BY VERTICAL, 2020-2029 (USD THOUSAND)
TABLE 204 GUATEMALA BANKING, FINANCIAL SERVICES AND INSURANCE (BFSI) IN TREASURY SOFTWARE MARKET, BY APPLICATION, 2020-2029 (USD THOUSAND)
TABLE 205 GUATEMALA GOVERNMENT IN TREASURY SOFTWARE MARKET, BY APPLICATION, 2020-2029 (USD THOUSAND)
TABLE 206 GUATEMALA MANUFACTURING IN TREASURY SOFTWARE MARKET, BY APPLICATION, 2020-2029 (USD THOUSAND)
TABLE 207 GUATEMALA HEALTHCARE IN TREASURY SOFTWARE MARKET, BY APPLICATION, 2020-2029 (USD THOUSAND)
TABLE 208 GUATEMALA CONSUMER GOODS IN TREASURY SOFTWARE MARKET, BY APPLICATION, 2020-2029 (USD THOUSAND)
TABLE 209 GUATEMALA CHEMICALS IN TREASURY SOFTWARE MARKET, BY APPLICATION, 2020-2029 (USD THOUSAND)
TABLE 210 GUATEMALA ENERGY IN TREASURY SOFTWARE MARKET, BY APPLICATION, 2020-2029 (USD THOUSAND)
TABLE 211 GUATEMALA OTHERS IN TREASURY SOFTWARE MARKET, BY APPLICATION, 2020-2029 (USD THOUSAND)
TABLE 212 EL SALVADOR TREASURY SOFTWARE MARKET, BY OPERATING SYSTEM, 2020-2029 (USD THOUSAND)
TABLE 213 EL SALVADOR TREASURY SOFTWARE MARKET, BY APPLICATION, 2020-2029 (USD THOUSAND)
TABLE 214 EL SALVADOR TREASURY SOFTWARE MARKET, BY DEPLOYMENT MODEL, 2020-2029 (USD THOUSAND)
TABLE 215 EL SALVADOR CLOUD IN TREASURY SOFTWARE MARKET, BY TYPE, 2020-2029 (USD THOUSAND)
TABLE 216 EL SALVADOR TREASURY SOFTWARE MARKET, BY ORGANISATION SIZE, 2020-2029 (USD THOUSAND)
TABLE 217 EL SALVADOR TREASURY SOFTWARE MARKET, BY VERTICAL, 2020-2029 (USD THOUSAND)
TABLE 218 EL SALVADOR BANKING, FINANCIAL SERVICES AND INSURANCE (BFSI) IN TREASURY SOFTWARE MARKET, BY APPLICATION, 2020-2029 (USD THOUSAND)
TABLE 219 EL SALVADOR GOVERNMENT IN TREASURY SOFTWARE MARKET, BY APPLICATION, 2020-2029 (USD THOUSAND)
TABLE 220 EL SALVADOR MANUFACTURING IN TREASURY SOFTWARE MARKET, BY APPLICATION, 2020-2029 (USD THOUSAND)
TABLE 221 EL SALVADOR HEALTHCARE IN TREASURY SOFTWARE MARKET, BY APPLICATION, 2020-2029 (USD THOUSAND)
TABLE 222 EL SALVADOR CONSUMER GOODS IN TREASURY SOFTWARE MARKET, BY APPLICATION, 2020-2029 (USD THOUSAND)
TABLE 223 EL SALVADOR CHEMICALS IN TREASURY SOFTWARE MARKET, BY APPLICATION, 2020-2029 (USD THOUSAND)
TABLE 224 EL SALVADOR ENERGY IN TREASURY SOFTWARE MARKET, BY APPLICATION, 2020-2029 (USD THOUSAND)
TABLE 225 EL SALVADOR OTHERS IN TREASURY SOFTWARE MARKET, BY APPLICATION, 2020-2029 (USD THOUSAND)
TABLE 226 THE DOMINICAN REPUBLIC TREASURY SOFTWARE MARKET, BY OPERATING SYSTEM, 2020-2029 (USD THOUSAND)
TABLE 227 THE DOMINICAN REPUBLIC TREASURY SOFTWARE MARKET, BY APPLICATION, 2020-2029 (USD THOUSAND)
TABLE 228 THE DOMINICAN REPUBLIC TREASURY SOFTWARE MARKET, BY DEPLOYMENT MODEL, 2020-2029 (USD THOUSAND)
TABLE 229 THE DOMINICAN REPUBLIC CLOUD IN TREASURY SOFTWARE MARKET, BY TYPE, 2020-2029 (USD THOUSAND)
TABLE 230 THE DOMINICAN REPUBLIC TREASURY SOFTWARE MARKET, BY ORGANISATION SIZE, 2020-2029 (USD THOUSAND)
TABLE 231 THE DOMINICAN REPUBLIC TREASURY SOFTWARE MARKET, BY VERTICAL, 2020-2029 (USD THOUSAND)
TABLE 232 THE DOMINICAN REPUBLIC BANKING, FINANCIAL SERVICES AND INSURANCE (BFSI) IN TREASURY SOFTWARE MARKET, BY APPLICATION, 2020-2029 (USD THOUSAND)
TABLE 233 THE DOMINICAN REPUBLIC GOVERNMENT IN TREASURY SOFTWARE MARKET, BY APPLICATION, 2020-2029 (USD THOUSAND)
TABLE 234 THE DOMINICAN REPUBLIC MANUFACTURING IN TREASURY SOFTWARE MARKET, BY APPLICATION, 2020-2029 (USD THOUSAND)
TABLE 235 THE DOMINICAN REPUBLIC HEALTHCARE IN TREASURY SOFTWARE MARKET, BY APPLICATION, 2020-2029 (USD THOUSAND)
TABLE 236 THE DOMINICAN REPUBLIC CONSUMER GOODS IN TREASURY SOFTWARE MARKET, BY APPLICATION, 2020-2029 (USD THOUSAND)
TABLE 237 THE DOMINICAN REPUBLIC CHEMICALS IN TREASURY SOFTWARE MARKET, BY APPLICATION, 2020-2029 (USD THOUSAND)
TABLE 238 THE DOMINICAN REPUBLIC ENERGY IN TREASURY SOFTWARE MARKET, BY APPLICATION, 2020-2029 (USD THOUSAND)
TABLE 239 THE DOMINICAN REPUBLIC OTHERS IN TREASURY SOFTWARE MARKET, BY APPLICATION, 2020-2029 (USD THOUSAND)
TABLE 240 REST OF LATIN AMERICA TREASURY SOFTWARE MARKET, BY OPERATING SYSTEM, 2020-2029 (USD THOUSAND)
Liste des figures
FIGURE 1 LATIN AMERICA TREASURY SOFTWARE MARKET: SEGMENTATION
FIGURE 2 LATIN AMERICA TREASURY SOFTWARE MARKET: DATA TRIANGULATION
FIGURE 3 LATIN AMERICA TREASURY SOFTWARE MARKET: DROC ANALYSIS
FIGURE 4 LATIN AMERICA TREASURY SOFTWARE MARKET: REGIONAL VS COUNTRY MARKET ANALYSIS
FIGURE 5 LATIN AMERICA TREASURY SOFTWARE MARKET: COMPANY RESEARCH ANALYSIS
FIGURE 6 LATIN AMERICA TREASURY SOFTWARE MARKET: INTERVIEW DEMOGRAPHICS
FIGURE 7 LATIN AMERICA TREASURY SOFTWARE MARKET: DBMR MARKET POSITION GRID
FIGURE 8 LATIN AMERICA TREASURY SOFTWARE MARKET: VENDOR SHARE ANALYSIS
FIGURE 9 LATIN AMERICA TREASURY SOFTWARE MARKET: END-USER COVERAGE GRID
FIGURE 10 LATIN AMERICA TREASURY SOFTWARE MARKET: SEGMENTATION
FIGURE 11 INCREASING ADOPTION OF SMART ELECTRONIC PAYMENT MANAGEMENT TOOLS IS EXPECTED TO DRIVE THE LATIN AMERICA TREASURY SOFTWARE MARKET IN THE FORECAST PERIOD OF 2022 TO 2029
FIGURE 12 WINDOWS SEGMENT IS EXPECTED TO ACCOUNT FOR THE LARGEST SHARE OF THE LATIN AMERICA TREASURY SOFTWARE MARKET IN 2022 & 2029
FIGURE 13 DRIVERS, RESTRAINTS, OPPORTUNITIES, AND CHALLENGES OF THE LATIN AMERICA TREASURY SOFTWARE MARKET
FIGURE 14 MOBILE PAYMENTS SHARE (%) BY COUNTRY
FIGURE 15 FACTORS AFFECTING THE TMS AND CUSTOMER EXPERIENCE
FIGURE 16 THREE WAYS ARTIFICIAL INTELLIGENCE IS TRANSFORMING TREASURY
FIGURE 17 CYBER-ATTACKS INCIDENTS BY COUNTRY AND REGION IN 2020
FIGURE 18 TECHNOLOGIES USED IN TREASURY DEPARTMENT CURRENTLY
FIGURE 19 LATIN AMERICA TREASURY SOFTWARE MARKET: BY OPERATING SYSTEM, 2021
FIGURE 20 LATIN AMERICA TREASURY SOFTWARE MARKET: BY APPLICATION, 2021
FIGURE 21 LATIN AMERICA TREASURY SOFTWARE MARKET: BY ORGANIZATION SIZE, 2021
FIGURE 22 LATIN AMERICA TREASURY SOFTWARE MARKET: BY DEPLOYMENT MODEL, 2021
FIGURE 23 LATIN AMERICA TREASURY SOFTWARE MARKET: BY VERTICAL, 2021
FIGURE 24 LATIN AMERICA TREASURY SOFTWARE MARKET: SNAPSHOT (2021)
FIGURE 25 LATIN AMERICA TREASURY SOFTWARE MARKET: BY COUNTRY (2021)
FIGURE 26 LATIN AMERICA TREASURY SOFTWARE MARKET: BY COUNTRY (2022 & 2029)
FIGURE 27 LATIN AMERICA TREASURY SOFTWARE MARKET: BY COUNTRY (2021 & 2029)
FIGURE 28 LATIN AMERICA TREASURY SOFTWARE MARKET: BY OPERATING SYSTEM (2022-2029)
FIGURE 29 LATIN AMERICA TREASURY SOFTWARE MARKET: COMPANY SHARE 2021 (%)
Méthodologie de recherche
La collecte de données et l'analyse de l'année de base sont effectuées à l'aide de modules de collecte de données avec des échantillons de grande taille. L'étape consiste à obtenir des informations sur le marché ou des données connexes via diverses sources et stratégies. Elle comprend l'examen et la planification à l'avance de toutes les données acquises dans le passé. Elle englobe également l'examen des incohérences d'informations observées dans différentes sources d'informations. Les données de marché sont analysées et estimées à l'aide de modèles statistiques et cohérents de marché. De plus, l'analyse des parts de marché et l'analyse des tendances clés sont les principaux facteurs de succès du rapport de marché. Pour en savoir plus, veuillez demander un appel d'analyste ou déposer votre demande.
La méthodologie de recherche clé utilisée par l'équipe de recherche DBMR est la triangulation des données qui implique l'exploration de données, l'analyse de l'impact des variables de données sur le marché et la validation primaire (expert du secteur). Les modèles de données incluent la grille de positionnement des fournisseurs, l'analyse de la chronologie du marché, l'aperçu et le guide du marché, la grille de positionnement des entreprises, l'analyse des brevets, l'analyse des prix, l'analyse des parts de marché des entreprises, les normes de mesure, l'analyse globale par rapport à l'analyse régionale et des parts des fournisseurs. Pour en savoir plus sur la méthodologie de recherche, envoyez une demande pour parler à nos experts du secteur.
Personnalisation disponible
Data Bridge Market Research est un leader de la recherche formative avancée. Nous sommes fiers de fournir à nos clients existants et nouveaux des données et des analyses qui correspondent à leurs objectifs. Le rapport peut être personnalisé pour inclure une analyse des tendances des prix des marques cibles, une compréhension du marché pour d'autres pays (demandez la liste des pays), des données sur les résultats des essais cliniques, une revue de la littérature, une analyse du marché des produits remis à neuf et de la base de produits. L'analyse du marché des concurrents cibles peut être analysée à partir d'une analyse basée sur la technologie jusqu'à des stratégies de portefeuille de marché. Nous pouvons ajouter autant de concurrents que vous le souhaitez, dans le format et le style de données que vous recherchez. Notre équipe d'analystes peut également vous fournir des données sous forme de fichiers Excel bruts, de tableaux croisés dynamiques (Fact book) ou peut vous aider à créer des présentations à partir des ensembles de données disponibles dans le rapport.

