
Global Self Organizing Network Son Market
Taille du marché en milliards USD
TCAC :
% 
 USD
7.26 Billion
USD
19.72 Billion
2024
2032
USD
7.26 Billion
USD
19.72 Billion
2024
2032
| 2025 –2032 | |
| USD 7.26 Billion | |
| USD 19.72 Billion | |
| % | |
|
Segmentation du marché mondial des réseaux auto-organisés (SON), par offre (logiciels et services), réseau (RAN, Wi-Fi, réseau central et backhaul), architecture (C-SON (centralisé), D-SON (décentralisé) et H-SON (hybride)), technologie réseau (4G/LTE, 2G/3G et 5G), application (sécurité et authentification réseau, WAP, communication inter-machines, système de positionnement global, jeux et autres) - Tendances et prévisions du secteur jusqu'en 2032
Taille du marché des réseaux auto-organisés (SON)
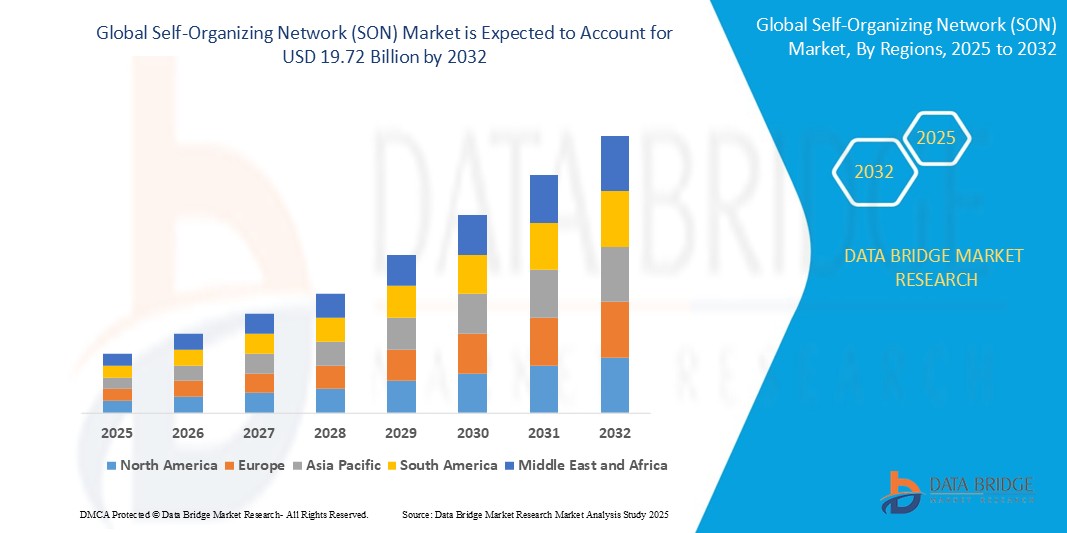
- La taille du marché mondial des réseaux auto-organisés (SON) était évaluée à 7,26 milliards USD en 2024 et devrait atteindre 19,72 milliards USD d'ici 2032 , à un TCAC de 13,30 % au cours de la période de prévision.
- La croissance du marché est largement alimentée par l’adoption rapide des réseaux 5G, la complexité croissante des réseaux, la demande croissante d’automatisation dans la gestion des réseaux et la nécessité de réduire les coûts opérationnels.
- De plus, le nombre croissant d’appareils connectés et de trafic de données pousse les opérateurs de télécommunications à investir dans des technologies intelligentes et auto-optimisées telles que SON pour améliorer les performances du réseau, l’évolutivité et l’expérience utilisateur.
Analyse du marché des réseaux auto-organisés (SON)
- Le marché des réseaux auto-organisés connaît une forte dynamique, portée par le besoin croissant de gestion intelligente des réseaux.
- L'innovation continue dans les technologies réseau façonne le paysage concurrentiel de ce marché. Les principaux acteurs se concentrent sur l'optimisation des performances et la fluidité des expériences utilisateur grâce à des solutions adaptatives.
- L'Amérique du Nord domine le marché des réseaux auto-organisés (SON) avec la plus grande part de revenus de 78,5 % en 2025, grâce à des investissements solides dans la 5G, à l'adoption précoce de la technologie et à la présence d'acteurs majeurs des télécommunications.
- L'Asie-Pacifique devrait être la région connaissant la croissance la plus rapide sur le marché des réseaux auto-organisés (SON) au cours de la période de prévision en raison de la pénétration croissante de la téléphonie mobile, de l'expansion des infrastructures de télécommunications et de l'accélération des initiatives numériques dans les économies émergentes.
- Le segment des logiciels détenait la plus grande part de chiffre d'affaires du marché en 2025, propulsé par le rôle essentiel des logiciels SON dans l'automatisation des processus de configuration, d'optimisation et de réparation des réseaux. Face à la complexité croissante des réseaux, la demande de solutions logicielles sophistiquées pour les gérer efficacement continuera de stimuler ce segment. Les logiciels prennent également en charge l'analyse en temps réel et l'apprentissage adaptatif, permettant aux réseaux de réagir proactivement aux fluctuations du trafic. Par ailleurs, les principaux opérateurs de télécommunications investissent dans des logiciels SON basés sur l'IA afin d'améliorer l'évolutivité et de réduire les coûts opérationnels. Cette innovation continue devrait maintenir la domination du segment des logiciels tout au long de la période de prévision.
Portée du rapport et segmentation du marché des réseaux auto-organisés (SON)
|
Attributs |
Informations clés sur le marché des réseaux auto-organisés (SON) |
|
Segments couverts |
|
|
Pays couverts |
Amérique du Nord
Europe
Asie-Pacifique
Moyen-Orient et Afrique
Amérique du Sud
|
|
Acteurs clés du marché |
|
|
Opportunités de marché |
|
|
Ensembles d'informations de données à valeur ajoutée |
Outre les informations sur les scénarios de marché tels que la valeur marchande, le taux de croissance, la segmentation, la couverture géographique et les principaux acteurs, les rapports de marché organisés par Data Bridge Market Research comprennent également une analyse approfondie par des experts, une production et une capacité géographiquement représentées par entreprise, des configurations de réseau de distributeurs et de partenaires, une analyse détaillée et mise à jour des tendances des prix et une analyse des déficits de la chaîne d'approvisionnement et de la demande. |
Tendances du marché des réseaux auto-organisés (SON)
« Intégration accrue de l'intelligence artificielle dans les solutions de réseaux auto-organisés »
- L'intelligence artificielle est de plus en plus intégrée dans des solutions de réseau auto-organisées pour améliorer la prise de décision et l'automatisation en temps réel
- Les fournisseurs de télécommunications utilisent des outils basés sur l'IA pour la maintenance prédictive et la détection des anomalies, contribuant ainsi à réduire les temps d'arrêt et à améliorer la fiabilité du réseau.
- Par exemple, les principaux opérateurs de réseau tels qu'AT&T et Vodafone exploitent des algorithmes d'apprentissage automatique pour optimiser le flux de trafic et l'expérience utilisateur.
- L'intégration de l'IA permet également aux réseaux de s'adapter de manière dynamique aux changements de trafic et aux demandes des utilisateurs, ce qui conduit à une utilisation plus efficace du spectre et à des coûts opérationnels réduits.
- Par exemple, les analyses basées sur l'IA réalisées par des entreprises telles qu'Ericsson et Huawei améliorent la planification du réseau et permettent des capacités d'auto-réparation, rendant ainsi les réseaux plus résilients et prêts pour l'avenir.
Dynamique du marché des réseaux auto-organisés (SON)
Conducteur
« Augmentation du trafic de données et de la complexité du réseau »
- L'utilisation croissante des smartphones, des plateformes de streaming et des appareils connectés augmente considérablement le trafic de données mobiles, mettant ainsi sous pression l'infrastructure réseau
- Par exemple, l’essor du streaming vidéo sur des plateformes telles que Netflix et YouTube a entraîné une consommation massive de données à l’échelle mondiale.
- À mesure que les réseaux gagnent en ampleur et en complexité, maintenir une qualité de service constante grâce à une configuration manuelle est devenu inefficace et peu pratique.
- Les réseaux auto-organisés offrent des capacités automatisées pour configurer, optimiser et réparer les réseaux en temps réel, réduisant ainsi la charge des opérateurs humains
- Ces systèmes contribuent à réduire les coûts opérationnels et les erreurs humaines tout en garantissant des performances efficaces sur des charges de trafic et des modèles d'utilisation variés.
- Le besoin croissant d'une connectivité fiable et à haut débit pousse les fournisseurs de télécommunications à adopter des solutions de réseau intelligentes, faisant du SON un élément essentiel des mises à niveau des infrastructures.
Retenue/Défi
« Intégration avec l'infrastructure existante »
- L'intégration de technologies de réseau auto-organisées avec une infrastructure existante constitue un défi majeur, car les systèmes plus anciens manquent souvent de compatibilité avec les outils d'automatisation modernes.
- Par exemple, les réseaux 2G ou 3G traditionnels utilisés par certains fournisseurs ne sont pas conçus pour prendre en charge les fonctionnalités SON sans modifications importantes.
- Ce manque d'interopérabilité augmente la complexité et le temps requis pour le déploiement, nécessitant souvent des approches d'intégration personnalisées pour chaque environnement réseau
- Les opérateurs de télécommunications doivent fréquemment investir dans des mises à niveau d'infrastructure coûteuses ou dans des solutions tierces pour permettre une intégration transparente, ce qui peut mettre à rude épreuve les ressources financières.
- La pénurie de professionnels qualifiés formés à l’automatisation avancée des réseaux entrave encore davantage le processus de mise en œuvre, en particulier dans les régions à faibles ressources.
- Ces barrières opérationnelles et financières peuvent amener certains fournisseurs à reporter ou à réduire leurs investissements SON, limitant ainsi le taux d'adoption global et ralentissant les progrès technologiques sur certains marchés.
Portée du marché des réseaux auto-organisés (SON)
Le marché mondial des réseaux auto-organisés est segmenté en fonction de l'offre, du réseau, de l'architecture, de la technologie du réseau et de l'application.
- En offrant
Sur la base de l'offre, le marché des réseaux auto-organisés (SON) est segmenté en logiciels et services. Le segment des logiciels détenait la plus grande part de chiffre d'affaires en 2025, grâce au rôle crucial des logiciels SON dans l'automatisation des processus de configuration, d'optimisation et de réparation des réseaux. Face à la complexité croissante des réseaux, la demande de solutions logicielles sophistiquées pour les gérer efficacement continuera de stimuler ce segment. Les logiciels prennent également en charge l'analyse en temps réel et l'apprentissage adaptatif, permettant aux réseaux de réagir proactivement aux fluctuations du trafic. Par ailleurs, les principaux opérateurs de télécommunications investissent dans des logiciels SON basés sur l'IA afin d'améliorer l'évolutivité et de réduire les coûts opérationnels. Cette innovation continue devrait maintenir la domination du segment des logiciels tout au long de la période de prévision.
Le segment des services devrait connaître la croissance la plus rapide entre 2025 et 2032, alimenté par le besoin croissant d'expertise en matière de déploiement, d'intégration et de maintenance des solutions SON. Les opérateurs télécoms et les entreprises s'appuient de plus en plus sur des services professionnels pour optimiser leurs investissements SON. Ces services comprennent le conseil, la mise en œuvre, la formation et le support technique, autant de services essentiels à la réussite d'un déploiement. Avec le dynamisme croissant des environnements réseau, la demande de services gérés augmente également. La tendance à l'externalisation des opérations SON auprès de prestataires spécialisés accélérera encore la croissance du segment des services.
- Par réseau
Sur la base du réseau, le marché des réseaux auto-organisés (SON) est segmenté en RAN, Wi-Fi, réseau central et backhaul. Le segment RAN a dominé la plus grande part de chiffre d'affaires du marché en 2025, grâce à son impact significatif sur l'optimisation des performances des réseaux d'accès radio, essentielle pour les opérateurs de réseaux mobiles afin d'offrir une connectivité fluide et des débits de données élevés. Avec l'expansion rapide de la 5G et les attentes croissantes des utilisateurs, l'optimisation du RAN est devenue une priorité pour les opérateurs de télécommunications. Le SON améliore l'efficacité du RAN en automatisant des tâches telles que l'équilibrage de charge, la réduction des interférences et l'optimisation de la couverture. Les opérateurs bénéficient d'une meilleure qualité de service et de coûts d'exploitation réduits. Les progrès continus des technologies RAN et leur intégration aux plateformes SON devraient permettre à ce segment de conserver sa position de leader.
Le segment Wi-Fi devrait connaître le TCAC le plus rapide entre 2025 et 2032, stimulé par la densité croissante des réseaux Wi-Fi et la demande croissante de solutions Wi-Fi auto-optimisées, tant pour les particuliers que pour les entreprises, afin de garantir une connectivité sans fil fiable et constante . Alors que les utilisateurs dépendent de plus en plus du Wi-Fi pour le streaming, les jeux et le télétravail, les attentes en matière de performances ne cessent d'augmenter. Les solutions SON pour Wi-Fi permettent de gérer les interférences entre les canaux, d'optimiser la puissance du signal et d'ajuster automatiquement les configurations. Les entreprises déploient également des systèmes Wi-Fi compatibles SON pour prendre en charge des volumes importants d'appareils et maintenir la satisfaction des utilisateurs. Ces tendances accélèrent l'adoption du SON dans le segment Wi-Fi, et ce dans divers secteurs.
- Par Architecture
Sur la base de l'architecture, le marché des réseaux auto-organisés (SON) est segmenté en C-SON (centralisé), D-SON (décentralisé) et H-SON (hybride). Le segment C-SON détenait la plus grande part de chiffre d'affaires du marché en 2025, grâce à l'adoption précoce et aux avantages avérés du contrôle centralisé pour la gestion des ressources réseau et la mise en œuvre d'algorithmes d'optimisation. Les réseaux auto-organisés centralisés permettent une planification coordonnée du réseau et une optimisation globale sur plusieurs cellules, ce qui est particulièrement avantageux pour les déploiements à grande échelle. Les opérateurs privilégient C-SON pour sa capacité à offrir des améliorations de performances constantes et à prendre en charge l'intégration avec les systèmes de gestion de réseau existants. Son approche structurée facilite les mises à niveau et les analyses centralisées. Alors que les opérateurs continuent de privilégier le contrôle et la visibilité, C-SON devrait maintenir une forte présence sur le marché.
Le segment H-SON devrait connaître la croissance la plus rapide entre 2025 et 2032, porté par la reconnaissance croissante des avantages de la combinaison d'approches centralisées et décentralisées pour une gestion des réseaux plus flexible, évolutive et résiliente. H-SON exploite les atouts des approches C-SON et D-SON pour permettre des réponses en temps réel en périphérie tout en assurant un contrôle coordonné et centralisé. Ce modèle hybride est idéal pour les environnements dynamiques, tels que la 5G et les réseaux urbains denses, où les conditions du réseau peuvent évoluer rapidement. Face à l'évolution des architectures réseau, H-SON offre une solution équilibrée qui s'adapte aux besoins mondiaux et locaux. Sa capacité à prendre en charge des cas d'usage avancés en fait un choix attractif pour les réseaux d'avenir.
- Par la technologie réseau
En fonction de la technologie réseau, le marché des réseaux auto-organisés (SON) est segmenté en 4G/LTE, 2G/3G et 5G. Le segment 4G/LTE représentait la plus grande part de chiffre d'affaires du marché en 2025, grâce au déploiement massif des réseaux LTE à l'échelle mondiale et au besoin constant d'optimisation pour améliorer l'expérience utilisateur et l'efficacité du réseau. Le LTE reste le pilier de nombreux réseaux mobiles, en particulier dans les régions où la 5G est encore émergente. Les solutions de réseau auto-organisées sont essentielles pour optimiser les performances LTE, gérer les transferts, équilibrer les charges de trafic et réduire les interruptions d'appels. Les opérateurs continuent d'investir dans le SON pour LTE afin de maintenir la qualité de service face à la demande croissante des utilisateurs. Ce segment devrait maintenir une demande stable, le LTE servant de solution de repli aux nouvelles technologies réseau.
- Par application
En fonction des applications, le marché des réseaux auto-organisés (SON) est segmenté en sécurité et authentification réseau, WAP, communication inter-machines, GPS, jeux vidéo, etc. En 2025, ce segment détenait la plus grande part de chiffre d'affaires, porté par l'importance croissante des mesures de sécurité automatisées et de la gestion des identités dans les environnements réseau complexes. À mesure que les réseaux deviennent plus intelligents et interconnectés, sécuriser les accès et garantir une communication fiable entre les appareils est crucial. Les réseaux auto-organisés prennent en charge la détection des menaces en temps réel, la gestion des anomalies et l'application automatique des politiques, essentielles au maintien de l'intégrité des données et de la confidentialité des utilisateurs. Les opérateurs privilégient les fonctionnalités SON axées sur la sécurité pour se protéger contre les cybermenaces et les vulnérabilités croissantes. Cette priorité fait de ce segment un axe d'investissement clé dans les infrastructures de télécommunications modernes.
Le segment des communications intermachines devrait connaître le TCAC le plus rapide entre 2025 et 2032, propulsé par la prolifération des objets connectés et le besoin de capacités d'auto-organisation pour gérer l'ampleur et la nature dynamique des réseaux de communication intermachines. Ces réseaux impliquent souvent un grand nombre d'appareils connectés fonctionnant avec une intervention humaine minimale. Les technologies SON jouent un rôle crucial dans l'automatisation de la connectivité, l'optimisation des performances et la réduction de la latence dans ces scénarios. Alors que des secteurs comme l'industrie manufacturière, les transports et la santé s'appuient de plus en plus sur les écosystèmes IoT, la demande d'outils de gestion de réseau évolutifs et autonomes s'accélère. La capacité des technologies SON à s'adapter en temps réel à l'évolution des modes de communication des machines soutient leur croissance rapide dans ce segment.
Analyse régionale du marché des réseaux auto-organisés (SON)
- Le marché nord-américain des réseaux auto-organisés détenait la plus grande part de revenus, soit 78,5 %, en raison de son infrastructure technologique bien établie et de sa volonté d'adopter des solutions de réseau avancées.
- Par exemple, les États-Unis ont toujours été à l’avant-garde de la mise en œuvre de technologies d’automatisation dans les opérations de télécommunications.
- La forte demande de connectivité ininterrompue et de performances réseau améliorées aux États-Unis et au Canada favorise l'adoption généralisée des technologies SON.
- La présence de sociétés de télécommunications de premier plan telles qu'AT&T et Verizon contribue de manière significative à l'expansion du marché grâce à des déploiements et des innovations SON à grande échelle.
- Des investissements substantiels dans les mises à niveau du réseau, y compris le déploiement rapide de la 5G, répondent au besoin croissant de systèmes de gestion de réseau intelligents et automatisés.
- L’accent mis sur l’innovation et l’adoption précoce des technologies de nouvelle génération positionne l’Amérique du Nord comme un leader mondial dans le paysage des réseaux auto-organisés.
Aperçu du marché du réseau auto-organisé américain (SON)
En 2025, le marché américain des réseaux SON détenait la plus grande part de chiffre d'affaires en Amérique du Nord, avec 78,5 %, grâce à l'adoption précoce de technologies réseau avancées et à la complexité croissante des réseaux mobiles et d'entreprise. L'accent mis sur la performance réseau et l'expérience utilisateur stimule la demande de solutions d'optimisation réseau automatisées. De plus, la présence de grands opérateurs de télécommunications et le déploiement rapide de l'infrastructure 5G contribuent significativement à l'expansion du marché.
Aperçu du marché du Réseau européen d'auto-organisation (SON)
Le marché européen des réseaux SON devrait connaître une croissance soutenue tout au long de la période de prévision, principalement portée par des réglementations strictes en matière de qualité des réseaux et par le besoin croissant d'une gestion efficace des réseaux dans les zones urbaines densément peuplées. L'adoption croissante des services cloud et la demande croissante de connectivité fluide entre diverses applications favorisent l'adoption des solutions SON. La région connaît une croissance significative auprès des opérateurs de réseaux mobiles et des grandes entreprises cherchant à optimiser leur infrastructure réseau.
Aperçu du marché du réseau d'auto-organisation britannique (SON)
Le marché britannique des SON devrait connaître une croissance annuelle moyenne (TCAC) remarquable au cours de la période de prévision, portée par l'adoption croissante du haut débit mobile et la volonté d'améliorer l'efficacité et la fiabilité des réseaux. De plus, les investissements continus dans les initiatives de villes intelligentes et la demande croissante de services de données à haut débit incitent les opérateurs mobiles et les entreprises à opter pour des solutions de gestion de réseau automatisées. La robustesse des infrastructures de télécommunications du Royaume-Uni et la présence de fournisseurs de technologies innovantes devraient continuer de stimuler la croissance du marché.
Aperçu du marché du réseau auto-organisé allemand (SON)
Le marché allemand des SON devrait connaître une croissance TCAC considérable au cours de la période de prévision, alimentée par une prise de conscience croissante des avantages de l'optimisation des réseaux et par la demande croissante de solutions réseau performantes et à la pointe de la technologie. L'infrastructure de télécommunications bien développée de l'Allemagne, combinée à l'importance accordée à l'automatisation industrielle et à l'adoption de l'IoT, favorise le déploiement des SON, notamment dans les réseaux mobiles et les systèmes de communication industriels. L'accent mis sur la stabilité et l'efficacité des réseaux répond aux exigences du secteur local.
Aperçu du marché du Réseau auto-organisé Asie-Pacifique (SON)
Le marché SON en Asie-Pacifique devrait connaître son taux de croissance annuel composé le plus élevé en 2025, porté par la croissance du nombre d'abonnés mobiles, l'urbanisation rapide et les avancées technologiques dans des pays comme la Chine, le Japon et l'Inde. L'orientation croissante de la région vers la transformation numérique, soutenue par les initiatives gouvernementales favorisant le développement des infrastructures réseau, favorise l'adoption du SON. De plus, l'émergence de l'APAC comme marché majeur pour les services mobiles et les applications numériques accroît considérablement le besoin d'une gestion de réseau efficace et automatisée.
Aperçu du marché du Réseau d'auto-organisation japonais (SON)
Le marché japonais des SON prend de l'ampleur grâce à la culture high-tech du pays, à l'adoption rapide de la 5G et à la demande de connectivité fluide. Le marché japonais accorde une importance majeure à la qualité et à la fiabilité des réseaux, et l'adoption des SON est stimulée par la complexité croissante des réseaux mobiles et la prolifération des objets connectés. L'intégration des SON à des systèmes avancés de gestion de réseau alimente la croissance. De plus, l'accent mis par le Japon sur l'efficacité et l'automatisation dans tous les secteurs devrait stimuler la demande de solutions intelligentes d'optimisation des réseaux, tant dans le secteur mobile que dans celui des entreprises.
Aperçu du marché du réseau auto-organisé chinois (SON)
En 2025, le marché chinois des SON représentait la plus grande part de chiffre d'affaires en Asie-Pacifique, grâce à l'importante base d'abonnés mobiles du pays, au déploiement rapide des réseaux 5G et à un taux d'adoption technologique élevé. La Chine est l'un des plus grands marchés pour les services mobiles et les applications numériques, et les solutions SON deviennent de plus en plus cruciales pour gérer l'ampleur et la complexité de ces réseaux. L'essor des infrastructures intelligentes et la disponibilité de technologies de réseau avancées, ainsi que la présence de fournisseurs d'infrastructures de télécommunications nationaux performants, sont des facteurs clés qui propulsent le marché en Chine.
Part de marché des réseaux auto-organisés (SON)
L'industrie des réseaux auto-organisés (SON) est principalement dirigée par des entreprises bien établies, notamment :
- Nokia (Finlande)
- Cisco Systems, Inc. (États-Unis)
- Telefonaktiebolaget Lm Ericsson (Suède)
- Qualcomm Technologies Inc. (États-Unis)
- Airspan Networks (États-Unis)
- Innovile (Turquie)
- Corning Incorporated (États-Unis)
- Hughes Systique Corporation (États-Unis)
- Altran (France)
- Cellwize (Singapour)
- Airhop Communications (États-Unis)
- ZTE Corporation (Chine)
- Comarch SA (Pologne)
- PI Works (Turquie)
- CCS Ltd (Inde)
- Radisys (États-Unis)
- VIAVI Solutions (États-Unis)
- Infovista (Royaume-Uni)
Derniers développements sur le marché mondial des réseaux auto-organisés (SON)
- En juin 2020, VIAVI Solutions Inc. a lancé deux solutions de géolocalisation 3D pour les réseaux 5G : GEOperformance 5G et Coverage Assurance 5G. Ce développement produit vise à offrir aux opérateurs une visibilité détaillée sur l'expérience des abonnés et la couverture 5G en temps réel. Ces outils aident les fournisseurs de réseaux à optimiser la qualité de service et à gérer plus efficacement les lacunes de couverture. Leur principal avantage est de permettre aux opérateurs de gérer proactivement les performances du réseau, d'améliorer la satisfaction des utilisateurs et de générer de nouvelles opportunités de revenus. Cette innovation devrait favoriser l'adoption des réseaux auto-organisés en améliorant la fourniture de services 5G et l'efficacité opérationnelle du marché.
SKU-
Accédez en ligne au rapport sur le premier cloud mondial de veille économique

- Tableau de bord d'analyse de données interactif
- Tableau de bord d'analyse d'entreprise pour les opportunités à fort potentiel de croissance
- Accès d'analyste de recherche pour la personnalisation et les requêtes
- Analyse de la concurrence avec tableau de bord interactif
- Dernières actualités, mises à jour et analyse des tendances
- Exploitez la puissance de l'analyse comparative pour un suivi complet de la concurrence
Méthodologie de recherche
La collecte de données et l'analyse de l'année de base sont effectuées à l'aide de modules de collecte de données avec des échantillons de grande taille. L'étape consiste à obtenir des informations sur le marché ou des données connexes via diverses sources et stratégies. Elle comprend l'examen et la planification à l'avance de toutes les données acquises dans le passé. Elle englobe également l'examen des incohérences d'informations observées dans différentes sources d'informations. Les données de marché sont analysées et estimées à l'aide de modèles statistiques et cohérents de marché. De plus, l'analyse des parts de marché et l'analyse des tendances clés sont les principaux facteurs de succès du rapport de marché. Pour en savoir plus, veuillez demander un appel d'analyste ou déposer votre demande.
La méthodologie de recherche clé utilisée par l'équipe de recherche DBMR est la triangulation des données qui implique l'exploration de données, l'analyse de l'impact des variables de données sur le marché et la validation primaire (expert du secteur). Les modèles de données incluent la grille de positionnement des fournisseurs, l'analyse de la chronologie du marché, l'aperçu et le guide du marché, la grille de positionnement des entreprises, l'analyse des brevets, l'analyse des prix, l'analyse des parts de marché des entreprises, les normes de mesure, l'analyse globale par rapport à l'analyse régionale et des parts des fournisseurs. Pour en savoir plus sur la méthodologie de recherche, envoyez une demande pour parler à nos experts du secteur.
Personnalisation disponible
Data Bridge Market Research est un leader de la recherche formative avancée. Nous sommes fiers de fournir à nos clients existants et nouveaux des données et des analyses qui correspondent à leurs objectifs. Le rapport peut être personnalisé pour inclure une analyse des tendances des prix des marques cibles, une compréhension du marché pour d'autres pays (demandez la liste des pays), des données sur les résultats des essais cliniques, une revue de la littérature, une analyse du marché des produits remis à neuf et de la base de produits. L'analyse du marché des concurrents cibles peut être analysée à partir d'une analyse basée sur la technologie jusqu'à des stratégies de portefeuille de marché. Nous pouvons ajouter autant de concurrents que vous le souhaitez, dans le format et le style de données que vous recherchez. Notre équipe d'analystes peut également vous fournir des données sous forme de fichiers Excel bruts, de tableaux croisés dynamiques (Fact book) ou peut vous aider à créer des présentations à partir des ensembles de données disponibles dans le rapport.

