
Marché mondial des tables électriques autoportantes réglables en hauteur, par type (moteur simple et moteur double), application (bureaux, commerce, industrie et maison), canal de vente (magasins spécialisés, supermarchés et hypermarchés, vente au détail en ligne et autres) - Tendances et prévisions de l'industrie jusqu'en 2029.
Analyse du marché et de la taille des tables électriques autoportantes réglables en hauteur
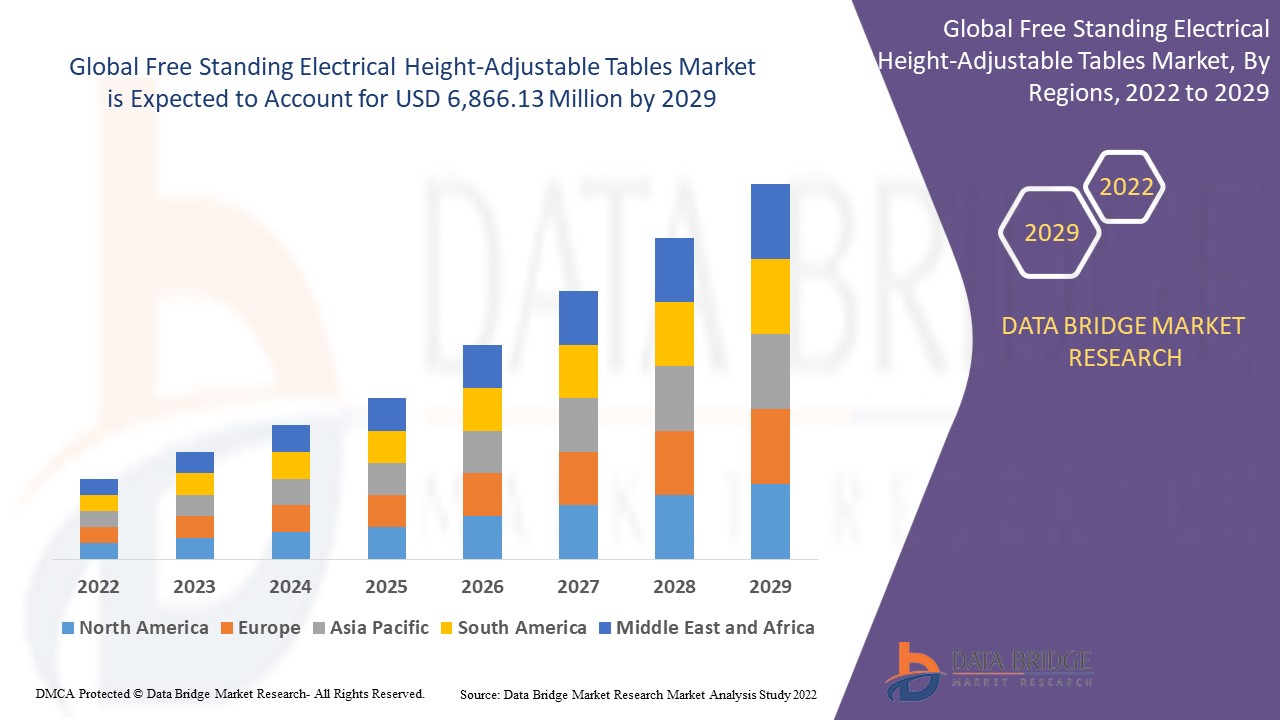
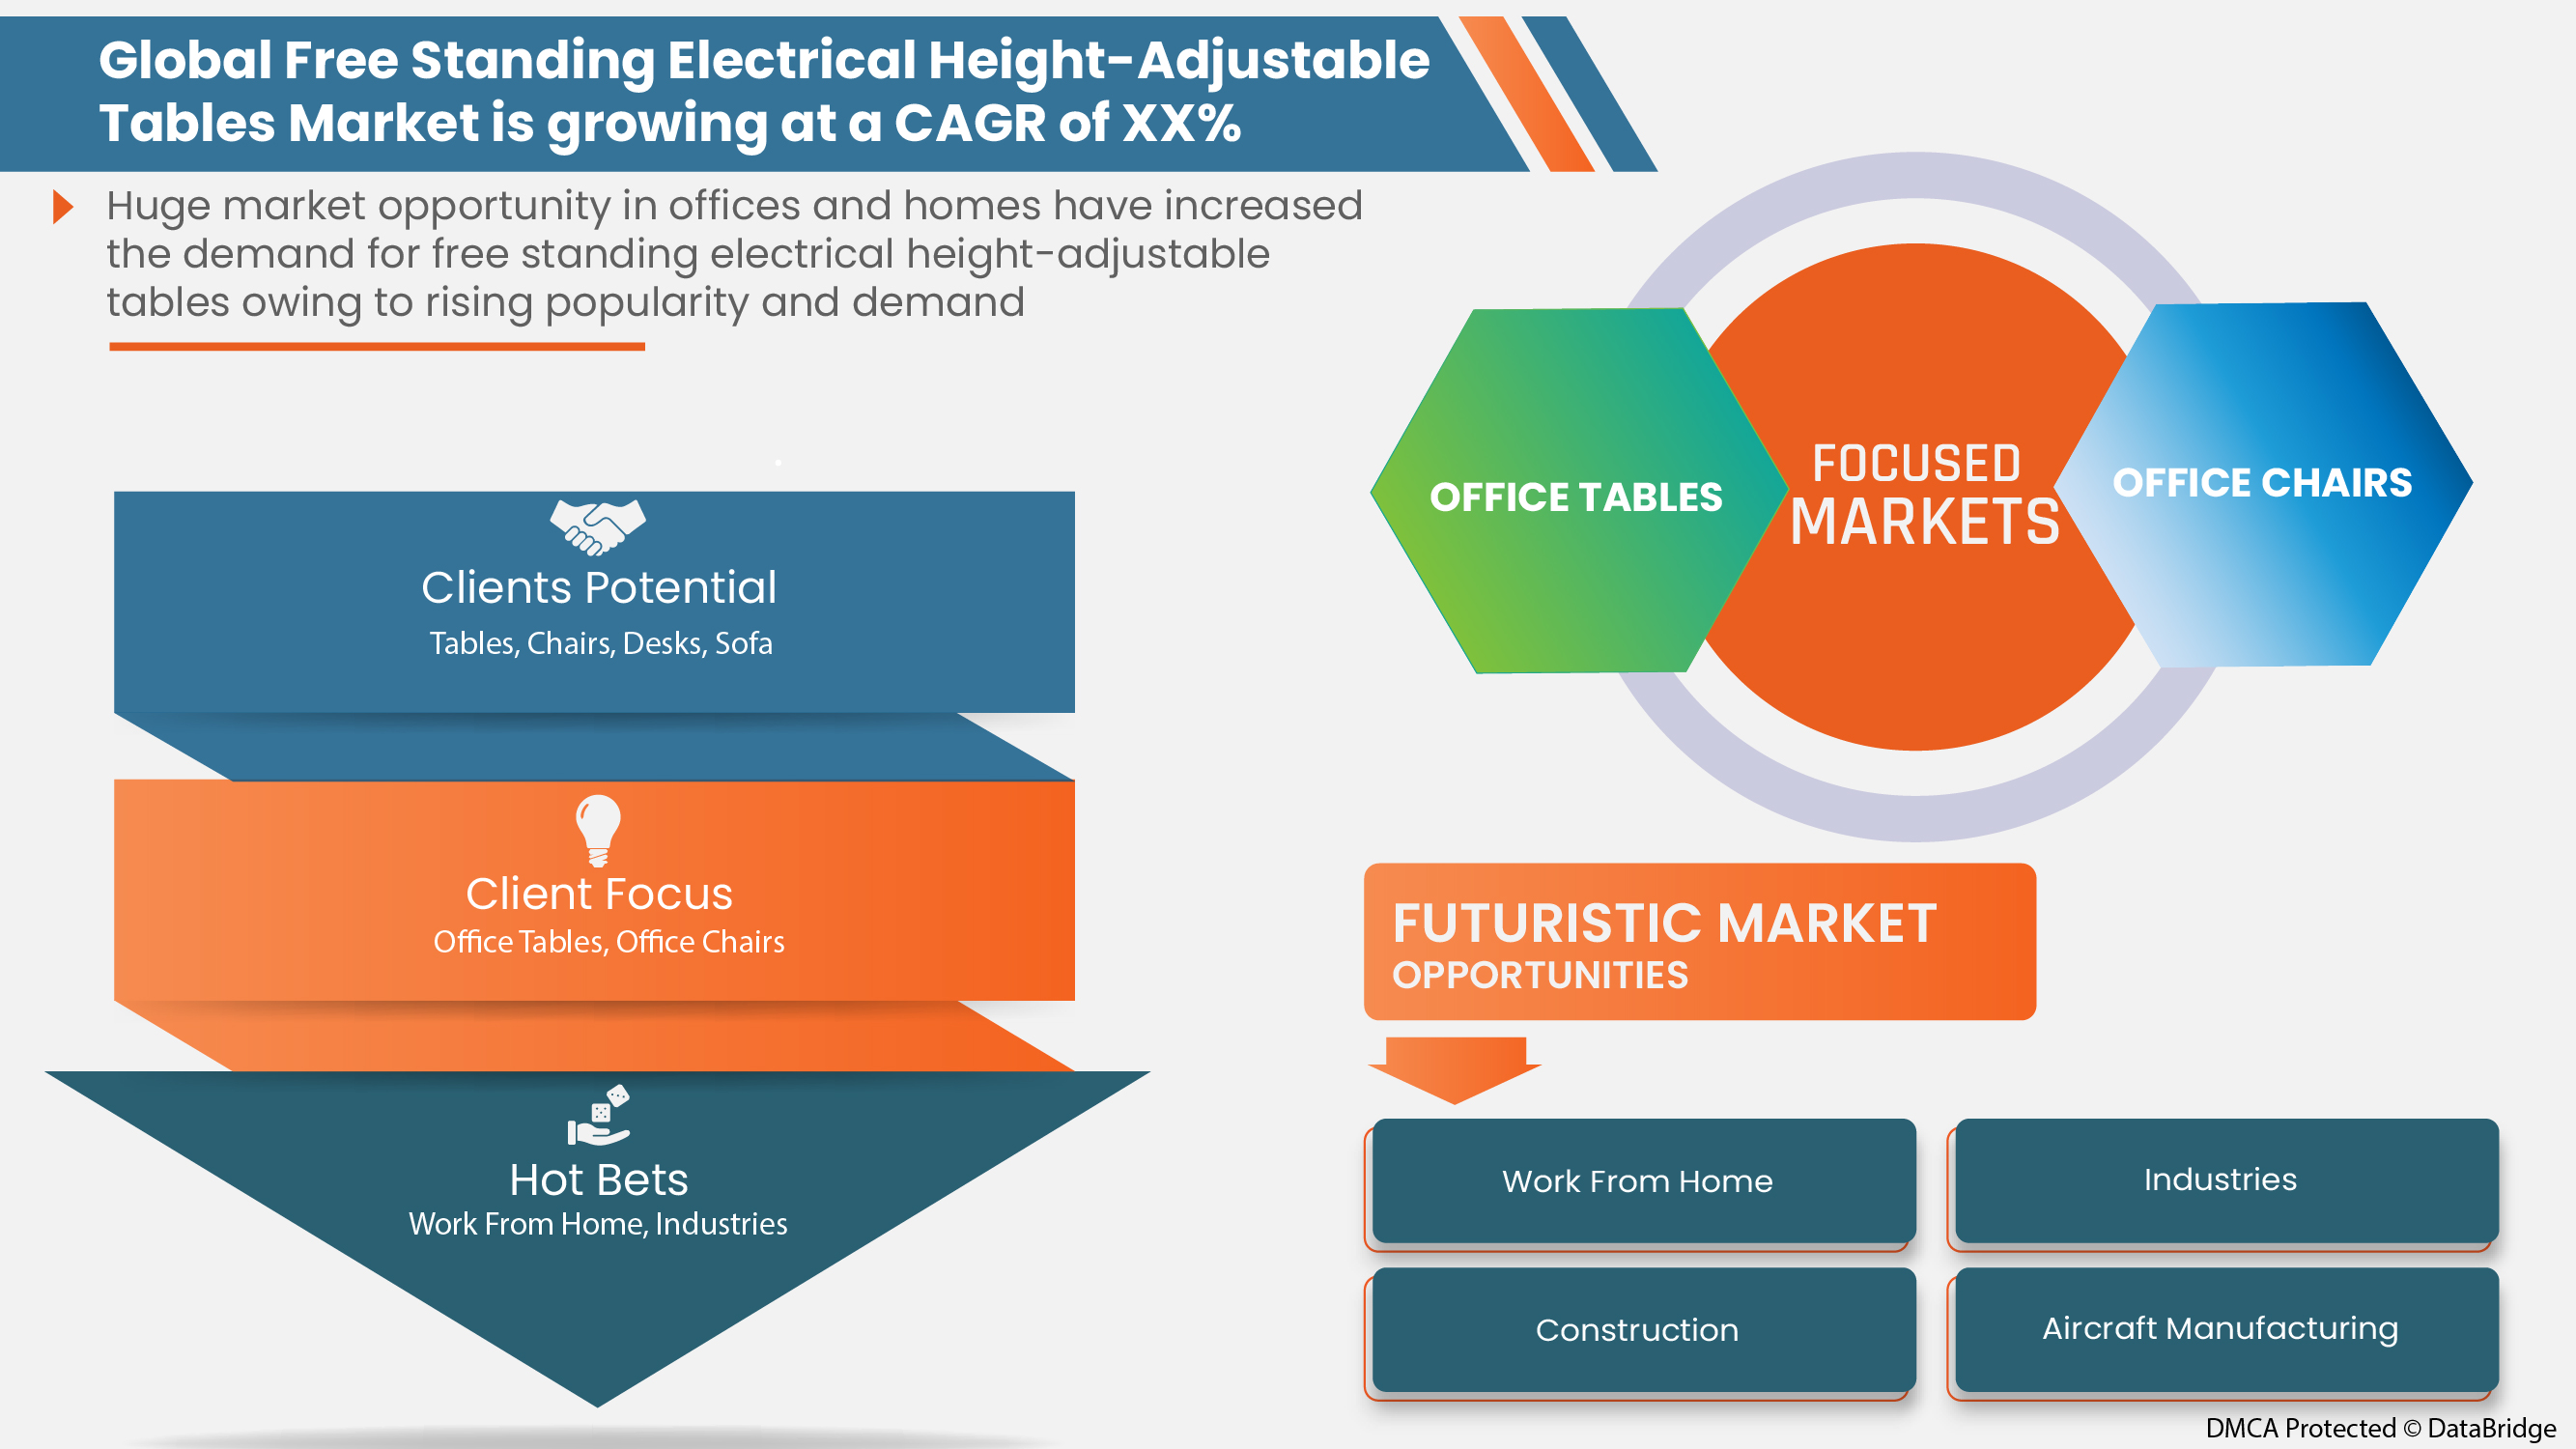
Le marché mondial des tables électriques réglables en hauteur autonomes est stimulé par les nombreux avantages qu'elles offrent aux entreprises et aux employés. Le marché des bureaux contemporains réglables en hauteur est également stimulé par une augmentation de la demande de postes de travail contemporains réglables en hauteur. Le corps humain fonctionne naturellement mieux lorsqu'il est dans une position confortable, en particulier pendant les heures normales de travail au bureau. Cela améliore la santé générale, ce qui crée une opportunité de marché pour les bureaux modernes réglables en hauteur. Alors que le principal facteur limitant le marché mondial des tables électriques réglables en hauteur autonomes est dû à une augmentation de la demande de substituts indiqués ci-dessus, les producteurs s'efforcent davantage de fabriquer de nouveaux modèles et de nouveaux modèles.
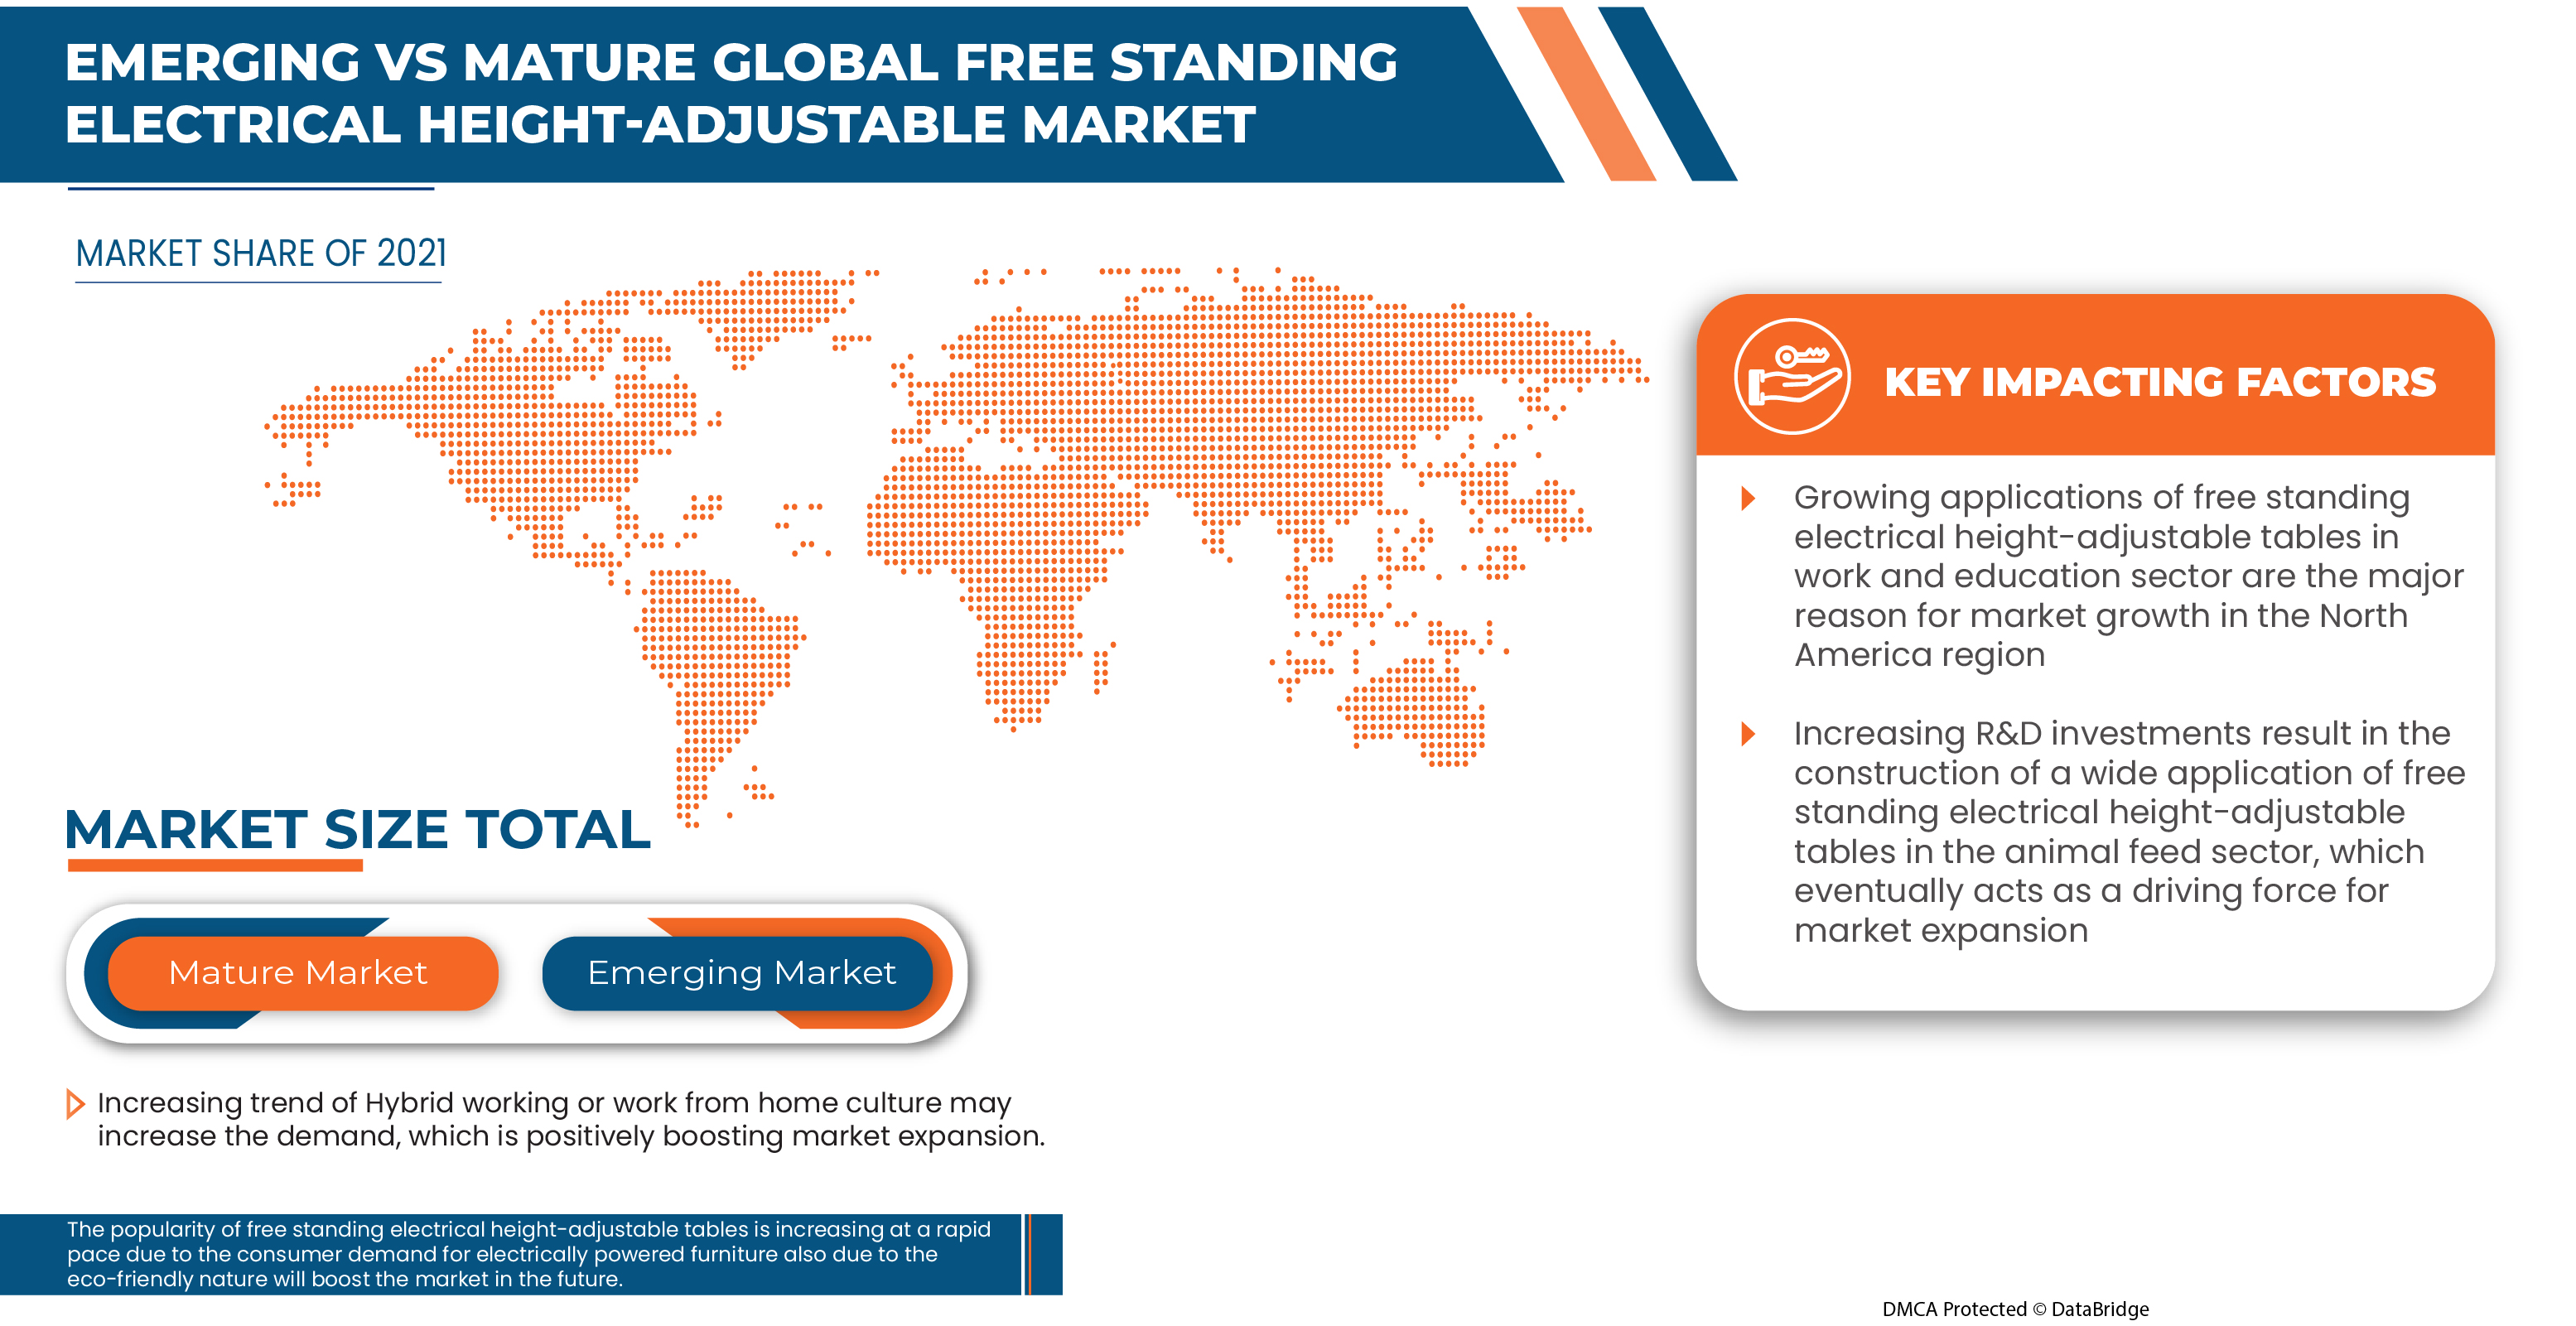
Certains des facteurs qui stimulent la croissance du marché sont la tendance au travail hybride ou à la culture du travail à domicile et l'évolution de la préférence des consommateurs pour les meubles électriques et la nature écologique du produit. Cependant, les limites liées à l'énorme différence de prix entre les produits de mobilier intelligent et les meubles traditionnels freinent la croissance du marché.
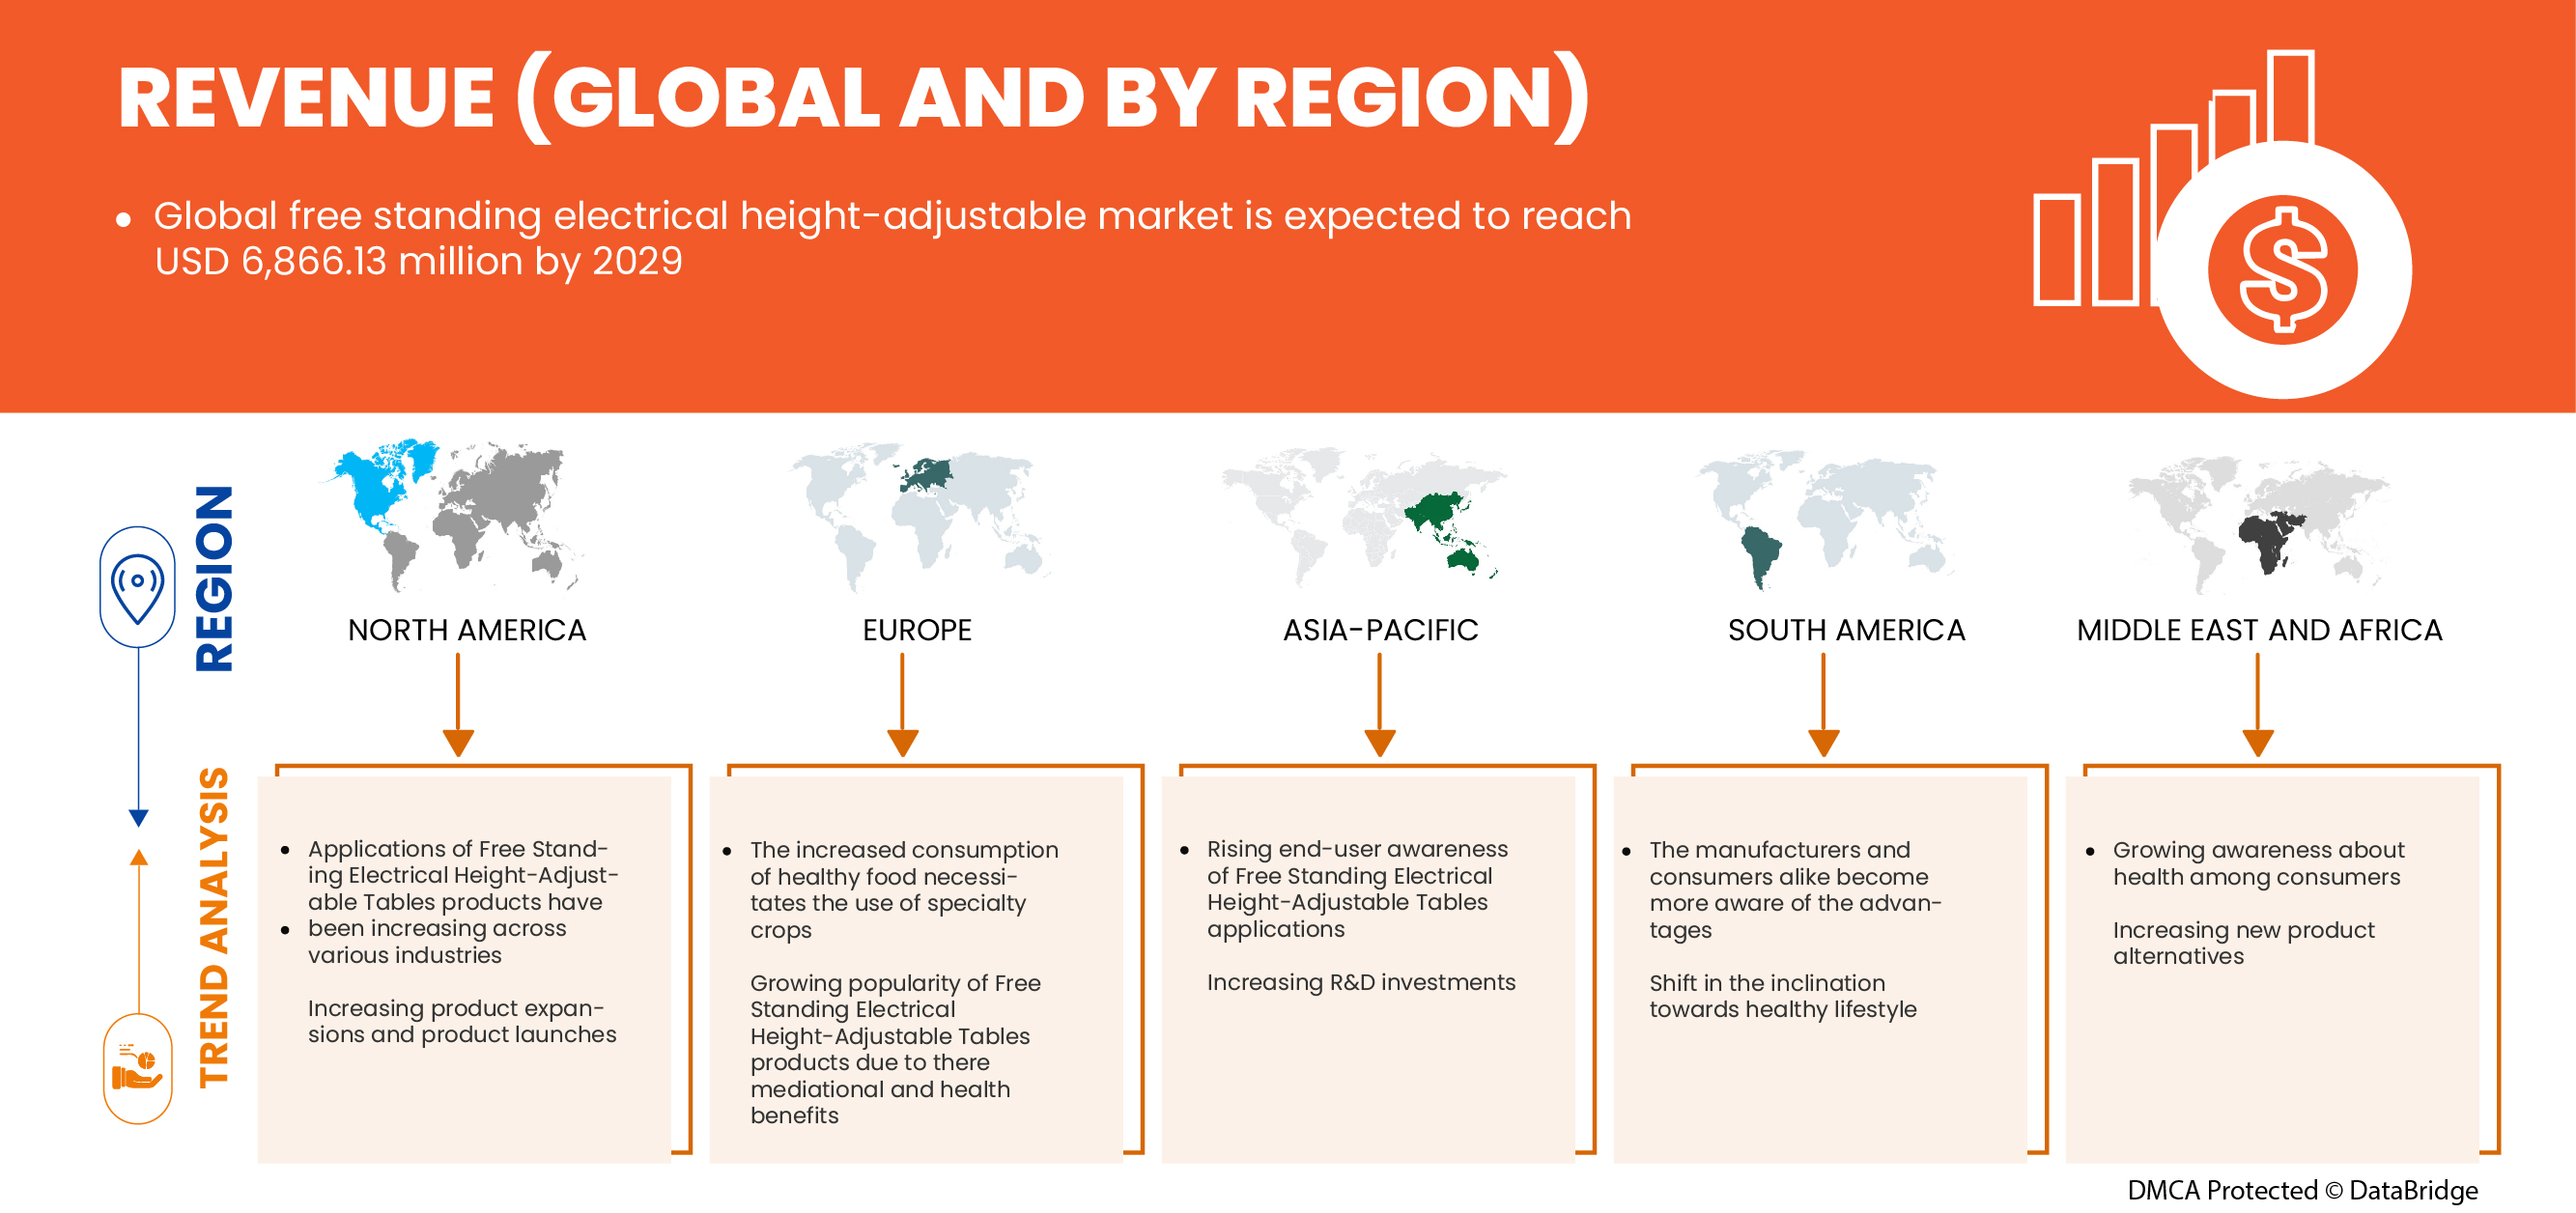
Data Bridge Market Research analyse que le marché des tables électriques autoportantes réglables en hauteur devrait atteindre la valeur de 6 866,13 millions USD d'ici 2029 avec un TCAC de 7,4 % au cours de la période de prévision.
|
Rapport métrique |
Détails |
|
Période de prévision |
2022 à 2029 |
|
Année de base |
2021 |
|
Année historique |
2020 (personnalisable pour 2019-2014) |
|
Unités quantitatives |
Chiffre d'affaires en millions USD, volumes en milliers d'unités, prix en USD |
|
Segments couverts |
Par type (moteur simple et moteur double), application (bureaux, commerces, industrie et maison), canal de vente (magasins spécialisés, supermarchés et hypermarchés, vente au détail en ligne et autres) |
|
Pays couverts |
États-Unis, Canada, Mexique, Allemagne, Italie, France, Royaume-Uni, Pologne, Pays-Bas, Espagne, Autriche, Suède, Danemark, Belgique, Russie, Suisse, Luxembourg, Grèce, Turquie, Norvège et reste de l'Europe, Chine, Japon, Inde, Australie et Nouvelle-Zélande, Singapour, Indonésie, Thaïlande, Corée du Sud, Malaisie, Philippines, Taïwan et reste de l'Asie-Pacifique, Arabie saoudite, Afrique du Sud, Égypte, Émirats arabes unis, Israël et reste du Moyen-Orient et de l'Afrique, Brésil, Argentine et reste de l'Amérique du Sud. |
|
Acteurs du marché couverts |
Conen Products GmbH, ConSet America, Global Furniture Group, HNI Corporation, Schiavello, KI, Fellowes Brands, Ofita, ROL AB, Teknion, PALMBERG, Haworth Inc., OKAMURA CORPORATION., Kimball International, Steelcase Inc., Gispen, Ergomaster, Inter IKEA Systems BV, CEKA, RAGNARS, Röhr-Bush GmbH & Co. KG, ACTIU Berbegal y Formas SA, KOKUYO CO., LTD. et Kinnarps AB, entre autres. |
Définition du marché
Les tables électriques autoportantes réglables en hauteur permettent aux utilisateurs de modifier leur taille. Les muscles du dos et du cou sont très détendus, avec une mobilité suffisante du bureau. Une table réglable en hauteur est une option contemporaine pour la colonne vertébrale, les genoux et les chevilles. De plus, elle favorise la concentration et l'imagination des utilisateurs. Une table réglable en hauteur qui peut être modifiée pour s'asseoir et se tenir debout est plus saine qu'une table qui ne peut être utilisée que pour s'asseoir. Des effets négatifs sur la santé ont été associés à des séjours prolongés. Les petits modèles de table qui peuvent être ajoutés ou retirés d'un bureau actuel pour passer de la position debout à la position assise sont une autre option pour les postes de travail assis-debout.
Dynamique du marché des tables électriques autoportantes réglables en hauteur
Cette section traite de la compréhension des moteurs, des opportunités, des contraintes et des défis du marché. Tout cela est discuté en détail ci-dessous :
Conducteurs :
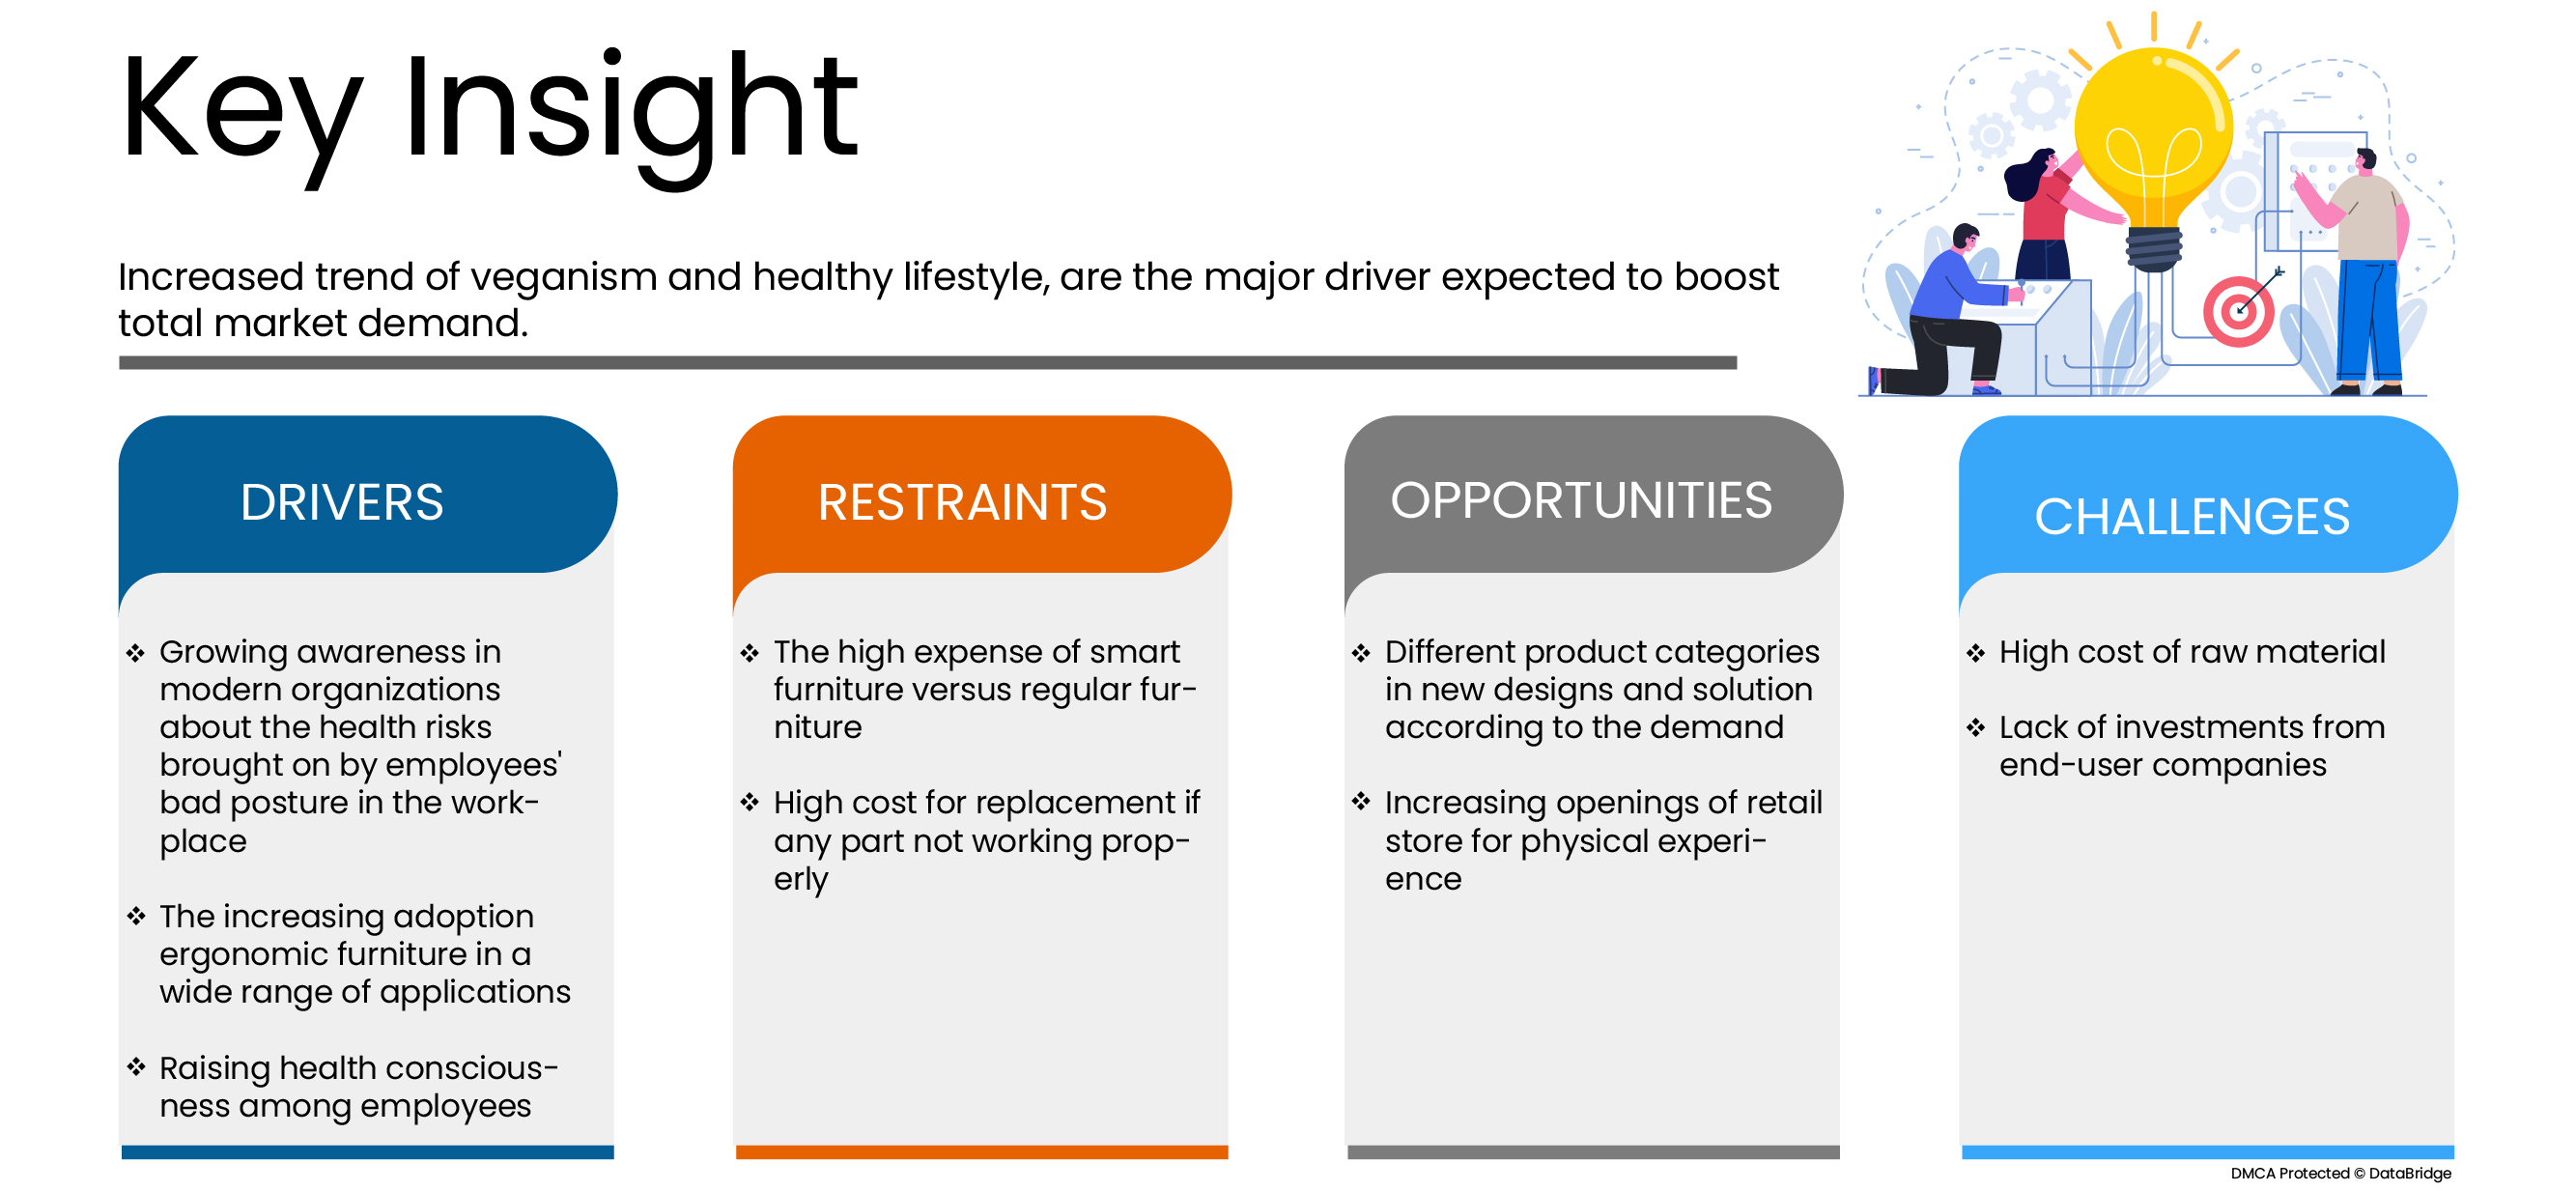
- Sensibiliser davantage les organisations modernes aux risques pour la santé liés à la mauvaise posture des employés sur le lieu de travail
Une mauvaise posture, par exemple, peut entraîner de nombreux problèmes de santé en exerçant une pression inutile sur les articulations et les muscles. Cela entraîne un surmenage et une fatigue qui peuvent entraîner un inconfort chronique. En conséquence, des maladies musculo-squelettiques (TMS) telles que la tendinite ou le syndrome du canal carpien peuvent se développer. Les muscles, les vaisseaux sanguins, les nerfs, les ligaments et les tendons peuvent tous être affectés par ces affections. Aujourd'hui, les gens sont plus conscients de ces problèmes de santé en raison d'une mauvaise posture pendant les heures de bureau. Par conséquent, les organisations fournissent des équipements tels que des tables électriques autoportantes réglables en hauteur, qui assurent une bonne posture pendant les heures de travail. Par conséquent, les employés ne sont pas confrontés à de nombreux problèmes de santé liés à une mauvaise posture.
Par exemple,
- En mai 2022, Aayuv Technologies Private Limited a publié un blog sur « La santé et le bien-être des employés : sont-ils importants pour la croissance de l'entreprise ? ». Il révèle que ces derniers jours, la plupart des organisations fournissent les meilleures infrastructures en raison de la demande croissante d'employeurs plus soucieux de leur santé
Les organisations modernes mènent des programmes de sensibilisation et offrent de meilleures installations au bureau en raison de cette prise de conscience accrue des effets drastiques d'une mauvaise posture sur la santé dans les organisations modernes. Cela agit directement comme un moteur et contribue à la croissance du marché.
- L'augmentation de l'adoption de mobilier ergonomique dans une large gamme d'applications
L'ergonomie est la pratique qui consiste à créer un lieu de travail qui réponde aux exigences du travailleur plutôt que de le forcer à s'adapter à son lieu de travail. Il a été prouvé qu'une bonne conception ergonomique améliore la qualité et le rendement du travail tout en améliorant le bien-être des travailleurs. Contrairement au mobilier de bureau traditionnel, les chaises ergonomiques maintiennent le corps de l'utilisateur dans une position sûre et droite, réduisant ainsi le stress sur la colonne vertébrale, le cou et les hanches. Cela est accompli grâce à l'utilisation d'un appui-tête pour soutenir le cou et les épaules, ainsi que d'un dossier pour maintenir la courbe naturelle de la colonne vertébrale. Une autre tendance croissante en matière d'ergonomie qui devient rapidement obligatoire dans certaines entreprises est le bureau assis-debout, qui vise à inciter les employés à se lever et à bouger davantage. En raison de son adoption croissante, les gens sont intéressés par l'utilisation de diverses applications.
Par exemple,
- ImageWorks Commercial Interiors a publié un article intitulé « Ce que vous devez savoir sur l'avenir du mobilier de bureau ergonomique ». La technologie moderne et les designs créatifs sont déjà présents dans le mobilier de bureau ergonomique actuellement disponible, mais cela ne signifie pas qu'il n'y a pas toujours de potentiel de développement. L'avenir du mobilier de bureau ergonomique regorge d'idées innovantes qui ont le potentiel de modifier fondamentalement la façon dont le mobilier de bureau est fabriqué
Il existe une large gamme d'applicabilité sur le marché, et à l'avenir également, les applications augmenteront de jour en jour en utilisant une technologie de pointe qui aidera le marché à se développer.
RESTRICTIONS
- Le coût élevé des meubles intelligents par rapport aux meubles classiques
Les meubles intelligents ne sont pas des meubles ordinaires comme les chaises, les bureaux et les tables. Ils sont plutôt utilisés dans les conceptions modernes pour les maisons et les bureaux qui disposent d'un système intelligent ou sont contrôlés par un contrôleur. Ainsi, l'approvisionnement en matières premières et la fabrication nécessitent des investissements élevés, de sorte que le prix final du produit est plus élevé que celui des meubles ordinaires. C'est pourquoi de nombreux consommateurs évitent d'acheter des meubles intelligents comme les tables électriques autoportantes réglables en hauteur.
Par conséquent, il est prévu que l’énorme différence de prix entre les produits d’ameublement intelligents et les meubles traditionnels entravera considérablement l’expansion du marché.
OPPORTUNITÉS
- Augmentation des ouvertures de magasins de détail pour une expérience physique
Les clients préfèrent se rendre dans les magasins de détail pour mieux comprendre les produits d'ameublement. Ces dernières années, de nombreux nouveaux magasins de détail aux noms de succursales variés ont été érigés à divers endroits. La majorité des clients de chaque région pourront accéder à ces différentes succursales. Les employés bénéficieront grandement de cette accessibilité simple, ainsi que l'entreprise elle-même, en générant plus de ventes.
Par exemple,
- En juin 2022, IKEA ouvre son premier magasin à grande surface à Bengaluru ; pour investir 3 000 crores de roupies au Karnataka. Cela aide IKEA à augmenter ses ventes
Cette augmentation du nombre de nouveaux magasins de détail créera de nombreuses opportunités pour les employés et pour les entreprises, ce qui contribuera à la croissance du marché.
DÉFIS
- Coût élevé des matières premières
De nos jours, la plupart des consommateurs privilégient les produits de haute qualité. Pour produire des produits de haute qualité, il faut des matières premières de haute qualité, ce qui est une condition préalable au processus de fabrication. Cependant, le coût des matières premières de haute qualité est exorbitant et seul un petit nombre d'investisseurs sont prêts à faire ce type d'investissement. La majorité des entreprises ne manifestent pas d'intérêt à investir dans ces secteurs en raison du coût élevé des excellentes matières premières.
Par exemple,
- En août 2021, Henkel a publié un article intitulé « Actualités de l’industrie du meuble : comment une augmentation du coût des matières premières pourrait-elle changer l’industrie du meuble telle que nous la connaissons ? ». Il explique que le prix élevé des matières premières pendant la pandémie de COVID-19 en raison d’une moindre disponibilité entraîne une augmentation des prix des produits d’ameublement finis
Par conséquent, le principal défi du marché pourrait être causé par les prix élevés des matières premières.
Impact post-COVID-19 sur le marché mondial des tables électriques autoportantes réglables en hauteur
Après la pandémie, la demande de tables électriques autoportantes réglables en hauteur a augmenté car il n'y aura aucune restriction de mouvement ; par conséquent, l'approvisionnement en produits serait facile. La persistance du COVID-19 pendant une période plus longue a affecté la chaîne d'approvisionnement car elle a été perturbée, et il est devenu difficile de fournir des produits d'ameublement aux consommateurs, augmentant initialement la demande de produits. Cependant, après le COVID, la demande de tables électriques autoportantes réglables en hauteur a considérablement augmenté en raison de l'amélioration de la santé générale et de la productivité au travail.
Développements récents
- En juillet 2022, ACTIU Berbegal y Formas SA avait pour objectif d'innover pour être au sommet de la classe. L'entreprise conçoit des espaces de travail pour les étudiants en classe pour une meilleure étude et un meilleur apprentissage en fournissant un mobilier agile et confortable. Le développement de technologies avancées a conduit à de bonnes installations d'apprentissage, ce qui incitera d'autres instituts d'apprentissage à adopter les mêmes. Cela contribue à la croissance du marché
- En 2019, Conen Produkte GmbH a lancé un support réglable en hauteur qui est une nouvelle tendance et qui a également été développé dans les tables, ce qui a eu un grand impact sur le marché, tant dans le secteur des tables que des supports, ce qui a entraîné une augmentation du marché de l'entreprise. Ces techniques contribuent également à l'augmentation du marché des tables, car elles impliquent les mêmes techniques
Portée du marché mondial des tables électriques autoportantes réglables en hauteur
Le marché mondial des tables électriques autoportantes réglables en hauteur est segmenté en trois segments notables en fonction du type, de l'application et du canal de vente. La croissance de ces segments vous aidera à analyser les principaux segments de croissance des industries et à fournir aux utilisateurs un aperçu précieux du marché et des informations sur le marché pour les aider à prendre des décisions stratégiques pour identifier les principales applications du marché.
TAPER
- Moteur unique
- Moteur double
Sur la base du type, le marché mondial des tables électriques réglables en hauteur autonomes est segmenté en moteur simple et moteur double.
APPLICATION
- Bureaux
- Commercial
- Industriel
- Maison
Sur la base de l'application, le marché mondial des tables électriques réglables en hauteur autonomes est segmenté en bureaux, commerces, industries et maisons.
CANAL DE VENTE
- Magasins spécialisés
- Supermarchés et hypermarchés
- Vente au détail en ligne
- Autres
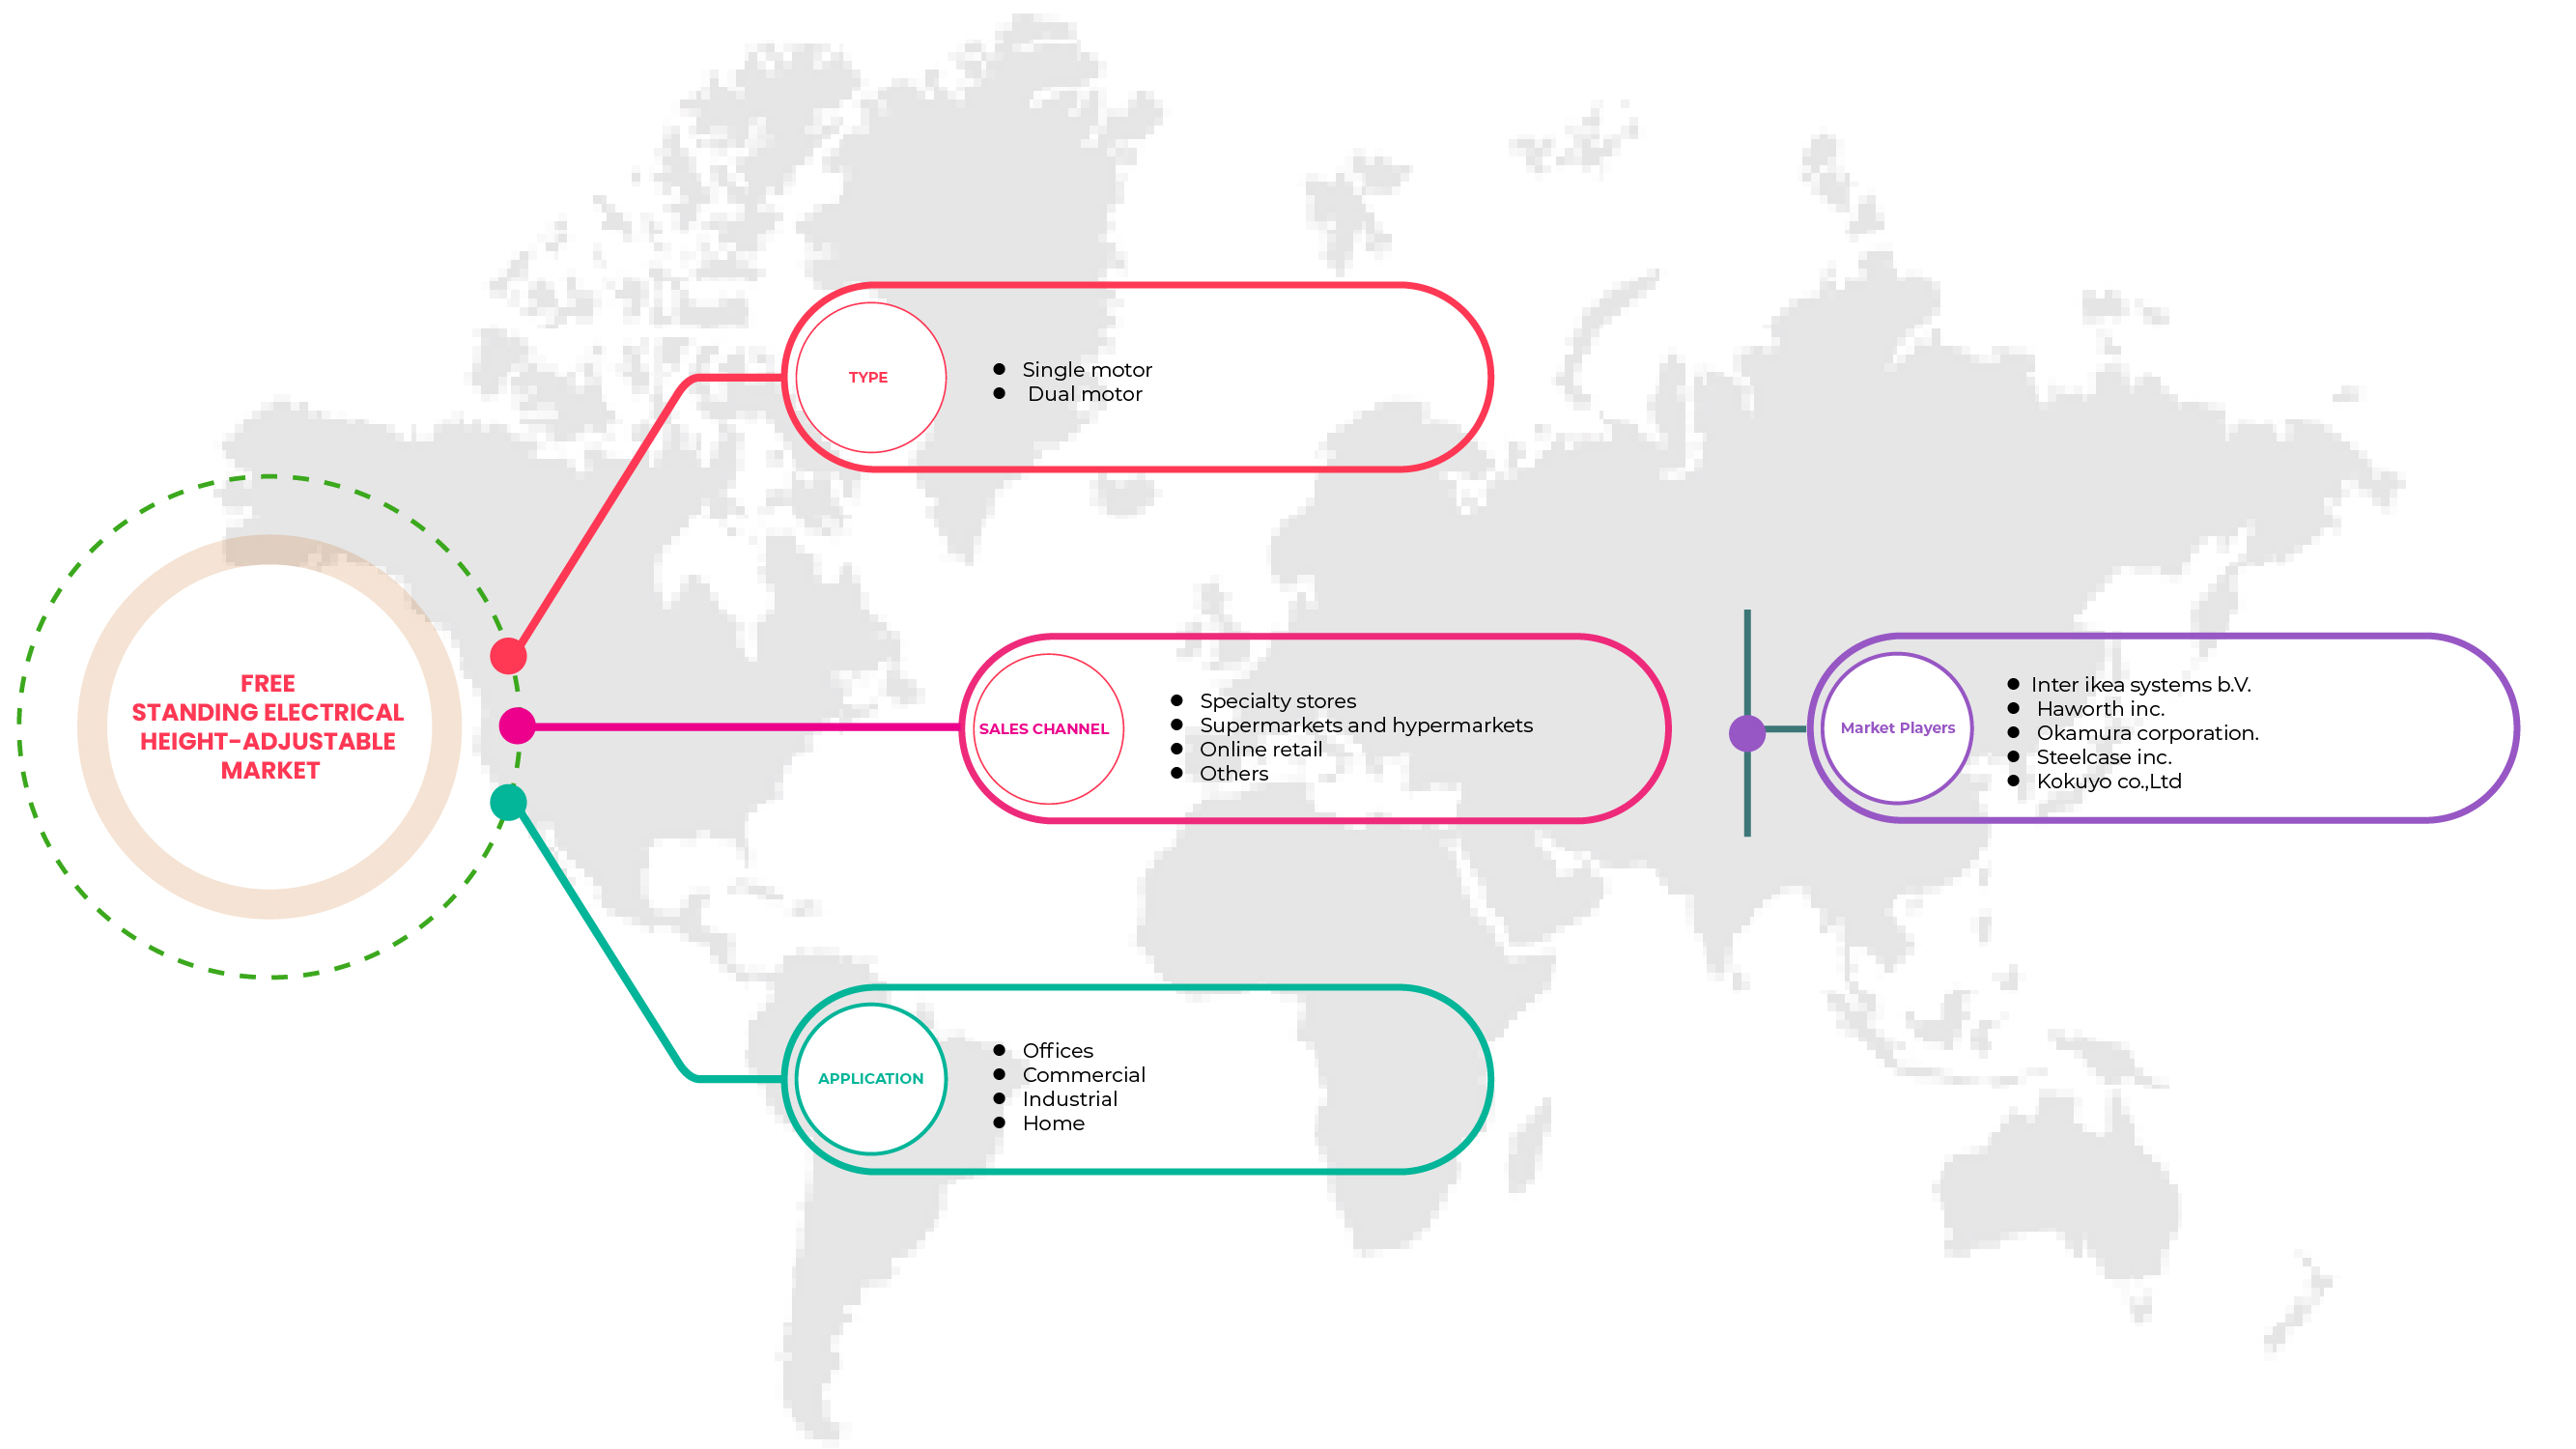
Sur la base des canaux de vente, le marché mondial des tables électriques réglables en hauteur autonomes est segmenté en magasins spécialisés, supermarchés, hypermarchés, vente au détail en ligne et autres.
Analyse/perspectives régionales du marché mondial des tables électriques autoportantes réglables en hauteur
Le marché des tables électriques autoportantes réglables en hauteur est analysé et des informations et tendances sur la taille du marché sont fournies par pays, type, application et canal de vente comme référencé ci-dessus.
Les pays couverts dans le rapport sur le marché mondial des tables électriques réglables en hauteur autonomes sont les États-Unis, le Canada, le Mexique, l'Allemagne, l'Italie, la France, le Royaume-Uni, la Pologne, les Pays-Bas, l'Espagne, l'Autriche, la Suède, le Danemark, la Belgique, la Russie, la Suisse, le Luxembourg, la Grèce, la Turquie, la Norvège et le reste de l'Europe, la Chine, le Japon, l'Inde, l'Australie et la Nouvelle-Zélande, Singapour, l'Indonésie, la Thaïlande, la Corée du Sud, la Malaisie, les Philippines, Taïwan et le reste de l'Asie-Pacifique, l'Arabie saoudite, l'Afrique du Sud, l'Égypte, les Émirats arabes unis, Israël et le reste du Moyen-Orient et de l'Afrique, le Brésil, l'Argentine et le reste de l'Amérique du Sud.
L'Amérique du Nord est le plus grand marché pour les tables électriques autoportantes réglables en hauteur. Les expiations dans les canaux de vente au détail et de distribution en ligne contribueront à obtenir une forte demande dans le monde entier, ce qui est la principale raison de la croissance du marché des tables électriques autoportantes réglables en hauteur en Amérique du Nord. Cependant, le coût élevé des excellentes matières premières est susceptible de limiter la croissance du marché.
La section pays du rapport fournit également des facteurs individuels ayant un impact sur le marché et des changements dans la réglementation du marché qui ont un impact sur les tendances actuelles et futures du marché. Des points de données tels que l'analyse de la chaîne de valeur en aval et en amont, l'analyse des tendances techniques des cinq forces de Porter et les études de cas sont quelques-uns des indicateurs utilisés pour prévoir le scénario de marché pour les différents pays. En outre, la présence et la disponibilité des marques mondiales et les défis auxquels elles sont confrontées en raison de la concurrence importante ou rare des marques locales et nationales, l'impact des tarifs nationaux et les routes commerciales sont pris en compte lors de l'analyse prévisionnelle des données nationales.
Analyse du paysage concurrentiel et des parts de marché des tables électriques autoportantes réglables en hauteur
Le paysage concurrentiel du marché des tables électriques autoportantes réglables en hauteur fournit des détails par concurrents. Les détails inclus sont la présentation de l'entreprise, les finances de l'entreprise, les revenus générés, le potentiel du marché, les investissements dans la recherche et le développement, les nouvelles initiatives du marché, la présence mondiale, les sites et installations de production, les capacités de production, les forces et les faiblesses de l'entreprise, le lancement du produit, la largeur et l'étendue du produit et la domination de l'application. Les points de données ci-dessus fournis ne concernent que les entreprises se concentrant sur le marché des tables électriques autoportantes réglables en hauteur.
Français Certains des principaux acteurs opérant sur le marché des tables électriques autoportantes réglables en hauteur sont Conen Products GmbH, ConSet America, Global Furniture Group, HNI Corporation, Schiavello, KI, Fellowes Brands, Ofita, ROL AB, Teknion, PALMBERG, Haworth Inc., OKAMURA CORPORATION., Kimball International, Steelcase Inc., Gispen, Ergomaster, Inter IKEA Systems BV, CEKA, RAGNARS, Röhr-Bush GmbH & Co. KG, ACTIU Berbegal y Formas SA, KOKUYO CO., LTD., et Kinnarps AB, entre autres.
SKU-
Accédez en ligne au rapport sur le premier cloud mondial de veille économique

- Tableau de bord d'analyse de données interactif
- Tableau de bord d'analyse d'entreprise pour les opportunités à fort potentiel de croissance
- Accès d'analyste de recherche pour la personnalisation et les requêtes
- Analyse de la concurrence avec tableau de bord interactif
- Dernières actualités, mises à jour et analyse des tendances
- Exploitez la puissance de l'analyse comparative pour un suivi complet de la concurrence
Table des matières
1 INTRODUCTION
1.1 OBJECTIVES OF THE STUDY
1.2 OVERVIEW OF THE GLOBAL FREE STANDING ELECTRICAL HEIGHT-ADJUSTABLE TABLES MARKET
1.3 LIMITATIONS
1.4 MARKETS COVERED
2 MARKET SEGMENTATION
2.1 MARKETS COVERED
2.2 GEOGRAPHICAL SCOPE
2.3 YEARS CONSIDERED FOR THE STUDY
2.4 CURRENCY AND PRICING
2.5 DBMR TRIPOD DATA VALIDATION MODEL
2.6 MULTIVARIATE MODELLING
2.7 TYPE LIFELINE CURVE
2.8 PRIMARY INTERVIEWS WITH KEY OPINION LEADERS
2.9 DBMR MARKET POSITION GRID
2.1 VENDOR SHARE ANALYSIS
2.11 SECONDARY SOURCES
2.12 ASSUMPTIONS
3 EXECUTIVE SUMMARY
4 PREMIUM INSIGHTS
4.1 LIST OF CONSUMERS
4.2 LIST OF KEY RAW MATERIALS
4.3 LIST OF SUPPLIERS
4.4 MARKET DYNAMICS AND EXPANSION PLANS (M&A)
4.4.1 MARKET DYNAMICS
4.4.2 EXPANSION PLANS (M&A)
4.5 TOP MANUFACTURES SALES PRICES (USD/UNIT) -
4.6 TOP MANUFACTURERS TOTAL SALES
5 SUPPLY CHAIN ANALYSIS
5.1 RAW MATERIAL & COMPONENTS
5.2 PRODUCTION & ASSEMBLY
5.3 RETAILERS & DISTRIBUTION
5.4 END-USERS
6 IMPACT OF ECONOMIC SLOWDOWN ON THE MARKET
6.1 IMPACT ON PRICE
6.2 IMPACT ON SUPPLY CHAIN
6.3 IMPACT ON SHIPMENT
6.4 IMPACT ON COMPANY'S STRATEGIC DECISIONS
7 MARKET OVERVIEW
7.1 DRIVERS
7.1.1 GROW IN AWARENESS IN MODERN ORGANIZATIONS ABOUT THE HEALTH RISKS BROUGHT ON BY EMPLOYEES' BAD POSTURE IN THE WORKPLACE
7.1.2 THE INCREASE IN ADOPTION OF ERGONOMIC FURNITURE IN A WIDE RANGE OF APPLICATIONS
7.1.3 RAISE IN HEALTH CONSCIOUSNESS AMONG EMPLOYEES
7.1.4 A TREND IN CONSUMER PREFERENCE FOR ELECTRICALLY POWERED FURNITURE
7.1.5 THE INCREASING TREND OF HYBRID WORKING OR WORK FROM HOME CULTURE MAY INCREASE THE DEMAND
7.2 RESTRAINTS
7.2.1 THE HIGH EXPENSE OF SMART FURNITURE VERSUS REGULAR FURNITURE
7.2.2 HIGH COST FOR REPLACEMENT IF ANY PART IS NOT WORKING PROPERLY
7.2.3 HIGH AVAILABILITY OF SUBSTITUTE PRODUCTS
7.3 OPPORTUNITIES
7.3.1 DIFFERENT PRODUCT CATEGORIES IN NEW DESIGNS AND SOLUTIONS ACCORDING TO THE DEMAND
7.3.2 INCREASING OPENINGS OF RETAIL STORES FOR PHYSICAL EXPERIENCE
7.3.3 EXPANSION OF ONLINE RETAIL AND DISTRIBUTION CHANNEL
7.4 CHALLENGES
7.4.1 HIGH COST OF RAW MATERIAL
7.4.2 LACK OF INVESTMENTS FROM END-USER COMPANIES
7.4.3 INTENSE MARKET COMPETITION BY MANUFACTURERS
8 GLOBAL FREE STANDING ELECTRICAL HEIGHT-ADJUSTABLE TABLES MARKET, BY TYPE
8.1 OVERVIEW
8.2 SINGLE MOTOR
8.3 DUAL MOTOR
9 GLOBAL FREE STANDING ELECTRICAL HEIGHT-ADJUSTABLE TABLES MARKET, BY APPLICATION
9.1 OVERVIEW
9.2 OFFICES
9.2.1 HIGH-RISE
9.2.2 MID-RISE
9.2.3 LOW-RISE
9.3 COMMERCIAL
9.3.1 EDUCATIONAL INSTITUTIONS
9.3.2 HEALTHCARE FACILITIES
9.3.3 RESEARCH LABORATORIES
9.3.4 AIRPORTS
9.3.5 RAILWAYS AND METRO STATIONS
9.3.6 HOTELS
9.3.7 MANUFACTURING
9.3.8 BUS STOPS AND STATIONS
9.3.9 RESTAURANTS AND BARS
9.3.10 RETAILS
9.3.11 WAREHOUSES
9.3.12 SHIPPING YARDS
9.3.13 OTHERS
9.4 INDUSTRIAL
9.4.1 PHARMACEUTICALS FACTORY
9.4.2 FOOD AND BEVERAGE
9.4.3 MANUFACTURING
9.4.4 OIL AND GAS
9.4.5 OTHERS
9.5 HOME
9.5.1 CONDOMINIUM
9.5.2 TOWN HOUSE
9.5.3 SINGLE FAMILY HOME
9.5.4 OTHERS
10 GLOBAL FREE STANDING ELECTRICAL HEIGHT-ADJUSTABLE TABLES MARKET, BY SALES CHANNEL
10.1 OVERVIEW
10.2 SPECIALTY STORES
10.3 SUPERMARKETS AND HYPERMARKETS
10.4 ONLINE RETAIL
10.5 OTHERS
11 GLOBAL FREE STANDING ELECTRICAL HEIGHT-ADJUSTABLE TABLES MARKET, BY REGION
11.1 OVERVIEW
11.2 NORTH AMERICA
11.2.1 U.S.
11.2.2 CANADA
11.2.3 MEXICO
11.3 EUROPE
11.3.1 GERMANY
11.3.2 ITALY
11.3.3 FRANCE
11.3.4 U.K.
11.3.5 POLAND
11.3.6 NETHERLANDS
11.3.7 SPAIN
11.3.8 AUSTRIA
11.3.9 SWEDEN
11.3.10 DENMARK
11.3.11 BELGIUM
11.3.12 RUSSIA
11.3.13 SWITZERLAND
11.3.14 LUXEMBOURG
11.3.15 GREECE
11.3.16 TURKEY
11.3.17 NORWAY
11.3.18 REST OF EUROPE
11.4 ASIA-PACIFIC
11.4.1 CHINA
11.4.2 INDIA
11.4.3 JAPAN
11.4.4 SOUTH KOREA
11.4.5 AUSTRALIA & NEW ZEALAND
11.4.6 THAILAND
11.4.7 MALAYSIA
11.4.8 INDONESIA
11.4.9 SINGAPORE
11.4.10 TAIWAN
11.4.11 PHILIPPINES
11.4.12 REST OF ASIA-PACIFIC
11.5 SOUTH AMERICA
11.5.1 BRAZIL
11.5.2 ARGENTINA
11.5.3 REST OF SOUTH AMERICA
11.6 MIDDLE EAST & AFRICA
11.6.1 SAUDI ARABIA
11.6.2 UNITED ARAB EMIRATES
11.6.3 ISRAEL
11.6.4 EGYPT
11.6.5 SOUTH AFRICA
11.6.6 REST OF MIDDLE EAST & AFRICA
12 COMPANY LANDSCAPE
12.1 COMPANY SHARE ANALYSIS: GLOBAL
12.2 COMPANY SHARE ANALYSIS: NORTH AMERICA
12.3 COMPANY SHARE ANALYSIS: EUROPE
12.4 COMPANY SHARE ANALYSIS: ASIA-PACIFIC
13 SWOT ANALYSIS
14 COMPANY PROFILES
14.1 INTER IKEA SYSTEMS B.V.
14.1.1 COMPANY SNAPSHOT
14.1.2 COMPANY SHARE ANALYSIS
14.1.3 PRODUCT PORTFOLIO
14.1.4 RECENT DEVELOPMENTS
14.2 HAWORTH INC
14.2.1 COMPANY SNAPSHOT
14.2.2 COMPANY SHARE ANALYSIS
14.2.3 PRODUCT PORTFOLIO
14.2.4 RECENT DEVELOPMENTS
14.3 OKAMURA CORPORATION.
14.3.1 COMPANY SNAPSHOT
14.3.2 REVENUE ANALYSIS
14.3.3 COMPANY SHARE ANALYSIS
14.3.4 PRODUCT PORTFOLIO
14.3.5 RECENT DEVELOPMENTS
14.4 STEELCASE INC.
14.4.1 COMPANY SNAPSHOT
14.4.2 REVENUE ANALYSIS
14.4.3 COMPANY SHARE ANALYSIS
14.4.4 PRODUCT PORTFOLIO
14.4.5 RECENT DEVELOPMENTS
14.5 KOKUYO CO., LTD
14.5.1 COMPANY SNAPSHOT
14.5.2 REVENUE ANALYSIS
14.5.3 COMPANY SHARE ANALYSIS
14.5.4 PRODUCT PORTFOLIO
14.5.5 RECENT DEVELOPMENTS
14.6 ACTIU BERBEGAL Y FORMAS S.A.
14.6.1 COMPANY SNAPSHOT
14.6.2 PRODUCT PORTFOLIO
14.6.3 RECENT DEVELOPMENTS
14.7 CEKA
14.7.1 COMPANY SNAPSHOT
14.7.2 PRODUCT PORTFOLIO
14.7.3 RECENT DEVELOPMENT
14.8 CONEN PRODUCTS GMBH
14.8.1 COMPANY SNAPSHOT
14.8.2 PRODUCT PORTFOLIO
14.8.3 RECENT DEVELOPMENT
14.9 CONSET AMERICA
14.9.1 COMPANY SNAPSHOT
14.9.2 PRODUCT PORTFOLIO
14.9.3 RECENT DEVELOPMENTS
14.1 FELLOWES INC.
14.10.1 COMPANY SNAPSHOT
14.10.2 PRODUCT PORTFOLIO
14.10.3 RECENT DEVELOPMENTS
14.11 ERGOMASTER
14.11.1 COMPANY SNAPSHOT
14.11.2 PRODUCT PORTFOLIO
14.11.3 RECENT DEVELOPMENTS
14.12 GISPEN
14.12.1 COMPANY SNAPSHOT
14.12.2 PRODUCT PORTFOLIO
14.12.3 RECENT DEVELOPMENTS
14.13 GLOBAL FURNITURE GROUP
14.13.1 COMPANY SNAPSHOT
14.13.2 PRODUCT PORTFOLIO
14.13.3 RECENT DEVELOPMENTS
14.14 HNI CORP.
14.14.1 COMPANY SNAPSHOT
14.14.2 REVENUE ANALYSIS
14.14.3 PRODUCT PORTFOLIO
14.14.4 RECENT DEVELOPMENTS
14.15 KI
14.15.1 COMPANY SNAPSHOT
14.15.2 PRODUCT PORTFOLIO
14.15.3 RECENT DEVELOPMENTS
14.16 KIMBALL INTERNATIONAL INC
14.16.1 COMPANY SNAPSHOT
14.16.2 REVENUE ANALYSIS
14.16.3 PRODUCT PORTFOLIO
14.16.4 RECENT DEVELOPMENTS
14.17 KINNARPS AB
14.17.1 COMPANY SNAPSHOT
14.17.2 PRODUCT PORTFOLIO
14.17.3 RECENT DEVELOPMENTS
14.18 OFITA
14.18.1 COMPANY SNAPSHOT
14.18.2 PRODUCT PORTFOLIO
14.18.3 RECENT DEVELOPMENTS
14.19 PALMBERG BÜROEINRICHTUNGEN + SERVICE GMBH
14.19.1 COMPANY SNAPSHOT
14.19.2 PRODUCT PORTFOLIO
14.19.3 RECENT DEVELOPMENTS
14.2 RAGNARS
14.20.1 COMPANY SNAPSHOT
14.20.2 PRODUCT PORTFOLIO
14.20.3 RECENT DEVELOPMENT
14.21 ROEHR-BUSH
14.21.1 COMPANY SNAPSHOT
14.21.2 PRODUCT PORTFOLIO
14.21.3 RECENT DEVELOPMENT
14.22 ROL AB
14.22.1 COMPANY SNAPSHOT
14.22.2 PRODUCT PORTFOLIO
14.22.3 RECENT DEVELOPMENTS
14.23 SCHIAVELLO INTERNATIONAL
14.23.1 COMPANY SNAPSHOT
14.23.2 PRODUCT PORTFOLIO
14.23.3 RECENT DEVELOPMENTS
14.24 TEKNION
14.24.1 COMPANY SNAPSHOT
14.24.2 PRODUCT PORTFOLIO
14.24.3 RECENT DEVELOPMENTS
15 QUESTIONNAIRE
16 RELATED REPORTS
Liste des tableaux
TABLE 1 THE LIST OF SUPPLIERS:
TABLE 2 THE TOP MANUFACTURES SALES PRICES (USD/UNIT) FOR FREE STANDING ELECTRICAL HEIGHT-ADJUSTABLE TABLES:
TABLE 3 THE TOTAL SALES OF ELECTRICAL HEIGHT-ADJUSTABLE TABLE BASED COMPANIES ARE LISTED BELOW:
TABLE 4 GLOBAL FREE STANDING ELECTRICAL HEIGHT-ADJUSTABLE TABLES MARKET, BY TYPE, 2020-2029 (USD MILLION)
TABLE 5 GLOBAL FREE STANDING ELECTRICAL HEIGHT-ADJUSTABLE TABLES MARKET, BY TYPE, 2020-2029 (THOUSAND UNITS)
TABLE 6 GLOBAL SINGLE MOTOR IN FREE STANDING ELECTRICAL HEIGHT-ADJUSTABLE TABLES MARKET, BY REGION, 2020-2029 (USD MILLION)
TABLE 7 GLOBAL SINGLE MOTOR IN FREE STANDING ELECTRICAL HEIGHT-ADJUSTABLE TABLES MARKET, BY REGION, 2020-2029 (THOUSAND UNITS)
TABLE 8 GLOBAL DUAL MOTOR IN FREE STANDING ELECTRICAL HEIGHT-ADJUSTABLE TABLES MARKET, BY REGION, 2020-2029 (USD MILLION)
TABLE 9 GLOBAL DUAL MOTOR IN FREE STANDING ELECTRICAL HEIGHT-ADJUSTABLE TABLES MARKET, BY REGION, 2020-2029 (THOUSAND UNITS)
TABLE 10 GLOBAL FREE STANDING ELECTRICAL HEIGHT-ADJUSTABLE TABLES MARKET, BY APPLICATION, 2020-2029 (USD MILLION)
TABLE 11 GLOBAL FREE STANDING ELECTRICAL HEIGHT-ADJUSTABLE TABLES MARKET, BY APPLICATION, 2020-2029 (THOUSAND UNITS)
TABLE 12 GLOBAL OFFICES IN FREE STANDING ELECTRICAL HEIGHT-ADJUSTABLE TABLES MARKET, BY REGION, 2020-2029 (USD MILLION)
TABLE 13 GLOBAL OFFICES IN FREE STANDING ELECTRICAL HEIGHT-ADJUSTABLE TABLES MARKET, BY REGION, 2020-2029 (THOUSAND UNITS)
TABLE 14 GLOBAL OFFICES IN FREE STANDING ELECTRICAL HEIGHT-ADJUSTABLE TABLES MARKET, BY SEGMENT, 2020-2029 (USD MILLION)
TABLE 15 GLOBAL OFFICES IN FREE STANDING ELECTRICAL HEIGHT-ADJUSTABLE TABLES MARKET, BY SEGMENT, 2020-2029 (THOUSAND UNITS)
TABLE 16 GLOBAL COMMERCIAL IN FREE STANDING ELECTRICAL HEIGHT-ADJUSTABLE TABLES MARKET, BY REGION, 2020-2029 (USD MILLION)
TABLE 17 GLOBAL COMMERCIAL IN FREE STANDING ELECTRICAL HEIGHT-ADJUSTABLE TABLES MARKET, BY REGION, 2020-2029 (THOUSAND UNITS)
TABLE 18 GLOBAL COMMERCIAL IN FREE STANDING ELECTRICAL HEIGHT-ADJUSTABLE TABLES MARKET, BY SEGMENT, 2020-2029 (USD MILLION)
TABLE 19 GLOBAL COMMERCIAL IN FREE STANDING ELECTRICAL HEIGHT-ADJUSTABLE TABLES MARKET, BY SEGMENT, 2020-2029 (THOUSAND UNITS)
TABLE 20 GLOBAL INDUSTRIAL IN FREE STANDING ELECTRICAL HEIGHT-ADJUSTABLE TABLES MARKET, BY REGION, 2020-2029 (USD MILLION)
TABLE 21 GLOBAL INDUSTRIAL IN FREE STANDING ELECTRICAL HEIGHT-ADJUSTABLE TABLES MARKET, BY REGION, 2020-2029 (THOUSAND UNITS)
TABLE 22 GLOBAL INDUSTRIAL IN FREE STANDING ELECTRICAL HEIGHT-ADJUSTABLE TABLES MARKET, BY SEGMENT, 2020-2029 (USD MILLION)
TABLE 23 GLOBAL INDUSTRIAL IN FREE STANDING ELECTRICAL HEIGHT-ADJUSTABLE TABLES MARKET, BY SEGMENT, 2020-2029 (THOUSAND UNITS)
TABLE 24 GLOBAL HOME IN FREE STANDING ELECTRICAL HEIGHT-ADJUSTABLE TABLES MARKET, BY REGION, 2020-2029 (USD MILLION)
TABLE 25 GLOBAL HOME IN FREE STANDING ELECTRICAL HEIGHT-ADJUSTABLE TABLES MARKET, BY REGION, 2020-2029 (THOUSAND UNITS)
TABLE 26 GLOBAL HOME IN FREE STANDING ELECTRICAL HEIGHT-ADJUSTABLE TABLES MARKET, BY SEGMENT, 2020-2029 (USD MILLION)
TABLE 27 GLOBAL HOME IN FREE STANDING ELECTRICAL HEIGHT-ADJUSTABLE TABLES MARKET, BY SEGMENT, 2020-2029 (THOUSAND UNITS)
TABLE 28 GLOBAL FREE STANDING ELECTRICAL HEIGHT-ADJUSTABLE TABLES MARKET, BY SALES CHANNEL, 2020-2029 (USD MILLION)
TABLE 29 GLOBAL FREE STANDING ELECTRICAL HEIGHT-ADJUSTABLE TABLES MARKET, BY SALES CHANNEL, 2020-2029 (THOUSAND UNITS)
TABLE 30 GLOBAL SPECIALTY STORES IN FREE STANDING ELECTRICAL HEIGHT-ADJUSTABLE TABLES MARKET, BY REGION, 2020-2029 (USD MILLION)
TABLE 31 GLOBAL SPECIALTY STORES IN FREE STANDING ELECTRICAL HEIGHT-ADJUSTABLE TABLES MARKET, BY REGION, 2020-2029 (THOUSAND UNITS)
TABLE 32 GLOBAL SUPERMARKETS AND HYPERMARKETS IN FREE STANDING ELECTRICAL HEIGHT-ADJUSTABLE TABLES MARKET, BY REGION, 2020-2029 (USD MILLION)
TABLE 33 GLOBAL SUPERMARKETS AND HYPERMARKETS IN FREE STANDING ELECTRICAL HEIGHT-ADJUSTABLE TABLES MARKET, BY REGION, 2020-2029 (THOUSAND UNITS)
TABLE 34 GLOBAL ONLINE RETAIL IN FREE STANDING ELECTRICAL HEIGHT-ADJUSTABLE TABLES MARKET, BY REGION, 2020-2029 (USD MILLION)
TABLE 35 GLOBAL ONLINE RETAIL IN FREE STANDING ELECTRICAL HEIGHT-ADJUSTABLE TABLES MARKET, BY REGION, 2020-2029 (THOUSAND UNITS)
TABLE 36 GLOBAL OTHERS IN FREE STANDING ELECTRICAL HEIGHT-ADJUSTABLE TABLES MARKET, BY REGION, 2020-2029 (USD MILLION)
TABLE 37 GLOBAL OTHERS IN FREE STANDING ELECTRICAL HEIGHT-ADJUSTABLE TABLES MARKET, BY REGION, 2020-2029 (THOUSAND UNITS)
TABLE 38 GLOBAL FREE STANDING ELECTRICAL HEIGHT-ADJUSTABLE TABLES MARKET, BY REGION, 2020-2029 (USD MILLION)
TABLE 39 GLOBAL FREE STANDING ELECTRICAL HEIGHT-ADJUSTABLE TABLES MARKET, BY REGION, 2020-2029 (THOUSAND UNITS)
TABLE 40 NORTH AMERICA FREE STANDING ELECTRICAL HEIGHT-ADJUSTABLE TABLES MARKET, BY COUNTRY, 2020-2029 (USD MILLION)
TABLE 41 NORTH AMERICA FREE STANDING ELECTRICAL HEIGHT-ADJUSTABLE TABLES MARKET, BY COUNTRY, 2020-2029 (THOUSAND UNITS)
TABLE 42 NORTH AMERICA FREE STANDING ELECTRICAL HEIGHT-ADJUSTABLE TABLES MARKET, BY TYPE, 2020-2029 (USD MILLION)
TABLE 43 NORTH AMERICA FREE STANDING ELECTRICAL HEIGHT-ADJUSTABLE TABLES MARKET, BY TYPE, 2020-2029 (THOUSAND UNITS)
TABLE 44 NORTH AMERICA FREE STANDING ELECTRICAL HEIGHT-ADJUSTABLE TABLES MARKET, BY APPLICATION, 2020-2029 (USD MILLION)
TABLE 45 NORTH AMERICA FREE STANDING ELECTRICAL HEIGHT-ADJUSTABLE TABLES MARKET, BY APPLICATION, 2020-2029 (THOUSAND UNITS)
TABLE 46 NORTH AMERICA OFFICES IN FREE STANDING ELECTRICAL HEIGHT-ADJUSTABLE TABLES MARKET, BY SEGMENT, 2020-2029 (USD MILLION)
TABLE 47 NORTH AMERICA OFFICES IN FREE STANDING ELECTRICAL HEIGHT-ADJUSTABLE TABLES MARKET, BY SEGMENT, 2020-2029 (THOUSAND UNITS)
TABLE 48 NORTH AMERICA COMMERCIAL IN FREE STANDING ELECTRICAL HEIGHT-ADJUSTABLE TABLES MARKET, BY SEGMENT, 2020-2029 (USD MILLION)
TABLE 49 NORTH AMERICA COMMERCIAL IN FREE STANDING ELECTRICAL HEIGHT-ADJUSTABLE TABLES MARKET, BY SEGMENT, 2020-2029 (THOUSAND UNITS)
TABLE 50 NORTH AMERICA INDUSTRIAL IN FREE STANDING ELECTRICAL HEIGHT-ADJUSTABLE TABLES MARKET, BY SEGMENT, 2020-2029 (USD MILLION)
TABLE 51 NORTH AMERICA INDUSTRIAL IN FREE STANDING ELECTRICAL HEIGHT-ADJUSTABLE TABLES MARKET, BY SEGMENT, 2020-2029 (THOUSAND UNITS)
TABLE 52 NORTH AMERICA HOME IN FREE STANDING ELECTRICAL HEIGHT-ADJUSTABLE TABLES MARKET, BY SEGMENT, 2020-2029 (USD MILLION)
TABLE 53 NORTH AMERICA HOME IN FREE STANDING ELECTRICAL HEIGHT-ADJUSTABLE TABLES MARKET, BY SEGMENT, 2020-2029 (THOUSAND UNITS)
TABLE 54 NORTH AMERICA FREE STANDING ELECTRICAL HEIGHT-ADJUSTABLE TABLES MARKET, BY SALES CHANNEL, 2020-2029 (USD MILLION)
TABLE 55 NORTH AMERICA FREE STANDING ELECTRICAL HEIGHT-ADJUSTABLE TABLES MARKET, BY SALES CHANNEL, 2020-2029 (THOUSAND UNITS)
TABLE 56 U.S. FREE STANDING ELECTRICAL HEIGHT-ADJUSTABLE TABLES MARKET, BY TYPE, 2020-2029 (USD MILLION)
TABLE 57 U.S. FREE STANDING ELECTRICAL HEIGHT-ADJUSTABLE TABLES MARKET, BY TYPE, 2020-2029 (THOUSAND UNITS)
TABLE 58 U.S. FREE STANDING ELECTRICAL HEIGHT-ADJUSTABLE TABLES MARKET, BY APPLICATION, 2020-2029 (USD MILLION)
TABLE 59 U.S. FREE STANDING ELECTRICAL HEIGHT-ADJUSTABLE TABLES MARKET, BY APPLICATION, 2020-2029 (THOUSAND UNITS)
TABLE 60 U.S. OFFICES IN FREE STANDING ELECTRICAL HEIGHT-ADJUSTABLE TABLES MARKET, BY SEGMENT, 2020-2029 (USD MILLION)
TABLE 61 U.S. OFFICES IN FREE STANDING ELECTRICAL HEIGHT-ADJUSTABLE TABLES MARKET, BY SEGMENT, 2020-2029 (THOUSAND UNITS)
TABLE 62 U.S. COMMERCIAL IN FREE STANDING ELECTRICAL HEIGHT-ADJUSTABLE TABLES MARKET, BY SEGMENT, 2020-2029 (USD MILLION)
TABLE 63 U.S. COMMERCIAL IN FREE STANDING ELECTRICAL HEIGHT-ADJUSTABLE TABLES MARKET, BY SEGMENT, 2020-2029 (THOUSAND UNITS)
TABLE 64 U.S. INDUSTRIAL IN FREE STANDING ELECTRICAL HEIGHT-ADJUSTABLE TABLES MARKET, BY SEGMENT, 2020-2029 (USD MILLION)
TABLE 65 U.S. INDUSTRIAL IN FREE STANDING ELECTRICAL HEIGHT-ADJUSTABLE TABLES MARKET, BY SEGMENT, 2020-2029 (THOUSAND UNITS)
TABLE 66 U.S. HOME IN FREE STANDING ELECTRICAL HEIGHT-ADJUSTABLE TABLES MARKET, BY SEGMENT, 2020-2029 (USD MILLION)
TABLE 67 U.S. HOME IN FREE STANDING ELECTRICAL HEIGHT-ADJUSTABLE TABLES MARKET, BY SEGMENT, 2020-2029 (THOUSAND UNITS)
TABLE 68 U.S. FREE STANDING ELECTRICAL HEIGHT-ADJUSTABLE TABLES MARKET, BY SALES CHANNEL, 2020-2029 (USD MILLION)
TABLE 69 U.S. FREE STANDING ELECTRICAL HEIGHT-ADJUSTABLE TABLES MARKET, BY SALES CHANNEL, 2020-2029 (THOUSAND UNITS)
TABLE 70 CANADA FREE STANDING ELECTRICAL HEIGHT-ADJUSTABLE TABLES MARKET, BY TYPE, 2020-2029 (USD MILLION)
TABLE 71 CANADA FREE STANDING ELECTRICAL HEIGHT-ADJUSTABLE TABLES MARKET, BY TYPE, 2020-2029 (THOUSAND UNITS)
TABLE 72 CANADA FREE STANDING ELECTRICAL HEIGHT-ADJUSTABLE TABLES MARKET, BY APPLICATION, 2020-2029 (USD MILLION)
TABLE 73 CANADA FREE STANDING ELECTRICAL HEIGHT-ADJUSTABLE TABLES MARKET, BY APPLICATION, 2020-2029 (THOUSAND UNITS)
TABLE 74 CANADA OFFICES IN FREE STANDING ELECTRICAL HEIGHT-ADJUSTABLE TABLES MARKET, BY SEGMENT, 2020-2029 (USD MILLION)
TABLE 75 CANADA OFFICES IN FREE STANDING ELECTRICAL HEIGHT-ADJUSTABLE TABLES MARKET, BY SEGMENT, 2020-2029 (THOUSAND UNITS)
TABLE 76 CANADA COMMERCIAL IN FREE STANDING ELECTRICAL HEIGHT-ADJUSTABLE TABLES MARKET, BY SEGMENT, 2020-2029 (USD MILLION)
TABLE 77 CANADA COMMERCIAL IN FREE STANDING ELECTRICAL HEIGHT-ADJUSTABLE TABLES MARKET, BY SEGMENT, 2020-2029 (THOUSAND UNITS)
TABLE 78 CANADA INDUSTRIAL IN FREE STANDING ELECTRICAL HEIGHT-ADJUSTABLE TABLES MARKET, BY SEGMENT, 2020-2029 (USD MILLION)
TABLE 79 CANADA INDUSTRIAL IN FREE STANDING ELECTRICAL HEIGHT-ADJUSTABLE TABLES MARKET, BY SEGMENT, 2020-2029 (THOUSAND UNITS)
TABLE 80 CANADA HOME IN FREE STANDING ELECTRICAL HEIGHT-ADJUSTABLE TABLES MARKET, BY SEGMENT, 2020-2029 (USD MILLION)
TABLE 81 CANADA HOME IN FREE STANDING ELECTRICAL HEIGHT-ADJUSTABLE TABLES MARKET, BY SEGMENT, 2020-2029 (THOUSAND UNITS)
TABLE 82 CANADA FREE STANDING ELECTRICAL HEIGHT-ADJUSTABLE TABLES MARKET, BY SALES CHANNEL, 2020-2029 (USD MILLION)
TABLE 83 CANADA FREE STANDING ELECTRICAL HEIGHT-ADJUSTABLE TABLES MARKET, BY SALES CHANNEL, 2020-2029 (THOUSAND UNITS)
TABLE 84 MEXICO FREE STANDING ELECTRICAL HEIGHT-ADJUSTABLE TABLES MARKET, BY TYPE, 2020-2029 (USD MILLION)
TABLE 85 MEXICO FREE STANDING ELECTRICAL HEIGHT-ADJUSTABLE TABLES MARKET, BY TYPE, 2020-2029 (THOUSAND UNITS)
TABLE 86 MEXICO FREE STANDING ELECTRICAL HEIGHT-ADJUSTABLE TABLES MARKET, BY APPLICATION, 2020-2029 (USD MILLION)
TABLE 87 MEXICO FREE STANDING ELECTRICAL HEIGHT-ADJUSTABLE TABLES MARKET, BY APPLICATION, 2020-2029 (THOUSAND UNITS)
TABLE 88 MEXICO OFFICES IN FREE STANDING ELECTRICAL HEIGHT-ADJUSTABLE TABLES MARKET, BY SEGMENT, 2020-2029 (USD MILLION)
TABLE 89 MEXICO OFFICES IN FREE STANDING ELECTRICAL HEIGHT-ADJUSTABLE TABLES MARKET, BY SEGMENT, 2020-2029 (THOUSAND UNITS)
TABLE 90 MEXICO COMMERCIAL IN FREE STANDING ELECTRICAL HEIGHT-ADJUSTABLE TABLES MARKET, BY SEGMENT, 2020-2029 (USD MILLION)
TABLE 91 MEXICO COMMERCIAL IN FREE STANDING ELECTRICAL HEIGHT-ADJUSTABLE TABLES MARKET, BY SEGMENT, 2020-2029 (THOUSAND UNITS)
TABLE 92 MEXICO INDUSTRIAL IN FREE STANDING ELECTRICAL HEIGHT-ADJUSTABLE TABLES MARKET, BY SEGMENT, 2020-2029 (USD MILLION)
TABLE 93 MEXICO INDUSTRIAL IN FREE STANDING ELECTRICAL HEIGHT-ADJUSTABLE TABLES MARKET, BY SEGMENT, 2020-2029 (THOUSAND UNITS)
TABLE 94 MEXICO HOME IN FREE STANDING ELECTRICAL HEIGHT-ADJUSTABLE TABLES MARKET, BY SEGMENT, 2020-2029 (USD MILLION)
TABLE 95 MEXICO HOME IN FREE STANDING ELECTRICAL HEIGHT-ADJUSTABLE TABLES MARKET, BY SEGMENT, 2020-2029 (THOUSAND UNITS)
TABLE 96 MEXICO FREE STANDING ELECTRICAL HEIGHT-ADJUSTABLE TABLES MARKET, BY SALES CHANNEL, 2020-2029 (USD MILLION)
TABLE 97 MEXICO FREE STANDING ELECTRICAL HEIGHT-ADJUSTABLE TABLES MARKET, BY SALES CHANNEL, 2020-2029 (THOUSAND UNITS)
TABLE 98 EUROPE FREE STANDING ELECTRICAL HEIGHT-ADJUSTABLE TABLES MARKET, BY COUNTRY, 2020-2029 (USD MILLION)
TABLE 99 EUROPE FREE STANDING ELECTRICAL HEIGHT-ADJUSTABLE TABLES MARKET, BY COUNTRY, 2020-2029 (THOUSAND UNITS)
TABLE 100 EUROPE FREE STANDING ELECTRICAL HEIGHT-ADJUSTABLE TABLES MARKET, BY TYPE, 2020-2029 (USD MILLION)
TABLE 101 EUROPE FREE STANDING ELECTRICAL HEIGHT-ADJUSTABLE TABLES MARKET, BY TYPE, 2020-2029 (THOUSAND UNITS)
TABLE 102 EUROPE FREE STANDING ELECTRICAL HEIGHT-ADJUSTABLE TABLES MARKET, BY APPLICATION, 2020-2029 (USD MILLION)
TABLE 103 EUROPE FREE STANDING ELECTRICAL HEIGHT-ADJUSTABLE TABLES MARKET, BY APPLICATION, 2020-2029 (THOUSAND UNITS)
TABLE 104 EUROPE OFFICES IN FREE STANDING ELECTRICAL HEIGHT-ADJUSTABLE TABLES MARKET, BY SEGMENT, 2020-2029 (USD MILLION)
TABLE 105 EUROPE OFFICES IN FREE STANDING ELECTRICAL HEIGHT-ADJUSTABLE TABLES MARKET, BY SEGMENT, 2020-2029 (THOUSAND UNITS)
TABLE 106 EUROPE COMMERCIAL IN FREE STANDING ELECTRICAL HEIGHT-ADJUSTABLE TABLES MARKET, BY SEGMENT, 2020-2029 (USD MILLION)
TABLE 107 EUROPE COMMERCIAL IN FREE STANDING ELECTRICAL HEIGHT-ADJUSTABLE TABLES MARKET, BY SEGMENT, 2020-2029 (THOUSAND UNITS)
TABLE 108 EUROPE INDUSTRIAL IN FREE STANDING ELECTRICAL HEIGHT-ADJUSTABLE TABLES MARKET, BY SEGMENT, 2020-2029 (USD MILLION)
TABLE 109 EUROPE INDUSTRIAL IN FREE STANDING ELECTRICAL HEIGHT-ADJUSTABLE TABLES MARKET, BY SEGMENT, 2020-2029 (THOUSAND UNITS)
TABLE 110 EUROPE HOME IN FREE STANDING ELECTRICAL HEIGHT-ADJUSTABLE TABLES MARKET, BY SEGMENT, 2020-2029 (USD MILLION)
TABLE 111 EUROPE HOME IN FREE STANDING ELECTRICAL HEIGHT-ADJUSTABLE TABLES MARKET, BY SEGMENT, 2020-2029 (THOUSAND UNITS)
TABLE 112 EUROPE FREE STANDING ELECTRICAL HEIGHT-ADJUSTABLE TABLES MARKET, BY SALES CHANNEL, 2020-2029 (USD MILLION)
TABLE 113 EUROPE FREE STANDING ELECTRICAL HEIGHT-ADJUSTABLE TABLES MARKET, BY SALES CHANNEL, 2020-2029 (THOUSAND UNITS)
TABLE 114 GERMANY FREE STANDING ELECTRICAL HEIGHT-ADJUSTABLE TABLES MARKET, BY TYPE, 2020-2029 (USD MILLION)
TABLE 115 GERMANY FREE STANDING ELECTRICAL HEIGHT-ADJUSTABLE TABLES MARKET, BY TYPE, 2020-2029 (THOUSAND UNITS)
TABLE 116 GERMANY FREE STANDING ELECTRICAL HEIGHT-ADJUSTABLE TABLES MARKET, BY APPLICATION, 2020-2029 (USD MILLION)
TABLE 117 GERMANY FREE STANDING ELECTRICAL HEIGHT-ADJUSTABLE TABLES MARKET, BY APPLICATION, 2020-2029 (THOUSAND UNITS)
TABLE 118 GERMANY OFFICES IN FREE STANDING ELECTRICAL HEIGHT-ADJUSTABLE TABLES MARKET, BY SEGMENT, 2020-2029 (USD MILLION)
TABLE 119 GERMANY OFFICES IN FREE STANDING ELECTRICAL HEIGHT-ADJUSTABLE TABLES MARKET, BY SEGMENT, 2020-2029 (THOUSAND UNITS)
TABLE 120 GERMANY COMMERCIAL IN FREE STANDING ELECTRICAL HEIGHT-ADJUSTABLE TABLES MARKET, BY SEGMENT, 2020-2029 (USD MILLION)
TABLE 121 GERMANY COMMERCIAL IN FREE STANDING ELECTRICAL HEIGHT-ADJUSTABLE TABLES MARKET, BY SEGMENT, 2020-2029 (THOUSAND UNITS)
TABLE 122 GERMANY INDUSTRIAL IN FREE STANDING ELECTRICAL HEIGHT-ADJUSTABLE TABLES MARKET, BY SEGMENT, 2020-2029 (USD MILLION)
TABLE 123 GERMANY INDUSTRIAL IN FREE STANDING ELECTRICAL HEIGHT-ADJUSTABLE TABLES MARKET, BY SEGMENT, 2020-2029 (THOUSAND UNITS)
TABLE 124 GERMANY HOME IN FREE STANDING ELECTRICAL HEIGHT-ADJUSTABLE TABLES MARKET, BY SEGMENT, 2020-2029 (USD MILLION)
TABLE 125 GERMANY HOME IN FREE STANDING ELECTRICAL HEIGHT-ADJUSTABLE TABLES MARKET, BY SEGMENT, 2020-2029 (THOUSAND UNITS)
TABLE 126 GERMANY FREE STANDING ELECTRICAL HEIGHT-ADJUSTABLE TABLES MARKET, BY SALES CHANNEL, 2020-2029 (USD MILLION)
TABLE 127 GERMANY FREE STANDING ELECTRICAL HEIGHT-ADJUSTABLE TABLES MARKET, BY SALES CHANNEL, 2020-2029 (THOUSAND UNITS)
TABLE 128 ITALY FREE STANDING ELECTRICAL HEIGHT-ADJUSTABLE TABLES MARKET, BY TYPE, 2020-2029 (USD MILLION)
TABLE 129 ITALY FREE STANDING ELECTRICAL HEIGHT-ADJUSTABLE TABLES MARKET, BY TYPE, 2020-2029 (THOUSAND UNITS)
TABLE 130 ITALY FREE STANDING ELECTRICAL HEIGHT-ADJUSTABLE TABLES MARKET, BY APPLICATION, 2020-2029 (USD MILLION)
TABLE 131 ITALY FREE STANDING ELECTRICAL HEIGHT-ADJUSTABLE TABLES MARKET, BY APPLICATION, 2020-2029 (THOUSAND UNITS)
TABLE 132 ITALY OFFICES IN FREE STANDING ELECTRICAL HEIGHT-ADJUSTABLE TABLES MARKET, BY SEGMENT, 2020-2029 (USD MILLION)
TABLE 133 ITALY OFFICES IN FREE STANDING ELECTRICAL HEIGHT-ADJUSTABLE TABLES MARKET, BY SEGMENT, 2020-2029 (THOUSAND UNITS)
TABLE 134 ITALY COMMERCIAL IN FREE STANDING ELECTRICAL HEIGHT-ADJUSTABLE TABLES MARKET, BY SEGMENT, 2020-2029 (USD MILLION)
TABLE 135 ITALY COMMERCIAL IN FREE STANDING ELECTRICAL HEIGHT-ADJUSTABLE TABLES MARKET, BY SEGMENT, 2020-2029 (THOUSAND UNITS)
TABLE 136 ITALY INDUSTRIAL IN FREE STANDING ELECTRICAL HEIGHT-ADJUSTABLE TABLES MARKET, BY SEGMENT, 2020-2029 (USD MILLION)
TABLE 137 ITALY INDUSTRIAL IN FREE STANDING ELECTRICAL HEIGHT-ADJUSTABLE TABLES MARKET, BY SEGMENT, 2020-2029 (THOUSAND UNITS)
TABLE 138 ITALY HOME IN FREE STANDING ELECTRICAL HEIGHT-ADJUSTABLE TABLES MARKET, BY SEGMENT, 2020-2029 (USD MILLION)
TABLE 139 ITALY HOME IN FREE STANDING ELECTRICAL HEIGHT-ADJUSTABLE TABLES MARKET, BY SEGMENT, 2020-2029 (THOUSAND UNITS)
TABLE 140 ITALY FREE STANDING ELECTRICAL HEIGHT-ADJUSTABLE TABLES MARKET, BY SALES CHANNEL, 2020-2029 (USD MILLION)
TABLE 141 ITALY FREE STANDING ELECTRICAL HEIGHT-ADJUSTABLE TABLES MARKET, BY SALES CHANNEL, 2020-2029 (THOUSAND UNITS)
TABLE 142 FRANCE FREE STANDING ELECTRICAL HEIGHT-ADJUSTABLE TABLES MARKET, BY TYPE, 2020-2029 (USD MILLION)
TABLE 143 FRANCE FREE STANDING ELECTRICAL HEIGHT-ADJUSTABLE TABLES MARKET, BY TYPE, 2020-2029 (THOUSAND UNITS)
TABLE 144 FRANCE FREE STANDING ELECTRICAL HEIGHT-ADJUSTABLE TABLES MARKET, BY APPLICATION, 2020-2029 (USD MILLION)
TABLE 145 FRANCE FREE STANDING ELECTRICAL HEIGHT-ADJUSTABLE TABLES MARKET, BY APPLICATION, 2020-2029 (THOUSAND UNITS)
TABLE 146 FRANCE OFFICES IN FREE STANDING ELECTRICAL HEIGHT-ADJUSTABLE TABLES MARKET, BY SEGMENT, 2020-2029 (USD MILLION)
TABLE 147 FRANCE OFFICES IN FREE STANDING ELECTRICAL HEIGHT-ADJUSTABLE TABLES MARKET, BY SEGMENT, 2020-2029 (THOUSAND UNITS)
TABLE 148 FRANCE COMMERCIAL IN FREE STANDING ELECTRICAL HEIGHT-ADJUSTABLE TABLES MARKET, BY SEGMENT, 2020-2029 (USD MILLION)
TABLE 149 FRANCE COMMERCIAL IN FREE STANDING ELECTRICAL HEIGHT-ADJUSTABLE TABLES MARKET, BY SEGMENT, 2020-2029 (THOUSAND UNITS)
TABLE 150 FRANCE INDUSTRIAL IN FREE STANDING ELECTRICAL HEIGHT-ADJUSTABLE TABLES MARKET, BY SEGMENT, 2020-2029 (USD MILLION)
TABLE 151 FRANCE INDUSTRIAL IN FREE STANDING ELECTRICAL HEIGHT-ADJUSTABLE TABLES MARKET, BY SEGMENT, 2020-2029 (THOUSAND UNITS)
TABLE 152 FRANCE HOME IN FREE STANDING ELECTRICAL HEIGHT-ADJUSTABLE TABLES MARKET, BY SEGMENT, 2020-2029 (USD MILLION)
TABLE 153 FRANCE HOME IN FREE STANDING ELECTRICAL HEIGHT-ADJUSTABLE TABLES MARKET, BY SEGMENT, 2020-2029 (THOUSAND UNITS)
TABLE 154 FRANCE FREE STANDING ELECTRICAL HEIGHT-ADJUSTABLE TABLES MARKET, BY SALES CHANNEL, 2020-2029 (USD MILLION)
TABLE 155 FRANCE FREE STANDING ELECTRICAL HEIGHT-ADJUSTABLE TABLES MARKET, BY SALES CHANNEL, 2020-2029 (THOUSAND UNITS)
TABLE 156 U.K. FREE STANDING ELECTRICAL HEIGHT-ADJUSTABLE TABLES MARKET, BY TYPE, 2020-2029 (USD MILLION)
TABLE 157 U.K. FREE STANDING ELECTRICAL HEIGHT-ADJUSTABLE TABLES MARKET, BY TYPE, 2020-2029 (THOUSAND UNITS)
TABLE 158 U.K. FREE STANDING ELECTRICAL HEIGHT-ADJUSTABLE TABLES MARKET, BY APPLICATION, 2020-2029 (USD MILLION)
TABLE 159 U.K. FREE STANDING ELECTRICAL HEIGHT-ADJUSTABLE TABLES MARKET, BY APPLICATION, 2020-2029 (THOUSAND UNITS)
TABLE 160 U.K. OFFICES IN FREE STANDING ELECTRICAL HEIGHT-ADJUSTABLE TABLES MARKET, BY SEGMENT, 2020-2029 (USD MILLION)
TABLE 161 U.K. OFFICES IN FREE STANDING ELECTRICAL HEIGHT-ADJUSTABLE TABLES MARKET, BY SEGMENT, 2020-2029 (THOUSAND UNITS)
TABLE 162 U.K. COMMERCIAL IN FREE STANDING ELECTRICAL HEIGHT-ADJUSTABLE TABLES MARKET, BY SEGMENT, 2020-2029 (USD MILLION)
TABLE 163 U.K. COMMERCIAL IN FREE STANDING ELECTRICAL HEIGHT-ADJUSTABLE TABLES MARKET, BY SEGMENT, 2020-2029 (THOUSAND UNITS)
TABLE 164 U.K. INDUSTRIAL IN FREE STANDING ELECTRICAL HEIGHT-ADJUSTABLE TABLES MARKET, BY SEGMENT, 2020-2029 (USD MILLION)
TABLE 165 U.K. INDUSTRIAL IN FREE STANDING ELECTRICAL HEIGHT-ADJUSTABLE TABLES MARKET, BY SEGMENT, 2020-2029 (THOUSAND UNITS)
TABLE 166 U.K. HOME IN FREE STANDING ELECTRICAL HEIGHT-ADJUSTABLE TABLES MARKET, BY SEGMENT, 2020-2029 (USD MILLION)
TABLE 167 U.K. HOME IN FREE STANDING ELECTRICAL HEIGHT-ADJUSTABLE TABLES MARKET, BY SEGMENT, 2020-2029 (THOUSAND UNITS)
TABLE 168 U.K. FREE STANDING ELECTRICAL HEIGHT-ADJUSTABLE TABLES MARKET, BY SALES CHANNEL, 2020-2029 (USD MILLION)
TABLE 169 U.K. FREE STANDING ELECTRICAL HEIGHT-ADJUSTABLE TABLES MARKET, BY SALES CHANNEL, 2020-2029 (THOUSAND UNITS)
TABLE 170 POLAND FREE STANDING ELECTRICAL HEIGHT-ADJUSTABLE TABLES MARKET, BY TYPE, 2020-2029 (USD MILLION)
TABLE 171 POLAND FREE STANDING ELECTRICAL HEIGHT-ADJUSTABLE TABLES MARKET, BY TYPE, 2020-2029 (THOUSAND UNITS)
TABLE 172 POLAND FREE STANDING ELECTRICAL HEIGHT-ADJUSTABLE TABLES MARKET, BY APPLICATION, 2020-2029 (USD MILLION)
TABLE 173 POLAND FREE STANDING ELECTRICAL HEIGHT-ADJUSTABLE TABLES MARKET, BY APPLICATION, 2020-2029 (THOUSAND UNITS)
TABLE 174 POLAND OFFICES IN FREE STANDING ELECTRICAL HEIGHT-ADJUSTABLE TABLES MARKET, BY SEGMENT, 2020-2029 (USD MILLION)
TABLE 175 POLAND OFFICES IN FREE STANDING ELECTRICAL HEIGHT-ADJUSTABLE TABLES MARKET, BY SEGMENT, 2020-2029 (THOUSAND UNITS)
TABLE 176 POLAND COMMERCIAL IN FREE STANDING ELECTRICAL HEIGHT-ADJUSTABLE TABLES MARKET, BY SEGMENT, 2020-2029 (USD MILLION)
TABLE 177 POLAND COMMERCIAL IN FREE STANDING ELECTRICAL HEIGHT-ADJUSTABLE TABLES MARKET, BY SEGMENT, 2020-2029 (THOUSAND UNITS)
TABLE 178 POLAND INDUSTRIAL IN FREE STANDING ELECTRICAL HEIGHT-ADJUSTABLE TABLES MARKET, BY SEGMENT, 2020-2029 (USD MILLION)
TABLE 179 POLAND INDUSTRIAL IN FREE STANDING ELECTRICAL HEIGHT-ADJUSTABLE TABLES MARKET, BY SEGMENT, 2020-2029 (THOUSAND UNITS)
TABLE 180 POLAND HOME IN FREE STANDING ELECTRICAL HEIGHT-ADJUSTABLE TABLES MARKET, BY SEGMENT, 2020-2029 (USD MILLION)
TABLE 181 POLAND HOME IN FREE STANDING ELECTRICAL HEIGHT-ADJUSTABLE TABLES MARKET, BY SEGMENT, 2020-2029 (THOUSAND UNITS)
TABLE 182 POLAND FREE STANDING ELECTRICAL HEIGHT-ADJUSTABLE TABLES MARKET, BY SALES CHANNEL, 2020-2029 (USD MILLION)
TABLE 183 POLAND FREE STANDING ELECTRICAL HEIGHT-ADJUSTABLE TABLES MARKET, BY SALES CHANNEL, 2020-2029 (THOUSAND UNITS)
TABLE 184 NETHERLANDS FREE STANDING ELECTRICAL HEIGHT-ADJUSTABLE TABLES MARKET, BY TYPE, 2020-2029 (USD MILLION)
TABLE 185 NETHERLANDS FREE STANDING ELECTRICAL HEIGHT-ADJUSTABLE TABLES MARKET, BY TYPE, 2020-2029 (THOUSAND UNITS)
TABLE 186 NETHERLANDS FREE STANDING ELECTRICAL HEIGHT-ADJUSTABLE TABLES MARKET, BY APPLICATION, 2020-2029 (USD MILLION)
TABLE 187 NETHERLANDS FREE STANDING ELECTRICAL HEIGHT-ADJUSTABLE TABLES MARKET, BY APPLICATION, 2020-2029 (THOUSAND UNITS)
TABLE 188 NETHERLANDS OFFICES IN FREE STANDING ELECTRICAL HEIGHT-ADJUSTABLE TABLES MARKET, BY SEGMENT, 2020-2029 (USD MILLION)
TABLE 189 NETHERLANDS OFFICES IN FREE STANDING ELECTRICAL HEIGHT-ADJUSTABLE TABLES MARKET, BY SEGMENT, 2020-2029 (THOUSAND UNITS)
TABLE 190 NETHERLANDS COMMERCIAL IN FREE STANDING ELECTRICAL HEIGHT-ADJUSTABLE TABLES MARKET, BY SEGMENT, 2020-2029 (USD MILLION)
TABLE 191 NETHERLANDS COMMERCIAL IN FREE STANDING ELECTRICAL HEIGHT-ADJUSTABLE TABLES MARKET, BY SEGMENT, 2020-2029 (THOUSAND UNITS)
TABLE 192 NETHERLANDS INDUSTRIAL IN FREE STANDING ELECTRICAL HEIGHT-ADJUSTABLE TABLES MARKET, BY SEGMENT, 2020-2029 (USD MILLION)
TABLE 193 NETHERLANDS INDUSTRIAL IN FREE STANDING ELECTRICAL HEIGHT-ADJUSTABLE TABLES MARKET, BY SEGMENT, 2020-2029 (THOUSAND UNITS)
TABLE 194 NETHERLANDS HOME IN FREE STANDING ELECTRICAL HEIGHT-ADJUSTABLE TABLES MARKET, BY SEGMENT, 2020-2029 (USD MILLION)
TABLE 195 NETHERLANDS HOME IN FREE STANDING ELECTRICAL HEIGHT-ADJUSTABLE TABLES MARKET, BY SEGMENT, 2020-2029 (THOUSAND UNITS)
TABLE 196 NETHERLANDS FREE STANDING ELECTRICAL HEIGHT-ADJUSTABLE TABLES MARKET, BY SALES CHANNEL, 2020-2029 (USD MILLION)
TABLE 197 NETHERLANDS FREE STANDING ELECTRICAL HEIGHT-ADJUSTABLE TABLES MARKET, BY SALES CHANNEL, 2020-2029 (THOUSAND UNITS)
TABLE 198 SPAIN FREE STANDING ELECTRICAL HEIGHT-ADJUSTABLE TABLES MARKET, BY TYPE, 2020-2029 (USD MILLION)
TABLE 199 SPAIN FREE STANDING ELECTRICAL HEIGHT-ADJUSTABLE TABLES MARKET, BY TYPE, 2020-2029 (THOUSAND UNITS)
TABLE 200 SPAIN FREE STANDING ELECTRICAL HEIGHT-ADJUSTABLE TABLES MARKET, BY APPLICATION, 2020-2029 (USD MILLION)
TABLE 201 SPAIN FREE STANDING ELECTRICAL HEIGHT-ADJUSTABLE TABLES MARKET, BY APPLICATION, 2020-2029 (THOUSAND UNITS)
TABLE 202 SPAIN OFFICES IN FREE STANDING ELECTRICAL HEIGHT-ADJUSTABLE TABLES MARKET, BY SEGMENT, 2020-2029 (USD MILLION)
TABLE 203 SPAIN OFFICES IN FREE STANDING ELECTRICAL HEIGHT-ADJUSTABLE TABLES MARKET, BY SEGMENT, 2020-2029 (THOUSAND UNITS)
TABLE 204 SPAIN COMMERCIAL IN FREE STANDING ELECTRICAL HEIGHT-ADJUSTABLE TABLES MARKET, BY SEGMENT, 2020-2029 (USD MILLION)
TABLE 205 SPAIN COMMERCIAL IN FREE STANDING ELECTRICAL HEIGHT-ADJUSTABLE TABLES MARKET, BY SEGMENT, 2020-2029 (THOUSAND UNITS)
TABLE 206 SPAIN INDUSTRIAL IN FREE STANDING ELECTRICAL HEIGHT-ADJUSTABLE TABLES MARKET, BY SEGMENT, 2020-2029 (USD MILLION)
TABLE 207 SPAIN INDUSTRIAL IN FREE STANDING ELECTRICAL HEIGHT-ADJUSTABLE TABLES MARKET, BY SEGMENT, 2020-2029 (THOUSAND UNITS)
TABLE 208 SPAIN HOME IN FREE STANDING ELECTRICAL HEIGHT-ADJUSTABLE TABLES MARKET, BY SEGMENT, 2020-2029 (USD MILLION)
TABLE 209 SPAIN HOME IN FREE STANDING ELECTRICAL HEIGHT-ADJUSTABLE TABLES MARKET, BY SEGMENT, 2020-2029 (THOUSAND UNITS)
TABLE 210 SPAIN FREE STANDING ELECTRICAL HEIGHT-ADJUSTABLE TABLES MARKET, BY SALES CHANNEL, 2020-2029 (USD MILLION)
TABLE 211 SPAIN FREE STANDING ELECTRICAL HEIGHT-ADJUSTABLE TABLES MARKET, BY SALES CHANNEL, 2020-2029 (THOUSAND UNITS)
TABLE 212 AUSTRIA FREE STANDING ELECTRICAL HEIGHT-ADJUSTABLE TABLES MARKET, BY TYPE, 2020-2029 (USD MILLION)
TABLE 213 AUSTRIA FREE STANDING ELECTRICAL HEIGHT-ADJUSTABLE TABLES MARKET, BY TYPE, 2020-2029 (THOUSAND UNITS)
TABLE 214 AUSTRIA FREE STANDING ELECTRICAL HEIGHT-ADJUSTABLE TABLES MARKET, BY APPLICATION, 2020-2029 (USD MILLION)
TABLE 215 AUSTRIA FREE STANDING ELECTRICAL HEIGHT-ADJUSTABLE TABLES MARKET, BY APPLICATION, 2020-2029 (THOUSAND UNITS)
TABLE 216 AUSTRIA OFFICES IN FREE STANDING ELECTRICAL HEIGHT-ADJUSTABLE TABLES MARKET, BY SEGMENT, 2020-2029 (USD MILLION)
TABLE 217 AUSTRIA OFFICES IN FREE STANDING ELECTRICAL HEIGHT-ADJUSTABLE TABLES MARKET, BY SEGMENT, 2020-2029 (THOUSAND UNITS)
TABLE 218 AUSTRIA COMMERCIAL IN FREE STANDING ELECTRICAL HEIGHT-ADJUSTABLE TABLES MARKET, BY SEGMENT, 2020-2029 (USD MILLION)
TABLE 219 AUSTRIA COMMERCIAL IN FREE STANDING ELECTRICAL HEIGHT-ADJUSTABLE TABLES MARKET, BY SEGMENT, 2020-2029 (THOUSAND UNITS)
TABLE 220 AUSTRIA INDUSTRIAL IN FREE STANDING ELECTRICAL HEIGHT-ADJUSTABLE TABLES MARKET, BY SEGMENT, 2020-2029 (USD MILLION)
TABLE 221 AUSTRIA INDUSTRIAL IN FREE STANDING ELECTRICAL HEIGHT-ADJUSTABLE TABLES MARKET, BY SEGMENT, 2020-2029 (THOUSAND UNITS)
TABLE 222 AUSTRIA HOME IN FREE STANDING ELECTRICAL HEIGHT-ADJUSTABLE TABLES MARKET, BY SEGMENT, 2020-2029 (USD MILLION)
TABLE 223 AUSTRIA HOME IN FREE STANDING ELECTRICAL HEIGHT-ADJUSTABLE TABLES MARKET, BY SEGMENT, 2020-2029 (THOUSAND UNITS)
TABLE 224 AUSTRIA FREE STANDING ELECTRICAL HEIGHT-ADJUSTABLE TABLES MARKET, BY SALES CHANNEL, 2020-2029 (USD MILLION)
TABLE 225 AUSTRIA FREE STANDING ELECTRICAL HEIGHT-ADJUSTABLE TABLES MARKET, BY SALES CHANNEL, 2020-2029 (THOUSAND UNITS)
TABLE 226 SWEDEN FREE STANDING ELECTRICAL HEIGHT-ADJUSTABLE TABLES MARKET, BY TYPE, 2020-2029 (USD MILLION)
TABLE 227 SWEDEN FREE STANDING ELECTRICAL HEIGHT-ADJUSTABLE TABLES MARKET, BY TYPE, 2020-2029 (THOUSAND UNITS)
TABLE 228 SWEDEN FREE STANDING ELECTRICAL HEIGHT-ADJUSTABLE TABLES MARKET, BY APPLICATION, 2020-2029 (USD MILLION)
TABLE 229 SWEDEN FREE STANDING ELECTRICAL HEIGHT-ADJUSTABLE TABLES MARKET, BY APPLICATION, 2020-2029 (THOUSAND UNITS)
TABLE 230 SWEDEN OFFICES IN FREE STANDING ELECTRICAL HEIGHT-ADJUSTABLE TABLES MARKET, BY SEGMENT, 2020-2029 (USD MILLION)
TABLE 231 SWEDEN OFFICES IN FREE STANDING ELECTRICAL HEIGHT-ADJUSTABLE TABLES MARKET, BY SEGMENT, 2020-2029 (THOUSAND UNITS)
TABLE 232 SWEDEN COMMERCIAL IN FREE STANDING ELECTRICAL HEIGHT-ADJUSTABLE TABLES MARKET, BY SEGMENT, 2020-2029 (USD MILLION)
TABLE 233 SWEDEN COMMERCIAL IN FREE STANDING ELECTRICAL HEIGHT-ADJUSTABLE TABLES MARKET, BY SEGMENT, 2020-2029 (THOUSAND UNITS)
TABLE 234 SWEDEN INDUSTRIAL IN FREE STANDING ELECTRICAL HEIGHT-ADJUSTABLE TABLES MARKET, BY SEGMENT, 2020-2029 (USD MILLION)
TABLE 235 SWEDEN INDUSTRIAL IN FREE STANDING ELECTRICAL HEIGHT-ADJUSTABLE TABLES MARKET, BY SEGMENT, 2020-2029 (THOUSAND UNITS)
TABLE 236 SWEDEN HOME IN FREE STANDING ELECTRICAL HEIGHT-ADJUSTABLE TABLES MARKET, BY SEGMENT, 2020-2029 (USD MILLION)
TABLE 237 SWEDEN HOME IN FREE STANDING ELECTRICAL HEIGHT-ADJUSTABLE TABLES MARKET, BY SEGMENT, 2020-2029 (THOUSAND UNITS)
TABLE 238 SWEDEN FREE STANDING ELECTRICAL HEIGHT-ADJUSTABLE TABLES MARKET, BY SALES CHANNEL, 2020-2029 (USD MILLION)
TABLE 239 SWEDEN FREE STANDING ELECTRICAL HEIGHT-ADJUSTABLE TABLES MARKET, BY SALES CHANNEL, 2020-2029 (THOUSAND UNITS)
TABLE 240 DENMARK FREE STANDING ELECTRICAL HEIGHT-ADJUSTABLE TABLES MARKET, BY TYPE, 2020-2029 (USD MILLION)
TABLE 241 DENMARK FREE STANDING ELECTRICAL HEIGHT-ADJUSTABLE TABLES MARKET, BY TYPE, 2020-2029 (THOUSAND UNITS)
TABLE 242 DENMARK FREE STANDING ELECTRICAL HEIGHT-ADJUSTABLE TABLES MARKET, BY APPLICATION, 2020-2029 (USD MILLION)
TABLE 243 DENMARK FREE STANDING ELECTRICAL HEIGHT-ADJUSTABLE TABLES MARKET, BY APPLICATION, 2020-2029 (THOUSAND UNITS)
TABLE 244 DENMARK OFFICES IN FREE STANDING ELECTRICAL HEIGHT-ADJUSTABLE TABLES MARKET, BY SEGMENT, 2020-2029 (USD MILLION)
TABLE 245 DENMARK OFFICES IN FREE STANDING ELECTRICAL HEIGHT-ADJUSTABLE TABLES MARKET, BY SEGMENT, 2020-2029 (THOUSAND UNITS)
TABLE 246 DENMARK COMMERCIAL IN FREE STANDING ELECTRICAL HEIGHT-ADJUSTABLE TABLES MARKET, BY SEGMENT, 2020-2029 (USD MILLION)
TABLE 247 DENMARK COMMERCIAL IN FREE STANDING ELECTRICAL HEIGHT-ADJUSTABLE TABLES MARKET, BY SEGMENT, 2020-2029 (THOUSAND UNITS)
TABLE 248 DENMARK INDUSTRIAL IN FREE STANDING ELECTRICAL HEIGHT-ADJUSTABLE TABLES MARKET, BY SEGMENT, 2020-2029 (USD MILLION)
TABLE 249 DENMARK INDUSTRIAL IN FREE STANDING ELECTRICAL HEIGHT-ADJUSTABLE TABLES MARKET, BY SEGMENT, 2020-2029 (THOUSAND UNITS)
TABLE 250 DENMARK HOME IN FREE STANDING ELECTRICAL HEIGHT-ADJUSTABLE TABLES MARKET, BY SEGMENT, 2020-2029 (USD MILLION)
TABLE 251 DENMARK HOME IN FREE STANDING ELECTRICAL HEIGHT-ADJUSTABLE TABLES MARKET, BY SEGMENT, 2020-2029 (THOUSAND UNITS)
TABLE 252 DENMARK FREE STANDING ELECTRICAL HEIGHT-ADJUSTABLE TABLES MARKET, BY SALES CHANNEL, 2020-2029 (USD MILLION)
TABLE 253 DENMARK FREE STANDING ELECTRICAL HEIGHT-ADJUSTABLE TABLES MARKET, BY SALES CHANNEL, 2020-2029 (THOUSAND UNITS)
TABLE 254 BELGIUM FREE STANDING ELECTRICAL HEIGHT-ADJUSTABLE TABLES MARKET, BY TYPE, 2020-2029 (USD MILLION)
TABLE 255 BELGIUM FREE STANDING ELECTRICAL HEIGHT-ADJUSTABLE TABLES MARKET, BY TYPE, 2020-2029 (THOUSAND UNITS)
TABLE 256 BELGIUM FREE STANDING ELECTRICAL HEIGHT-ADJUSTABLE TABLES MARKET, BY APPLICATION, 2020-2029 (USD MILLION)
TABLE 257 BELGIUM FREE STANDING ELECTRICAL HEIGHT-ADJUSTABLE TABLES MARKET, BY APPLICATION, 2020-2029 (THOUSAND UNITS)
TABLE 258 BELGIUM OFFICES IN FREE STANDING ELECTRICAL HEIGHT-ADJUSTABLE TABLES MARKET, BY SEGMENT, 2020-2029 (USD MILLION)
TABLE 259 BELGIUM OFFICES IN FREE STANDING ELECTRICAL HEIGHT-ADJUSTABLE TABLES MARKET, BY SEGMENT, 2020-2029 (THOUSAND UNITS)
TABLE 260 BELGIUM COMMERCIAL IN FREE STANDING ELECTRICAL HEIGHT-ADJUSTABLE TABLES MARKET, BY SEGMENT, 2020-2029 (USD MILLION)
TABLE 261 BELGIUM COMMERCIAL IN FREE STANDING ELECTRICAL HEIGHT-ADJUSTABLE TABLES MARKET, BY SEGMENT, 2020-2029 (THOUSAND UNITS)
TABLE 262 BELGIUM INDUSTRIAL IN FREE STANDING ELECTRICAL HEIGHT-ADJUSTABLE TABLES MARKET, BY SEGMENT, 2020-2029 (USD MILLION)
TABLE 263 BELGIUM INDUSTRIAL IN FREE STANDING ELECTRICAL HEIGHT-ADJUSTABLE TABLES MARKET, BY SEGMENT, 2020-2029 (THOUSAND UNITS)
TABLE 264 BELGIUM HOME IN FREE STANDING ELECTRICAL HEIGHT-ADJUSTABLE TABLES MARKET, BY SEGMENT, 2020-2029 (USD MILLION)
TABLE 265 BELGIUM HOME IN FREE STANDING ELECTRICAL HEIGHT-ADJUSTABLE TABLES MARKET, BY SEGMENT, 2020-2029 (THOUSAND UNITS)
TABLE 266 BELGIUM FREE STANDING ELECTRICAL HEIGHT-ADJUSTABLE TABLES MARKET, BY SALES CHANNEL, 2020-2029 (USD MILLION)
TABLE 267 BELGIUM FREE STANDING ELECTRICAL HEIGHT-ADJUSTABLE TABLES MARKET, BY SALES CHANNEL, 2020-2029 (THOUSAND UNITS)
TABLE 268 RUSSIA FREE STANDING ELECTRICAL HEIGHT-ADJUSTABLE TABLES MARKET, BY TYPE, 2020-2029 (USD MILLION)
TABLE 269 RUSSIA FREE STANDING ELECTRICAL HEIGHT-ADJUSTABLE TABLES MARKET, BY TYPE, 2020-2029 (THOUSAND UNITS)
TABLE 270 RUSSIA FREE STANDING ELECTRICAL HEIGHT-ADJUSTABLE TABLES MARKET, BY APPLICATION, 2020-2029 (USD MILLION)
TABLE 271 RUSSIA FREE STANDING ELECTRICAL HEIGHT-ADJUSTABLE TABLES MARKET, BY APPLICATION, 2020-2029 (THOUSAND UNITS)
TABLE 272 RUSSIA OFFICES IN FREE STANDING ELECTRICAL HEIGHT-ADJUSTABLE TABLES MARKET, BY SEGMENT, 2020-2029 (USD MILLION)
TABLE 273 RUSSIA OFFICES IN FREE STANDING ELECTRICAL HEIGHT-ADJUSTABLE TABLES MARKET, BY SEGMENT, 2020-2029 (THOUSAND UNITS)
TABLE 274 RUSSIA COMMERCIAL IN FREE STANDING ELECTRICAL HEIGHT-ADJUSTABLE TABLES MARKET, BY SEGMENT, 2020-2029 (USD MILLION)
TABLE 275 RUSSIA COMMERCIAL IN FREE STANDING ELECTRICAL HEIGHT-ADJUSTABLE TABLES MARKET, BY SEGMENT, 2020-2029 (THOUSAND UNITS)
TABLE 276 RUSSIA INDUSTRIAL IN FREE STANDING ELECTRICAL HEIGHT-ADJUSTABLE TABLES MARKET, BY SEGMENT, 2020-2029 (USD MILLION)
TABLE 277 RUSSIA INDUSTRIAL IN FREE STANDING ELECTRICAL HEIGHT-ADJUSTABLE TABLES MARKET, BY SEGMENT, 2020-2029 (THOUSAND UNITS)
TABLE 278 RUSSIA HOME IN FREE STANDING ELECTRICAL HEIGHT-ADJUSTABLE TABLES MARKET, BY SEGMENT, 2020-2029 (USD MILLION)
TABLE 279 RUSSIA HOME IN FREE STANDING ELECTRICAL HEIGHT-ADJUSTABLE TABLES MARKET, BY SEGMENT, 2020-2029 (THOUSAND UNITS)
TABLE 280 RUSSIA FREE STANDING ELECTRICAL HEIGHT-ADJUSTABLE TABLES MARKET, BY SALES CHANNEL, 2020-2029 (USD MILLION)
TABLE 281 RUSSIA FREE STANDING ELECTRICAL HEIGHT-ADJUSTABLE TABLES MARKET, BY SALES CHANNEL, 2020-2029 (THOUSAND UNITS)
TABLE 282 SWITZERLAND FREE STANDING ELECTRICAL HEIGHT-ADJUSTABLE TABLES MARKET, BY TYPE, 2020-2029 (USD MILLION)
TABLE 283 SWITZERLAND FREE STANDING ELECTRICAL HEIGHT-ADJUSTABLE TABLES MARKET, BY TYPE, 2020-2029 (THOUSAND UNITS)
TABLE 284 SWITZERLAND FREE STANDING ELECTRICAL HEIGHT-ADJUSTABLE TABLES MARKET, BY APPLICATION, 2020-2029 (USD MILLION)
TABLE 285 SWITZERLAND FREE STANDING ELECTRICAL HEIGHT-ADJUSTABLE TABLES MARKET, BY APPLICATION, 2020-2029 (THOUSAND UNITS)
TABLE 286 SWITZERLAND OFFICES IN FREE STANDING ELECTRICAL HEIGHT-ADJUSTABLE TABLES MARKET, BY SEGMENT, 2020-2029 (USD MILLION)
TABLE 287 SWITZERLAND OFFICES IN FREE STANDING ELECTRICAL HEIGHT-ADJUSTABLE TABLES MARKET, BY SEGMENT, 2020-2029 (THOUSAND UNITS)
TABLE 288 SWITZERLAND COMMERCIAL IN FREE STANDING ELECTRICAL HEIGHT-ADJUSTABLE TABLES MARKET, BY SEGMENT, 2020-2029 (USD MILLION)
TABLE 289 SWITZERLAND COMMERCIAL IN FREE STANDING ELECTRICAL HEIGHT-ADJUSTABLE TABLES MARKET, BY SEGMENT, 2020-2029 (THOUSAND UNITS)
TABLE 290 SWITZERLAND INDUSTRIAL IN FREE STANDING ELECTRICAL HEIGHT-ADJUSTABLE TABLES MARKET, BY SEGMENT, 2020-2029 (USD MILLION)
TABLE 291 SWITZERLAND INDUSTRIAL IN FREE STANDING ELECTRICAL HEIGHT-ADJUSTABLE TABLES MARKET, BY SEGMENT, 2020-2029 (THOUSAND UNITS)
TABLE 292 SWITZERLAND HOME IN FREE STANDING ELECTRICAL HEIGHT-ADJUSTABLE TABLES MARKET, BY SEGMENT, 2020-2029 (USD MILLION)
TABLE 293 SWITZERLAND HOME IN FREE STANDING ELECTRICAL HEIGHT-ADJUSTABLE TABLES MARKET, BY SEGMENT, 2020-2029 (THOUSAND UNITS)
TABLE 294 SWITZERLAND FREE STANDING ELECTRICAL HEIGHT-ADJUSTABLE TABLES MARKET, BY SALES CHANNEL, 2020-2029 (USD MILLION)
TABLE 295 SWITZERLAND FREE STANDING ELECTRICAL HEIGHT-ADJUSTABLE TABLES MARKET, BY SALES CHANNEL, 2020-2029 (THOUSAND UNITS)
TABLE 296 LUXEMBOURG FREE STANDING ELECTRICAL HEIGHT-ADJUSTABLE TABLES MARKET, BY TYPE, 2020-2029 (USD MILLION)
TABLE 297 LUXEMBOURG FREE STANDING ELECTRICAL HEIGHT-ADJUSTABLE TABLES MARKET, BY TYPE, 2020-2029 (THOUSAND UNITS)
TABLE 298 LUXEMBOURG FREE STANDING ELECTRICAL HEIGHT-ADJUSTABLE TABLES MARKET, BY APPLICATION, 2020-2029 (USD MILLION)
TABLE 299 LUXEMBOURG FREE STANDING ELECTRICAL HEIGHT-ADJUSTABLE TABLES MARKET, BY APPLICATION, 2020-2029 (THOUSAND UNITS)
TABLE 300 LUXEMBOURG OFFICES IN FREE STANDING ELECTRICAL HEIGHT-ADJUSTABLE TABLES MARKET, BY SEGMENT, 2020-2029 (USD MILLION)
TABLE 301 LUXEMBOURG OFFICES IN FREE STANDING ELECTRICAL HEIGHT-ADJUSTABLE TABLES MARKET, BY SEGMENT, 2020-2029 (THOUSAND UNITS)
TABLE 302 LUXEMBOURG COMMERCIAL IN FREE STANDING ELECTRICAL HEIGHT-ADJUSTABLE TABLES MARKET, BY SEGMENT, 2020-2029 (USD MILLION)
TABLE 303 LUXEMBOURG COMMERCIAL IN FREE STANDING ELECTRICAL HEIGHT-ADJUSTABLE TABLES MARKET, BY SEGMENT, 2020-2029 (THOUSAND UNITS)
TABLE 304 LUXEMBOURG INDUSTRIAL IN FREE STANDING ELECTRICAL HEIGHT-ADJUSTABLE TABLES MARKET, BY SEGMENT, 2020-2029 (USD MILLION)
TABLE 305 LUXEMBOURG INDUSTRIAL IN FREE STANDING ELECTRICAL HEIGHT-ADJUSTABLE TABLES MARKET, BY SEGMENT, 2020-2029 (THOUSAND UNITS)
TABLE 306 LUXEMBOURG HOME IN FREE STANDING ELECTRICAL HEIGHT-ADJUSTABLE TABLES MARKET, BY SEGMENT, 2020-2029 (USD MILLION)
TABLE 307 LUXEMBOURG HOME IN FREE STANDING ELECTRICAL HEIGHT-ADJUSTABLE TABLES MARKET, BY SEGMENT, 2020-2029 (THOUSAND UNITS)
TABLE 308 LUXEMBOURG FREE STANDING ELECTRICAL HEIGHT-ADJUSTABLE TABLES MARKET, BY SALES CHANNEL, 2020-2029 (USD MILLION)
TABLE 309 LUXEMBOURG FREE STANDING ELECTRICAL HEIGHT-ADJUSTABLE TABLES MARKET, BY SALES CHANNEL, 2020-2029 (THOUSAND UNITS)
TABLE 310 GREECE FREE STANDING ELECTRICAL HEIGHT-ADJUSTABLE TABLES MARKET, BY TYPE, 2020-2029 (USD MILLION)
TABLE 311 GREECE FREE STANDING ELECTRICAL HEIGHT-ADJUSTABLE TABLES MARKET, BY TYPE, 2020-2029 (THOUSAND UNITS)
TABLE 312 GREECE FREE STANDING ELECTRICAL HEIGHT-ADJUSTABLE TABLES MARKET, BY APPLICATION, 2020-2029 (USD MILLION)
TABLE 313 GREECE FREE STANDING ELECTRICAL HEIGHT-ADJUSTABLE TABLES MARKET, BY APPLICATION, 2020-2029 (THOUSAND UNITS)
TABLE 314 GREECE OFFICES IN FREE STANDING ELECTRICAL HEIGHT-ADJUSTABLE TABLES MARKET, BY SEGMENT, 2020-2029 (USD MILLION)
TABLE 315 GREECE OFFICES IN FREE STANDING ELECTRICAL HEIGHT-ADJUSTABLE TABLES MARKET, BY SEGMENT, 2020-2029 (THOUSAND UNITS)
TABLE 316 GREECE COMMERCIAL IN FREE STANDING ELECTRICAL HEIGHT-ADJUSTABLE TABLES MARKET, BY SEGMENT, 2020-2029 (USD MILLION)
TABLE 317 GREECE COMMERCIAL IN FREE STANDING ELECTRICAL HEIGHT-ADJUSTABLE TABLES MARKET, BY SEGMENT, 2020-2029 (THOUSAND UNITS)
TABLE 318 GREECE INDUSTRIAL IN FREE STANDING ELECTRICAL HEIGHT-ADJUSTABLE TABLES MARKET, BY SEGMENT, 2020-2029 (USD MILLION)
TABLE 319 GREECE INDUSTRIAL IN FREE STANDING ELECTRICAL HEIGHT-ADJUSTABLE TABLES MARKET, BY SEGMENT, 2020-2029 (THOUSAND UNITS)
TABLE 320 GREECE HOME IN FREE STANDING ELECTRICAL HEIGHT-ADJUSTABLE TABLES MARKET, BY SEGMENT, 2020-2029 (USD MILLION)
TABLE 321 GREECE HOME IN FREE STANDING ELECTRICAL HEIGHT-ADJUSTABLE TABLES MARKET, BY SEGMENT, 2020-2029 (THOUSAND UNITS)
TABLE 322 GREECE FREE STANDING ELECTRICAL HEIGHT-ADJUSTABLE TABLES MARKET, BY SALES CHANNEL, 2020-2029 (USD MILLION)
TABLE 323 GREECE FREE STANDING ELECTRICAL HEIGHT-ADJUSTABLE TABLES MARKET, BY SALES CHANNEL, 2020-2029 (THOUSAND UNITS)
TABLE 324 TURKEY FREE STANDING ELECTRICAL HEIGHT-ADJUSTABLE TABLES MARKET, BY TYPE, 2020-2029 (USD MILLION)
TABLE 325 TURKEY FREE STANDING ELECTRICAL HEIGHT-ADJUSTABLE TABLES MARKET, BY TYPE, 2020-2029 (THOUSAND UNITS)
TABLE 326 TURKEY FREE STANDING ELECTRICAL HEIGHT-ADJUSTABLE TABLES MARKET, BY APPLICATION, 2020-2029 (USD MILLION)
TABLE 327 TURKEY FREE STANDING ELECTRICAL HEIGHT-ADJUSTABLE TABLES MARKET, BY APPLICATION, 2020-2029 (THOUSAND UNITS)
TABLE 328 TURKEY OFFICES IN FREE STANDING ELECTRICAL HEIGHT-ADJUSTABLE TABLES MARKET, BY SEGMENT, 2020-2029 (USD MILLION)
TABLE 329 TURKEY OFFICES IN FREE STANDING ELECTRICAL HEIGHT-ADJUSTABLE TABLES MARKET, BY SEGMENT, 2020-2029 (THOUSAND UNITS)
TABLE 330 TURKEY COMMERCIAL IN FREE STANDING ELECTRICAL HEIGHT-ADJUSTABLE TABLES MARKET, BY SEGMENT, 2020-2029 (USD MILLION)
TABLE 331 TURKEY COMMERCIAL IN FREE STANDING ELECTRICAL HEIGHT-ADJUSTABLE TABLES MARKET, BY SEGMENT, 2020-2029 (THOUSAND UNITS)
TABLE 332 TURKEY INDUSTRIAL IN FREE STANDING ELECTRICAL HEIGHT-ADJUSTABLE TABLES MARKET, BY SEGMENT, 2020-2029 (USD MILLION)
TABLE 333 TURKEY INDUSTRIAL IN FREE STANDING ELECTRICAL HEIGHT-ADJUSTABLE TABLES MARKET, BY SEGMENT, 2020-2029 (THOUSAND UNITS)
TABLE 334 TURKEY HOME IN FREE STANDING ELECTRICAL HEIGHT-ADJUSTABLE TABLES MARKET, BY SEGMENT, 2020-2029 (USD MILLION)
TABLE 335 TURKEY HOME IN FREE STANDING ELECTRICAL HEIGHT-ADJUSTABLE TABLES MARKET, BY SEGMENT, 2020-2029 (THOUSAND UNITS)
TABLE 336 TURKEY FREE STANDING ELECTRICAL HEIGHT-ADJUSTABLE TABLES MARKET, BY SALES CHANNEL, 2020-2029 (USD MILLION)
TABLE 337 TURKEY FREE STANDING ELECTRICAL HEIGHT-ADJUSTABLE TABLES MARKET, BY SALES CHANNEL, 2020-2029 (THOUSAND UNITS)
TABLE 338 NORWAY FREE STANDING ELECTRICAL HEIGHT-ADJUSTABLE TABLES MARKET, BY TYPE, 2020-2029 (USD MILLION)
TABLE 339 NORWAY FREE STANDING ELECTRICAL HEIGHT-ADJUSTABLE TABLES MARKET, BY TYPE, 2020-2029 (THOUSAND UNITS)
TABLE 340 NORWAY FREE STANDING ELECTRICAL HEIGHT-ADJUSTABLE TABLES MARKET, BY APPLICATION, 2020-2029 (USD MILLION)
TABLE 341 NORWAY FREE STANDING ELECTRICAL HEIGHT-ADJUSTABLE TABLES MARKET, BY APPLICATION, 2020-2029 (THOUSAND UNITS)
TABLE 342 NORWAY OFFICES IN FREE STANDING ELECTRICAL HEIGHT-ADJUSTABLE TABLES MARKET, BY SEGMENT, 2020-2029 (USD MILLION)
TABLE 343 NORWAY OFFICES IN FREE STANDING ELECTRICAL HEIGHT-ADJUSTABLE TABLES MARKET, BY SEGMENT, 2020-2029 (THOUSAND UNITS)
TABLE 344 NORWAY COMMERCIAL IN FREE STANDING ELECTRICAL HEIGHT-ADJUSTABLE TABLES MARKET, BY SEGMENT, 2020-2029 (USD MILLION)
TABLE 345 NORWAY COMMERCIAL IN FREE STANDING ELECTRICAL HEIGHT-ADJUSTABLE TABLES MARKET, BY SEGMENT, 2020-2029 (THOUSAND UNITS)
TABLE 346 NORWAY INDUSTRIAL IN FREE STANDING ELECTRICAL HEIGHT-ADJUSTABLE TABLES MARKET, BY SEGMENT, 2020-2029 (USD MILLION)
TABLE 347 NORWAY INDUSTRIAL IN FREE STANDING ELECTRICAL HEIGHT-ADJUSTABLE TABLES MARKET, BY SEGMENT, 2020-2029 (THOUSAND UNITS)
TABLE 348 NORWAY HOME IN FREE STANDING ELECTRICAL HEIGHT-ADJUSTABLE TABLES MARKET, BY SEGMENT, 2020-2029 (USD MILLION)
TABLE 349 NORWAY HOME IN FREE STANDING ELECTRICAL HEIGHT-ADJUSTABLE TABLES MARKET, BY SEGMENT, 2020-2029 (THOUSAND UNITS)
TABLE 350 NORWAY FREE STANDING ELECTRICAL HEIGHT-ADJUSTABLE TABLES MARKET, BY SALES CHANNEL, 2020-2029 (USD MILLION)
TABLE 351 NORWAY FREE STANDING ELECTRICAL HEIGHT-ADJUSTABLE TABLES MARKET, BY SALES CHANNEL, 2020-2029 (THOUSAND UNITS)
TABLE 352 REST OF EUROPE FREE STANDING ELECTRICAL HEIGHT-ADJUSTABLE TABLES MARKET, BY TYPE, 2020-2029 (USD MILLION)
TABLE 353 REST OF EUROPE FREE STANDING ELECTRICAL HEIGHT-ADJUSTABLE TABLES MARKET, BY TYPE, 2020-2029 (THOUSAND UNITS)
TABLE 354 ASIA-PACIFIC FREE STANDING ELECTRICAL HEIGHT-ADJUSTABLE TABLES MARKET, BY COUNTRY, 2020-2029 (USD MILLION)
TABLE 355 ASIA-PACIFIC FREE STANDING ELECTRICAL HEIGHT-ADJUSTABLE TABLES MARKET, BY COUNTRY, 2020-2029 (THOUSAND UNITS)
TABLE 356 ASIA-PACIFIC FREE STANDING ELECTRICAL HEIGHT-ADJUSTABLE TABLES MARKET, BY TYPE, 2020-2029 (USD MILLION)
TABLE 357 ASIA-PACIFIC FREE STANDING ELECTRICAL HEIGHT-ADJUSTABLE TABLES MARKET, BY TYPE, 2020-2029 (THOUSAND UNITS)
TABLE 358 ASIA-PACIFIC FREE STANDING ELECTRICAL HEIGHT-ADJUSTABLE TABLES MARKET, BY APPLICATION, 2020-2029 (USD MILLION)
TABLE 359 ASIA-PACIFIC FREE STANDING ELECTRICAL HEIGHT-ADJUSTABLE TABLES MARKET, BY APPLICATION, 2020-2029 (THOUSAND UNITS)
TABLE 360 ASIA-PACIFIC OFFICES IN FREE STANDING ELECTRICAL HEIGHT-ADJUSTABLE TABLES MARKET, BY SEGMENT, 2020-2029 (USD MILLION)
TABLE 361 ASIA-PACIFIC OFFICES IN FREE STANDING ELECTRICAL HEIGHT-ADJUSTABLE TABLES MARKET, BY SEGMENT, 2020-2029 (THOUSAND UNITS)
TABLE 362 ASIA-PACIFIC COMMERCIAL IN FREE STANDING ELECTRICAL HEIGHT-ADJUSTABLE TABLES MARKET, BY SEGMENT, 2020-2029 (USD MILLION)
TABLE 363 ASIA-PACIFIC COMMERCIAL IN FREE STANDING ELECTRICAL HEIGHT-ADJUSTABLE TABLES MARKET, BY SEGMENT, 2020-2029 (THOUSAND UNITS)
TABLE 364 ASIA-PACIFIC INDUSTRIAL IN FREE STANDING ELECTRICAL HEIGHT-ADJUSTABLE TABLES MARKET, BY SEGMENT, 2020-2029 (USD MILLION)
TABLE 365 ASIA-PACIFIC INDUSTRIAL IN FREE STANDING ELECTRICAL HEIGHT-ADJUSTABLE TABLES MARKET, BY SEGMENT, 2020-2029 (THOUSAND UNITS)
TABLE 366 ASIA-PACIFIC HOME IN FREE STANDING ELECTRICAL HEIGHT-ADJUSTABLE TABLES MARKET, BY SEGMENT, 2020-2029 (USD MILLION)
TABLE 367 ASIA-PACIFIC HOME IN FREE STANDING ELECTRICAL HEIGHT-ADJUSTABLE TABLES MARKET, BY SEGMENT, 2020-2029 (THOUSAND UNITS)
TABLE 368 ASIA-PACIFIC FREE STANDING ELECTRICAL HEIGHT-ADJUSTABLE TABLES MARKET, BY SALES CHANNEL, 2020-2029 (USD MILLION)
TABLE 369 ASIA-PACIFIC FREE STANDING ELECTRICAL HEIGHT-ADJUSTABLE TABLES MARKET, BY SALES CHANNEL, 2020-2029 (THOUSAND UNITS)
TABLE 370 CHINA FREE STANDING ELECTRICAL HEIGHT-ADJUSTABLE TABLES MARKET, BY TYPE, 2020-2029 (USD MILLION)
TABLE 371 CHINA FREE STANDING ELECTRICAL HEIGHT-ADJUSTABLE TABLES MARKET, BY TYPE, 2020-2029 (THOUSAND UNITS)
TABLE 372 CHINA FREE STANDING ELECTRICAL HEIGHT-ADJUSTABLE TABLES MARKET, BY APPLICATION, 2020-2029 (USD MILLION)
TABLE 373 CHINA FREE STANDING ELECTRICAL HEIGHT-ADJUSTABLE TABLES MARKET, BY APPLICATION, 2020-2029 (THOUSAND UNITS)
TABLE 374 CHINA OFFICES IN FREE STANDING ELECTRICAL HEIGHT-ADJUSTABLE TABLES MARKET, BY SEGMENT, 2020-2029 (USD MILLION)
TABLE 375 CHINA OFFICES IN FREE STANDING ELECTRICAL HEIGHT-ADJUSTABLE TABLES MARKET, BY SEGMENT, 2020-2029 (THOUSAND UNITS)
TABLE 376 CHINA COMMERCIAL IN FREE STANDING ELECTRICAL HEIGHT-ADJUSTABLE TABLES MARKET, BY SEGMENT, 2020-2029 (USD MILLION)
TABLE 377 CHINA COMMERCIAL IN FREE STANDING ELECTRICAL HEIGHT-ADJUSTABLE TABLES MARKET, BY SEGMENT, 2020-2029 (THOUSAND UNITS)
TABLE 378 CHINA INDUSTRIAL IN FREE STANDING ELECTRICAL HEIGHT-ADJUSTABLE TABLES MARKET, BY SEGMENT, 2020-2029 (USD MILLION)
TABLE 379 CHINA INDUSTRIAL IN FREE STANDING ELECTRICAL HEIGHT-ADJUSTABLE TABLES MARKET, BY SEGMENT, 2020-2029 (THOUSAND UNITS)
TABLE 380 CHINA HOME IN FREE STANDING ELECTRICAL HEIGHT-ADJUSTABLE TABLES MARKET, BY SEGMENT, 2020-2029 (USD MILLION)
TABLE 381 CHINA HOME IN FREE STANDING ELECTRICAL HEIGHT-ADJUSTABLE TABLES MARKET, BY SEGMENT, 2020-2029 (THOUSAND UNITS)
TABLE 382 CHINA FREE STANDING ELECTRICAL HEIGHT-ADJUSTABLE TABLES MARKET, BY SALES CHANNEL, 2020-2029 (USD MILLION)
TABLE 383 CHINA FREE STANDING ELECTRICAL HEIGHT-ADJUSTABLE TABLES MARKET, BY SALES CHANNEL, 2020-2029 (THOUSAND UNITS)
TABLE 384 INDIA FREE STANDING ELECTRICAL HEIGHT-ADJUSTABLE TABLES MARKET, BY TYPE, 2020-2029 (USD MILLION)
TABLE 385 INDIA FREE STANDING ELECTRICAL HEIGHT-ADJUSTABLE TABLES MARKET, BY TYPE, 2020-2029 (THOUSAND UNITS)
TABLE 386 INDIA FREE STANDING ELECTRICAL HEIGHT-ADJUSTABLE TABLES MARKET, BY APPLICATION, 2020-2029 (USD MILLION)
TABLE 387 INDIA FREE STANDING ELECTRICAL HEIGHT-ADJUSTABLE TABLES MARKET, BY APPLICATION, 2020-2029 (THOUSAND UNITS)
TABLE 388 INDIA OFFICES IN FREE STANDING ELECTRICAL HEIGHT-ADJUSTABLE TABLES MARKET, BY SEGMENT, 2020-2029 (USD MILLION)
TABLE 389 INDIA OFFICES IN FREE STANDING ELECTRICAL HEIGHT-ADJUSTABLE TABLES MARKET, BY SEGMENT, 2020-2029 (THOUSAND UNITS)
TABLE 390 INDIA COMMERCIAL IN FREE STANDING ELECTRICAL HEIGHT-ADJUSTABLE TABLES MARKET, BY SEGMENT, 2020-2029 (USD MILLION)
TABLE 391 INDIA COMMERCIAL IN FREE STANDING ELECTRICAL HEIGHT-ADJUSTABLE TABLES MARKET, BY SEGMENT, 2020-2029 (THOUSAND UNITS)
TABLE 392 INDIA INDUSTRIAL IN FREE STANDING ELECTRICAL HEIGHT-ADJUSTABLE TABLES MARKET, BY SEGMENT, 2020-2029 (USD MILLION)
TABLE 393 INDIA INDUSTRIAL IN FREE STANDING ELECTRICAL HEIGHT-ADJUSTABLE TABLES MARKET, BY SEGMENT, 2020-2029 (THOUSAND UNITS)
TABLE 394 INDIA HOME IN FREE STANDING ELECTRICAL HEIGHT-ADJUSTABLE TABLES MARKET, BY SEGMENT, 2020-2029 (USD MILLION)
TABLE 395 INDIA HOME IN FREE STANDING ELECTRICAL HEIGHT-ADJUSTABLE TABLES MARKET, BY SEGMENT, 2020-2029 (THOUSAND UNITS)
TABLE 396 INDIA FREE STANDING ELECTRICAL HEIGHT-ADJUSTABLE TABLES MARKET, BY SALES CHANNEL, 2020-2029 (USD MILLION)
TABLE 397 INDIA FREE STANDING ELECTRICAL HEIGHT-ADJUSTABLE TABLES MARKET, BY SALES CHANNEL, 2020-2029 (THOUSAND UNITS)
TABLE 398 JAPAN FREE STANDING ELECTRICAL HEIGHT-ADJUSTABLE TABLES MARKET, BY TYPE, 2020-2029 (USD MILLION)
TABLE 399 JAPAN FREE STANDING ELECTRICAL HEIGHT-ADJUSTABLE TABLES MARKET, BY TYPE, 2020-2029 (THOUSAND UNITS)
TABLE 400 JAPAN FREE STANDING ELECTRICAL HEIGHT-ADJUSTABLE TABLES MARKET, BY APPLICATION, 2020-2029 (USD MILLION)
TABLE 401 JAPAN FREE STANDING ELECTRICAL HEIGHT-ADJUSTABLE TABLES MARKET, BY APPLICATION, 2020-2029 (THOUSAND UNITS)
TABLE 402 JAPAN OFFICES IN FREE STANDING ELECTRICAL HEIGHT-ADJUSTABLE TABLES MARKET, BY SEGMENT, 2020-2029 (USD MILLION)
TABLE 403 JAPAN OFFICES IN FREE STANDING ELECTRICAL HEIGHT-ADJUSTABLE TABLES MARKET, BY SEGMENT, 2020-2029 (THOUSAND UNITS)
TABLE 404 JAPAN COMMERCIAL IN FREE STANDING ELECTRICAL HEIGHT-ADJUSTABLE TABLES MARKET, BY SEGMENT, 2020-2029 (USD MILLION)
TABLE 405 JAPAN COMMERCIAL IN FREE STANDING ELECTRICAL HEIGHT-ADJUSTABLE TABLES MARKET, BY SEGMENT, 2020-2029 (THOUSAND UNITS)
TABLE 406 JAPAN INDUSTRIAL IN FREE STANDING ELECTRICAL HEIGHT-ADJUSTABLE TABLES MARKET, BY SEGMENT, 2020-2029 (USD MILLION)
TABLE 407 JAPAN INDUSTRIAL IN FREE STANDING ELECTRICAL HEIGHT-ADJUSTABLE TABLES MARKET, BY SEGMENT, 2020-2029 (THOUSAND UNITS)
TABLE 408 JAPAN HOME IN FREE STANDING ELECTRICAL HEIGHT-ADJUSTABLE TABLES MARKET, BY SEGMENT, 2020-2029 (USD MILLION)
TABLE 409 JAPAN HOME IN FREE STANDING ELECTRICAL HEIGHT-ADJUSTABLE TABLES MARKET, BY SEGMENT, 2020-2029 (THOUSAND UNITS)
TABLE 410 JAPAN FREE STANDING ELECTRICAL HEIGHT-ADJUSTABLE TABLES MARKET, BY SALES CHANNEL, 2020-2029 (USD MILLION)
TABLE 411 JAPAN FREE STANDING ELECTRICAL HEIGHT-ADJUSTABLE TABLES MARKET, BY SALES CHANNEL, 2020-2029 (THOUSAND UNITS)
TABLE 412 SOUTH KOREA FREE STANDING ELECTRICAL HEIGHT-ADJUSTABLE TABLES MARKET, BY TYPE, 2020-2029 (USD MILLION)
TABLE 413 SOUTH KOREA FREE STANDING ELECTRICAL HEIGHT-ADJUSTABLE TABLES MARKET, BY TYPE, 2020-2029 (THOUSAND UNITS)
TABLE 414 SOUTH KOREA FREE STANDING ELECTRICAL HEIGHT-ADJUSTABLE TABLES MARKET, BY APPLICATION, 2020-2029 (USD MILLION)
TABLE 415 SOUTH KOREA FREE STANDING ELECTRICAL HEIGHT-ADJUSTABLE TABLES MARKET, BY APPLICATION, 2020-2029 (THOUSAND UNITS)
TABLE 416 SOUTH KOREA OFFICES IN FREE STANDING ELECTRICAL HEIGHT-ADJUSTABLE TABLES MARKET, BY SEGMENT, 2020-2029 (USD MILLION)
TABLE 417 SOUTH KOREA OFFICES IN FREE STANDING ELECTRICAL HEIGHT-ADJUSTABLE TABLES MARKET, BY SEGMENT, 2020-2029 (THOUSAND UNITS)
TABLE 418 SOUTH KOREA COMMERCIAL IN FREE STANDING ELECTRICAL HEIGHT-ADJUSTABLE TABLES MARKET, BY SEGMENT, 2020-2029 (USD MILLION)
TABLE 419 SOUTH KOREA COMMERCIAL IN FREE STANDING ELECTRICAL HEIGHT-ADJUSTABLE TABLES MARKET, BY SEGMENT, 2020-2029 (THOUSAND UNITS)
TABLE 420 SOUTH KOREA INDUSTRIAL IN FREE STANDING ELECTRICAL HEIGHT-ADJUSTABLE TABLES MARKET, BY SEGMENT, 2020-2029 (USD MILLION)
TABLE 421 SOUTH KOREA INDUSTRIAL IN FREE STANDING ELECTRICAL HEIGHT-ADJUSTABLE TABLES MARKET, BY SEGMENT, 2020-2029 (THOUSAND UNITS)
TABLE 422 SOUTH KOREA HOME IN FREE STANDING ELECTRICAL HEIGHT-ADJUSTABLE TABLES MARKET, BY SEGMENT, 2020-2029 (USD MILLION)
TABLE 423 SOUTH KOREA HOME IN FREE STANDING ELECTRICAL HEIGHT-ADJUSTABLE TABLES MARKET, BY SEGMENT, 2020-2029 (THOUSAND UNITS)
TABLE 424 SOUTH KOREA FREE STANDING ELECTRICAL HEIGHT-ADJUSTABLE TABLES MARKET, BY SALES CHANNEL, 2020-2029 (USD MILLION)
TABLE 425 SOUTH KOREA FREE STANDING ELECTRICAL HEIGHT-ADJUSTABLE TABLES MARKET, BY SALES CHANNEL, 2020-2029 (THOUSAND UNITS)
TABLE 426 AUSTRALIA & NEW ZEALAND FREE STANDING ELECTRICAL HEIGHT-ADJUSTABLE TABLES MARKET, BY TYPE, 2020-2029 (USD MILLION)
TABLE 427 AUSTRALIA & NEW ZEALAND FREE STANDING ELECTRICAL HEIGHT-ADJUSTABLE TABLES MARKET, BY TYPE, 2020-2029 (THOUSAND UNITS)
TABLE 428 AUSTRALIA & NEW ZEALAND FREE STANDING ELECTRICAL HEIGHT-ADJUSTABLE TABLES MARKET, BY APPLICATION, 2020-2029 (USD MILLION)
TABLE 429 AUSTRALIA & NEW ZEALAND FREE STANDING ELECTRICAL HEIGHT-ADJUSTABLE TABLES MARKET, BY APPLICATION, 2020-2029 (THOUSAND UNITS)
TABLE 430 AUSTRALIA & NEW ZEALAND OFFICES IN FREE STANDING ELECTRICAL HEIGHT-ADJUSTABLE TABLES MARKET, BY SEGMENT, 2020-2029 (USD MILLION)
TABLE 431 AUSTRALIA & NEW ZEALAND OFFICES IN FREE STANDING ELECTRICAL HEIGHT-ADJUSTABLE TABLES MARKET, BY SEGMENT, 2020-2029 (THOUSAND UNITS)
TABLE 432 AUSTRALIA & NEW ZEALAND COMMERCIAL IN FREE STANDING ELECTRICAL HEIGHT-ADJUSTABLE TABLES MARKET, BY SEGMENT, 2020-2029 (USD MILLION)
TABLE 433 AUSTRALIA & NEW ZEALAND COMMERCIAL IN FREE STANDING ELECTRICAL HEIGHT-ADJUSTABLE TABLES MARKET, BY SEGMENT, 2020-2029 (THOUSAND UNITS)
TABLE 434 AUSTRALIA & NEW ZEALAND INDUSTRIAL IN FREE STANDING ELECTRICAL HEIGHT-ADJUSTABLE TABLES MARKET, BY SEGMENT, 2020-2029 (USD MILLION)
TABLE 435 AUSTRALIA & NEW ZEALAND INDUSTRIAL IN FREE STANDING ELECTRICAL HEIGHT-ADJUSTABLE TABLES MARKET, BY SEGMENT, 2020-2029 (THOUSAND UNITS)
TABLE 436 AUSTRALIA & NEW ZEALAND HOME IN FREE STANDING ELECTRICAL HEIGHT-ADJUSTABLE TABLES MARKET, BY SEGMENT, 2020-2029 (USD MILLION)
TABLE 437 AUSTRALIA & NEW ZEALAND HOME IN FREE STANDING ELECTRICAL HEIGHT-ADJUSTABLE TABLES MARKET, BY SEGMENT, 2020-2029 (THOUSAND UNITS)
TABLE 438 AUSTRALIA & NEW ZEALAND FREE STANDING ELECTRICAL HEIGHT-ADJUSTABLE TABLES MARKET, BY SALES CHANNEL, 2020-2029 (USD MILLION)
TABLE 439 AUSTRALIA & NEW ZEALAND FREE STANDING ELECTRICAL HEIGHT-ADJUSTABLE TABLES MARKET, BY SALES CHANNEL, 2020-2029 (THOUSAND UNITS)
TABLE 440 THAILAND FREE STANDING ELECTRICAL HEIGHT-ADJUSTABLE TABLES MARKET, BY TYPE, 2020-2029 (USD MILLION)
TABLE 441 THAILAND FREE STANDING ELECTRICAL HEIGHT-ADJUSTABLE TABLES MARKET, BY TYPE, 2020-2029 (THOUSAND UNITS)
TABLE 442 THAILAND FREE STANDING ELECTRICAL HEIGHT-ADJUSTABLE TABLES MARKET, BY APPLICATION, 2020-2029 (USD MILLION)
TABLE 443 THAILAND FREE STANDING ELECTRICAL HEIGHT-ADJUSTABLE TABLES MARKET, BY APPLICATION, 2020-2029 (THOUSAND UNITS)
TABLE 444 THAILAND OFFICES IN FREE STANDING ELECTRICAL HEIGHT-ADJUSTABLE TABLES MARKET, BY SEGMENT, 2020-2029 (USD MILLION)
TABLE 445 THAILAND OFFICES IN FREE STANDING ELECTRICAL HEIGHT-ADJUSTABLE TABLES MARKET, BY SEGMENT, 2020-2029 (THOUSAND UNITS)
TABLE 446 THAILAND COMMERCIAL IN FREE STANDING ELECTRICAL HEIGHT-ADJUSTABLE TABLES MARKET, BY SEGMENT, 2020-2029 (USD MILLION)
TABLE 447 THAILAND COMMERCIAL IN FREE STANDING ELECTRICAL HEIGHT-ADJUSTABLE TABLES MARKET, BY SEGMENT, 2020-2029 (THOUSAND UNITS)
TABLE 448 THAILAND INDUSTRIAL IN FREE STANDING ELECTRICAL HEIGHT-ADJUSTABLE TABLES MARKET, BY SEGMENT, 2020-2029 (USD MILLION)
TABLE 449 THAILAND INDUSTRIAL IN FREE STANDING ELECTRICAL HEIGHT-ADJUSTABLE TABLES MARKET, BY SEGMENT, 2020-2029 (THOUSAND UNITS)
TABLE 450 THAILAND HOME IN FREE STANDING ELECTRICAL HEIGHT-ADJUSTABLE TABLES MARKET, BY SEGMENT, 2020-2029 (USD MILLION)
TABLE 451 THAILAND HOME IN FREE STANDING ELECTRICAL HEIGHT-ADJUSTABLE TABLES MARKET, BY SEGMENT, 2020-2029 (THOUSAND UNITS)
TABLE 452 THAILAND FREE STANDING ELECTRICAL HEIGHT-ADJUSTABLE TABLES MARKET, BY SALES CHANNEL, 2020-2029 (USD MILLION)
TABLE 453 THAILAND FREE STANDING ELECTRICAL HEIGHT-ADJUSTABLE TABLES MARKET, BY SALES CHANNEL, 2020-2029 (THOUSAND UNITS)
TABLE 454 MALAYSIA FREE STANDING ELECTRICAL HEIGHT-ADJUSTABLE TABLES MARKET, BY TYPE, 2020-2029 (USD MILLION)
TABLE 455 MALAYSIA FREE STANDING ELECTRICAL HEIGHT-ADJUSTABLE TABLES MARKET, BY TYPE, 2020-2029 (THOUSAND UNITS)
TABLE 456 MALAYSIA FREE STANDING ELECTRICAL HEIGHT-ADJUSTABLE TABLES MARKET, BY APPLICATION, 2020-2029 (USD MILLION)
TABLE 457 MALAYSIA FREE STANDING ELECTRICAL HEIGHT-ADJUSTABLE TABLES MARKET, BY APPLICATION, 2020-2029 (THOUSAND UNITS)
TABLE 458 MALAYSIA OFFICES IN FREE STANDING ELECTRICAL HEIGHT-ADJUSTABLE TABLES MARKET, BY SEGMENT, 2020-2029 (USD MILLION)
TABLE 459 MALAYSIA OFFICES IN FREE STANDING ELECTRICAL HEIGHT-ADJUSTABLE TABLES MARKET, BY SEGMENT, 2020-2029 (THOUSAND UNITS)
TABLE 460 MALAYSIA COMMERCIAL IN FREE STANDING ELECTRICAL HEIGHT-ADJUSTABLE TABLES MARKET, BY SEGMENT, 2020-2029 (USD MILLION)
TABLE 461 MALAYSIA COMMERCIAL IN FREE STANDING ELECTRICAL HEIGHT-ADJUSTABLE TABLES MARKET, BY SEGMENT, 2020-2029 (THOUSAND UNITS)
TABLE 462 MALAYSIA INDUSTRIAL IN FREE STANDING ELECTRICAL HEIGHT-ADJUSTABLE TABLES MARKET, BY SEGMENT, 2020-2029 (USD MILLION)
TABLE 463 MALAYSIA INDUSTRIAL IN FREE STANDING ELECTRICAL HEIGHT-ADJUSTABLE TABLES MARKET, BY SEGMENT, 2020-2029 (THOUSAND UNITS)
TABLE 464 MALAYSIA HOME IN FREE STANDING ELECTRICAL HEIGHT-ADJUSTABLE TABLES MARKET, BY SEGMENT, 2020-2029 (USD MILLION)
TABLE 465 MALAYSIA HOME IN FREE STANDING ELECTRICAL HEIGHT-ADJUSTABLE TABLES MARKET, BY SEGMENT, 2020-2029 (THOUSAND UNITS)
TABLE 466 MALAYSIA FREE STANDING ELECTRICAL HEIGHT-ADJUSTABLE TABLES MARKET, BY SALES CHANNEL, 2020-2029 (USD MILLION)
TABLE 467 MALAYSIA FREE STANDING ELECTRICAL HEIGHT-ADJUSTABLE TABLES MARKET, BY SALES CHANNEL, 2020-2029 (THOUSAND UNITS)
TABLE 468 INDONESIA FREE STANDING ELECTRICAL HEIGHT-ADJUSTABLE TABLES MARKET, BY TYPE, 2020-2029 (USD MILLION)
TABLE 469 INDONESIA FREE STANDING ELECTRICAL HEIGHT-ADJUSTABLE TABLES MARKET, BY TYPE, 2020-2029 (THOUSAND UNITS)
TABLE 470 INDONESIA FREE STANDING ELECTRICAL HEIGHT-ADJUSTABLE TABLES MARKET, BY APPLICATION, 2020-2029 (USD MILLION)
TABLE 471 INDONESIA FREE STANDING ELECTRICAL HEIGHT-ADJUSTABLE TABLES MARKET, BY APPLICATION, 2020-2029 (THOUSAND UNITS)
TABLE 472 INDONESIA OFFICES IN FREE STANDING ELECTRICAL HEIGHT-ADJUSTABLE TABLES MARKET, BY SEGMENT, 2020-2029 (USD MILLION)
TABLE 473 INDONESIA OFFICES IN FREE STANDING ELECTRICAL HEIGHT-ADJUSTABLE TABLES MARKET, BY SEGMENT, 2020-2029 (THOUSAND UNITS)
TABLE 474 INDONESIA COMMERCIAL IN FREE STANDING ELECTRICAL HEIGHT-ADJUSTABLE TABLES MARKET, BY SEGMENT, 2020-2029 (USD MILLION)
TABLE 475 INDONESIA COMMERCIAL IN FREE STANDING ELECTRICAL HEIGHT-ADJUSTABLE TABLES MARKET, BY SEGMENT, 2020-2029 (THOUSAND UNITS)
TABLE 476 INDONESIA INDUSTRIAL IN FREE STANDING ELECTRICAL HEIGHT-ADJUSTABLE TABLES MARKET, BY SEGMENT, 2020-2029 (USD MILLION)
TABLE 477 INDONESIA INDUSTRIAL IN FREE STANDING ELECTRICAL HEIGHT-ADJUSTABLE TABLES MARKET, BY SEGMENT, 2020-2029 (THOUSAND UNITS)
TABLE 478 INDONESIA HOME IN FREE STANDING ELECTRICAL HEIGHT-ADJUSTABLE TABLES MARKET, BY SEGMENT, 2020-2029 (USD MILLION)
TABLE 479 INDONESIA HOME IN FREE STANDING ELECTRICAL HEIGHT-ADJUSTABLE TABLES MARKET, BY SEGMENT, 2020-2029 (THOUSAND UNITS)
TABLE 480 INDONESIA FREE STANDING ELECTRICAL HEIGHT-ADJUSTABLE TABLES MARKET, BY SALES CHANNEL, 2020-2029 (USD MILLION)
TABLE 481 INDONESIA FREE STANDING ELECTRICAL HEIGHT-ADJUSTABLE TABLES MARKET, BY SALES CHANNEL, 2020-2029 (THOUSAND UNITS)
TABLE 482 SINGAPORE FREE STANDING ELECTRICAL HEIGHT-ADJUSTABLE TABLES MARKET, BY TYPE, 2020-2029 (USD MILLION)
TABLE 483 SINGAPORE FREE STANDING ELECTRICAL HEIGHT-ADJUSTABLE TABLES MARKET, BY TYPE, 2020-2029 (THOUSAND UNITS)
TABLE 484 SINGAPORE FREE STANDING ELECTRICAL HEIGHT-ADJUSTABLE TABLES MARKET, BY APPLICATION, 2020-2029 (USD MILLION)
TABLE 485 SINGAPORE FREE STANDING ELECTRICAL HEIGHT-ADJUSTABLE TABLES MARKET, BY APPLICATION, 2020-2029 (THOUSAND UNITS)
TABLE 486 SINGAPORE OFFICES IN FREE STANDING ELECTRICAL HEIGHT-ADJUSTABLE TABLES MARKET, BY SEGMENT, 2020-2029 (USD MILLION)
TABLE 487 SINGAPORE OFFICES IN FREE STANDING ELECTRICAL HEIGHT-ADJUSTABLE TABLES MARKET, BY SEGMENT, 2020-2029 (THOUSAND UNITS)
TABLE 488 SINGAPORE COMMERCIAL IN FREE STANDING ELECTRICAL HEIGHT-ADJUSTABLE TABLES MARKET, BY SEGMENT, 2020-2029 (USD MILLION)
TABLE 489 SINGAPORE COMMERCIAL IN FREE STANDING ELECTRICAL HEIGHT-ADJUSTABLE TABLES MARKET, BY SEGMENT, 2020-2029 (THOUSAND UNITS)
TABLE 490 SINGAPORE INDUSTRIAL IN FREE STANDING ELECTRICAL HEIGHT-ADJUSTABLE TABLES MARKET, BY SEGMENT, 2020-2029 (USD MILLION)
TABLE 491 SINGAPORE INDUSTRIAL IN FREE STANDING ELECTRICAL HEIGHT-ADJUSTABLE TABLES MARKET, BY SEGMENT, 2020-2029 (THOUSAND UNITS)
TABLE 492 SINGAPORE HOME IN FREE STANDING ELECTRICAL HEIGHT-ADJUSTABLE TABLES MARKET, BY SEGMENT, 2020-2029 (USD MILLION)
TABLE 493 SINGAPORE HOME IN FREE STANDING ELECTRICAL HEIGHT-ADJUSTABLE TABLES MARKET, BY SEGMENT, 2020-2029 (THOUSAND UNITS)
TABLE 494 SINGAPORE FREE STANDING ELECTRICAL HEIGHT-ADJUSTABLE TABLES MARKET, BY SALES CHANNEL, 2020-2029 (USD MILLION)
TABLE 495 SINGAPORE FREE STANDING ELECTRICAL HEIGHT-ADJUSTABLE TABLES MARKET, BY SALES CHANNEL, 2020-2029 (THOUSAND UNITS)
TABLE 496 TAIWAN FREE STANDING ELECTRICAL HEIGHT-ADJUSTABLE TABLES MARKET, BY TYPE, 2020-2029 (USD MILLION)
TABLE 497 TAIWAN FREE STANDING ELECTRICAL HEIGHT-ADJUSTABLE TABLES MARKET, BY TYPE, 2020-2029 (THOUSAND UNITS)
TABLE 498 TAIWAN FREE STANDING ELECTRICAL HEIGHT-ADJUSTABLE TABLES MARKET, BY APPLICATION, 2020-2029 (USD MILLION)
TABLE 499 TAIWAN FREE STANDING ELECTRICAL HEIGHT-ADJUSTABLE TABLES MARKET, BY APPLICATION, 2020-2029 (THOUSAND UNITS)
TABLE 500 TAIWAN OFFICES IN FREE STANDING ELECTRICAL HEIGHT-ADJUSTABLE TABLES MARKET, BY SEGMENT, 2020-2029 (USD MILLION)
TABLE 501 TAIWAN OFFICES IN FREE STANDING ELECTRICAL HEIGHT-ADJUSTABLE TABLES MARKET, BY SEGMENT, 2020-2029 (THOUSAND UNITS)
TABLE 502 TAIWAN COMMERCIAL IN FREE STANDING ELECTRICAL HEIGHT-ADJUSTABLE TABLES MARKET, BY SEGMENT, 2020-2029 (USD MILLION)
TABLE 503 TAIWAN COMMERCIAL IN FREE STANDING ELECTRICAL HEIGHT-ADJUSTABLE TABLES MARKET, BY SEGMENT, 2020-2029 (THOUSAND UNITS)
TABLE 504 TAIWAN INDUSTRIAL IN FREE STANDING ELECTRICAL HEIGHT-ADJUSTABLE TABLES MARKET, BY SEGMENT, 2020-2029 (USD MILLION)
TABLE 505 TAIWAN INDUSTRIAL IN FREE STANDING ELECTRICAL HEIGHT-ADJUSTABLE TABLES MARKET, BY SEGMENT, 2020-2029 (THOUSAND UNITS)
TABLE 506 TAIWAN HOME IN FREE STANDING ELECTRICAL HEIGHT-ADJUSTABLE TABLES MARKET, BY SEGMENT, 2020-2029 (USD MILLION)
TABLE 507 TAIWAN HOME IN FREE STANDING ELECTRICAL HEIGHT-ADJUSTABLE TABLES MARKET, BY SEGMENT, 2020-2029 (THOUSAND UNITS)
TABLE 508 TAIWAN FREE STANDING ELECTRICAL HEIGHT-ADJUSTABLE TABLES MARKET, BY SALES CHANNEL, 2020-2029 (USD MILLION)
TABLE 509 TAIWAN FREE STANDING ELECTRICAL HEIGHT-ADJUSTABLE TABLES MARKET, BY SALES CHANNEL, 2020-2029 (THOUSAND UNITS)
TABLE 510 PHILIPPINES FREE STANDING ELECTRICAL HEIGHT-ADJUSTABLE TABLES MARKET, BY TYPE, 2020-2029 (USD MILLION)
TABLE 511 PHILIPPINES FREE STANDING ELECTRICAL HEIGHT-ADJUSTABLE TABLES MARKET, BY TYPE, 2020-2029 (THOUSAND UNITS)
TABLE 512 PHILIPPINES FREE STANDING ELECTRICAL HEIGHT-ADJUSTABLE TABLES MARKET, BY APPLICATION, 2020-2029 (USD MILLION)
TABLE 513 PHILIPPINES FREE STANDING ELECTRICAL HEIGHT-ADJUSTABLE TABLES MARKET, BY APPLICATION, 2020-2029 (THOUSAND UNITS)
TABLE 514 PHILIPPINES OFFICES IN FREE STANDING ELECTRICAL HEIGHT-ADJUSTABLE TABLES MARKET, BY SEGMENT, 2020-2029 (USD MILLION)
TABLE 515 PHILIPPINES OFFICES IN FREE STANDING ELECTRICAL HEIGHT-ADJUSTABLE TABLES MARKET, BY SEGMENT, 2020-2029 (THOUSAND UNITS)
TABLE 516 PHILIPPINES COMMERCIAL IN FREE STANDING ELECTRICAL HEIGHT-ADJUSTABLE TABLES MARKET, BY SEGMENT, 2020-2029 (USD MILLION)
TABLE 517 PHILIPPINES COMMERCIAL IN FREE STANDING ELECTRICAL HEIGHT-ADJUSTABLE TABLES MARKET, BY SEGMENT, 2020-2029 (THOUSAND UNITS)
TABLE 518 PHILIPPINES INDUSTRIAL IN FREE STANDING ELECTRICAL HEIGHT-ADJUSTABLE TABLES MARKET, BY SEGMENT, 2020-2029 (USD MILLION)
TABLE 519 PHILIPPINES INDUSTRIAL IN FREE STANDING ELECTRICAL HEIGHT-ADJUSTABLE TABLES MARKET, BY SEGMENT, 2020-2029 (THOUSAND UNITS)
TABLE 520 PHILIPPINES HOME IN FREE STANDING ELECTRICAL HEIGHT-ADJUSTABLE TABLES MARKET, BY SEGMENT, 2020-2029 (USD MILLION)
TABLE 521 PHILIPPINES HOME IN FREE STANDING ELECTRICAL HEIGHT-ADJUSTABLE TABLES MARKET, BY SEGMENT, 2020-2029 (THOUSAND UNITS)
TABLE 522 PHILIPPINES FREE STANDING ELECTRICAL HEIGHT-ADJUSTABLE TABLES MARKET, BY SALES CHANNEL, 2020-2029 (USD MILLION)
TABLE 523 PHILIPPINES FREE STANDING ELECTRICAL HEIGHT-ADJUSTABLE TABLES MARKET, BY SALES CHANNEL, 2020-2029 (THOUSAND UNITS)
TABLE 524 REST OF ASIA-PACIFIC FREE STANDING ELECTRICAL HEIGHT-ADJUSTABLE TABLES MARKET, BY TYPE, 2020-2029 (USD MILLION)
TABLE 525 REST OF ASIA-PACIFIC FREE STANDING ELECTRICAL HEIGHT-ADJUSTABLE TABLES MARKET, BY TYPE, 2020-2029 (THOUSAND UNITS)
TABLE 526 SOUTH AMERICA FREE STANDING ELECTRICAL HEIGHT-ADJUSTABLE TABLES MARKET, BY COUNTRY, 2020-2029 (USD MILLION)
TABLE 527 SOUTH AMERICA FREE STANDING ELECTRICAL HEIGHT-ADJUSTABLE TABLES MARKET, BY COUNTRY, 2020-2029 (THOUSAND UNITS)
TABLE 528 SOUTH AMERICA FREE STANDING ELECTRICAL HEIGHT-ADJUSTABLE TABLES MARKET, BY TYPE, 2020-2029 (USD MILLION)
TABLE 529 SOUTH AMERICA FREE STANDING ELECTRICAL HEIGHT-ADJUSTABLE TABLES MARKET, BY TYPE, 2020-2029 (THOUSAND UNITS)
TABLE 530 SOUTH AMERICA FREE STANDING ELECTRICAL HEIGHT-ADJUSTABLE TABLES MARKET, BY APPLICATION, 2020-2029 (USD MILLION)
TABLE 531 SOUTH AMERICA FREE STANDING ELECTRICAL HEIGHT-ADJUSTABLE TABLES MARKET, BY APPLICATION, 2020-2029 (THOUSAND UNITS)
TABLE 532 SOUTH AMERICA OFFICES IN FREE STANDING ELECTRICAL HEIGHT-ADJUSTABLE TABLES MARKET, BY SEGMENT, 2020-2029 (USD MILLION)
TABLE 533 SOUTH AMERICA OFFICES IN FREE STANDING ELECTRICAL HEIGHT-ADJUSTABLE TABLES MARKET, BY SEGMENT, 2020-2029 (THOUSAND UNITS)
TABLE 534 SOUTH AMERICA COMMERCIAL IN FREE STANDING ELECTRICAL HEIGHT-ADJUSTABLE TABLES MARKET, BY SEGMENT, 2020-2029 (USD MILLION)
TABLE 535 SOUTH AMERICA COMMERCIAL IN FREE STANDING ELECTRICAL HEIGHT-ADJUSTABLE TABLES MARKET, BY SEGMENT, 2020-2029 (THOUSAND UNITS)
TABLE 536 SOUTH AMERICA INDUSTRIAL IN FREE STANDING ELECTRICAL HEIGHT-ADJUSTABLE TABLES MARKET, BY SEGMENT, 2020-2029 (USD MILLION)
TABLE 537 SOUTH AMERICA INDUSTRIAL IN FREE STANDING ELECTRICAL HEIGHT-ADJUSTABLE TABLES MARKET, BY SEGMENT, 2020-2029 (THOUSAND UNITS)
TABLE 538 SOUTH AMERICA HOME IN FREE STANDING ELECTRICAL HEIGHT-ADJUSTABLE TABLES MARKET, BY SEGMENT, 2020-2029 (USD MILLION)
TABLE 539 SOUTH AMERICA HOME IN FREE STANDING ELECTRICAL HEIGHT-ADJUSTABLE TABLES MARKET, BY SEGMENT, 2020-2029 (THOUSAND UNITS)
TABLE 540 SOUTH AMERICA FREE STANDING ELECTRICAL HEIGHT-ADJUSTABLE TABLES MARKET, BY SALES CHANNEL, 2020-2029 (USD MILLION)
TABLE 541 SOUTH AMERICA FREE STANDING ELECTRICAL HEIGHT-ADJUSTABLE TABLES MARKET, BY SALES CHANNEL, 2020-2029 (THOUSAND UNITS)
TABLE 542 BRAZIL FREE STANDING ELECTRICAL HEIGHT-ADJUSTABLE TABLES MARKET, BY TYPE, 2020-2029 (USD MILLION)
TABLE 543 BRAZIL FREE STANDING ELECTRICAL HEIGHT-ADJUSTABLE TABLES MARKET, BY TYPE, 2020-2029 (THOUSAND UNITS)
TABLE 544 BRAZIL FREE STANDING ELECTRICAL HEIGHT-ADJUSTABLE TABLES MARKET, BY APPLICATION, 2020-2029 (USD MILLION)
TABLE 545 BRAZIL FREE STANDING ELECTRICAL HEIGHT-ADJUSTABLE TABLES MARKET, BY APPLICATION, 2020-2029 (THOUSAND UNITS)
TABLE 546 BRAZIL OFFICES IN FREE STANDING ELECTRICAL HEIGHT-ADJUSTABLE TABLES MARKET, BY SEGMENT, 2020-2029 (USD MILLION)
TABLE 547 BRAZIL OFFICES IN FREE STANDING ELECTRICAL HEIGHT-ADJUSTABLE TABLES MARKET, BY SEGMENT, 2020-2029 (THOUSAND UNITS)
TABLE 548 BRAZIL COMMERCIAL IN FREE STANDING ELECTRICAL HEIGHT-ADJUSTABLE TABLES MARKET, BY SEGMENT, 2020-2029 (USD MILLION)
TABLE 549 BRAZIL COMMERCIAL IN FREE STANDING ELECTRICAL HEIGHT-ADJUSTABLE TABLES MARKET, BY SEGMENT, 2020-2029 (THOUSAND UNITS)
TABLE 550 BRAZIL INDUSTRIAL IN FREE STANDING ELECTRICAL HEIGHT-ADJUSTABLE TABLES MARKET, BY SEGMENT, 2020-2029 (USD MILLION)
TABLE 551 BRAZIL INDUSTRIAL IN FREE STANDING ELECTRICAL HEIGHT-ADJUSTABLE TABLES MARKET, BY SEGMENT, 2020-2029 (THOUSAND UNITS)
TABLE 552 BRAZIL HOME IN FREE STANDING ELECTRICAL HEIGHT-ADJUSTABLE TABLES MARKET, BY SEGMENT, 2020-2029 (USD MILLION)
TABLE 553 BRAZIL HOME IN FREE STANDING ELECTRICAL HEIGHT-ADJUSTABLE TABLES MARKET, BY SEGMENT, 2020-2029 (THOUSAND UNITS)
TABLE 554 BRAZIL FREE STANDING ELECTRICAL HEIGHT-ADJUSTABLE TABLES MARKET, BY SALES CHANNEL, 2020-2029 (USD MILLION)
TABLE 555 BRAZIL FREE STANDING ELECTRICAL HEIGHT-ADJUSTABLE TABLES MARKET, BY SALES CHANNEL, 2020-2029 (THOUSAND UNITS)
TABLE 556 ARGENTINA FREE STANDING ELECTRICAL HEIGHT-ADJUSTABLE TABLES MARKET, BY TYPE, 2020-2029 (USD MILLION)
TABLE 557 ARGENTINA FREE STANDING ELECTRICAL HEIGHT-ADJUSTABLE TABLES MARKET, BY TYPE, 2020-2029 (THOUSAND UNITS)
TABLE 558 ARGENTINA FREE STANDING ELECTRICAL HEIGHT-ADJUSTABLE TABLES MARKET, BY APPLICATION, 2020-2029 (USD MILLION)
TABLE 559 ARGENTINA FREE STANDING ELECTRICAL HEIGHT-ADJUSTABLE TABLES MARKET, BY APPLICATION, 2020-2029 (THOUSAND UNITS)
TABLE 560 ARGENTINA OFFICES IN FREE STANDING ELECTRICAL HEIGHT-ADJUSTABLE TABLES MARKET, BY SEGMENT, 2020-2029 (USD MILLION)
TABLE 561 ARGENTINA OFFICES IN FREE STANDING ELECTRICAL HEIGHT-ADJUSTABLE TABLES MARKET, BY SEGMENT, 2020-2029 (THOUSAND UNITS)
TABLE 562 ARGENTINA COMMERCIAL IN FREE STANDING ELECTRICAL HEIGHT-ADJUSTABLE TABLES MARKET, BY SEGMENT, 2020-2029 (USD MILLION)
TABLE 563 ARGENTINA COMMERCIAL IN FREE STANDING ELECTRICAL HEIGHT-ADJUSTABLE TABLES MARKET, BY SEGMENT, 2020-2029 (THOUSAND UNITS)
TABLE 564 ARGENTINA INDUSTRIAL IN FREE STANDING ELECTRICAL HEIGHT-ADJUSTABLE TABLES MARKET, BY SEGMENT, 2020-2029 (USD MILLION)
TABLE 565 ARGENTINA INDUSTRIAL IN FREE STANDING ELECTRICAL HEIGHT-ADJUSTABLE TABLES MARKET, BY SEGMENT, 2020-2029 (THOUSAND UNITS)
TABLE 566 ARGENTINA HOME IN FREE STANDING ELECTRICAL HEIGHT-ADJUSTABLE TABLES MARKET, BY SEGMENT, 2020-2029 (USD MILLION)
TABLE 567 ARGENTINA HOME IN FREE STANDING ELECTRICAL HEIGHT-ADJUSTABLE TABLES MARKET, BY SEGMENT, 2020-2029 (THOUSAND UNITS)
TABLE 568 ARGENTINA FREE STANDING ELECTRICAL HEIGHT-ADJUSTABLE TABLES MARKET, BY SALES CHANNEL, 2020-2029 (USD MILLION)
TABLE 569 ARGENTINA FREE STANDING ELECTRICAL HEIGHT-ADJUSTABLE TABLES MARKET, BY SALES CHANNEL, 2020-2029 (THOUSAND UNITS)
TABLE 570 REST OF SOUTH AMERICA FREE STANDING ELECTRICAL HEIGHT-ADJUSTABLE TABLES MARKET, BY TYPE, 2020-2029 (USD MILLION)
TABLE 571 REST OF SOUTH AMERICA FREE STANDING ELECTRICAL HEIGHT-ADJUSTABLE TABLES MARKET, BY TYPE, 2020-2029 (THOUSAND UNITS)
TABLE 572 MIDDLE EAST AND AFRICA FREE STANDING ELECTRICAL HEIGHT-ADJUSTABLE TABLES MARKET, BY COUNTRY, 2020-2029 (USD MILLION)
TABLE 573 MIDDLE EAST AND AFRICA FREE STANDING ELECTRICAL HEIGHT-ADJUSTABLE TABLES MARKET, BY COUNTRY, 2020-2029 (THOUSAND UNITS)
TABLE 574 MIDDLE EAST AND AFRICA FREE STANDING ELECTRICAL HEIGHT-ADJUSTABLE TABLES MARKET, BY TYPE, 2020-2029 (USD MILLION)
TABLE 575 MIDDLE EAST AND AFRICA FREE STANDING ELECTRICAL HEIGHT-ADJUSTABLE TABLES MARKET, BY TYPE, 2020-2029 (THOUSAND UNITS)
TABLE 576 MIDDLE EAST AND AFRICA FREE STANDING ELECTRICAL HEIGHT-ADJUSTABLE TABLES MARKET, BY APPLICATION, 2020-2029 (USD MILLION)
TABLE 577 MIDDLE EAST AND AFRICA FREE STANDING ELECTRICAL HEIGHT-ADJUSTABLE TABLES MARKET, BY APPLICATION, 2020-2029 (THOUSAND UNITS)
TABLE 578 MIDDLE EAST AND AFRICA OFFICES IN FREE STANDING ELECTRICAL HEIGHT-ADJUSTABLE TABLES MARKET, BY SEGMENT, 2020-2029 (USD MILLION)
TABLE 579 MIDDLE EAST AND AFRICA OFFICES IN FREE STANDING ELECTRICAL HEIGHT-ADJUSTABLE TABLES MARKET, BY SEGMENT, 2020-2029 (THOUSAND UNITS)
TABLE 580 MIDDLE EAST AND AFRICA COMMERCIAL IN FREE STANDING ELECTRICAL HEIGHT-ADJUSTABLE TABLES MARKET, BY SEGMENT, 2020-2029 (USD MILLION)
TABLE 581 MIDDLE EAST AND AFRICA COMMERCIAL IN FREE STANDING ELECTRICAL HEIGHT-ADJUSTABLE TABLES MARKET, BY SEGMENT, 2020-2029 (THOUSAND UNITS)
TABLE 582 MIDDLE EAST AND AFRICA INDUSTRIAL IN FREE STANDING ELECTRICAL HEIGHT-ADJUSTABLE TABLES MARKET, BY SEGMENT, 2020-2029 (USD MILLION)
TABLE 583 MIDDLE EAST AND AFRICA INDUSTRIAL IN FREE STANDING ELECTRICAL HEIGHT-ADJUSTABLE TABLES MARKET, BY SEGMENT, 2020-2029 (THOUSAND UNITS)
TABLE 584 MIDDLE EAST AND AFRICA HOME IN FREE STANDING ELECTRICAL HEIGHT-ADJUSTABLE TABLES MARKET, BY SEGMENT, 2020-2029 (USD MILLION)
TABLE 585 MIDDLE EAST AND AFRICA HOME IN FREE STANDING ELECTRICAL HEIGHT-ADJUSTABLE TABLES MARKET, BY SEGMENT, 2020-2029 (THOUSAND UNITS)
TABLE 586 MIDDLE EAST AND AFRICA FREE STANDING ELECTRICAL HEIGHT-ADJUSTABLE TABLES MARKET, BY SALES CHANNEL, 2020-2029 (USD MILLION)
TABLE 587 MIDDLE EAST AND AFRICA FREE STANDING ELECTRICAL HEIGHT-ADJUSTABLE TABLES MARKET, BY SALES CHANNEL, 2020-2029 (THOUSAND UNITS)
TABLE 588 SAUDI ARABIA FREE STANDING ELECTRICAL HEIGHT-ADJUSTABLE TABLES MARKET, BY TYPE, 2020-2029 (USD MILLION)
TABLE 589 SAUDI ARABIA FREE STANDING ELECTRICAL HEIGHT-ADJUSTABLE TABLES MARKET, BY TYPE, 2020-2029 (THOUSAND UNITS)
TABLE 590 SAUDI ARABIA FREE STANDING ELECTRICAL HEIGHT-ADJUSTABLE TABLES MARKET, BY APPLICATION, 2020-2029 (USD MILLION)
TABLE 591 SAUDI ARABIA FREE STANDING ELECTRICAL HEIGHT-ADJUSTABLE TABLES MARKET, BY APPLICATION, 2020-2029 (THOUSAND UNITS)
TABLE 592 SAUDI ARABIA OFFICES IN FREE STANDING ELECTRICAL HEIGHT-ADJUSTABLE TABLES MARKET, BY SEGMENT, 2020-2029 (USD MILLION)
TABLE 593 SAUDI ARABIA OFFICES IN FREE STANDING ELECTRICAL HEIGHT-ADJUSTABLE TABLES MARKET, BY SEGMENT, 2020-2029 (THOUSAND UNITS)
TABLE 594 SAUDI ARABIA COMMERCIAL IN FREE STANDING ELECTRICAL HEIGHT-ADJUSTABLE TABLES MARKET, BY SEGMENT, 2020-2029 (USD MILLION)
TABLE 595 SAUDI ARABIA COMMERCIAL IN FREE STANDING ELECTRICAL HEIGHT-ADJUSTABLE TABLES MARKET, BY SEGMENT, 2020-2029 (THOUSAND UNITS)
TABLE 596 SAUDI ARABIA INDUSTRIAL IN FREE STANDING ELECTRICAL HEIGHT-ADJUSTABLE TABLES MARKET, BY SEGMENT, 2020-2029 (USD MILLION)
TABLE 597 SAUDI ARABIA INDUSTRIAL IN FREE STANDING ELECTRICAL HEIGHT-ADJUSTABLE TABLES MARKET, BY SEGMENT, 2020-2029 (THOUSAND UNITS)
TABLE 598 SAUDI ARABIA HOME IN FREE STANDING ELECTRICAL HEIGHT-ADJUSTABLE TABLES MARKET, BY SEGMENT, 2020-2029 (USD MILLION)
TABLE 599 SAUDI ARABIA HOME IN FREE STANDING ELECTRICAL HEIGHT-ADJUSTABLE TABLES MARKET, BY SEGMENT, 2020-2029 (THOUSAND UNITS)
TABLE 600 SAUDI ARABIA FREE STANDING ELECTRICAL HEIGHT-ADJUSTABLE TABLES MARKET, BY SALES CHANNEL, 2020-2029 (USD MILLION)
TABLE 601 SAUDI ARABIA FREE STANDING ELECTRICAL HEIGHT-ADJUSTABLE TABLES MARKET, BY SALES CHANNEL, 2020-2029 (THOUSAND UNITS)
TABLE 602 UNITED ARAB EMIRATES FREE STANDING ELECTRICAL HEIGHT-ADJUSTABLE TABLES MARKET, BY TYPE, 2020-2029 (USD MILLION)
TABLE 603 UNITED ARAB EMIRATES FREE STANDING ELECTRICAL HEIGHT-ADJUSTABLE TABLES MARKET, BY TYPE, 2020-2029 (THOUSAND UNITS)
TABLE 604 UNITED ARAB EMIRATES FREE STANDING ELECTRICAL HEIGHT-ADJUSTABLE TABLES MARKET, BY APPLICATION, 2020-2029 (USD MILLION)
TABLE 605 UNITED ARAB EMIRATES FREE STANDING ELECTRICAL HEIGHT-ADJUSTABLE TABLES MARKET, BY APPLICATION, 2020-2029 (THOUSAND UNITS)
TABLE 606 UNITED ARAB EMIRATES OFFICES IN FREE STANDING ELECTRICAL HEIGHT-ADJUSTABLE TABLES MARKET, BY SEGMENT, 2020-2029 (USD MILLION)
TABLE 607 UNITED ARAB EMIRATES OFFICES IN FREE STANDING ELECTRICAL HEIGHT-ADJUSTABLE TABLES MARKET, BY SEGMENT, 2020-2029 (THOUSAND UNITS)
TABLE 608 UNITED ARAB EMIRATES COMMERCIAL IN FREE STANDING ELECTRICAL HEIGHT-ADJUSTABLE TABLES MARKET, BY SEGMENT, 2020-2029 (USD MILLION)
TABLE 609 UNITED ARAB EMIRATES COMMERCIAL IN FREE STANDING ELECTRICAL HEIGHT-ADJUSTABLE TABLES MARKET, BY SEGMENT, 2020-2029 (THOUSAND UNITS)
TABLE 610 UNITED ARAB EMIRATES INDUSTRIAL IN FREE STANDING ELECTRICAL HEIGHT-ADJUSTABLE TABLES MARKET, BY SEGMENT, 2020-2029 (USD MILLION)
TABLE 611 UNITED ARAB EMIRATES INDUSTRIAL IN FREE STANDING ELECTRICAL HEIGHT-ADJUSTABLE TABLES MARKET, BY SEGMENT, 2020-2029 (THOUSAND UNITS)
TABLE 612 UNITED ARAB EMIRATES HOME IN FREE STANDING ELECTRICAL HEIGHT-ADJUSTABLE TABLES MARKET, BY SEGMENT, 2020-2029 (USD MILLION)
TABLE 613 UNITED ARAB EMIRATES HOME IN FREE STANDING ELECTRICAL HEIGHT-ADJUSTABLE TABLES MARKET, BY SEGMENT, 2020-2029 (THOUSAND UNITS)
TABLE 614 UNITED ARAB EMIRATES FREE STANDING ELECTRICAL HEIGHT-ADJUSTABLE TABLES MARKET, BY SALES CHANNEL, 2020-2029 (USD MILLION)
TABLE 615 UNITED ARAB EMIRATES FREE STANDING ELECTRICAL HEIGHT-ADJUSTABLE TABLES MARKET, BY SALES CHANNEL, 2020-2029 (THOUSAND UNITS)
TABLE 616 ISRAEL FREE STANDING ELECTRICAL HEIGHT-ADJUSTABLE TABLES MARKET, BY TYPE, 2020-2029 (USD MILLION)
TABLE 617 ISRAEL FREE STANDING ELECTRICAL HEIGHT-ADJUSTABLE TABLES MARKET, BY TYPE, 2020-2029 (THOUSAND UNITS)
TABLE 618 ISRAEL FREE STANDING ELECTRICAL HEIGHT-ADJUSTABLE TABLES MARKET, BY APPLICATION, 2020-2029 (USD MILLION)
TABLE 619 ISRAEL FREE STANDING ELECTRICAL HEIGHT-ADJUSTABLE TABLES MARKET, BY APPLICATION, 2020-2029 (THOUSAND UNITS)
TABLE 620 ISRAEL OFFICES IN FREE STANDING ELECTRICAL HEIGHT-ADJUSTABLE TABLES MARKET, BY SEGMENT, 2020-2029 (USD MILLION)
TABLE 621 ISRAEL OFFICES IN FREE STANDING ELECTRICAL HEIGHT-ADJUSTABLE TABLES MARKET, BY SEGMENT, 2020-2029 (THOUSAND UNITS)
TABLE 622 ISRAEL COMMERCIAL IN FREE STANDING ELECTRICAL HEIGHT-ADJUSTABLE TABLES MARKET, BY SEGMENT, 2020-2029 (USD MILLION)
TABLE 623 ISRAEL COMMERCIAL IN FREE STANDING ELECTRICAL HEIGHT-ADJUSTABLE TABLES MARKET, BY SEGMENT, 2020-2029 (THOUSAND UNITS)
TABLE 624 ISRAEL INDUSTRIAL IN FREE STANDING ELECTRICAL HEIGHT-ADJUSTABLE TABLES MARKET, BY SEGMENT, 2020-2029 (USD MILLION)
TABLE 625 ISRAEL INDUSTRIAL IN FREE STANDING ELECTRICAL HEIGHT-ADJUSTABLE TABLES MARKET, BY SEGMENT, 2020-2029 (THOUSAND UNITS)
TABLE 626 ISRAEL HOME IN FREE STANDING ELECTRICAL HEIGHT-ADJUSTABLE TABLES MARKET, BY SEGMENT, 2020-2029 (USD MILLION)
TABLE 627 ISRAEL HOME IN FREE STANDING ELECTRICAL HEIGHT-ADJUSTABLE TABLES MARKET, BY SEGMENT, 2020-2029 (THOUSAND UNITS)
TABLE 628 ISRAEL FREE STANDING ELECTRICAL HEIGHT-ADJUSTABLE TABLES MARKET, BY SALES CHANNEL, 2020-2029 (USD MILLION)
TABLE 629 ISRAEL FREE STANDING ELECTRICAL HEIGHT-ADJUSTABLE TABLES MARKET, BY SALES CHANNEL, 2020-2029 (THOUSAND UNITS)
TABLE 630 EGYPT FREE STANDING ELECTRICAL HEIGHT-ADJUSTABLE TABLES MARKET, BY TYPE, 2020-2029 (USD MILLION)
TABLE 631 EGYPT FREE STANDING ELECTRICAL HEIGHT-ADJUSTABLE TABLES MARKET, BY TYPE, 2020-2029 (THOUSAND UNITS)
TABLE 632 EGYPT FREE STANDING ELECTRICAL HEIGHT-ADJUSTABLE TABLES MARKET, BY APPLICATION, 2020-2029 (USD MILLION)
TABLE 633 EGYPT FREE STANDING ELECTRICAL HEIGHT-ADJUSTABLE TABLES MARKET, BY APPLICATION, 2020-2029 (THOUSAND UNITS)
TABLE 634 EGYPT OFFICES IN FREE STANDING ELECTRICAL HEIGHT-ADJUSTABLE TABLES MARKET, BY SEGMENT, 2020-2029 (USD MILLION)
TABLE 635 EGYPT OFFICES IN FREE STANDING ELECTRICAL HEIGHT-ADJUSTABLE TABLES MARKET, BY SEGMENT, 2020-2029 (THOUSAND UNITS)
TABLE 636 EGYPT COMMERCIAL IN FREE STANDING ELECTRICAL HEIGHT-ADJUSTABLE TABLES MARKET, BY SEGMENT, 2020-2029 (USD MILLION)
TABLE 637 EGYPT COMMERCIAL IN FREE STANDING ELECTRICAL HEIGHT-ADJUSTABLE TABLES MARKET, BY SEGMENT, 2020-2029 (THOUSAND UNITS)
TABLE 638 EGYPT INDUSTRIAL IN FREE STANDING ELECTRICAL HEIGHT-ADJUSTABLE TABLES MARKET, BY SEGMENT, 2020-2029 (USD MILLION)
TABLE 639 EGYPT INDUSTRIAL IN FREE STANDING ELECTRICAL HEIGHT-ADJUSTABLE TABLES MARKET, BY SEGMENT, 2020-2029 (THOUSAND UNITS)
TABLE 640 EGYPT HOME IN FREE STANDING ELECTRICAL HEIGHT-ADJUSTABLE TABLES MARKET, BY SEGMENT, 2020-2029 (USD MILLION)
TABLE 641 EGYPT HOME IN FREE STANDING ELECTRICAL HEIGHT-ADJUSTABLE TABLES MARKET, BY SEGMENT, 2020-2029 (THOUSAND UNITS)
TABLE 642 EGYPT FREE STANDING ELECTRICAL HEIGHT-ADJUSTABLE TABLES MARKET, BY SALES CHANNEL, 2020-2029 (USD MILLION)
TABLE 643 EGYPT FREE STANDING ELECTRICAL HEIGHT-ADJUSTABLE TABLES MARKET, BY SALES CHANNEL, 2020-2029 (THOUSAND UNITS)
TABLE 644 SOUTH AFRICA FREE STANDING ELECTRICAL HEIGHT-ADJUSTABLE TABLES MARKET, BY TYPE, 2020-2029 (USD MILLION)
TABLE 645 SOUTH AFRICA FREE STANDING ELECTRICAL HEIGHT-ADJUSTABLE TABLES MARKET, BY TYPE, 2020-2029 (THOUSAND UNITS)
TABLE 646 SOUTH AFRICA FREE STANDING ELECTRICAL HEIGHT-ADJUSTABLE TABLES MARKET, BY APPLICATION, 2020-2029 (USD MILLION)
TABLE 647 SOUTH AFRICA FREE STANDING ELECTRICAL HEIGHT-ADJUSTABLE TABLES MARKET, BY APPLICATION, 2020-2029 (THOUSAND UNITS)
TABLE 648 SOUTH AFRICA OFFICES IN FREE STANDING ELECTRICAL HEIGHT-ADJUSTABLE TABLES MARKET, BY SEGMENT, 2020-2029 (USD MILLION)
TABLE 649 SOUTH AFRICA OFFICES IN FREE STANDING ELECTRICAL HEIGHT-ADJUSTABLE TABLES MARKET, BY SEGMENT, 2020-2029 (THOUSAND UNITS)
TABLE 650 SOUTH AFRICA COMMERCIAL IN FREE STANDING ELECTRICAL HEIGHT-ADJUSTABLE TABLES MARKET, BY SEGMENT, 2020-2029 (USD MILLION)
TABLE 651 SOUTH AFRICA COMMERCIAL IN FREE STANDING ELECTRICAL HEIGHT-ADJUSTABLE TABLES MARKET, BY SEGMENT, 2020-2029 (THOUSAND UNITS)
TABLE 652 SOUTH AFRICA INDUSTRIAL IN FREE STANDING ELECTRICAL HEIGHT-ADJUSTABLE TABLES MARKET, BY SEGMENT, 2020-2029 (USD MILLION)
TABLE 653 SOUTH AFRICA INDUSTRIAL IN FREE STANDING ELECTRICAL HEIGHT-ADJUSTABLE TABLES MARKET, BY SEGMENT, 2020-2029 (THOUSAND UNITS)
TABLE 654 SOUTH AFRICA HOME IN FREE STANDING ELECTRICAL HEIGHT-ADJUSTABLE TABLES MARKET, BY SEGMENT, 2020-2029 (USD MILLION)
TABLE 655 SOUTH AFRICA HOME IN FREE STANDING ELECTRICAL HEIGHT-ADJUSTABLE TABLES MARKET, BY SEGMENT, 2020-2029 (THOUSAND UNITS)
TABLE 656 SOUTH AFRICA FREE STANDING ELECTRICAL HEIGHT-ADJUSTABLE TABLES MARKET, BY SALES CHANNEL, 2020-2029 (USD MILLION)
TABLE 657 SOUTH AFRICA FREE STANDING ELECTRICAL HEIGHT-ADJUSTABLE TABLES MARKET, BY SALES CHANNEL, 2020-2029 (THOUSAND UNITS)
TABLE 658 REST OF MIDDLE EAST & AFRICA FREE STANDING ELECTRICAL HEIGHT-ADJUSTABLE TABLES MARKET, BY TYPE, 2020-2029 (USD MILLION)
TABLE 659 REST OF MIDDLE EAST & AFRICA FREE STANDING ELECTRICAL HEIGHT-ADJUSTABLE TABLES MARKET, BY TYPE, 2020-2029 (THOUSAND UNITS)
Liste des figures
FIGURE 1 GLOBAL FREE STANDING ELECTRICAL HEIGHT-ADJUSTABLE TABLES MARKET: SEGMENTATION
FIGURE 2 GLOBAL FREE STANDING ELECTRICAL HEIGHT-ADJUSTABLE TABLES MARKET: DATA TRIANGULATION
FIGURE 3 GLOBAL FREE STANDING ELECTRICAL HEIGHT-ADJUSTABLE TABLES MARKET: DROC ANALYSIS
FIGURE 4 GLOBAL FREE STANDING ELECTRICAL HEIGHT-ADJUSTABLE TABLES MARKET: GLOBAL VS REGIONAL ANALYSIS
FIGURE 5 GLOBAL FREE STANDING ELECTRICAL HEIGHT-ADJUSTABLE TABLES MARKET: COMPANY RESEARCH ANALYSIS
FIGURE 6 GLOBAL FREE STANDING ELECTRICAL HEIGHT-ADJUSTABLE TABLES MARKET: INTERVIEW DEMOGRAPHICS
FIGURE 7 GLOBAL FREE STANDING ELECTRICAL HEIGHT-ADJUSTABLE TABLES MARKET: DBMR POSITION GRID
FIGURE 8 GLOBAL FREE STANDING ELECTRICAL HEIGHT-ADJUSTABLE TABLES MARKET: VENDOR SHARE ANALYSIS
FIGURE 9 GLOBAL FREE STANDING ELECTRICAL HEIGHT-ADJUSTABLE TABLES MARKET: SEGMENTATION
FIGURE 10 NORTH AMERICA REGION IS EXPECTED TO DOMINATE THE GLOBAL FREE STANDING ELECTRICAL HEIGHT-ADJUSTABLE TABLES MARKET GROWING AND HAS THE HIGHEST CAGR IN THE FORECAST PERIOD OF 2022 TO 2029
FIGURE 11 THE INCREASED TREND HYBRID WORKING OR WORK FROM HOME CULTURE IS EXPECTED TO DRIVE THE GLOBAL FREE STANDING ELECTRICAL HEIGHT-ADJUSTABLE TABLES MARKET IN THE FORECAST PERIOD OF 2022 TO 2029
FIGURE 12 THE SINGLE MOTOR SEGMENT IS EXPECTED TO ACCOUNT FOR THE LARGEST SHARE OF THE GLOBAL FREE STANDING ELECTRICAL HEIGHT-ADJUSTABLE TABLES MARKET IN THE FORECAST PERIOD OF 2022 TO 2029
FIGURE 13 NORTH AMERICA IS THE FASTEST-GROWING MARKET FOR FREE STANDING ELECTRICAL HEIGHT-ADJUSTABLE TABLES MANUFACTURERS IN THE FORECAST PERIOD OF 2022 TO 2029
FIGURE 14 SUPPLY CHAIN OF GLOBAL FREE STANDING ELECTRICAL HEIGHT-ADJUSTABLE TABLES MARKET
FIGURE 15 DRIVERS, RESTRAINTS, OPPORTUNITIES, AND CHALLENGES OF THE GLOBAL FREE STANDING ELECTRICAL HEIGHT-ADJUSTABLE TABLES MARKET
FIGURE 16 GLOBAL FREE STANDING ELECTRICAL HEIGHT-ADJUSTABLE TABLES MARKET, BY TYPE, 2021
FIGURE 17 GLOBAL FREE STANDING ELECTRICAL HEIGHT-ADJUSTABLE TABLES MARKET, BY APPLICATION, 2021
FIGURE 18 GLOBAL FREE STANDING ELECTRICAL HEIGHT-ADJUSTABLE TABLES MARKET, BY SALES CHANNELS, 2021
FIGURE 19 GLOBAL FREE STANDING ELECTRICAL HEIGHT-ADJUSTABLE TABLES MARKET: SNAPSHOT (2021)
FIGURE 20 GLOBAL FREE STANDING ELECTRICAL HEIGHT-ADJUSTABLE TABLES MARKET: BY REGION (2021)
FIGURE 21 GLOBAL FREE STANDING ELECTRICAL HEIGHT-ADJUSTABLE TABLES MARKET: BY REGION (2022 & 2029)
FIGURE 22 GLOBAL FREE STANDING ELECTRICAL HEIGHT-ADJUSTABLE TABLES MARKET: BY REGION (2021 & 2029)
FIGURE 23 GLOBAL FREE STANDING ELECTRICAL HEIGHT-ADJUSTABLE TABLES MARKET: BY MATERIAL (2022-2029)
FIGURE 24 NORTH AMERICA FREE STANDING ELECTRICAL HEIGHT-ADJUSTABLE TABLES MARKET: SNAPSHOT (2021)
FIGURE 25 NORTH AMERICA FREE STANDING ELECTRICAL HEIGHT-ADJUSTABLE TABLES MARKET: BY COUNTRY (2021)
FIGURE 26 NORTH AMERICA FREE STANDING ELECTRICAL HEIGHT-ADJUSTABLE TABLES MARKET: BY COUNTRY (2022 & 2029)
FIGURE 27 NORTH AMERICA FREE STANDING ELECTRICAL HEIGHT-ADJUSTABLE TABLES MARKET: BY COUNTRY (2021 & 2029)
FIGURE 28 NORTH AMERICA FREE STANDING ELECTRICAL HEIGHT-ADJUSTABLE TABLES MARKET: BY TYPE (2022-2029)
FIGURE 29 EUROPE FREE STANDING ELECTRICAL HEIGHT-ADJUSTABLE TABLES MARKET: SNAPSHOT (2021)
FIGURE 30 EUROPE FREE STANDING ELECTRICAL HEIGHT-ADJUSTABLE TABLES MARKET: BY COUNTRY (2021)
FIGURE 31 EUROPE FREE STANDING ELECTRICAL HEIGHT-ADJUSTABLE TABLES MARKET: BY COUNTRY (2022 & 2029)
FIGURE 32 EUROPE FREE STANDING ELECTRICAL HEIGHT-ADJUSTABLE TABLES MARKET: BY COUNTRY (2021 & 2029)
FIGURE 33 EUROPE FREE STANDING ELECTRICAL HEIGHT-ADJUSTABLE TABLES MARKET: BY TYPE (2022-2029)
FIGURE 34 ASIA-PACIFIC FREE STANDING ELECTRICAL HEIGHT-ADJUSTABLE TABLES MARKET: SNAPSHOT (2021)
FIGURE 35 ASIA-PACIFIC FREE STANDING ELECTRICAL HEIGHT-ADJUSTABLE TABLES MARKET: BY COUNTRY (2021)
FIGURE 36 ASIA-PACIFIC FREE STANDING ELECTRICAL HEIGHT-ADJUSTABLE TABLES MARKET: BY COUNTRY (2022 & 2029)
FIGURE 37 ASIA-PACIFIC FREE STANDING ELECTRICAL HEIGHT-ADJUSTABLE TABLES MARKET: BY COUNTRY (2021 & 2029)
FIGURE 38 ASIA-PACIFIC FREE STANDING ELECTRICAL HEIGHT-ADJUSTABLE TABLES MARKET: BY TYPE (2022-2029)
FIGURE 39 SOUTH AMERICA FREE STANDING ELECTRICAL HEIGHT-ADJUSTABLE TABLES MARKET: SNAPSHOT (2021)
FIGURE 40 SOUTH AMERICA FREE STANDING ELECTRICAL HEIGHT-ADJUSTABLE TABLES MARKET: BY COUNTRY (2021)
FIGURE 41 SOUTH AMERICA FREE STANDING ELECTRICAL HEIGHT-ADJUSTABLE TABLES MARKET: BY COUNTRY (2022 & 2029)
FIGURE 42 SOUTH AMERICA FREE STANDING ELECTRICAL HEIGHT-ADJUSTABLE TABLES MARKET: BY COUNTRY (2021 & 2029)
FIGURE 43 SOUTH AMERICA FREE STANDING ELECTRICAL HEIGHT-ADJUSTABLE TABLES MARKET: BY TYPE (2022-2029)
FIGURE 44 MIDDLE EAST & AFRICA FREE STANDING ELECTRICAL HEIGHT-ADJUSTABLE TABLES MARKET: SNAPSHOT (2021)
FIGURE 45 MIDDLE EAST & AFRICA FREE STANDING ELECTRICAL HEIGHT-ADJUSTABLE TABLES MARKET: BY COUNTRY (2021)
FIGURE 46 MIDDLE EAST & AFRICA FREE STANDING ELECTRICAL HEIGHT-ADJUSTABLE TABLES MARKET: BY COUNTRY (2022 & 2029)
FIGURE 47 MIDDLE EAST & AFRICA FREE STANDING ELECTRICAL HEIGHT-ADJUSTABLE TABLES MARKET: BY COUNTRY (2021 & 2029)
FIGURE 48 MIDDLE EAST & AFRICA FREE STANDING ELECTRICAL HEIGHT-ADJUSTABLE TABLES MARKET: BY TYPE (2022-2029)
FIGURE 49 GLOBAL FREE STANDING ELECTRICAL HEIGHT ADJUSTABLE TABLES MARKET: COMPANY SHARE 2021 (%)
FIGURE 50 NORTH AMERICA FREE STANDING ELECTRICAL HEIGHT ADJUSTABLE TABLES MARKET: COMPANY SHARE 2021 (%)
FIGURE 51 EUROPE FREE STANDING ELECTRICAL HEIGHT ADJUSTABLE TABLES MARKET: COMPANY SHARE 2021 (%)
FIGURE 52 ASIA-PACIFIC FREE STANDING ELECTRICAL HEIGHT ADJUSTABLE TABLES MARKET: COMPANY SHARE 2021 (%)
Méthodologie de recherche
La collecte de données et l'analyse de l'année de base sont effectuées à l'aide de modules de collecte de données avec des échantillons de grande taille. L'étape consiste à obtenir des informations sur le marché ou des données connexes via diverses sources et stratégies. Elle comprend l'examen et la planification à l'avance de toutes les données acquises dans le passé. Elle englobe également l'examen des incohérences d'informations observées dans différentes sources d'informations. Les données de marché sont analysées et estimées à l'aide de modèles statistiques et cohérents de marché. De plus, l'analyse des parts de marché et l'analyse des tendances clés sont les principaux facteurs de succès du rapport de marché. Pour en savoir plus, veuillez demander un appel d'analyste ou déposer votre demande.
La méthodologie de recherche clé utilisée par l'équipe de recherche DBMR est la triangulation des données qui implique l'exploration de données, l'analyse de l'impact des variables de données sur le marché et la validation primaire (expert du secteur). Les modèles de données incluent la grille de positionnement des fournisseurs, l'analyse de la chronologie du marché, l'aperçu et le guide du marché, la grille de positionnement des entreprises, l'analyse des brevets, l'analyse des prix, l'analyse des parts de marché des entreprises, les normes de mesure, l'analyse globale par rapport à l'analyse régionale et des parts des fournisseurs. Pour en savoir plus sur la méthodologie de recherche, envoyez une demande pour parler à nos experts du secteur.
Personnalisation disponible
Data Bridge Market Research est un leader de la recherche formative avancée. Nous sommes fiers de fournir à nos clients existants et nouveaux des données et des analyses qui correspondent à leurs objectifs. Le rapport peut être personnalisé pour inclure une analyse des tendances des prix des marques cibles, une compréhension du marché pour d'autres pays (demandez la liste des pays), des données sur les résultats des essais cliniques, une revue de la littérature, une analyse du marché des produits remis à neuf et de la base de produits. L'analyse du marché des concurrents cibles peut être analysée à partir d'une analyse basée sur la technologie jusqu'à des stratégies de portefeuille de marché. Nous pouvons ajouter autant de concurrents que vous le souhaitez, dans le format et le style de données que vous recherchez. Notre équipe d'analystes peut également vous fournir des données sous forme de fichiers Excel bruts, de tableaux croisés dynamiques (Fact book) ou peut vous aider à créer des présentations à partir des ensembles de données disponibles dans le rapport.

