

Marché mondial des substituts de graisse, par type (à base de glucides, de protéines et de graisses), source (végétale et animale), catégorie (Clean-Label et conventionnelle), forme (liquide et sèche), application (boulangerie, produits laitiers, sauces, soupes et vinaigrettes, plats cuisinés, viande transformée, confiserie, boissons, aliments fonctionnels et autres), pays (États-Unis, Canada, Mexique, Allemagne, Royaume-Uni, Italie, France, Espagne, Russie, Suisse, Belgique, Pays-Bas, Russie et reste de l'Europe, Japon, Chine, Corée du Sud, Inde, Singapour, Indonésie, Malaisie, Philippines, Australie et reste de l'Asie-Pacifique, Brésil, Argentine, reste de l'Amérique du Sud, Afrique du Sud, Arabie saoudite, Émirats arabes unis, Koweït et reste du Moyen-Orient et de l'Afrique) Tendances et prévisions de l'industrie jusqu'en 2029.
 Analyse et perspectives du marché : marché mondial des substituts de graisse
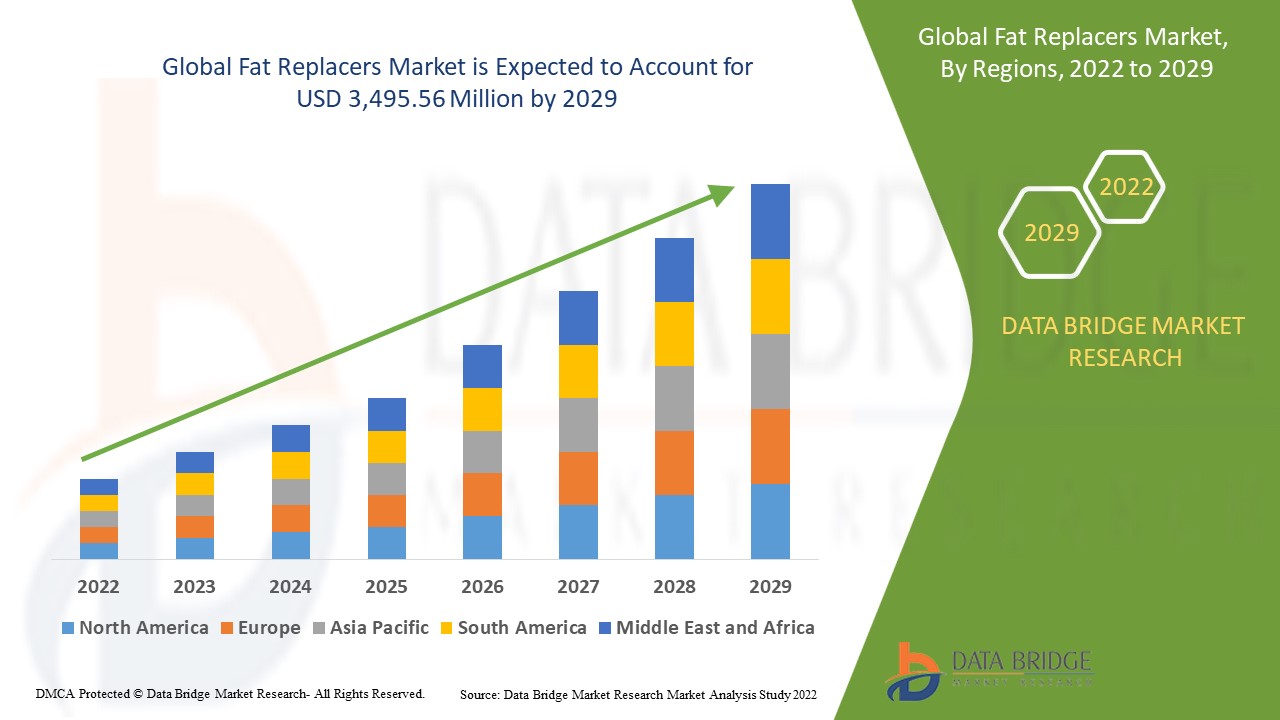
Le marché mondial des substituts de graisse devrait connaître une croissance significative au cours de la période de prévision de 2022 à 2029. Data Bridge Market Research analyse que le marché croît avec un TCAC de 6,2 % au cours de la période de prévision de 2022 à 2029 et devrait atteindre 3 495,56 millions USD d'ici 2029. La sensibilisation accrue des gens à la consommation excessive de graisses et la conscience croissante de la santé parmi les gens agissent comme moteur de la croissance du marché mondial des substituts de graisse.
Les substituts de matières grasses, également appelés substituts de matières grasses, sont des substances qui remplacent la totalité ou une partie des matières grasses dans un régime alimentaire tout en conservant le même goût, la même texture et la même sensation en bouche que l'aliment entier d'origine. Les matières grasses ne sont pas une substance unique, mais plutôt un ensemble de diverses substances constituées d'une molécule de glycérol et de trois acides gras distincts . C'est un élément essentiel d'une alimentation saine. Il contient les éléments constitutifs des prostaglandines, contient des acides gras essentiels, aide à contrôler le métabolisme du cholestérol, transporte les vitamines liposolubles et les caroténoïdes dans tout le corps et offre neuf calories d'énergie par gramme.
Les substituts de matières grasses sont des composés utilisés pour remplacer les matières grasses dans une variété d'aliments et de boissons. La majorité des substituts de matières grasses sont des versions reformulées de composants alimentaires existants (amidons, gommes, cellulose et autres).
Les matières grasses sont présentes dans presque tous les aliments. Elles confèrent une texture, une saveur et un arôme distincts au plat dans lequel elles sont présentes. Bien que les matières grasses soient nécessaires à la vie, elles peuvent être nocives pour la santé si elles sont consommées au-delà des besoins physiologiques. Les régimes riches en matières grasses augmentent le risque de maladie cardiaque, de prise de poids et de plusieurs cancers. L'utilisation de substituts de matières grasses dans les produits alimentaires permet de conserver les caractéristiques de qualité d'origine des aliments tout en évitant les risques associés à la consommation de matières grasses. Le marché des substituts de matières grasses connaît une croissance significative en raison de la sensibilisation croissante des personnes à la consommation excessive de matières grasses et de la prise de conscience croissante de la santé des personnes. La participation croissante des personnes aux programmes de gestion de la perte de poids, la réglementation gouvernementale croissante associée à la limitation de la consommation quotidienne de matières grasses et l'utilisation croissante de substituts de matières grasses dans les produits de boulangerie, les produits laitiers et les produits surgelés stimulent également la croissance du marché mondial des substituts de matières grasses. Cependant, le goût défavorable par rapport aux matières grasses et les problèmes nutritionnels associés aux substituts de matières grasses devraient freiner la croissance du marché des substituts de matières grasses au cours de la période de prévision. L'augmentation de la consommation de plats cuisinés et du nombre croissant de personnes optant pour des régimes sans produits laitiers, ainsi que l'augmentation de la recherche et du développement de substituts de graisse créeront des opportunités pour le marché au cours de la période de prévision. Cependant, les prix élevés des produits de remplacement des graisses et les effets indésirables de ces produits peuvent constituer un énorme défi pour le marché.
Le rapport sur le marché mondial des substituts de graisse fournit des détails sur la part de marché, les nouveaux développements et l'analyse du pipeline de produits, l'impact des acteurs du marché national et local, analyse les opportunités en termes de poches de revenus émergentes, les changements dans la réglementation du marché, les approbations de produits, les décisions stratégiques, les lancements de produits, les expansions géographiques et les innovations technologiques sur le marché. Pour comprendre l'analyse et le scénario du marché des substituts de graisse, contactez Data Bridge Market Research pour un briefing d'analyste, notre équipe vous aidera à créer une solution d'impact sur les revenus pour atteindre votre objectif souhaité.
 Portée et taille du marché mondial des substituts de graisse
Le marché mondial des substituts de graisse est segmenté en fonction du type, de la source, de la catégorie, de la forme et de l'application. La croissance entre les segments vous aide à analyser les niches de croissance et les stratégies pour aborder le marché et déterminer vos principaux domaines d'application et la différence entre vos marchés cibles.
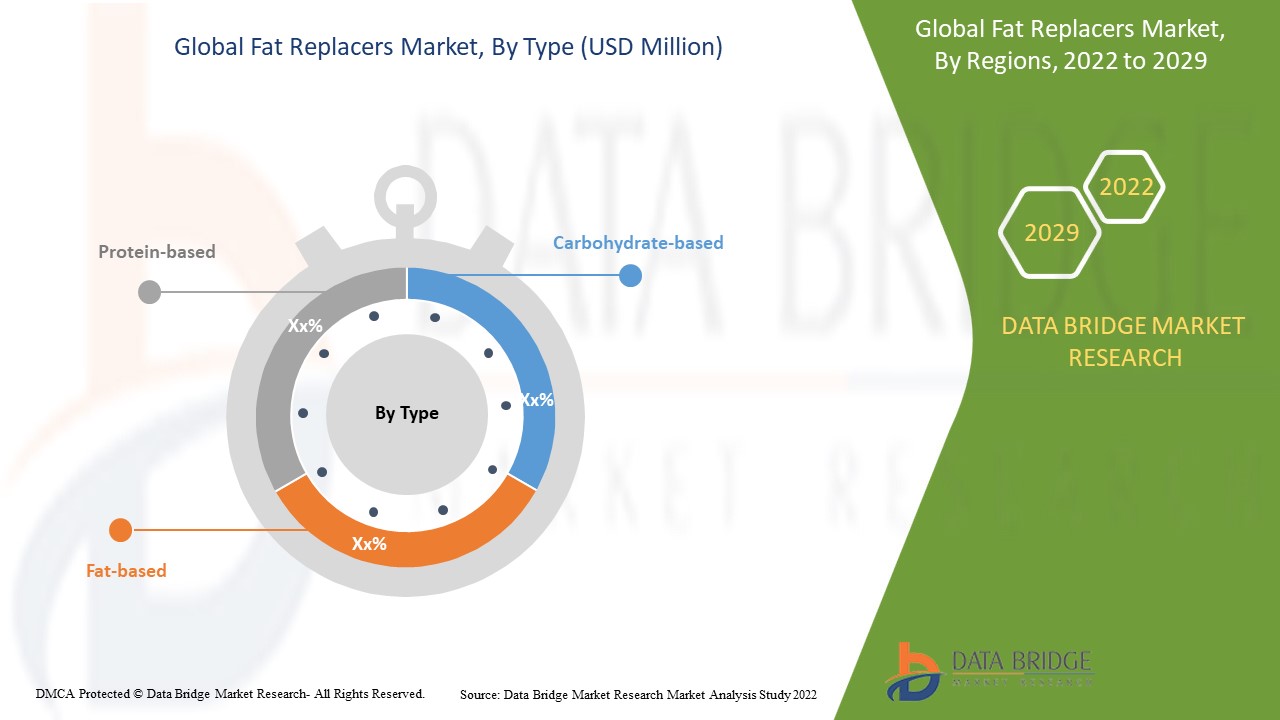
- Sur la base du type, le marché mondial des substituts de graisse est segmenté en produits à base de glucides, de protéines et de matières grasses. En 2022, le segment à base de glucides devrait dominer le marché des substituts de graisse en raison de la demande croissante de substituts de graisse à base de glucides pour imiter certaines des propriétés des graisses conventionnelles.
- Sur la base de la source, le marché mondial des substituts de graisse est segmenté en végétaux et en animaux. En 2022, le segment végétal devrait dominer le marché en raison de la croissance de la population végétalienne et végétarienne à travers le monde.
- Sur la base de la catégorie, le marché mondial des substituts de matières grasses est segmenté en clean label et conventionnel. En 2022, le segment clean label devrait dominer le marché des substituts de matières grasses en raison de la consommation croissante d'ingrédients clean label parmi les consommateurs.
- Sur la base de la forme, le marché mondial des substituts de graisse est segmenté en liquide et en sec. En 2022, le segment sec devrait dominer le marché des substituts de graisse, car les substituts de graisse sous forme sèche sont faciles à utiliser et à entretenir par rapport aux substituts de graisse sous forme liquide.
- En fonction des applications, le marché mondial des substituts de matières grasses est segmenté en produits de boulangerie, produits laitiers, sauces, soupes et vinaigrettes, plats cuisinés, aliments transformés, confiseries, viandes transformées, aliments fonctionnels et autres. En 2022, le segment de la boulangerie devrait dominer le marché des substituts de matières grasses en raison de la demande croissante de collations saines à teneur réduite en matières grasses.
 Analyse du marché des substituts de graisse au niveau des pays
Le marché mondial des substituts de graisse est analysé et des informations sur la taille du marché sont fournies en fonction du type, de la source, de la catégorie, de la forme et de l’application comme référencé ci-dessus.
Les pays couverts dans le rapport sur le marché mondial des substituts de graisse sont les États-Unis, le Canada, le Mexique, l'Allemagne, le Royaume-Uni, l'Italie, la France, l'Espagne, la Russie, la Suisse, la Belgique, les Pays-Bas, la Russie et le reste de l'Europe, le Japon, la Chine, la Corée du Sud, l'Inde, Singapour, l'Indonésie, la Malaisie, les Philippines, l'Australie et le reste de l'Asie-Pacifique, le Brésil, l'Argentine, le reste de l'Amérique du Sud, l'Afrique du Sud, l'Arabie saoudite, les Émirats arabes unis, le Koweït et le reste du Moyen-Orient et de l'Afrique.
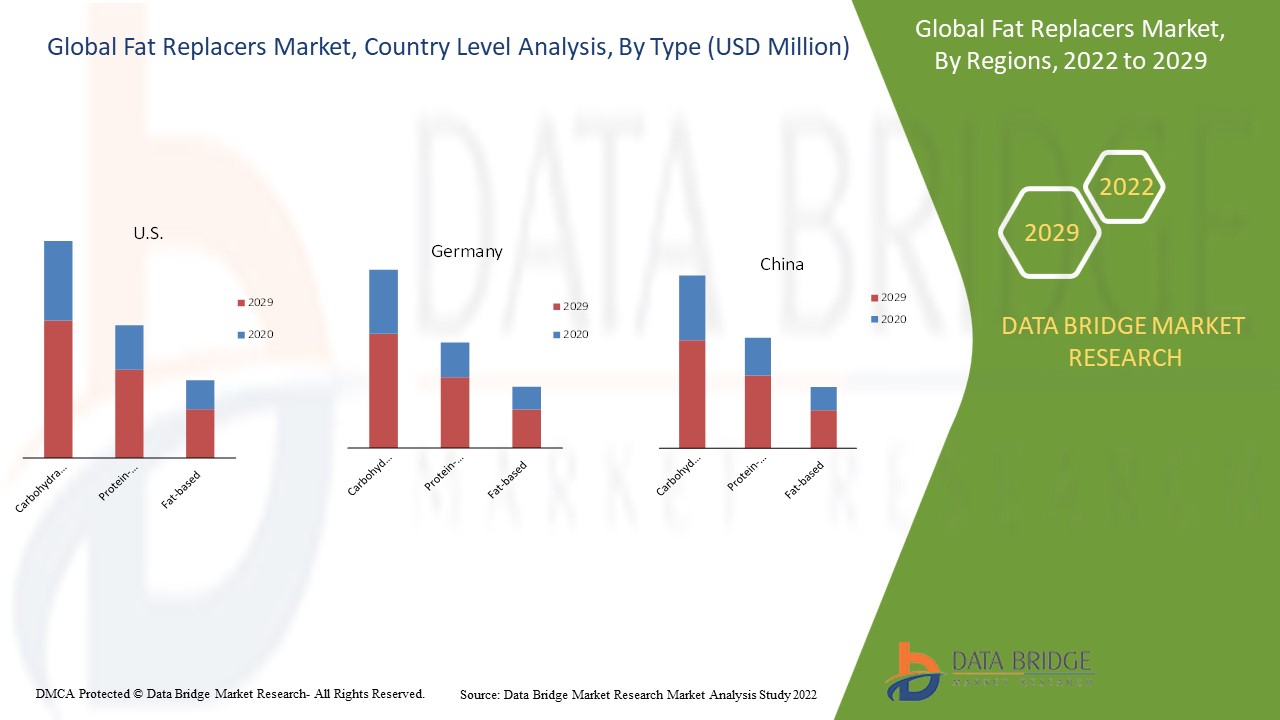
Le segment des types aux États-Unis devrait connaître le taux de croissance le plus élevé au cours de la période de prévision de 2022 à 2029 en raison de la sensibilisation accrue des personnes à la consommation excessive de graisses. Le segment des types en Allemagne domine le marché en raison de la sensibilisation croissante des personnes à la santé. La Chine est en tête de la croissance du marché mondial, car le segment des types domine dans ce pays en raison de la participation croissante des personnes aux programmes de gestion de la perte de poids.
La section pays du rapport fournit également des facteurs d'impact sur les marchés individuels et des changements de réglementation sur le marché national qui ont un impact sur les tendances actuelles et futures du marché. Des points de données tels que les nouvelles ventes, les ventes de remplacement, la démographie des pays, les actes réglementaires et les tarifs d'importation et d'exportation sont quelques-uns des principaux indicateurs utilisés pour prévoir le scénario de marché pour les différents pays. En outre, la présence et la disponibilité des marques mondiales et les défis auxquels elles sont confrontées en raison de la concurrence importante ou rare des marques locales et nationales, l'impact des canaux de vente sont pris en compte lors de l'analyse prévisionnelle des données nationales.
Les activités stratégiques croissantes des principaux acteurs du marché visant à accroître la sensibilisation aux avantages des substituts de graisse stimulent la croissance du marché
Le marché mondial des substituts de graisse vous fournit également une analyse de marché détaillée pour la croissance de chaque pays sur le marché particulier. En outre, il fournit des informations détaillées sur la stratégie des acteurs du marché et leur présence géographique. Les données sont disponibles pour la période historique de 2010 à 2020.
Analyse du paysage concurrentiel et des parts de marché des substituts de graisse
Le paysage concurrentiel du marché mondial des substituts de graisse fournit des détails par concurrent. Les détails inclus sont la présentation de l'entreprise, les finances de l'entreprise, les revenus générés, le potentiel du marché, les investissements dans la recherche et le développement, les nouvelles initiatives du marché, les sites et installations de production, les forces et les faiblesses de l'entreprise, le lancement de produits, les pipelines d'essais de produits, les approbations de produits, les brevets, la largeur et l'étendue du produit, la domination des applications et la courbe de survie technologique. Les points de données ci-dessus fournis ne concernent que l'orientation de l'entreprise vers le marché des substituts de graisse.
Certains des principaux acteurs opérant sur le marché mondial des substituts de matières grasses sont Kerry, ULRICK&SHORT, Ingredion Incorporated, CP Kelco US, Inc., Tate & Lyle, BENEO, Cargill, Incorporated, Wilmar International Ltd, JELU-WERK J. Ehrler GmbH & Co. KG, Epogee, Grain Processing Corporation, Corbion, Ashland, AVEBE et DuPont, entre autres acteurs nationaux. Les analystes de DBMR comprennent les atouts concurrentiels et fournissent une analyse concurrentielle pour chaque concurrent séparément.
De nombreux lancements de produits sont également initiés par les entreprises du monde entier, ce qui accélère encore davantage la croissance du marché mondial des substituts de graisse.
Par exemple,
- En mai 2019, Ingredion Incorporated a lancé un nouvel amidon « clean label » pour réduire la teneur en matières grasses et créer des textures gourmandes. Il permet aux producteurs alimentaires d'améliorer la sensation en bouche en offrant la même fonctionnalité que l'amidon modifié tout en remplaçant ou en réduisant la teneur en matières grasses. Cela a aidé l'entreprise à élargir son portefeuille de produits.
Les collaborations, les lancements de produits, les expansions commerciales, les récompenses et les reconnaissances, les coentreprises et d’autres stratégies des acteurs du marché renforcent l’empreinte des entreprises sur le marché mondial des substituts de graisse.
SKU-
Accédez en ligne au rapport sur le premier cloud mondial de veille économique

- Tableau de bord d'analyse de données interactif
- Tableau de bord d'analyse d'entreprise pour les opportunités à fort potentiel de croissance
- Accès d'analyste de recherche pour la personnalisation et les requêtes
- Analyse de la concurrence avec tableau de bord interactif
- Dernières actualités, mises à jour et analyse des tendances
- Exploitez la puissance de l'analyse comparative pour un suivi complet de la concurrence
Table des matières
1 INTRODUCTION
1.1 OBJECTIVES OF THE STUDY
1.2 MARKET DEFINITION
1.3 OVERVIEW OF GLOBAL FAT REPLACERS MARKET
1.4 LIMITATIONS
1.5 MARKETS COVERED
2 MARKET SEGMENTATION
2.1 MARKETS COVERED
2.2 GEOGRAPHICAL SCOPE
2.3 YEARS CONSIDERED FOR THE STUDY
2.4 CURRENCY AND PRICING
2.5 DBMR TRIPOD DATA VALIDATION MODEL
2.6 MULTIVARIATE MODELLING
2.7 TYPE LIFELINE CURVE
2.8 PRIMARY INTERVIEWS WITH KEY OPINION LEADERS
2.9 DBMR MARKET POSITION GRID
2.1 VENDOR SHARE ANALYSIS
2.11 SECONDARY SOURCES
2.12 ASSUMPTIONS
3 EXECUTIVE SUMMARY
4 PREMIUM INSIGHTS
4.1 GLOBAL FAT REPLACERS MARKET: GROWTH STRATEGIES
4.2 GLOBAL FAT REPLACERS MARKET: INDUSTRIAL INSIGHTS
5 GLOBAL FAT REPLACERS MARKET: REGULATORY FRAMEWORK
5.1 FDA
5.1.1 LABELLING REGULATIONS
5.1.2 OLESTRA
5.1.3 MALTODEXTRINS
5.1.4 ALLERGEN LABELING
5.2 EU
5.2.1 EU ALLERGEN LABELING
5.2.2 EU NUTRITIONAL VALUE
5.2.3 EU HEALTH CLAIM: ‘CARBOHYDRATES CONTRIBUTE TO THE MAINTENANCE OF NORMAL BRAIN FUNCTION’
5.2.4 EU HEALTH CLAIM: ‘CARBOHYDRATE-ELECTROLYTE SOLUTIONS ENHANCE THE ABSORPTION OF WATER DURING PHYSICAL EXERCISE’
5.2.5 EU HEALTH CLAIM: ‘CARBOHYDRATE-ELECTROLYTE SOLUTIONS CAN CONTRIBUTE TO THE MAINTENANCE OF ENDURANCE PERFORMANCE DURING PROLONGED ENDURANCE EXERCISE’
5.2.6 EU HEALTH CLAIM: ‘GLYCEMIC CARBOHYDRATES CONTRIBUTE TO RECOVERY OF NORMAL MUSCLE FUNCTION (CONTRACTION) AFTER STRENUOUS EXERCISE’
5.2.7 EU INFANT NUTRITION REGULATION
6 MARKET OVERVIEW
6.1 DRIVERS
6.1.1 INCREASE IN AWARENESS AMONG PEOPLE ABOUT EXCESSIVE CONSUMPTION OF FAT
6.1.2 GROWING HEALTH CONSCIOUSNESS AMONG PEOPLE
6.1.3 INCREASE IN PARTICIPATION OF PEOPLE IN WEIGHT LOSS MANAGEMENT PROGRAMS
6.1.4 GROWING GOVERNMENT REGULATIONS ASSOCIATED WITH LIMIT ON DAILY CONSUMPTION OF FAT
6.1.5 GROWING USAGE OF FAT REPLACER IN BAKERY, DAIRY, AND FROZEN PRODUCTS
6.2 RESTRAINTS
6.2.1 UNFAVORABLE TASTE WHEN COMPARED TO FATS
6.2.2 NUTRITION PROBLEMS ASSOCIATED WITH FAT SUBSTITUTES
6.3 OPPORTUNITIES
6.3.1 INCREASE IN CONSUMPTION OF CONVENIENCE FOOD
6.3.2 A LARGE NUMBER OF PEOPLE TURNING TO DAIRY-FREE DIETS
6.3.3 INCREASE IN RESEARCH & DEVELOPMENT OF FAT REPLACER
6.4 CHALLENGES
6.4.1 HIGH PRICES OF FAT REPLACER PRODUCTS
6.4.2 ADVERSE EFFECTS OF FAT REPLACERS
7 IMPACT OF COVID-19 ON THE GLOBAL FAT REPLACERSS MARKET
7.1 AFTERMATH OF COVID-19 AND GOVERNMENT INITIATIVES TO BOOST THE GLOBAL FAT REPLACERS MARKET
7.2 STRATEGIC DECISIONS FOR MANUFACTURERS AFTER COVID-19 TO GAIN COMPETITIVE MARKET SHARE
7.3 IMPACT ON PRICE
7.4 IMPACT ON DEMAND
7.5 IMPACT ON SUPPLY CHAIN
7.6 CONCLUSION
8 GLOBAL FAT REPLACERS MARKET, BY TYPE
8.1 OVERVIEW
8.2 CARBOHYDRATE-BASED
8.2.1 STARCH
8.2.2 CELLULOSE
8.2.3 GUM
8.2.4 GELATIN
8.2.5 OTHERS
8.3 PROTEIN-BASED
8.3.1 WHEY PROTEIN
8.3.2 SOY PROTEIN
8.3.3 MILK PROTEIN
8.3.4 EGG PROTEIN
8.3.5 OTHERS
8.4 FAT-BASED
8.4.1 OLESTRA
8.4.2 SALATRIM
8.4.3 CAPRENIN
8.4.4 OTHERS
9 GLOBAL FAT REPLACERS MARKET, BY SOURCE
9.1 OVERVIEW
9.2 PLANT
9.3 ANIMAL
10 GLOBAL FAT REPLACERS MARKET, BY CATEGORY
10.1 OVERVIEW
10.2 CLEAN LABEL
10.3 CONVENTIONAL
11 GLOBAL FAT REPLACERS MARKET, BY FORM
11.1 OVERVIEW
11.2 DRY
11.3 LIQUID
12 GLOBAL FAT REPLACERS MARKET, BY APPLICATION
12.1 OVERVIEW
12.2 BAKERY
12.2.1 BAKERY, BY PRODUCT TYPE
12.2.1.1 BREADS & ROLLS
12.2.1.2 CAKES, PASTRIES, & TRUFFLES
12.2.1.3 COOKIES & BISCUIT
12.2.1.4 TART & PIES
12.2.1.5 BROWNIES
12.2.1.6 TORTILLA
12.2.1.7 OTHERS
12.2.2 BAKERY, BY TYPE
12.2.2.1 CARBOHYDRATE-BASED
12.2.2.2 PROTEIN-BASED
12.2.2.3 FAT-BASED
12.3 DAIRY PRODUCTS
12.3.1 DAIRY PRODUCTS, BY PRODUCT TYPE
12.3.1.1 ICE CREAM
12.3.1.2 YOGURT
12.3.1.2.1 FRESH
12.3.1.2.2 FROZEN
12.3.1.3 MILK
12.3.1.3.1 REGULAR PROCESSED MILK
12.3.1.3.2 FLAVORED MILK
12.3.1.4 CHEESE
12.3.1.5 OTHERS
12.3.2 DAIRY PRODUCTS, BY TYPE
12.3.2.1 CARBOHYDRATE-BASED
12.3.2.2 PROTEIN-BASED
12.3.2.3 FAT-BASED
12.4 CONVENIENCE FOOD
12.4.1 CONVENIENCE FOOD, BY PRODUCT TYPE
12.4.1.1 FROZEN FOOD
12.4.1.2 RTE
12.4.1.3 CANNED FOOD
12.4.1.4 NOODLE AND PASTA
12.4.1.5 CEREALS & SNACKS
12.4.1.6 OTHERS
12.4.2 CONVENIENCE FOOD, BY TYPE
12.4.2.1 CARBOHYDRATE-BASED
12.4.2.2 PROTEIN-BASED
12.4.2.3 FAT-BASED
12.5 PROCESSED MEAT
12.5.1 PROCESSED MEAT, BY TYPE
12.5.1.1 CARBOHYDRATE-BASED
12.5.1.2 PROTEIN-BASED
12.5.1.3 FAT-BASED
12.6 CONFECTIONERY
12.6.1 CONFECTIONERY, BY PRODUCT TYPE
12.6.1.1 CHOCOLATE
12.6.1.2 HARD-BOILED SWEETS
12.6.1.3 GUMS & JELLIES
12.6.1.4 CHOCOLATE SYRUPS
12.6.1.5 CARAMELS & TOFFEES
12.6.1.6 MINTS
12.6.1.7 OTHERS
12.6.2 CONFECTIONERY, BY TYPE
12.6.2.1 CARBOHYDRATE-BASED
12.6.2.2 PROTEIN-BASED
12.6.2.3 FAT-BASED
12.7 FUNCTIONAL FOOD
12.7.1 FUNCTIONAL FOOD, BY TYPE
12.7.1.1 CARBOHYDRATE-BASED
12.7.1.2 PROTEIN-BASED
12.7.1.3 FAT-BASED
12.8 SAUCES, SOUPS, & DRESSINGS
12.8.1 SAUCES, SOUPS, & DRESSINGS, BY TYPE
12.8.1.1 CARBOHYDRATE-BASED
12.8.1.2 PROTEIN-BASED
12.8.1.3 FAT-BASED
12.9 BEVERAGES
12.9.1 BEVERAGES, BY TYPE
12.9.1.1 CARBOHYDRATE-BASED
12.9.1.2 PROTEIN-BASED
12.9.1.3 FAT-BASED
12.1 OTHERS
12.10.1 OTHERS, BY TYPE
12.10.1.1 CARBOHYDRATE-BASED
12.10.1.2 PROTEIN-BASED
12.10.1.3 FAT-BASED
13 GLOBAL FAT REPLACERS MARKET, BY REGION
13.1 OVERVIEW
13.2 NORTH AMERICA
13.2.1 U.S.
13.2.2 CANADA
13.2.3 MEXICO
13.3 EUROPE
13.3.1 GERMANY
13.3.2 FRANCE
13.3.3 U.K.
13.3.4 ITALY
13.3.5 SPAIN
13.3.6 RUSSIA
13.3.7 TURKEY
13.3.8 NETHERLANDS
13.3.9 BELGIUM
13.3.10 SWITZERLAND
13.3.11 REST OF EUROPE
13.4 ASIA-PACIFIC
13.4.1 CHINA
13.4.2 INDIA
13.4.3 JAPAN
13.4.4 AUSTRALIA
13.4.5 INDONESIA
13.4.6 SINGAPORE
13.4.7 SOUTH KOREA
13.4.8 MALAYSIA
13.4.9 THAILAND
13.4.10 PHILIPPINES
13.4.11 REST OF ASIA-PACIFIC
13.5 SOUTH AMERICA
13.5.1 BRAZIL
13.5.2 ARGENTINA
13.5.3 REST OF SOUTH AMERICA
13.6 MIDDLE EAST AND AFRICA
13.6.1 SOUTH AFRICA
13.6.2 SAUDI ARABIA
13.6.3 U.A.E.
13.6.4 KUWAIT
13.6.5 REST OF MIDDLE EAST AND AFRICA
14 GLOBAL FAT REPLACERS MARKET: COMPANY LANDSCAPE
14.1 COMPANY SHARE ANALYSIS: GLOBAL
14.2 COMPANY SHARE ANALYSIS: NORTH AMERICA
14.3 COMPANY SHARE ANALYSIS: EUROPE
14.4 COMPANY SHARE ANALYSIS: ASIA-PACIFIC
15 SWOT ANALYSIS
16 COMPANY PROFILE
16.1 CARGILL, INCORPORATED
16.1.1 COMPANY SNAPSHOT
16.1.2 REVENUE ANALYSIS
16.1.3 COMPANY SHARE ANALYSIS
16.1.4 PRODUCT PORTFOLIO
16.1.5 RECENT DEVELOPMENTS
16.2 WILMAR INTERNATIONAL LTD
16.2.1 COMPANY SNAPSHOT
16.2.2 REVENUS ANALYSIS
16.2.3 COMPANY SHARE ANALYSIS
16.2.4 PRODUCT PORTFOLIO
16.2.5 RECENT DEVELOPMENT
16.3 DUPONT
16.3.1 COMPANY SNAPSHOT
16.3.2 REVENUE ANALYSIS
16.3.3 COMPANY SHARE ANALYSIS
16.3.4 PRODUCT PORTFOLIO
16.3.5 RECENT DEVELOPMENT
16.4 INGREDION INCORPORATED
16.4.1 COMPANY SNAPSHOT
16.4.2 REVENUE ANALYSIS
16.4.3 COMPANY SHARE ANALYSIS
16.4.4 PRODUCT PORTFOLIO
16.4.5 RECENT DEVELOPMENT
16.5 ASHLAND
16.5.1 COMPANY SNAPSHOT
16.5.2 REVENUE ANALYSIS
16.5.3 COMPANY SHARE ANALYSIS
16.5.4 PRODUCT PORTFOLIO
16.5.5 RECENT DEVELOPMENT
16.6 CORBION
16.6.1 COMPANY SNAPSHOT
16.6.2 REVENUE ANALYSIS
16.6.3 PRODUCT PORTFOLIO
16.6.4 RECENT DEVELOPMENTS
16.7 KERRY
16.7.1 COMPANY SNAPSHOT
16.7.2 REVENUE ANALYSIS
16.7.3 PRODUCT PORTFOLIO
16.7.4 RECENT DEVELOPMENTS
16.8 CP KELCO U.S., INC.
16.8.1 COMPANY SNAPSHOT
16.8.2 PRODUCT PORTFOLIO
16.8.3 RECENT DEVELOPMENTS
16.9 AVEBE
16.9.1 COMPANY SNAPSHOT
16.9.2 PRODUCT PORTFOLIO
16.9.3 RECENT DEVELOPMENT
16.1 TATE & LYLE
16.10.1 COMPANY SNAPSHOT
16.10.2 REVENUE ANALYSIS
16.10.3 PRODUCT PORTFOLIO
16.10.4 RECENT DEVELOPMENTS
16.11 BENEO
16.11.1 COMPANY SNAPSHOT
16.11.2 PRODUCT PORTFOLIO
16.11.3 RECENT DEVELOPMENT
16.12 EPOGEE
16.12.1 COMPANY SNAPSHOT
16.12.2 PRODUCT PORTFOLIO
16.12.3 RECENT DEVELOPMENTS
16.13 GRAIN PROCESSING CORPORATION
16.13.1 COMPANY SNAPSHOT
16.13.2 PRODUCT PORTFOLIO
16.13.3 RECENT DEVELOPMENT
16.14 JELU-WERK J. EHRLER GMBH & CO. KG
16.14.1 COMPANY SNAPSHOT
16.14.2 PRODUCT PORTFOLIO
16.14.3 RECENT DEVELOPMENTS
16.15 ULRICK&SHORT
16.15.1 COMPANY SNAPSHOT
16.15.2 PRODUCT PORTFOLIO
16.15.3 RECENT DEVELOPMENTS
17 QUESTIONNAIRE
18 RELATED REPORTS
Liste des tableaux
TABLE 1 GLOBAL FAT REPLACERS MARKET, BY TYPE, 2020-2029 (USD MILLION)
TABLE 2 GLOBAL CARBOHYDRATE-BASED IN FAT REPLACERS MARKET, BY REGION, 2020-2029 (USD MILLION)
TABLE 3 GLOBAL CARBOHYDRATE-BASED IN FAT REPLACERS MARKET, BY TYPE, 2020-2029 (USD MILLION)
TABLE 4 GLOBAL PROTEIN-BASED IN FAT REPLACERS MARKET, BY REGION, 2020-2029 (USD MILLION)
TABLE 5 GLOBAL PROTEIN-BASED IN FAT REPLACERS MARKET, BY TYPE, 2020-2029 (USD MILLION)
TABLE 6 GLOBAL FAT-BASED IN FAT REPLACERS MARKET, BY REGION, 2020-2029 (USD MILLION)
TABLE 7 GLOBAL FAT-BASED IN FAT REPLACERS MARKET, BY TYPE, 2020-2029 (USD MILLION)
TABLE 8 GLOBAL FAT REPLACERS MARKET, BY SOURCE, 2020-2029 (USD MILLION)
TABLE 9 GLOBAL PLANT IN FAT REPLACERS MARKET, BY REGION, 2020-2029 (USD MILLION)
TABLE 10 GLOBAL ANIMAL IN FAT REPLACERS MARKET, BY REGION, 2020-2029 (USD MILLION)
TABLE 11 GLOBAL FAT REPLACERS MARKET, BY CATEGORY, 2020-2029 (USD MILLION)
TABLE 12 GLOBAL CLEAN LABEL IN FAT REPLACERS MARKET, BY REGION, 2020-2029 (USD MILLION)
TABLE 13 GLOBAL CONVENTIONAL IN FAT REPLACERS MARKET, BY REGION, 2020-2029 (USD MILLION)
TABLE 14 GLOBAL FAT REPLACERS MARKET, BY FORM, 2020-2029 (USD MILLION)
TABLE 15 GLOBAL DRY IN FAT REPLACERS MARKET, BY REGION, 2020-2029 (USD MILLION)
TABLE 16 GLOBAL LIQUID IN FAT REPLACERS MARKET, BY REGION, 2020-2029 (USD MILLION)
TABLE 17 GLOBAL FAT REPLACERS MARKET, BY APPLICATION, 2020-2029 (USD MILLION)
TABLE 18 GLOBAL BAKERY IN FAT REPLACERS MARKET, BY REGION, 2020-2029 (USD MILLION)
TABLE 19 GLOBAL BAKERY IN FAT REPLACERS MARKET, BY PRODUCT TYPE, 2020-2029 (USD MILLION)
TABLE 20 GLOBAL BAKERY IN FAT REPLACERS MARKET, BY TYPE, 2020-2029 (USD MILLION)
TABLE 21 GLOBAL DAIRY PRODUCTS IN FAT REPLACERS MARKET, BY REGION, 2020-2029 (USD MILLION)
TABLE 22 GLOBAL DAIRY PRODUCTS IN FAT REPLACERS MARKET, BY PRODUCT TYPE, 2020-2029 (USD MILLION)
TABLE 23 GLOBAL YOGURT IN FAT REPLACERS MARKET, BY PRODUCT TYPE, 2020-2029 (USD MILLION)
TABLE 24 GLOBAL MILK IN FAT REPLACERS MARKET, BY PRODUCT TYPE, 2020-2029 (USD MILLION)
TABLE 25 GLOBAL DAIRY PRODUCT IN FAT REPLACERS MARKET, BY TYPE, 2020-2029 (USD MILLION)
TABLE 26 GLOBAL CONVENIENCE FOOD IN FAT REPLACERS MARKET, BY REGION, 2020-2029 (USD MILLION)
TABLE 27 GLOBAL CONVENIENCE FOOD IN FAT REPLACERS MARKET, BY PRODUCT TYPE, 2020-2029 (USD MILLION)
TABLE 28 GLOBAL CONVENIENCE FOOD IN FAT REPLACERS MARKET, BY TYPE, 2020-2029 (USD MILLION)
TABLE 29 GLOBAL PROCESSED MEAT IN FAT REPLACERS MARKET, BY REGION, 2020-2029 (USD MILLION)
TABLE 30 GLOBAL PROCESSED MEAT IN FAT REPLACERS MARKET, BY TYPE, 2020-2029 (USD MILLION)
TABLE 31 GLOBAL CONFECTIONARY IN FAT REPLACERS MARKET, BY REGION, 2020-2029 (USD MILLION)
TABLE 32 GLOBAL CONFECTIONERY IN FAT REPLACERS MARKET, BY PRODUCT TYPE, 2020-2029 (USD MILLION)
TABLE 33 GLOBAL CONFECTIONERY IN FAT REPLACERS MARKET, BY TYPE, 2020-2029 (USD MILLION)
TABLE 34 GLOBAL FUNCTIONAL FOOD IN FAT REPLACERS MARKET, BY REGION, 2020-2029 (USD MILLION)
TABLE 35 GLOBAL FUNCTIONAL FOOD IN FAT REPLACERS MARKET, BY TYPE, 2020-2029 (USD MILLION)
TABLE 36 GLOBAL SAUCES, SOUPS, & DRESSINGS IN FAT REPLACERS MARKET, BY REGION, 2020-2029 (USD MILLION)
TABLE 37 GLOBAL SAUCES, SOUPS, & DRESSINGS IN FAT REPLACERS MARKET, BY TYPE, 2020-2029 (USD MILLION)
TABLE 38 GLOBAL BEVERAGES IN FAT REPLACERS MARKET, BY REGION, 2020-2029 (USD MILLION)
TABLE 39 GLOBAL BEVERAGES IN FAT REPLACERS MARKET, BY TYPE, 2020-2029 (USD MILLION)
TABLE 40 GLOBAL OTHERS IN FAT REPLACERS MARKET, BY REGION, 2020-2029 (USD MILLION)
TABLE 41 GLOBAL OTHERS IN FAT REPLACERS MARKET, BY TYPE, 2020-2029 (USD MILLION)
TABLE 42 GLOBAL FAT REPLACERS MARKET, BY REGION, 2020-2029 (USD MILLION)
TABLE 43 NORTH AMERICA FAT REPLACERS MARKET, BY COUNTRY, 2020-2029 (USD MILLION)
TABLE 44 NORTH AMERICA FAT REPLACERS MARKET, BY TYPE, 2020-2029 (USD MILLION)
TABLE 45 NORTH AMERICA CARBOHYDRATE-BASED IN FAT REPLACERS MARKET, BY TYPE, 2020-2029 (USD MILLION)
TABLE 46 NORTH AMERICA PROTEIN-BASED IN FAT REPLACERS MARKET, BY TYPE, 2020-2029 (USD MILLION)
TABLE 47 NORTH AMERICA FAT-BASED IN FAT REPLACERS MARKET, BY TYPE, 2020-2029 (USD MILLION)
TABLE 48 NORTH AMERICA REPLACERS MARKET, BY SOURCE, 2020-2029 (USD MILLION)
TABLE 49 NORTH AMERICA FAT REPLACERS MARKET, BY CATEGORY, 2020-2029 (USD MILLION)
TABLE 50 NORTH AMERICA FAT REPLACERS MARKET, BY FORM, 2020-2029 (USD MILLION)
TABLE 51 NORTH AMERICA FAT REPLACERS MARKET, BY APPLICATION, 2020-2029 (USD MILLION)
TABLE 52 NORTH AMERICA BAKERY IN FAT REPLACERS MARKET, BY PRODUCT TYPE, 2020-2029 (USD MILLION)
TABLE 53 NORTH AMERICA BAKERY IN FAT REPLACERS MARKET, BY TYPE, 2020-2029 (USD MILLION)
TABLE 54 NORTH AMERICA DAIRY PRODUCTS IN FAT REPLACERS MARKET, BY PRODUCT TYPE, 2020-2029 (USD MILLION)
TABLE 55 NORTH AMERICA YOGURT IN FAT REPLACERS MARKET, BY PRODUCT TYPE, 2020-2029 (USD MILLION)
TABLE 56 NORTH AMERICA MILK IN FAT REPLACERS MARKET, BY PRODUCT TYPE, 2020-2029 (USD MILLION)
TABLE 57 NORTH AMERICA DAIRY PRODUCTS IN FAT REPLACERS MARKET, BY TYPE, 2020-2029 (USD MILLION)
TABLE 58 NORTH AMERICA CONVENIENCE FOOD IN FAT REPLACERS MARKET, BY PRODUCT TYPE, 2020-2029 (USD MILLION)
TABLE 59 NORTH AMERICA CONVENIENCE FOOD IN FAT REPLACERS MARKET, BY TYPE, 2020-2029 (USD MILLION)
TABLE 60 NORTH AMERICA PROCESSED MEAT IN FAT REPLACERS MARKET, BY TYPE, 2020-2029 (USD MILLION)
TABLE 61 NORTH AMERICA CONFECTIONERY IN FAT REPLACERS MARKET, BY PRODUCT TYPE, 2020-2029 (USD MILLION)
TABLE 62 NORTH AMERICA CONFECTIONERY IN FAT REPLACERS MARKET, BY TYPE, 2020-2029 (USD MILLION)
TABLE 63 NORTH AMERICA FUNCTIONAL FOOD IN FAT REPLACERS MARKET, BY TYPE, 2020-2029 (USD MILLION)
TABLE 64 NORTH AMERICA SAUCES, SOUPS, & DRESSINGS IN FAT REPLACERS MARKET, BY TYPE, 2020-2029 (USD MILLION)
TABLE 65 NORTH AMERICA BEVERAGES IN FAT REPLACERS MARKET, BY TYPE, 2020-2029 (USD MILLION)
TABLE 66 NORTH AMERICA OTHERS IN FAT REPLACERS MARKET, BY TYPE, 2020-2029 (USD MILLION)
TABLE 67 U.S. FAT REPLACERS MARKET, BY TYPE, 2020-2029 (USD MILLION)
TABLE 68 U.S. CARBOHYDRATE-BASED IN FAT REPLACERS MARKET, BY TYPE, 2020-2029 (USD MILLION)
TABLE 69 U.S. PROTEIN-BASED IN FAT REPLACERS MARKET, BY TYPE, 2020-2029 (USD MILLION)
TABLE 70 U.S. FAT-BASED IN FAT REPLACERS MARKET, BY TYPE, 2020-2029 (USD MILLION)
TABLE 71 U.S. REPLACERS MARKET, BY SOURCE, 2020-2029 (USD MILLION)
TABLE 72 U.S. FAT REPLACERS MARKET, BY CATEGORY, 2020-2029 (USD MILLION)
TABLE 73 U.S. FAT REPLACERS MARKET, BY FORM, 2020-2029 (USD MILLION)
TABLE 74 U.S. FAT REPLACERS MARKET, BY APPLICATION, 2020-2029 (USD MILLION)
TABLE 75 U.S. BAKERY IN FAT REPLACERS MARKET, BY PRODUCT TYPE, 2020-2029 (USD MILLION)
TABLE 76 U.S. BAKERY IN FAT REPLACERS MARKET, BY TYPE, 2020-2029 (USD MILLION)
TABLE 77 U.S. DAIRY PRODUCTS IN FAT REPLACERS MARKET, BY PRODUCT TYPE, 2020-2029 (USD MILLION)
TABLE 78 U.S. YOGURT IN FAT REPLACERS MARKET, BY PRODUCT TYPE, 2020-2029 (USD MILLION)
TABLE 79 U.S. MILK IN FAT REPLACERS MARKET, BY PRODUCT TYPE, 2020-2029 (USD MILLION)
TABLE 80 U.S. DAIRY PRODUCTS IN FAT REPLACERS MARKET, BY TYPE, 2020-2029 (USD MILLION)
TABLE 81 U.S. CONVENIENCE FOOD IN FAT REPLACERS MARKET, BY PRODUCT TYPE, 2020-2029 (USD MILLION)
TABLE 82 U.S. CONVENIENCE FOOD IN FAT REPLACERS MARKET, BY TYPE, 2020-2029 (USD MILLION)
TABLE 83 U.S. PROCESSED MEAT IN FAT REPLACERS MARKET, BY TYPE, 2020-2029 (USD MILLION)
TABLE 84 U.S. CONFECTIONERY IN FAT REPLACERS MARKET, BY PRODUCT TYPE, 2020-2029 (USD MILLION)
TABLE 85 U.S. CONFECTIONERY IN FAT REPLACERS MARKET, BY TYPE, 2020-2029 (USD MILLION)
TABLE 86 U.S. FUNCTIONAL FOOD IN FAT REPLACERS MARKET, BY TYPE, 2020-2029 (USD MILLION)
TABLE 87 U.S. SAUCES, SOUPS, & DRESSINGS IN FAT REPLACERS MARKET, BY TYPE, 2020-2029 (USD MILLION)
TABLE 88 U.S. BEVERAGES IN FAT REPLACERS MARKET, BY TYPE, 2020-2029 (USD MILLION)
TABLE 89 U.S. OTHERS IN FAT REPLACERS MARKET, BY TYPE, 2020-2029 (USD MILLION)
TABLE 90 CANADA FAT REPLACERS MARKET, BY TYPE, 2020-2029 (USD MILLION)
TABLE 91 CANADA CARBOHYDRATE-BASED IN FAT REPLACERS MARKET, BY TYPE, 2020-2029 (USD MILLION)
TABLE 92 CANADA PROTEIN-BASED IN FAT REPLACERS MARKET, BY TYPE, 2020-2029 (USD MILLION)
TABLE 93 CANADA FAT-BASED IN FAT REPLACERS MARKET, BY TYPE, 2020-2029 (USD MILLION)
TABLE 94 CANADA REPLACERS MARKET, BY SOURCE, 2020-2029 (USD MILLION)
TABLE 95 CANADA FAT REPLACERS MARKET, BY CATEGORY, 2020-2029 (USD MILLION)
TABLE 96 CANADA FAT REPLACERS MARKET, BY FORM, 2020-2029 (USD MILLION)
TABLE 97 CANADA FAT REPLACERS MARKET, BY APPLICATION, 2020-2029 (USD MILLION)
TABLE 98 CANADA BAKERY IN FAT REPLACERS MARKET, BY PRODUCT TYPE, 2020-2029 (USD MILLION)
TABLE 99 CANADA BAKERY IN FAT REPLACERS MARKET, BY TYPE, 2020-2029 (USD MILLION)
TABLE 100 CANADA DAIRY PRODUCTS IN FAT REPLACERS MARKET, BY PRODUCT TYPE, 2020-2029 (USD MILLION)
TABLE 101 CANADA YOGURT IN FAT REPLACERS MARKET, BY PRODUCT TYPE, 2020-2029 (USD MILLION)
TABLE 102 CANADA MILK IN FAT REPLACERS MARKET, BY PRODUCT TYPE, 2020-2029 (USD MILLION)
TABLE 103 CANADA DAIRY PRODUCTS IN FAT REPLACERS MARKET, BY TYPE, 2020-2029 (USD MILLION)
TABLE 104 CANADA CONVENIENCE FOOD IN FAT REPLACERS MARKET, BY PRODUCT TYPE, 2020-2029 (USD MILLION)
TABLE 105 CANADA CONVENIENCE FOOD IN FAT REPLACERS MARKET, BY TYPE, 2020-2029 (USD MILLION)
TABLE 106 CANADA PROCESSED MEAT IN FAT REPLACERS MARKET, BY TYPE, 2020-2029 (USD MILLION)
TABLE 107 CANADA CONFECTIONERY IN FAT REPLACERS MARKET, BY PRODUCT TYPE, 2020-2029 (USD MILLION)
TABLE 108 CANADA CONFECTIONERY IN FAT REPLACERS MARKET, BY TYPE, 2020-2029 (USD MILLION)
TABLE 109 CANADA FUNCTIONAL FOOD IN FAT REPLACERS MARKET, BY TYPE, 2020-2029 (USD MILLION)
TABLE 110 CANADA SAUCES, SOUPS, & DRESSINGS IN FAT REPLACERS MARKET, BY TYPE, 2020-2029 (USD MILLION)
TABLE 111 CANADA BEVERAGES IN FAT REPLACERS MARKET, BY TYPE, 2020-2029 (USD MILLION)
TABLE 112 CANADA OTHERS IN FAT REPLACERS MARKET, BY TYPE, 2020-2029 (USD MILLION)
TABLE 113 MEXICO FAT REPLACERS MARKET, BY TYPE, 2020-2029 (USD MILLION)
TABLE 114 MEXICO CARBOHYDRATE-BASED IN FAT REPLACERS MARKET, BY TYPE, 2020-2029 (USD MILLION)
TABLE 115 MEXICO PROTEIN-BASED IN FAT REPLACERS MARKET, BY TYPE, 2020-2029 (USD MILLION)
TABLE 116 MEXICO FAT-BASED IN FAT REPLACERS MARKET, BY TYPE, 2020-2029 (USD MILLION)
TABLE 117 MEXICO REPLACERS MARKET, BY SOURCE, 2020-2029 (USD MILLION)
TABLE 118 MEXICO FAT REPLACERS MARKET, BY CATEGORY, 2020-2029 (USD MILLION)
TABLE 119 MEXICO FAT REPLACERS MARKET, BY FORM, 2020-2029 (USD MILLION)
TABLE 120 MEXICO FAT REPLACERS MARKET, BY APPLICATION, 2020-2029 (USD MILLION)
TABLE 121 MEXICO BAKERY IN FAT REPLACERS MARKET, BY PRODUCT TYPE, 2020-2029 (USD MILLION)
TABLE 122 MEXICO BAKERY IN FAT REPLACERS MARKET, BY TYPE, 2020-2029 (USD MILLION)
TABLE 123 MEXICO DAIRY PRODUCTS IN FAT REPLACERS MARKET, BY PRODUCT TYPE, 2020-2029 (USD MILLION)
TABLE 124 MEXICO YOGURT IN FAT REPLACERS MARKET, BY PRODUCT TYPE, 2020-2029 (USD MILLION)
TABLE 125 MEXICO MILK IN FAT REPLACERS MARKET, BY PRODUCT TYPE, 2020-2029 (USD MILLION)
TABLE 126 MEXICO DAIRY PRODUCTS IN FAT REPLACERS MARKET, BY TYPE, 2020-2029 (USD MILLION)
TABLE 127 MEXICO CONVENIENCE FOOD IN FAT REPLACERS MARKET, BY PRODUCT TYPE, 2020-2029 (USD MILLION)
TABLE 128 MEXICO CONVENIENCE FOOD IN FAT REPLACERS MARKET, BY TYPE, 2020-2029 (USD MILLION)
TABLE 129 MEXICO PROCESSED MEAT IN FAT REPLACERS MARKET, BY TYPE, 2020-2029 (USD MILLION)
TABLE 130 MEXICO CONFECTIONERY IN FAT REPLACERS MARKET, BY PRODUCT TYPE, 2020-2029 (USD MILLION)
TABLE 131 MEXICO CONFECTIONERY IN FAT REPLACERS MARKET, BY TYPE, 2020-2029 (USD MILLION)
TABLE 132 MEXICO FUNCTIONAL FOOD IN FAT REPLACERS MARKET, BY TYPE, 2020-2029 (USD MILLION)
TABLE 133 MEXICO SAUCES, SOUPS, & DRESSINGS IN FAT REPLACERS MARKET, BY TYPE, 2020-2029 (USD MILLION)
TABLE 134 MEXICO BEVERAGES IN FAT REPLACERS MARKET, BY TYPE, 2020-2029 (USD MILLION)
TABLE 135 MEXICO OTHERS IN FAT REPLACERS MARKET, BY TYPE, 2020-2029 (USD MILLION)
TABLE 136 EUROPE FAT REPLACERS MARKET, BY COUNTRY, 2020-2029 (USD MILLION)
TABLE 137 EUROPE FAT REPLACERS MARKET, BY TYPE, 2020-2029 (USD MILLION)
TABLE 138 EUROPE CARBOHYDRATE-BASED IN FAT REPLACERS MARKET, BY TYPE, 2020-2029 (USD MILLION)
TABLE 139 EUROPE PROTEIN-BASED IN FAT REPLACERS MARKET, BY TYPE, 2020-2029 (USD MILLION)
TABLE 140 EUROPE FAT-BASED IN FAT REPLACERS MARKET, BY TYPE, 2020-2029 (USD MILLION)
TABLE 141 EUROPE REPLACERS MARKET, BY SOURCE, 2020-2029 (USD MILLION)
TABLE 142 EUROPE FAT REPLACERS MARKET, BY CATEGORY, 2020-2029 (USD MILLION)
TABLE 143 EUROPE FAT REPLACERS MARKET, BY FORM, 2020-2029 (USD MILLION)
TABLE 144 EUROPE FAT REPLACERS MARKET, BY APPLICATION, 2020-2029 (USD MILLION)
TABLE 145 EUROPE BAKERY IN FAT REPLACERS MARKET, BY PRODUCT TYPE, 2020-2029 (USD MILLION)
TABLE 146 EUROPE BAKERY IN FAT REPLACERS MARKET, BY TYPE, 2020-2029 (USD MILLION)
TABLE 147 EUROPE DAIRY PRODUCTS IN FAT REPLACERS MARKET, BY PRODUCT TYPE, 2020-2029 (USD MILLION)
TABLE 148 EUROPE YOGURT IN FAT REPLACERS MARKET, BY PRODUCT TYPE, 2020-2029 (USD MILLION)
TABLE 149 EUROPE MILK IN FAT REPLACERS MARKET, BY PRODUCT TYPE, 2020-2029 (USD MILLION)
TABLE 150 EUROPE DAIRY PRODUCTS IN FAT REPLACERS MARKET, BY TYPE, 2020-2029 (USD MILLION)
TABLE 151 EUROPE CONVENIENCE FOOD IN FAT REPLACERS MARKET, BY PRODUCT TYPE, 2020-2029 (USD MILLION)
TABLE 152 EUROPE CONVENIENCE FOOD IN FAT REPLACERS MARKET, BY TYPE, 2020-2029 (USD MILLION)
TABLE 153 EUROPE PROCESSED MEAT IN FAT REPLACERS MARKET, BY TYPE, 2020-2029 (USD MILLION)
TABLE 154 EUROPE CONFECTIONERY IN FAT REPLACERS MARKET, BY PRODUCT TYPE, 2020-2029 (USD MILLION)
TABLE 155 EUROPE CONFECTIONERY IN FAT REPLACERS MARKET, BY TYPE, 2020-2029 (USD MILLION)
TABLE 156 EUROPE FUNCTIONAL FOOD IN FAT REPLACERS MARKET, BY TYPE, 2020-2029 (USD MILLION)
TABLE 157 EUROPE SAUCES, SOUPS, & DRESSINGS IN FAT REPLACERS MARKET, BY TYPE, 2020-2029 (USD MILLION)
TABLE 158 EUROPE BEVERAGES IN FAT REPLACERS MARKET, BY TYPE, 2020-2029 (USD MILLION)
TABLE 159 EUROPE OTHERS IN FAT REPLACERS MARKET, BY TYPE, 2020-2029 (USD MILLION)
TABLE 160 GERMANY FAT REPLACERS MARKET, BY TYPE, 2020-2029 (USD MILLION)
TABLE 161 GERMANY CARBOHYDRATE-BASED IN FAT REPLACERS MARKET, BY TYPE, 2020-2029 (USD MILLION)
TABLE 162 GERMANY PROTEIN-BASED IN FAT REPLACERS MARKET, BY TYPE, 2020-2029 (USD MILLION)
TABLE 163 GERMANY FAT-BASED IN FAT REPLACERS MARKET, BY TYPE, 2020-2029 (USD MILLION)
TABLE 164 GERMANY REPLACERS MARKET, BY SOURCE, 2020-2029 (USD MILLION)
TABLE 165 GERMANY FAT REPLACERS MARKET, BY CATEGORY, 2020-2029 (USD MILLION)
TABLE 166 GERMANY FAT REPLACERS MARKET, BY FORM, 2020-2029 (USD MILLION)
TABLE 167 GERMANY FAT REPLACERS MARKET, BY APPLICATION, 2020-2029 (USD MILLION)
TABLE 168 GERMANY BAKERY IN FAT REPLACERS MARKET, BY PRODUCT TYPE, 2020-2029 (USD MILLION)
TABLE 169 GERMANY BAKERY IN FAT REPLACERS MARKET, BY TYPE, 2020-2029 (USD MILLION)
TABLE 170 GERMANY DAIRY PRODUCTS IN FAT REPLACERS MARKET, BY PRODUCT TYPE, 2020-2029 (USD MILLION)
TABLE 171 GERMANY YOGURT IN FAT REPLACERS MARKET, BY PRODUCT TYPE, 2020-2029 (USD MILLION)
TABLE 172 GERMANY MILK IN FAT REPLACERS MARKET, BY PRODUCT TYPE, 2020-2029 (USD MILLION)
TABLE 173 GERMANY DAIRY PRODUCTS IN FAT REPLACERS MARKET, BY TYPE, 2020-2029 (USD MILLION)
TABLE 174 GERMANY CONVENIENCE FOOD IN FAT REPLACERS MARKET, BY PRODUCT TYPE, 2020-2029 (USD MILLION)
TABLE 175 GERMANY CONVENIENCE FOOD IN FAT REPLACERS MARKET, BY TYPE, 2020-2029 (USD MILLION)
TABLE 176 GERMANY PROCESSED MEAT IN FAT REPLACERS MARKET, BY TYPE, 2020-2029 (USD MILLION)
TABLE 177 GERMANY CONFECTIONERY IN FAT REPLACERS MARKET, BY PRODUCT TYPE, 2020-2029 (USD MILLION)
TABLE 178 GERMANY CONFECTIONERY IN FAT REPLACERS MARKET, BY TYPE, 2020-2029 (USD MILLION)
TABLE 179 GERMANY FUNCTIONAL FOOD IN FAT REPLACERS MARKET, BY TYPE, 2020-2029 (USD MILLION)
TABLE 180 GERMANY SAUCES, SOUPS, & DRESSINGS IN FAT REPLACERS MARKET, BY TYPE, 2020-2029 (USD MILLION)
TABLE 181 GERMANY BEVERAGES IN FAT REPLACERS MARKET, BY TYPE, 2020-2029 (USD MILLION)
TABLE 182 GERMANY OTHERS IN FAT REPLACERS MARKET, BY TYPE, 2020-2029 (USD MILLION)
TABLE 183 FRANCE FAT REPLACERS MARKET, BY TYPE, 2020-2029 (USD MILLION)
TABLE 184 FRANCE CARBOHYDRATE-BASED IN FAT REPLACERS MARKET, BY TYPE, 2020-2029 (USD MILLION)
TABLE 185 FRANCE PROTEIN-BASED IN FAT REPLACERS MARKET, BY TYPE, 2020-2029 (USD MILLION)
TABLE 186 FRANCE FAT-BASED IN FAT REPLACERS MARKET, BY TYPE, 2020-2029 (USD MILLION)
TABLE 187 FRANCE REPLACERS MARKET, BY SOURCE, 2020-2029 (USD MILLION)
TABLE 188 FRANCE FAT REPLACERS MARKET, BY CATEGORY, 2020-2029 (USD MILLION)
TABLE 189 FRANCE FAT REPLACERS MARKET, BY FORM, 2020-2029 (USD MILLION)
TABLE 190 FRANCE FAT REPLACERS MARKET, BY APPLICATION, 2020-2029 (USD MILLION)
TABLE 191 FRANCE BAKERY IN FAT REPLACERS MARKET, BY PRODUCT TYPE, 2020-2029 (USD MILLION)
TABLE 192 FRANCE BAKERY IN FAT REPLACERS MARKET, BY TYPE, 2020-2029 (USD MILLION)
TABLE 193 FRANCE DAIRY PRODUCTS IN FAT REPLACERS MARKET, BY PRODUCT TYPE, 2020-2029 (USD MILLION)
TABLE 194 FRANCE YOGURT IN FAT REPLACERS MARKET, BY PRODUCT TYPE, 2020-2029 (USD MILLION)
TABLE 195 FRANCE MILK IN FAT REPLACERS MARKET, BY PRODUCT TYPE, 2020-2029 (USD MILLION)
TABLE 196 FRANCE DAIRY PRODUCTS IN FAT REPLACERS MARKET, BY TYPE, 2020-2029 (USD MILLION)
TABLE 197 FRANCE CONVENIENCE FOOD IN FAT REPLACERS MARKET, BY PRODUCT TYPE, 2020-2029 (USD MILLION)
TABLE 198 FRANCE CONVENIENCE FOOD IN FAT REPLACERS MARKET, BY TYPE, 2020-2029 (USD MILLION)
TABLE 199 FRANCE PROCESSED MEAT IN FAT REPLACERS MARKET, BY TYPE, 2020-2029 (USD MILLION)
TABLE 200 FRANCE CONFECTIONERY IN FAT REPLACERS MARKET, BY PRODUCT TYPE, 2020-2029 (USD MILLION)
TABLE 201 FRANCE CONFECTIONERY IN FAT REPLACERS MARKET, BY TYPE, 2020-2029 (USD MILLION)
TABLE 202 FRANCE FUNCTIONAL FOOD IN FAT REPLACERS MARKET, BY TYPE, 2020-2029 (USD MILLION)
TABLE 203 FRANCE SAUCES, SOUPS, & DRESSINGS IN FAT REPLACERS MARKET, BY TYPE, 2020-2029 (USD MILLION)
TABLE 204 FRANCE BEVERAGES IN FAT REPLACERS MARKET, BY TYPE, 2020-2029 (USD MILLION)
TABLE 205 FRANCE OTHERS IN FAT REPLACERS MARKET, BY TYPE, 2020-2029 (USD MILLION)
TABLE 206 U.K. FAT REPLACERS MARKET, BY TYPE, 2020-2029 (USD MILLION)
TABLE 207 U.K. CARBOHYDRATE-BASED IN FAT REPLACERS MARKET, BY TYPE, 2020-2029 (USD MILLION)
TABLE 208 U.K. PROTEIN-BASED IN FAT REPLACERS MARKET, BY TYPE, 2020-2029 (USD MILLION)
TABLE 209 U.K. FAT-BASED IN FAT REPLACERS MARKET, BY TYPE, 2020-2029 (USD MILLION)
TABLE 210 U.K. REPLACERS MARKET, BY SOURCE, 2020-2029 (USD MILLION)
TABLE 211 U.K. FAT REPLACERS MARKET, BY CATEGORY, 2020-2029 (USD MILLION)
TABLE 212 U.K. FAT REPLACERS MARKET, BY FORM, 2020-2029 (USD MILLION)
TABLE 213 U.K. FAT REPLACERS MARKET, BY APPLICATION, 2020-2029 (USD MILLION)
TABLE 214 U.K. BAKERY IN FAT REPLACERS MARKET, BY PRODUCT TYPE, 2020-2029 (USD MILLION)
TABLE 215 U.K. BAKERY IN FAT REPLACERS MARKET, BY TYPE, 2020-2029 (USD MILLION)
TABLE 216 U.K. DAIRY PRODUCTS IN FAT REPLACERS MARKET, BY PRODUCT TYPE, 2020-2029 (USD MILLION)
TABLE 217 U.K. YOGURT IN FAT REPLACERS MARKET, BY PRODUCT TYPE, 2020-2029 (USD MILLION)
TABLE 218 U.K. MILK IN FAT REPLACERS MARKET, BY PRODUCT TYPE, 2020-2029 (USD MILLION)
TABLE 219 U.K. DAIRY PRODUCTS IN FAT REPLACERS MARKET, BY TYPE, 2020-2029 (USD MILLION)
TABLE 220 U.K. CONVENIENCE FOOD IN FAT REPLACERS MARKET, BY PRODUCT TYPE, 2020-2029 (USD MILLION)
TABLE 221 U.K. CONVENIENCE FOOD IN FAT REPLACERS MARKET, BY TYPE, 2020-2029 (USD MILLION)
TABLE 222 U.K. PROCESSED MEAT IN FAT REPLACERS MARKET, BY TYPE, 2020-2029 (USD MILLION)
TABLE 223 U.K. CONFECTIONERY IN FAT REPLACERS MARKET, BY PRODUCT TYPE, 2020-2029 (USD MILLION)
TABLE 224 U.K. CONFECTIONERY IN FAT REPLACERS MARKET, BY TYPE, 2020-2029 (USD MILLION)
TABLE 225 U.K. FUNCTIONAL FOOD IN FAT REPLACERS MARKET, BY TYPE, 2020-2029 (USD MILLION)
TABLE 226 U.K. SAUCES, SOUPS, & DRESSINGS IN FAT REPLACERS MARKET, BY TYPE, 2020-2029 (USD MILLION)
TABLE 227 U.K. BEVERAGES IN FAT REPLACERS MARKET, BY TYPE, 2020-2029 (USD MILLION)
TABLE 228 U.K. OTHERS IN FAT REPLACERS MARKET, BY TYPE, 2020-2029 (USD MILLION)
TABLE 229 ITALY FAT REPLACERS MARKET, BY TYPE, 2020-2029 (USD MILLION)
TABLE 230 ITALY CARBOHYDRATE-BASED IN FAT REPLACERS MARKET, BY TYPE, 2020-2029 (USD MILLION)
TABLE 231 ITALY PROTEIN-BASED IN FAT REPLACERS MARKET, BY TYPE, 2020-2029 (USD MILLION)
TABLE 232 ITALY FAT-BASED IN FAT REPLACERS MARKET, BY TYPE, 2020-2029 (USD MILLION)
TABLE 233 ITALY REPLACERS MARKET, BY SOURCE, 2020-2029 (USD MILLION)
TABLE 234 ITALY FAT REPLACERS MARKET, BY CATEGORY, 2020-2029 (USD MILLION)
TABLE 235 ITALY FAT REPLACERS MARKET, BY FORM, 2020-2029 (USD MILLION)
TABLE 236 ITALY FAT REPLACERS MARKET, BY APPLICATION, 2020-2029 (USD MILLION)
TABLE 237 ITALY BAKERY IN FAT REPLACERS MARKET, BY PRODUCT TYPE, 2020-2029 (USD MILLION)
TABLE 238 ITALY BAKERY IN FAT REPLACERS MARKET, BY TYPE, 2020-2029 (USD MILLION)
TABLE 239 ITALY DAIRY PRODUCTS IN FAT REPLACERS MARKET, BY PRODUCT TYPE, 2020-2029 (USD MILLION)
TABLE 240 ITALY YOGURT IN FAT REPLACERS MARKET, BY PRODUCT TYPE, 2020-2029 (USD MILLION)
TABLE 241 ITALY MILK IN FAT REPLACERS MARKET, BY PRODUCT TYPE, 2020-2029 (USD MILLION)
TABLE 242 ITALY DAIRY PRODUCTS IN FAT REPLACERS MARKET, BY TYPE, 2020-2029 (USD MILLION)
TABLE 243 ITALY CONVENIENCE FOOD IN FAT REPLACERS MARKET, BY PRODUCT TYPE, 2020-2029 (USD MILLION)
TABLE 244 ITALY CONVENIENCE FOOD IN FAT REPLACERS MARKET, BY TYPE, 2020-2029 (USD MILLION)
TABLE 245 ITALY PROCESSED MEAT IN FAT REPLACERS MARKET, BY TYPE, 2020-2029 (USD MILLION)
TABLE 246 ITALY CONFECTIONERY IN FAT REPLACERS MARKET, BY PRODUCT TYPE, 2020-2029 (USD MILLION)
TABLE 247 ITALY CONFECTIONERY IN FAT REPLACERS MARKET, BY TYPE, 2020-2029 (USD MILLION)
TABLE 248 ITALY FUNCTIONAL FOOD IN FAT REPLACERS MARKET, BY TYPE, 2020-2029 (USD MILLION)
TABLE 249 ITALY SAUCES, SOUPS, & DRESSINGS IN FAT REPLACERS MARKET, BY TYPE, 2020-2029 (USD MILLION)
TABLE 250 ITALY BEVERAGES IN FAT REPLACERS MARKET, BY TYPE, 2020-2029 (USD MILLION)
TABLE 251 ITALY OTHERS IN FAT REPLACERS MARKET, BY TYPE, 2020-2029 (USD MILLION)
TABLE 252 SPAIN FAT REPLACERS MARKET, BY TYPE, 2020-2029 (USD MILLION)
TABLE 253 SPAIN CARBOHYDRATE-BASED IN FAT REPLACERS MARKET, BY TYPE, 2020-2029 (USD MILLION)
TABLE 254 SPAIN PROTEIN-BASED IN FAT REPLACERS MARKET, BY TYPE, 2020-2029 (USD MILLION)
TABLE 255 SPAIN FAT-BASED IN FAT REPLACERS MARKET, BY TYPE, 2020-2029 (USD MILLION)
TABLE 256 SPAIN REPLACERS MARKET, BY SOURCE, 2020-2029 (USD MILLION)
TABLE 257 SPAIN FAT REPLACERS MARKET, BY CATEGORY, 2020-2029 (USD MILLION)
TABLE 258 SPAIN FAT REPLACERS MARKET, BY FORM, 2020-2029 (USD MILLION)
TABLE 259 SPAIN FAT REPLACERS MARKET, BY APPLICATION, 2020-2029 (USD MILLION)
TABLE 260 SPAIN BAKERY IN FAT REPLACERS MARKET, BY PRODUCT TYPE, 2020-2029 (USD MILLION)
TABLE 261 SPAIN BAKERY IN FAT REPLACERS MARKET, BY TYPE, 2020-2029 (USD MILLION)
TABLE 262 SPAIN DAIRY PRODUCTS IN FAT REPLACERS MARKET, BY PRODUCT TYPE, 2020-2029 (USD MILLION)
TABLE 263 SPAIN YOGURT IN FAT REPLACERS MARKET, BY PRODUCT TYPE, 2020-2029 (USD MILLION)
TABLE 264 SPAIN MILK IN FAT REPLACERS MARKET, BY PRODUCT TYPE, 2020-2029 (USD MILLION)
TABLE 265 SPAIN DAIRY PRODUCTS IN FAT REPLACERS MARKET, BY TYPE, 2020-2029 (USD MILLION)
TABLE 266 SPAIN CONVENIENCE FOOD IN FAT REPLACERS MARKET, BY PRODUCT TYPE, 2020-2029 (USD MILLION)
TABLE 267 SPAIN CONVENIENCE FOOD IN FAT REPLACERS MARKET, BY TYPE, 2020-2029 (USD MILLION)
TABLE 268 SPAIN PROCESSED MEAT IN FAT REPLACERS MARKET, BY TYPE, 2020-2029 (USD MILLION)
TABLE 269 SPAIN CONFECTIONERY IN FAT REPLACERS MARKET, BY PRODUCT TYPE, 2020-2029 (USD MILLION)
TABLE 270 SPAIN CONFECTIONERY IN FAT REPLACERS MARKET, BY TYPE, 2020-2029 (USD MILLION)
TABLE 271 SPAIN FUNCTIONAL FOOD IN FAT REPLACERS MARKET, BY TYPE, 2020-2029 (USD MILLION)
TABLE 272 SPAIN SAUCES, SOUPS, & DRESSINGS IN FAT REPLACERS MARKET, BY TYPE, 2020-2029 (USD MILLION)
TABLE 273 SPAIN BEVERAGES IN FAT REPLACERS MARKET, BY TYPE, 2020-2029 (USD MILLION)
TABLE 274 SPAIN OTHERS IN FAT REPLACERS MARKET, BY TYPE, 2020-2029 (USD MILLION)
TABLE 275 RUSSIA FAT REPLACERS MARKET, BY TYPE, 2020-2029 (USD MILLION)
TABLE 276 RUSSIA CARBOHYDRATE-BASED IN FAT REPLACERS MARKET, BY TYPE, 2020-2029 (USD MILLION)
TABLE 277 RUSSIA PROTEIN-BASED IN FAT REPLACERS MARKET, BY TYPE, 2020-2029 (USD MILLION)
TABLE 278 RUSSIA FAT-BASED IN FAT REPLACERS MARKET, BY TYPE, 2020-2029 (USD MILLION)
TABLE 279 RUSSIA REPLACERS MARKET, BY SOURCE, 2020-2029 (USD MILLION)
TABLE 280 RUSSIA FAT REPLACERS MARKET, BY CATEGORY, 2020-2029 (USD MILLION)
TABLE 281 RUSSIA FAT REPLACERS MARKET, BY FORM, 2020-2029 (USD MILLION)
TABLE 282 RUSSIA FAT REPLACERS MARKET, BY APPLICATION, 2020-2029 (USD MILLION)
TABLE 283 RUSSIA BAKERY IN FAT REPLACERS MARKET, BY PRODUCT TYPE, 2020-2029 (USD MILLION)
TABLE 284 RUSSIA BAKERY IN FAT REPLACERS MARKET, BY TYPE, 2020-2029 (USD MILLION)
TABLE 285 RUSSIA DAIRY PRODUCTS IN FAT REPLACERS MARKET, BY PRODUCT TYPE, 2020-2029 (USD MILLION)
TABLE 286 RUSSIA YOGURT IN FAT REPLACERS MARKET, BY PRODUCT TYPE, 2020-2029 (USD MILLION)
TABLE 287 RUSSIA MILK IN FAT REPLACERS MARKET, BY PRODUCT TYPE, 2020-2029 (USD MILLION)
TABLE 288 RUSSIA DAIRY PRODUCTS IN FAT REPLACERS MARKET, BY TYPE, 2020-2029 (USD MILLION)
TABLE 289 RUSSIA CONVENIENCE FOOD IN FAT REPLACERS MARKET, BY PRODUCT TYPE, 2020-2029 (USD MILLION)
TABLE 290 RUSSIA CONVENIENCE FOOD IN FAT REPLACERS MARKET, BY TYPE, 2020-2029 (USD MILLION)
TABLE 291 RUSSIA PROCESSED MEAT IN FAT REPLACERS MARKET, BY TYPE, 2020-2029 (USD MILLION)
TABLE 292 RUSSIA CONFECTIONERY IN FAT REPLACERS MARKET, BY PRODUCT TYPE, 2020-2029 (USD MILLION)
TABLE 293 RUSSIA CONFECTIONERY IN FAT REPLACERS MARKET, BY TYPE, 2020-2029 (USD MILLION)
TABLE 294 RUSSIA FUNCTIONAL FOOD IN FAT REPLACERS MARKET, BY TYPE, 2020-2029 (USD MILLION)
TABLE 295 RUSSIA SAUCES, SOUPS, & DRESSINGS IN FAT REPLACERS MARKET, BY TYPE, 2020-2029 (USD MILLION)
TABLE 296 RUSSIA BEVERAGES IN FAT REPLACERS MARKET, BY TYPE, 2020-2029 (USD MILLION)
TABLE 297 RUSSIA OTHERS IN FAT REPLACERS MARKET, BY TYPE, 2020-2029 (USD MILLION)
TABLE 298 TURKEY FAT REPLACERS MARKET, BY TYPE, 2020-2029 (USD MILLION)
TABLE 299 TURKEY CARBOHYDRATE-BASED IN FAT REPLACERS MARKET, BY TYPE, 2020-2029 (USD MILLION)
TABLE 300 TURKEY PROTEIN-BASED IN FAT REPLACERS MARKET, BY TYPE, 2020-2029 (USD MILLION)
TABLE 301 TURKEY FAT-BASED IN FAT REPLACERS MARKET, BY TYPE, 2020-2029 (USD MILLION)
TABLE 302 TURKEY REPLACERS MARKET, BY SOURCE, 2020-2029 (USD MILLION)
TABLE 303 TURKEY FAT REPLACERS MARKET, BY CATEGORY, 2020-2029 (USD MILLION)
TABLE 304 TURKEY FAT REPLACERS MARKET, BY FORM, 2020-2029 (USD MILLION)
TABLE 305 TURKEY FAT REPLACERS MARKET, BY APPLICATION, 2020-2029 (USD MILLION)
TABLE 306 TURKEY BAKERY IN FAT REPLACERS MARKET, BY PRODUCT TYPE, 2020-2029 (USD MILLION)
TABLE 307 TURKEY BAKERY IN FAT REPLACERS MARKET, BY TYPE, 2020-2029 (USD MILLION)
TABLE 308 TURKEY DAIRY PRODUCTS IN FAT REPLACERS MARKET, BY PRODUCT TYPE, 2020-2029 (USD MILLION)
TABLE 309 TURKEY YOGURT IN FAT REPLACERS MARKET, BY PRODUCT TYPE, 2020-2029 (USD MILLION)
TABLE 310 TURKEY MILK IN FAT REPLACERS MARKET, BY PRODUCT TYPE, 2020-2029 (USD MILLION)
TABLE 311 TURKEY DAIRY PRODUCTS IN FAT REPLACERS MARKET, BY TYPE, 2020-2029 (USD MILLION)
TABLE 312 TURKEY CONVENIENCE FOOD IN FAT REPLACERS MARKET, BY PRODUCT TYPE, 2020-2029 (USD MILLION)
TABLE 313 TURKEY CONVENIENCE FOOD IN FAT REPLACERS MARKET, BY TYPE, 2020-2029 (USD MILLION)
TABLE 314 TURKEY PROCESSED MEAT IN FAT REPLACERS MARKET, BY TYPE, 2020-2029 (USD MILLION)
TABLE 315 TURKEY CONFECTIONERY IN FAT REPLACERS MARKET, BY PRODUCT TYPE, 2020-2029 (USD MILLION)
TABLE 316 TURKEY CONFECTIONERY IN FAT REPLACERS MARKET, BY TYPE, 2020-2029 (USD MILLION)
TABLE 317 TURKEY FUNCTIONAL FOOD IN FAT REPLACERS MARKET, BY TYPE, 2020-2029 (USD MILLION)
TABLE 318 TURKEY SAUCES, SOUPS, & DRESSINGS IN FAT REPLACERS MARKET, BY TYPE, 2020-2029 (USD MILLION)
TABLE 319 TURKEY BEVERAGES IN FAT REPLACERS MARKET, BY TYPE, 2020-2029 (USD MILLION)
TABLE 320 TURKEY OTHERS IN FAT REPLACERS MARKET, BY TYPE, 2020-2029 (USD MILLION)
TABLE 321 NETHERLANDS FAT REPLACERS MARKET, BY TYPE, 2020-2029 (USD MILLION)
TABLE 322 NETHERLANDS CARBOHYDRATE-BASED IN FAT REPLACERS MARKET, BY TYPE, 2020-2029 (USD MILLION)
TABLE 323 NETHERLANDS PROTEIN-BASED IN FAT REPLACERS MARKET, BY TYPE, 2020-2029 (USD MILLION)
TABLE 324 NETHERLANDS FAT-BASED IN FAT REPLACERS MARKET, BY TYPE, 2020-2029 (USD MILLION)
TABLE 325 NETHERLANDS REPLACERS MARKET, BY SOURCE, 2020-2029 (USD MILLION)
TABLE 326 NETHERLANDS FAT REPLACERS MARKET, BY CATEGORY, 2020-2029 (USD MILLION)
TABLE 327 NETHERLANDS FAT REPLACERS MARKET, BY FORM, 2020-2029 (USD MILLION)
TABLE 328 NETHERLANDS FAT REPLACERS MARKET, BY APPLICATION, 2020-2029 (USD MILLION)
TABLE 329 NETHERLANDS BAKERY IN FAT REPLACERS MARKET, BY PRODUCT TYPE, 2020-2029 (USD MILLION)
TABLE 330 NETHERLANDS BAKERY IN FAT REPLACERS MARKET, BY TYPE, 2020-2029 (USD MILLION)
TABLE 331 NETHERLANDS DAIRY PRODUCTS IN FAT REPLACERS MARKET, BY PRODUCT TYPE, 2020-2029 (USD MILLION)
TABLE 332 NETHERLANDS YOGURT IN FAT REPLACERS MARKET, BY PRODUCT TYPE, 2020-2029 (USD MILLION)
TABLE 333 NETHERLANDS MILK IN FAT REPLACERS MARKET, BY PRODUCT TYPE, 2020-2029 (USD MILLION)
TABLE 334 NETHERLANDS DAIRY PRODUCTS IN FAT REPLACERS MARKET, BY TYPE, 2020-2029 (USD MILLION)
TABLE 335 NETHERLANDS CONVENIENCE FOOD IN FAT REPLACERS MARKET, BY PRODUCT TYPE, 2020-2029 (USD MILLION)
TABLE 336 NETHERLANDS CONVENIENCE FOOD IN FAT REPLACERS MARKET, BY TYPE, 2020-2029 (USD MILLION)
TABLE 337 NETHERLANDS PROCESSED MEAT IN FAT REPLACERS MARKET, BY TYPE, 2020-2029 (USD MILLION)
TABLE 338 NETHERLANDS CONFECTIONERY IN FAT REPLACERS MARKET, BY PRODUCT TYPE, 2020-2029 (USD MILLION)
TABLE 339 NETHERLANDS CONFECTIONERY IN FAT REPLACERS MARKET, BY TYPE, 2020-2029 (USD MILLION)
TABLE 340 NETHERLANDS FUNCTIONAL FOOD IN FAT REPLACERS MARKET, BY TYPE, 2020-2029 (USD MILLION)
TABLE 341 NETHERLANDS SAUCES, SOUPS, & DRESSINGS IN FAT REPLACERS MARKET, BY TYPE, 2020-2029 (USD MILLION)
TABLE 342 NETHERLANDS BEVERAGES IN FAT REPLACERS MARKET, BY TYPE, 2020-2029 (USD MILLION)
TABLE 343 NETHERLANDS OTHERS IN FAT REPLACERS MARKET, BY TYPE, 2020-2029 (USD MILLION)
TABLE 344 BELGIUM FAT REPLACERS MARKET, BY TYPE, 2020-2029 (USD MILLION)
TABLE 345 BELGIUM CARBOHYDRATE-BASED IN FAT REPLACERS MARKET, BY TYPE, 2020-2029 (USD MILLION)
TABLE 346 BELGIUM PROTEIN-BASED IN FAT REPLACERS MARKET, BY TYPE, 2020-2029 (USD MILLION)
TABLE 347 BELGIUM FAT-BASED IN FAT REPLACERS MARKET, BY TYPE, 2020-2029 (USD MILLION)
TABLE 348 BELGIUM REPLACERS MARKET, BY SOURCE, 2020-2029 (USD MILLION)
TABLE 349 BELGIUM FAT REPLACERS MARKET, BY CATEGORY, 2020-2029 (USD MILLION)
TABLE 350 BELGIUM FAT REPLACERS MARKET, BY FORM, 2020-2029 (USD MILLION)
TABLE 351 BELGIUM FAT REPLACERS MARKET, BY APPLICATION, 2020-2029 (USD MILLION)
TABLE 352 BELGIUM BAKERY IN FAT REPLACERS MARKET, BY PRODUCT TYPE, 2020-2029 (USD MILLION)
TABLE 353 BELGIUM BAKERY IN FAT REPLACERS MARKET, BY TYPE, 2020-2029 (USD MILLION)
TABLE 354 BELGIUM DAIRY PRODUCTS IN FAT REPLACERS MARKET, BY PRODUCT TYPE, 2020-2029 (USD MILLION)
TABLE 355 BELGIUM YOGURT IN FAT REPLACERS MARKET, BY PRODUCT TYPE, 2020-2029 (USD MILLION)
TABLE 356 BELGIUM MILK IN FAT REPLACERS MARKET, BY PRODUCT TYPE, 2020-2029 (USD MILLION)
TABLE 357 BELGIUM DAIRY PRODUCTS IN FAT REPLACERS MARKET, BY TYPE, 2020-2029 (USD MILLION)
TABLE 358 BELGIUM CONVENIENCE FOOD IN FAT REPLACERS MARKET, BY PRODUCT TYPE, 2020-2029 (USD MILLION)
TABLE 359 BELGIUM CONVENIENCE FOOD IN FAT REPLACERS MARKET, BY TYPE, 2020-2029 (USD MILLION)
TABLE 360 BELGIUM PROCESSED MEAT IN FAT REPLACERS MARKET, BY TYPE, 2020-2029 (USD MILLION)
TABLE 361 BELGIUM CONFECTIONERY IN FAT REPLACERS MARKET, BY PRODUCT TYPE, 2020-2029 (USD MILLION)
TABLE 362 BELGIUM CONFECTIONERY IN FAT REPLACERS MARKET, BY TYPE, 2020-2029 (USD MILLION)
TABLE 363 BELGIUM FUNCTIONAL FOOD IN FAT REPLACERS MARKET, BY TYPE, 2020-2029 (USD MILLION)
TABLE 364 BELGIUM SAUCES, SOUPS, & DRESSINGS IN FAT REPLACERS MARKET, BY TYPE, 2020-2029 (USD MILLION)
TABLE 365 BELGIUM BEVERAGES IN FAT REPLACERS MARKET, BY TYPE, 2020-2029 (USD MILLION)
TABLE 366 BELGIUM OTHERS IN FAT REPLACERS MARKET, BY TYPE, 2020-2029 (USD MILLION)
TABLE 367 SWITZERLAND FAT REPLACERS MARKET, BY TYPE, 2020-2029 (USD MILLION)
TABLE 368 SWITZERLAND CARBOHYDRATE-BASED IN FAT REPLACERS MARKET, BY TYPE, 2020-2029 (USD MILLION)
TABLE 369 SWITZERLAND PROTEIN-BASED IN FAT REPLACERS MARKET, BY TYPE, 2020-2029 (USD MILLION)
TABLE 370 SWITZERLAND FAT-BASED IN FAT REPLACERS MARKET, BY TYPE, 2020-2029 (USD MILLION)
TABLE 371 SWITZERLAND REPLACERS MARKET, BY SOURCE, 2020-2029 (USD MILLION)
TABLE 372 SWITZERLAND FAT REPLACERS MARKET, BY CATEGORY, 2020-2029 (USD MILLION)
TABLE 373 SWITZERLAND FAT REPLACERS MARKET, BY FORM, 2020-2029 (USD MILLION)
TABLE 374 SWITZERLAND FAT REPLACERS MARKET, BY APPLICATION, 2020-2029 (USD MILLION)
TABLE 375 SWITZERLAND BAKERY IN FAT REPLACERS MARKET, BY PRODUCT TYPE, 2020-2029 (USD MILLION)
TABLE 376 SWITZERLAND BAKERY IN FAT REPLACERS MARKET, BY TYPE, 2020-2029 (USD MILLION)
TABLE 377 SWITZERLAND DAIRY PRODUCTS IN FAT REPLACERS MARKET, BY PRODUCT TYPE, 2020-2029 (USD MILLION)
TABLE 378 SWITZERLAND YOGURT IN FAT REPLACERS MARKET, BY PRODUCT TYPE, 2020-2029 (USD MILLION)
TABLE 379 SWITZERLAND MILK IN FAT REPLACERS MARKET, BY PRODUCT TYPE, 2020-2029 (USD MILLION)
TABLE 380 SWITZERLAND DAIRY PRODUCTS IN FAT REPLACERS MARKET, BY TYPE, 2020-2029 (USD MILLION)
TABLE 381 SWITZERLAND CONVENIENCE FOOD IN FAT REPLACERS MARKET, BY PRODUCT TYPE, 2020-2029 (USD MILLION)
TABLE 382 SWITZERLAND CONVENIENCE FOOD IN FAT REPLACERS MARKET, BY TYPE, 2020-2029 (USD MILLION)
TABLE 383 SWITZERLAND PROCESSED MEAT IN FAT REPLACERS MARKET, BY TYPE, 2020-2029 (USD MILLION)
TABLE 384 SWITZERLAND CONFECTIONERY IN FAT REPLACERS MARKET, BY PRODUCT TYPE, 2020-2029 (USD MILLION)
TABLE 385 SWITZERLAND CONFECTIONERY IN FAT REPLACERS MARKET, BY TYPE, 2020-2029 (USD MILLION)
TABLE 386 SWITZERLAND FUNCTIONAL FOOD IN FAT REPLACERS MARKET, BY TYPE, 2020-2029 (USD MILLION)
TABLE 387 SWITZERLAND SAUCES, SOUPS, & DRESSINGS IN FAT REPLACERS MARKET, BY TYPE, 2020-2029 (USD MILLION)
TABLE 388 SWITZERLAND BEVERAGES IN FAT REPLACERS MARKET, BY TYPE, 2020-2029 (USD MILLION)
TABLE 389 SWITZERLAND OTHERS IN FAT REPLACERS MARKET, BY TYPE, 2020-2029 (USD MILLION)
TABLE 390 REST OF EUROPE FAT REPLACERS MARKET, BY TYPE, 2020-2029 (USD MILLION)
TABLE 391 ASIA-PACIFIC FAT REPLACERS MARKET, BY COUNTRY, 2020-2029 (USD MILLION)
TABLE 392 ASIA-PACIFIC FAT REPLACERS MARKET, BY TYPE, 2020-2029 (USD MILLION)
TABLE 393 ASIA-PACIFIC CARBOHYDRATE-BASED IN FAT REPLACERS MARKET, BY TYPE, 2020-2029 (USD MILLION)
TABLE 394 ASIA-PACIFIC PROTEIN-BASED IN FAT REPLACERS MARKET, BY TYPE, 2020-2029 (USD MILLION)
TABLE 395 ASIA-PACIFIC FAT-BASED IN FAT REPLACERS MARKET, BY TYPE, 2020-2029 (USD MILLION)
TABLE 396 ASIA-PACIFIC FAT REPLACERS MARKET, BY SOURCE, 2020-2029 (USD MILLION)
TABLE 397 ASIA-PACIFIC FAT REPLACERS MARKET, BY CATEGORY, 2020-2029 (USD MILLION)
TABLE 398 ASIA-PACIFIC FAT REPLACERS MARKET, BY FORM, 2020-2029 (USD MILLION)
TABLE 399 ASIA-PACIFIC FAT REPLACERS MARKET, BY APPLICATION, 2020-2029 (USD MILLION)
TABLE 400 ASIA-PACIFIC BAKERY IN FAT REPLACERS MARKET, BY PRODUCT TYPE, 2020-2029 (USD MILLION)
TABLE 401 ASIA-PACIFIC BAKERY IN FAT REPLACERS MARKET, BY TYPE, 2020-2029 (USD MILLION)
TABLE 402 ASIA-PACIFIC DIARY PRODUCTS IN FAT REPLACERS MARKET, BY PRODUCT TYPE, 2020-2029 (USD MILLION)
TABLE 403 ASIA-PACIFIC YOGURT IN FAT REPLACERS MARKET, BY PRODUCT TYPE, 2020-2029 (USD MILLION)
TABLE 404 ASIA-PACIFIC MILK IN FAT REPLACERS MARKET, BY PRODUCT TYPE, 2020-2029 (USD MILLION)
TABLE 405 ASIA-PACIFIC DAIRY PRODUCTS IN FAT REPLACERS MARKET, BY TYPE, 2020-2029 (USD MILLION)
TABLE 406 ASIA-PACIFIC CONVENIENCE FOOD IN FAT REPLACERS MARKET, BY PRODUCT TYPE, 2020-2029 (USD MILLION)
TABLE 407 ASIA-PACIFIC CONVENIENCE FOOD IN FAT REPLACERS MARKET, BY TYPE, 2020-2029 (USD MILLION)
TABLE 408 ASIA-PACIFIC PROCESSED MEAT IN FAT REPLACERS MARKET, BY TYPE, 2020-2029 (USD MILLION)
TABLE 409 ASIA-PACIFIC CONFECTIONERY IN FAT REPLACERS MARKET, BY PRODUCT TYPE, 2020-2029 (USD MILLION)
TABLE 410 ASIA-PACIFIC CONFECTIONERY IN FAT REPLACERS MARKET, BY TYPE, 2020-2029 (USD MILLION)
TABLE 411 ASIA-PACIFIC FUNCTIONAL FOOD IN FAT REPLACERS MARKET, BY TYPE, 2020-2029 (USD MILLION)
TABLE 412 ASIA-PACIFIC SAUCES, SOUPS, & DRESSINGS IN FAT REPLACERS MARKET, BY TYPE, 2020-2029 (USD MILLION)
TABLE 413 ASIA-PACIFIC BEVERAGES IN FAT REPLACERS MARKET, BY TYPE, 2020-2029 (USD MILLION)
TABLE 414 ASIA-PACIFIC OTHERS IN FAT REPLACERS MARKET, BY TYPE, 2020-2029 (USD MILLION)
TABLE 415 CHINA FAT REPLACERS MARKET, BY TYPE, 2020-2029 (USD MILLION)
TABLE 416 CHINA CARBOHYDRATE-BASED IN FAT REPLACERS MARKET, BY TYPE, 2020-2029 (USD MILLION)
TABLE 417 CHINA PROTEIN-BASED IN FAT REPLACERS MARKET, BY TYPE, 2020-2029 (USD MILLION)
TABLE 418 CHINA FAT-BASED IN FAT REPLACERS MARKET, BY TYPE, 2020-2029 (USD MILLION)
TABLE 419 CHINA FAT REPLACERS MARKET, BY SOURCE, 2020-2029 (USD MILLION)
TABLE 420 CHINA FAT REPLACERS MARKET, BY CATEGORY, 2020-2029 (USD MILLION)
TABLE 421 CHINA FAT REPLACERS MARKET, BY FORM, 2020-2029 (USD MILLION)
TABLE 422 CHINA FAT REPLACERS MARKET, BY APPLICATION, 2020-2029 (USD MILLION)
TABLE 423 CHINA BAKERY IN FAT REPLACERS MARKET, BY PRODUCT TYPE, 2020-2029 (USD MILLION)
TABLE 424 CHINA BAKERY IN FAT REPLACERS MARKET, BY TYPE, 2020-2029 (USD MILLION)
TABLE 425 CHINA DIARY PRODUCTS IN FAT REPLACERS MARKET, BY PRODUCT TYPE, 2020-2029 (USD MILLION)
TABLE 426 CHINA YOGURT IN FAT REPLACERS MARKET, BY PRODUCT TYPE, 2020-2029 (USD MILLION)
TABLE 427 CHINA MILK IN FAT REPLACERS MARKET, BY PRODUCT TYPE, 2020-2029 (USD MILLION)
TABLE 428 CHINA DAIRY PRODUCTS IN FAT REPLACERS MARKET, BY TYPE, 2020-2029 (USD MILLION)
TABLE 429 CHINA CONVENIENCE FOOD IN FAT REPLACERS MARKET, BY PRODUCT TYPE, 2020-2029 (USD MILLION)
TABLE 430 CHINA CONVENIENCE FOOD IN FAT REPLACERS MARKET, BY TYPE, 2020-2029 (USD MILLION)
TABLE 431 CHINA PROCESSED MEAT IN FAT REPLACERS MARKET, BY TYPE, 2020-2029 (USD MILLION)
TABLE 432 CHINA CONFECTIONERY IN FAT REPLACERS MARKET, BY PRODUCT TYPE, 2020-2029 (USD MILLION)
TABLE 433 CHINA CONFECTIONERY IN FAT REPLACERS MARKET, BY TYPE, 2020-2029 (USD MILLION)
TABLE 434 CHINA FUNCTIONAL FOOD IN FAT REPLACERS MARKET, BY TYPE, 2020-2029 (USD MILLION)
TABLE 435 CHINA SAUCES, SOUPS, & DRESSINGS IN FAT REPLACERS MARKET, BY TYPE, 2020-2029 (USD MILLION)
TABLE 436 CHINA BEVERAGES IN FAT REPLACERS MARKET, BY TYPE, 2020-2029 (USD MILLION)
TABLE 437 CHINA OTHERS IN FAT REPLACERS MARKET, BY TYPE, 2020-2029 (USD MILLION)
TABLE 438 INDIA FAT REPLACERS MARKET, BY TYPE, 2020-2029 (USD MILLION)
TABLE 439 INDIA CARBOHYDRATE-BASED IN FAT REPLACERS MARKET, BY TYPE, 2020-2029 (USD MILLION)
TABLE 440 INDIA PROTEIN-BASED IN FAT REPLACERS MARKET, BY TYPE, 2020-2029 (USD MILLION)
TABLE 441 INDIA FAT-BASED IN FAT REPLACERS MARKET, BY TYPE, 2020-2029 (USD MILLION)
TABLE 442 INDIA FAT REPLACERS MARKET, BY SOURCE, 2020-2029 (USD MILLION)
TABLE 443 INDIA FAT REPLACERS MARKET, BY CATEGORY, 2020-2029 (USD MILLION)
TABLE 444 INDIA FAT REPLACERS MARKET, BY FORM, 2020-2029 (USD MILLION)
TABLE 445 INDIA FAT REPLACERS MARKET, BY APPLICATION, 2020-2029 (USD MILLION)
TABLE 446 INDIA BAKERY IN FAT REPLACERS MARKET, BY PRODUCT TYPE, 2020-2029 (USD MILLION)
TABLE 447 INDIA BAKERY IN FAT REPLACERS MARKET, BY TYPE, 2020-2029 (USD MILLION)
TABLE 448 INDIA DIARY PRODUCTS IN FAT REPLACERS MARKET, BY PRODUCT TYPE, 2020-2029 (USD MILLION)
TABLE 449 INDIA YOGURT IN FAT REPLACERS MARKET, BY PRODUCT TYPE, 2020-2029 (USD MILLION)
TABLE 450 INDIA MILK IN FAT REPLACERS MARKET, BY PRODUCT TYPE, 2020-2029 (USD MILLION)
TABLE 451 INDIA DAIRY PRODUCTS IN FAT REPLACERS MARKET, BY TYPE, 2020-2029 (USD MILLION)
TABLE 452 INDIA CONVENIENCE FOOD IN FAT REPLACERS MARKET, BY PRODUCT TYPE, 2020-2029 (USD MILLION)
TABLE 453 INDIA CONVENIENCE FOOD IN FAT REPLACERS MARKET, BY TYPE, 2020-2029 (USD MILLION)
TABLE 454 INDIA PROCESSED MEAT IN FAT REPLACERS MARKET, BY TYPE, 2020-2029 (USD MILLION)
TABLE 455 INDIA CONFECTIONERY IN FAT REPLACERS MARKET, BY PRODUCT TYPE, 2020-2029 (USD MILLION)
TABLE 456 INDIA CONFECTIONERY IN FAT REPLACERS MARKET, BY TYPE, 2020-2029 (USD MILLION)
TABLE 457 INDIA FUNCTIONAL FOOD IN FAT REPLACERS MARKET, BY TYPE, 2020-2029 (USD MILLION)
TABLE 458 INDIA SAUCES, SOUPS, & DRESSINGS IN FAT REPLACERS MARKET, BY TYPE, 2020-2029 (USD MILLION)
TABLE 459 INDIA BEVERAGES IN FAT REPLACERS MARKET, BY TYPE, 2020-2029 (USD MILLION)
TABLE 460 INDIA OTHERS IN FAT REPLACERS MARKET, BY TYPE, 2020-2029 (USD MILLION)
TABLE 461 JAPAN FAT REPLACERS MARKET, BY TYPE, 2020-2029 (USD MILLION)
TABLE 462 JAPAN CARBOHYDRATE-BASED IN FAT REPLACERS MARKET, BY TYPE, 2020-2029 (USD MILLION)
TABLE 463 JAPAN PROTEIN-BASED IN FAT REPLACERS MARKET, BY TYPE, 2020-2029 (USD MILLION)
TABLE 464 JAPAN FAT-BASED IN FAT REPLACERS MARKET, BY TYPE, 2020-2029 (USD MILLION)
TABLE 465 JAPAN FAT REPLACERS MARKET, BY SOURCE, 2020-2029 (USD MILLION)
TABLE 466 JAPAN FAT REPLACERS MARKET, BY CATEGORY, 2020-2029 (USD MILLION)
TABLE 467 JAPAN FAT REPLACERS MARKET, BY FORM, 2020-2029 (USD MILLION)
TABLE 468 JAPAN FAT REPLACERS MARKET, BY APPLICATION, 2020-2029 (USD MILLION)
TABLE 469 JAPAN BAKERY IN FAT REPLACERS MARKET, BY PRODUCT TYPE, 2020-2029 (USD MILLION)
TABLE 470 JAPAN BAKERY IN FAT REPLACERS MARKET, BY TYPE, 2020-2029 (USD MILLION)
TABLE 471 JAPAN DIARY PRODUCTS IN FAT REPLACERS MARKET, BY PRODUCT TYPE, 2020-2029 (USD MILLION)
TABLE 472 JAPAN YOGURT IN FAT REPLACERS MARKET, BY PRODUCT TYPE, 2020-2029 (USD MILLION)
TABLE 473 JAPAN MILK IN FAT REPLACERS MARKET, BY PRODUCT TYPE, 2020-2029 (USD MILLION)
TABLE 474 JAPAN DAIRY PRODUCTS IN FAT REPLACERS MARKET, BY TYPE, 2020-2029 (USD MILLION)
TABLE 475 JAPAN CONVENIENCE FOOD IN FAT REPLACERS MARKET, BY PRODUCT TYPE, 2020-2029 (USD MILLION)
TABLE 476 JAPAN CONVENIENCE FOOD IN FAT REPLACERS MARKET, BY TYPE, 2020-2029 (USD MILLION)
TABLE 477 JAPAN PROCESSED MEAT IN FAT REPLACERS MARKET, BY TYPE, 2020-2029 (USD MILLION)
TABLE 478 JAPAN CONFECTIONERY IN FAT REPLACERS MARKET, BY PRODUCT TYPE, 2020-2029 (USD MILLION)
TABLE 479 JAPAN CONFECTIONERY IN FAT REPLACERS MARKET, BY TYPE, 2020-2029 (USD MILLION)
TABLE 480 JAPAN FUNCTIONAL FOOD IN FAT REPLACERS MARKET, BY TYPE, 2020-2029 (USD MILLION)
TABLE 481 JAPAN SAUCES, SOUPS, & DRESSINGS IN FAT REPLACERS MARKET, BY TYPE, 2020-2029 (USD MILLION)
TABLE 482 JAPAN BEVERAGES IN FAT REPLACERS MARKET, BY TYPE, 2020-2029 (USD MILLION)
TABLE 483 JAPAN OTHERS IN FAT REPLACERS MARKET, BY TYPE, 2020-2029 (USD MILLION)
TABLE 484 AUSTRALIA FAT REPLACERS MARKET, BY TYPE, 2020-2029 (USD MILLION)
TABLE 485 AUSTRALIA CARBOHYDRATE-BASED IN FAT REPLACERS MARKET, BY TYPE, 2020-2029 (USD MILLION)
TABLE 486 AUSTRALIA PROTEIN-BASED IN FAT REPLACERS MARKET, BY TYPE, 2020-2029 (USD MILLION)
TABLE 487 AUSTRALIA FAT-BASED IN FAT REPLACERS MARKET, BY TYPE, 2020-2029 (USD MILLION)
TABLE 488 AUSTRALIA FAT REPLACERS MARKET, BY SOURCE, 2020-2029 (USD MILLION)
TABLE 489 AUSTRALIA FAT REPLACERS MARKET, BY CATEGORY, 2020-2029 (USD MILLION)
TABLE 490 AUSTRALIA FAT REPLACERS MARKET, BY FORM, 2020-2029 (USD MILLION)
TABLE 491 AUSTRALIA FAT REPLACERS MARKET, BY APPLICATION, 2020-2029 (USD MILLION)
TABLE 492 AUSTRALIA BAKERY IN FAT REPLACERS MARKET, BY PRODUCT TYPE, 2020-2029 (USD MILLION)
TABLE 493 AUSTRALIA BAKERY IN FAT REPLACERS MARKET, BY TYPE, 2020-2029 (USD MILLION)
TABLE 494 AUSTRALIA DIARY PRODUCTS IN FAT REPLACERS MARKET, BY PRODUCT TYPE, 2020-2029 (USD MILLION)
TABLE 495 AUSTRALIA YOGURT IN FAT REPLACERS MARKET, BY PRODUCT TYPE, 2020-2029 (USD MILLION)
TABLE 496 AUSTRALIA MILK IN FAT REPLACERS MARKET, BY PRODUCT TYPE, 2020-2029 (USD MILLION)
TABLE 497 AUSTRALIA DAIRY PRODUCTS IN FAT REPLACERS MARKET, BY TYPE, 2020-2029 (USD MILLION)
TABLE 498 AUSTRALIA CONVENIENCE FOOD IN FAT REPLACERS MARKET, BY PRODUCT TYPE, 2020-2029 (USD MILLION)
TABLE 499 AUSTRALIA CONVENIENCE FOOD IN FAT REPLACERS MARKET, BY TYPE, 2020-2029 (USD MILLION)
TABLE 500 AUSTRALIA PROCESSED MEAT IN FAT REPLACERS MARKET, BY TYPE, 2020-2029 (USD MILLION)
TABLE 501 AUSTRALIA CONFECTIONERY IN FAT REPLACERS MARKET, BY PRODUCT TYPE, 2020-2029 (USD MILLION)
TABLE 502 AUSTRALIA CONFECTIONERY IN FAT REPLACERS MARKET, BY TYPE, 2020-2029 (USD MILLION)
TABLE 503 AUSTRALIA FUNCTIONAL FOOD IN FAT REPLACERS MARKET, BY TYPE, 2020-2029 (USD MILLION)
TABLE 504 AUSTRALIA SAUCES, SOUPS, & DRESSINGS IN FAT REPLACERS MARKET, BY TYPE, 2020-2029 (USD MILLION)
TABLE 505 AUSTRALIA BEVERAGES IN FAT REPLACERS MARKET, BY TYPE, 2020-2029 (USD MILLION)
TABLE 506 AUSTRALIA OTHERS IN FAT REPLACERS MARKET, BY TYPE, 2020-2029 (USD MILLION)
TABLE 507 INDONESIA FAT REPLACERS MARKET, BY TYPE, 2020-2029 (USD MILLION)
TABLE 508 INDONESIA CARBOHYDRATE-BASED IN FAT REPLACERS MARKET, BY TYPE, 2020-2029 (USD MILLION)
TABLE 509 INDONESIA PROTEIN-BASED IN FAT REPLACERS MARKET, BY TYPE, 2020-2029 (USD MILLION)
TABLE 510 INDONESIA FAT-BASED IN FAT REPLACERS MARKET, BY TYPE, 2020-2029 (USD MILLION)
TABLE 511 INDONESIA FAT REPLACERS MARKET, BY SOURCE, 2020-2029 (USD MILLION)
TABLE 512 INDONESIA FAT REPLACERS MARKET, BY CATEGORY, 2020-2029 (USD MILLION)
TABLE 513 INDONESIA FAT REPLACERS MARKET, BY FORM, 2020-2029 (USD MILLION)
TABLE 514 INDONESIA FAT REPLACERS MARKET, BY APPLICATION, 2020-2029 (USD MILLION)
TABLE 515 INDONESIA BAKERY IN FAT REPLACERS MARKET, BY PRODUCT TYPE, 2020-2029 (USD MILLION)
TABLE 516 INDONESIA BAKERY IN FAT REPLACERS MARKET, BY TYPE, 2020-2029 (USD MILLION)
TABLE 517 INDONESIA DIARY PRODUCTS IN FAT REPLACERS MARKET, BY PRODUCT TYPE, 2020-2029 (USD MILLION)
TABLE 518 INDONESIA YOGURT IN FAT REPLACERS MARKET, BY PRODUCT TYPE, 2020-2029 (USD MILLION)
TABLE 519 INDONESIA MILK IN FAT REPLACERS MARKET, BY PRODUCT TYPE, 2020-2029 (USD MILLION)
TABLE 520 INDONESIA DAIRY PRODUCTS IN FAT REPLACERS MARKET, BY TYPE, 2020-2029 (USD MILLION)
TABLE 521 INDONESIA CONVENIENCE FOOD IN FAT REPLACERS MARKET, BY PRODUCT TYPE, 2020-2029 (USD MILLION)
TABLE 522 INDONESIA CONVENIENCE FOOD IN FAT REPLACERS MARKET, BY TYPE, 2020-2029 (USD MILLION)
TABLE 523 INDONESIA PROCESSED MEAT IN FAT REPLACERS MARKET, BY TYPE, 2020-2029 (USD MILLION)
TABLE 524 INDONESIA CONFECTIONERY IN FAT REPLACERS MARKET, BY PRODUCT TYPE, 2020-2029 (USD MILLION)
TABLE 525 INDONESIA CONFECTIONERY IN FAT REPLACERS MARKET, BY TYPE, 2020-2029 (USD MILLION)
TABLE 526 INDONESIA FUNCTIONAL FOOD IN FAT REPLACERS MARKET, BY TYPE, 2020-2029 (USD MILLION)
TABLE 527 INDONESIA SAUCES, SOUPS, & DRESSINGS IN FAT REPLACERS MARKET, BY TYPE, 2020-2029 (USD MILLION)
TABLE 528 INDONESIA BEVERAGES IN FAT REPLACERS MARKET, BY TYPE, 2020-2029 (USD MILLION)
TABLE 529 INDONESIA OTHERS IN FAT REPLACERS MARKET, BY TYPE, 2020-2029 (USD MILLION)
TABLE 530 SINGAPORE FAT REPLACERS MARKET, BY TYPE, 2020-2029 (USD MILLION)
TABLE 531 SINGAPORE CARBOHYDRATE-BASED IN FAT REPLACERS MARKET, BY TYPE, 2020-2029 (USD MILLION)
TABLE 532 SINGAPORE PROTEIN-BASED IN FAT REPLACERS MARKET, BY TYPE, 2020-2029 (USD MILLION)
TABLE 533 SINGAPORE FAT-BASED IN FAT REPLACERS MARKET, BY TYPE, 2020-2029 (USD MILLION)
TABLE 534 SINGAPORE FAT REPLACERS MARKET, BY SOURCE, 2020-2029 (USD MILLION)
TABLE 535 SINGAPORE FAT REPLACERS MARKET, BY CATEGORY, 2020-2029 (USD MILLION)
TABLE 536 SINGAPORE FAT REPLACERS MARKET, BY FORM, 2020-2029 (USD MILLION)
TABLE 537 SINGAPORE FAT REPLACERS MARKET, BY APPLICATION, 2020-2029 (USD MILLION)
TABLE 538 SINGAPORE BAKERY IN FAT REPLACERS MARKET, BY PRODUCT TYPE, 2020-2029 (USD MILLION)
TABLE 539 SINGAPORE BAKERY IN FAT REPLACERS MARKET, BY TYPE, 2020-2029 (USD MILLION)
TABLE 540 SINGAPORE DIARY PRODUCTS IN FAT REPLACERS MARKET, BY PRODUCT TYPE, 2020-2029 (USD MILLION)
TABLE 541 SINGAPORE YOGURT IN FAT REPLACERS MARKET, BY PRODUCT TYPE, 2020-2029 (USD MILLION)
TABLE 542 SINGAPORE MILK IN FAT REPLACERS MARKET, BY PRODUCT TYPE, 2020-2029 (USD MILLION)
TABLE 543 SINGAPORE DAIRY PRODUCTS IN FAT REPLACERS MARKET, BY TYPE, 2020-2029 (USD MILLION)
TABLE 544 SINGAPORE CONVENIENCE FOOD IN FAT REPLACERS MARKET, BY PRODUCT TYPE, 2020-2029 (USD MILLION)
TABLE 545 SINGAPORE CONVENIENCE FOOD IN FAT REPLACERS MARKET, BY TYPE, 2020-2029 (USD MILLION)
TABLE 546 SINGAPORE PROCESSED MEAT IN FAT REPLACERS MARKET, BY TYPE, 2020-2029 (USD MILLION)
TABLE 547 SINGAPORE CONFECTIONERY IN FAT REPLACERS MARKET, BY PRODUCT TYPE, 2020-2029 (USD MILLION)
TABLE 548 SINGAPORE CONFECTIONERY IN FAT REPLACERS MARKET, BY TYPE, 2020-2029 (USD MILLION)
TABLE 549 SINGAPORE FUNCTIONAL FOOD IN FAT REPLACERS MARKET, BY TYPE, 2020-2029 (USD MILLION)
TABLE 550 SINGAPORE SAUCES, SOUPS, & DRESSINGS IN FAT REPLACERS MARKET, BY TYPE, 2020-2029 (USD MILLION)
TABLE 551 SINGAPORE BEVERAGES IN FAT REPLACERS MARKET, BY TYPE, 2020-2029 (USD MILLION)
TABLE 552 SINGAPORE OTHERS IN FAT REPLACERS MARKET, BY TYPE, 2020-2029 (USD MILLION)
TABLE 553 SOUTH KOREA FAT REPLACERS MARKET, BY TYPE, 2020-2029 (USD MILLION)
TABLE 554 SOUTH KOREA CARBOHYDRATE-BASED IN FAT REPLACERS MARKET, BY TYPE, 2020-2029 (USD MILLION)
TABLE 555 SOUTH KOREA PROTEIN-BASED IN FAT REPLACERS MARKET, BY TYPE, 2020-2029 (USD MILLION)
TABLE 556 SOUTH KOREA FAT-BASED IN FAT REPLACERS MARKET, BY TYPE, 2020-2029 (USD MILLION)
TABLE 557 SOUTH KOREA FAT REPLACERS MARKET, BY SOURCE, 2020-2029 (USD MILLION)
TABLE 558 SOUTH KOREA FAT REPLACERS MARKET, BY CATEGORY, 2020-2029 (USD MILLION)
TABLE 559 SOUTH KOREA FAT REPLACERS MARKET, BY FORM, 2020-2029 (USD MILLION)
TABLE 560 SOUTH KOREA FAT REPLACERS MARKET, BY APPLICATION, 2020-2029 (USD MILLION)
TABLE 561 SOUTH KOREA BAKERY IN FAT REPLACERS MARKET, BY PRODUCT TYPE, 2020-2029 (USD MILLION)
TABLE 562 SOUTH KOREA BAKERY IN FAT REPLACERS MARKET, BY TYPE, 2020-2029 (USD MILLION)
TABLE 563 SOUTH KOREA DIARY PRODUCTS IN FAT REPLACERS MARKET, BY PRODUCT TYPE, 2020-2029 (USD MILLION)
TABLE 564 SOUTH KOREA YOGURT IN FAT REPLACERS MARKET, BY PRODUCT TYPE, 2020-2029 (USD MILLION)
TABLE 565 SOUTH KOREA MILK IN FAT REPLACERS MARKET, BY PRODUCT TYPE, 2020-2029 (USD MILLION)
TABLE 566 SOUTH KOREA DAIRY PRODUCTS IN FAT REPLACERS MARKET, BY TYPE, 2020-2029 (USD MILLION)
TABLE 567 SOUTH KOREA CONVENIENCE FOOD IN FAT REPLACERS MARKET, BY PRODUCT TYPE, 2020-2029 (USD MILLION)
TABLE 568 SOUTH KOREA CONVENIENCE FOOD IN FAT REPLACERS MARKET, BY TYPE, 2020-2029 (USD MILLION)
TABLE 569 SOUTH KOREA PROCESSED MEAT IN FAT REPLACERS MARKET, BY TYPE, 2020-2029 (USD MILLION)
TABLE 570 SOUTH KOREA CONFECTIONERY IN FAT REPLACERS MARKET, BY PRODUCT TYPE, 2020-2029 (USD MILLION)
TABLE 571 SOUTH KOREA CONFECTIONERY IN FAT REPLACERS MARKET, BY TYPE, 2020-2029 (USD MILLION)
TABLE 572 SOUTH KOREA FUNCTIONAL FOOD IN FAT REPLACERS MARKET, BY TYPE, 2020-2029 (USD MILLION)
TABLE 573 SOUTH KOREA SAUCES, SOUPS, & DRESSINGS IN FAT REPLACERS MARKET, BY TYPE, 2020-2029 (USD MILLION)
TABLE 574 SOUTH KOREA BEVERAGES IN FAT REPLACERS MARKET, BY TYPE, 2020-2029 (USD MILLION)
TABLE 575 SOUTH KOREA OTHERS IN FAT REPLACERS MARKET, BY TYPE, 2020-2029 (USD MILLION)
TABLE 576 MALAYSIA FAT REPLACERS MARKET, BY TYPE, 2020-2029 (USD MILLION)
TABLE 577 MALAYSIA CARBOHYDRATE-BASED IN FAT REPLACERS MARKET, BY TYPE, 2020-2029 (USD MILLION)
TABLE 578 MALAYSIA PROTEIN-BASED IN FAT REPLACERS MARKET, BY TYPE, 2020-2029 (USD MILLION)
TABLE 579 MALAYSIA FAT-BASED IN FAT REPLACERS MARKET, BY TYPE, 2020-2029 (USD MILLION)
TABLE 580 MALAYSIA FAT REPLACERS MARKET, BY SOURCE, 2020-2029 (USD MILLION)
TABLE 581 MALAYSIA FAT REPLACERS MARKET, BY CATEGORY, 2020-2029 (USD MILLION)
TABLE 582 MALAYSIA FAT REPLACERS MARKET, BY FORM, 2020-2029 (USD MILLION)
TABLE 583 MALAYSIA FAT REPLACERS MARKET, BY APPLICATION, 2020-2029 (USD MILLION)
TABLE 584 MALAYSIA BAKERY IN FAT REPLACERS MARKET, BY PRODUCT TYPE, 2020-2029 (USD MILLION)
TABLE 585 MALAYSIA BAKERY IN FAT REPLACERS MARKET, BY TYPE, 2020-2029 (USD MILLION)
TABLE 586 MALAYSIA DIARY PRODUCTS IN FAT REPLACERS MARKET, BY PRODUCT TYPE, 2020-2029 (USD MILLION)
TABLE 587 MALAYSIA YOGURT IN FAT REPLACERS MARKET, BY PRODUCT TYPE, 2020-2029 (USD MILLION)
TABLE 588 MALAYSIA MILK IN FAT REPLACERS MARKET, BY PRODUCT TYPE, 2020-2029 (USD MILLION)
TABLE 589 MALAYSIA DAIRY PRODUCTS IN FAT REPLACERS MARKET, BY TYPE, 2020-2029 (USD MILLION)
TABLE 590 MALAYSIA CONVENIENCE FOOD IN FAT REPLACERS MARKET, BY PRODUCT TYPE, 2020-2029 (USD MILLION)
TABLE 591 MALAYSIA CONVENIENCE FOOD IN FAT REPLACERS MARKET, BY TYPE, 2020-2029 (USD MILLION)
TABLE 592 MALAYSIA PROCESSED MEAT IN FAT REPLACERS MARKET, BY TYPE, 2020-2029 (USD MILLION)
TABLE 593 MALAYSIA CONFECTIONERY IN FAT REPLACERS MARKET, BY PRODUCT TYPE, 2020-2029 (USD MILLION)
TABLE 594 MALAYSIA CONFECTIONERY IN FAT REPLACERS MARKET, BY TYPE, 2020-2029 (USD MILLION)
TABLE 595 MALAYSIA FUNCTIONAL FOOD IN FAT REPLACERS MARKET, BY TYPE, 2020-2029 (USD MILLION)
TABLE 596 MALAYSIA SAUCES, SOUPS, & DRESSINGS IN FAT REPLACERS MARKET, BY TYPE, 2020-2029 (USD MILLION)
TABLE 597 MALAYSIA BEVERAGES IN FAT REPLACERS MARKET, BY TYPE, 2020-2029 (USD MILLION)
TABLE 598 MALAYSIA OTHERS IN FAT REPLACERS MARKET, BY TYPE, 2020-2029 (USD MILLION)
TABLE 599 THAILAND FAT REPLACERS MARKET, BY TYPE, 2020-2029 (USD MILLION)
TABLE 600 THAILAND CARBOHYDRATE-BASED IN FAT REPLACERS MARKET, BY TYPE, 2020-2029 (USD MILLION)
TABLE 601 THAILAND PROTEIN-BASED IN FAT REPLACERS MARKET, BY TYPE, 2020-2029 (USD MILLION)
TABLE 602 THAILAND FAT-BASED IN FAT REPLACERS MARKET, BY TYPE, 2020-2029 (USD MILLION)
TABLE 603 THAILAND FAT REPLACERS MARKET, BY SOURCE, 2020-2029 (USD MILLION)
TABLE 604 THAILAND FAT REPLACERS MARKET, BY CATEGORY, 2020-2029 (USD MILLION)
TABLE 605 THAILAND FAT REPLACERS MARKET, BY FORM, 2020-2029 (USD MILLION)
TABLE 606 THAILAND FAT REPLACERS MARKET, BY APPLICATION, 2020-2029 (USD MILLION)
TABLE 607 THAILAND BAKERY IN FAT REPLACERS MARKET, BY PRODUCT TYPE, 2020-2029 (USD MILLION)
TABLE 608 THAILAND BAKERY IN FAT REPLACERS MARKET, BY TYPE, 2020-2029 (USD MILLION)
TABLE 609 THAILAND DIARY PRODUCTS IN FAT REPLACERS MARKET, BY PRODUCT TYPE, 2020-2029 (USD MILLION)
TABLE 610 THAILAND YOGURT IN FAT REPLACERS MARKET, BY PRODUCT TYPE, 2020-2029 (USD MILLION)
TABLE 611 THAILAND MILK IN FAT REPLACERS MARKET, BY PRODUCT TYPE, 2020-2029 (USD MILLION)
TABLE 612 THAILAND DAIRY PRODUCTS IN FAT REPLACERS MARKET, BY TYPE, 2020-2029 (USD MILLION)
TABLE 613 THAILAND CONVENIENCE FOOD IN FAT REPLACERS MARKET, BY PRODUCT TYPE, 2020-2029 (USD MILLION)
TABLE 614 THAILAND CONVENIENCE FOOD IN FAT REPLACERS MARKET, BY TYPE, 2020-2029 (USD MILLION)
TABLE 615 THAILAND PROCESSED MEAT IN FAT REPLACERS MARKET, BY TYPE, 2020-2029 (USD MILLION)
TABLE 616 THAILAND CONFECTIONERY IN FAT REPLACERS MARKET, BY PRODUCT TYPE, 2020-2029 (USD MILLION)
TABLE 617 THAILAND CONFECTIONERY IN FAT REPLACERS MARKET, BY TYPE, 2020-2029 (USD MILLION)
TABLE 618 THAILAND FUNCTIONAL FOOD IN FAT REPLACERS MARKET, BY TYPE, 2020-2029 (USD MILLION)
TABLE 619 THAILAND SAUCES, SOUPS, & DRESSINGS IN FAT REPLACERS MARKET, BY TYPE, 2020-2029 (USD MILLION)
TABLE 620 THAILAND BEVERAGES IN FAT REPLACERS MARKET, BY TYPE, 2020-2029 (USD MILLION)
TABLE 621 THAILAND OTHERS IN FAT REPLACERS MARKET, BY TYPE, 2020-2029 (USD MILLION)
TABLE 622 PHILIPPINES FAT REPLACERS MARKET, BY TYPE, 2020-2029 (USD MILLION)
TABLE 623 PHILIPPINES CARBOHYDRATE-BASED IN FAT REPLACERS MARKET, BY TYPE, 2020-2029 (USD MILLION)
TABLE 624 PHILIPPINES PROTEIN-BASED IN FAT REPLACERS MARKET, BY TYPE, 2020-2029 (USD MILLION)
TABLE 625 PHILIPPINES FAT-BASED IN FAT REPLACERS MARKET, BY TYPE, 2020-2029 (USD MILLION)
TABLE 626 PHILIPPINES FAT REPLACERS MARKET, BY SOURCE, 2020-2029 (USD MILLION)
TABLE 627 PHILIPPINES FAT REPLACERS MARKET, BY CATEGORY, 2020-2029 (USD MILLION)
TABLE 628 PHILIPPINES FAT REPLACERS MARKET, BY FORM, 2020-2029 (USD MILLION)
TABLE 629 PHILIPPINES FAT REPLACERS MARKET, BY APPLICATION, 2020-2029 (USD MILLION)
TABLE 630 PHILIPPINES BAKERY IN FAT REPLACERS MARKET, BY PRODUCT TYPE, 2020-2029 (USD MILLION)
TABLE 631 PHILIPPINES BAKERY IN FAT REPLACERS MARKET, BY TYPE, 2020-2029 (USD MILLION)
TABLE 632 PHILIPPINES DIARY PRODUCTS IN FAT REPLACERS MARKET, BY PRODUCT TYPE, 2020-2029 (USD MILLION)
TABLE 633 PHILIPPINES YOGURT IN FAT REPLACERS MARKET, BY PRODUCT TYPE, 2020-2029 (USD MILLION)
TABLE 634 PHILIPPINES MILK IN FAT REPLACERS MARKET, BY PRODUCT TYPE, 2020-2029 (USD MILLION)
TABLE 635 PHILIPPINES DAIRY PRODUCTS IN FAT REPLACERS MARKET, BY TYPE, 2020-2029 (USD MILLION)
TABLE 636 PHILIPPINES CONVENIENCE FOOD IN FAT REPLACERS MARKET, BY PRODUCT TYPE, 2020-2029 (USD MILLION)
TABLE 637 PHILIPPINES CONVENIENCE FOOD IN FAT REPLACERS MARKET, BY TYPE, 2020-2029 (USD MILLION)
TABLE 638 PHILIPPINES PROCESSED MEAT IN FAT REPLACERS MARKET, BY TYPE, 2020-2029 (USD MILLION)
TABLE 639 PHILIPPINES CONFECTIONERY IN FAT REPLACERS MARKET, BY PRODUCT TYPE, 2020-2029 (USD MILLION)
TABLE 640 PHILIPPINES CONFECTIONERY IN FAT REPLACERS MARKET, BY TYPE, 2020-2029 (USD MILLION)
TABLE 641 PHILIPPINES FUNCTIONAL FOOD IN FAT REPLACERS MARKET, BY TYPE, 2020-2029 (USD MILLION)
TABLE 642 PHILIPPINES SAUCES, SOUPS, & DRESSINGS IN FAT REPLACERS MARKET, BY TYPE, 2020-2029 (USD MILLION)
TABLE 643 PHILIPPINES BEVERAGES IN FAT REPLACERS MARKET, BY TYPE, 2020-2029 (USD MILLION)
TABLE 644 PHILIPPINES OTHERS IN FAT REPLACERS MARKET, BY TYPE, 2020-2029 (USD MILLION)
TABLE 645 REST OF ASIA-PACIFIC FAT REPLACERS MARKET, BY TYPE, 2020-2029 (USD MILLION)
TABLE 646 SOUTH AMERICA FAT REPLACERS MARKET, BY COUNTRY, 2020-2029 (USD MILLION)
TABLE 647 SOUTH AMERICA FAT REPLACERS MARKET, BY TYPE, 2020-2029 (USD MILLION)
TABLE 648 SOUTH AMERICA CARBOHYDRATE-BASED IN FAT REPLACERS MARKET, BY TYPE, 2020-2029 (USD MILLION)
TABLE 649 SOUTH AMERICA PROTEIN-BASED IN FAT REPLACERS MARKET, BY TYPE, 2020-2029 (USD MILLION)
TABLE 650 SOUTH AMERICA FAT-BASED IN FAT REPLACERS MARKET, BY TYPE, 2020-2029 (USD MILLION)
TABLE 651 SOUTH AMERICA FAT REPLACERS MARKET, BY SOURCE, 2020-2029 (USD MILLION)
TABLE 652 SOUTH AMERICA FAT REPLACERS MARKET, BY CATEGORY, 2020-2029 (USD MILLION)
TABLE 653 SOUTH AMERICA FAT REPLACERS MARKET, BY FORM, 2020-2029 (USD MILLION)
TABLE 654 SOUTH AMERICA FAT REPLACERS MARKET, BY APPLICATION, 2020-2029 (USD MILLION)
TABLE 655 SOUTH AMERICA BAKERY IN FAT REPLACERS MARKET, BY PRODUCT TYPE, 2020-2029 (USD MILLION)
TABLE 656 SOUTH AMERICA BAKERY IN FAT REPLACERS MARKET, BY TYPE, 2020-2029 (USD MILLION)
TABLE 657 SOUTH AMERICA DIARY PRODUCTS IN FAT REPLACERS MARKET, BY PRODUCT TYPE, 2020-2029 (USD MILLION)
TABLE 658 SOUTH AMERICA YOGURT IN FAT REPLACERS MARKET, BY PRODUCT TYPE, 2020-2029 (USD MILLION)
TABLE 659 SOUTH AMERICA MILK IN FAT REPLACERS MARKET, BY PRODUCT TYPE, 2020-2029 (USD MILLION)
TABLE 660 SOUTH AMERICA DAIRY PRODUCTS IN FAT REPLACERS MARKET, BY TYPE, 2020-2029 (USD MILLION)
TABLE 661 SOUTH AMERICA CONVENIENCE FOOD IN FAT REPLACERS MARKET, BY PRODUCT TYPE, 2020-2029 (USD MILLION)
TABLE 662 SOUTH AMERICA CONVENIENCE FOOD IN FAT REPLACERS MARKET, BY TYPE, 2020-2029 (USD MILLION)
TABLE 663 SOUTH AMERICA PROCESSED MEAT IN FAT REPLACERS MARKET, BY TYPE, 2020-2029 (USD MILLION)
TABLE 664 SOUTH AMERICA CONFECTIONERY IN FAT REPLACERS MARKET, BY PRODUCT TYPE, 2020-2029 (USD MILLION)
TABLE 665 SOUTH AMERICA CONFECTIONERY IN FAT REPLACERS MARKET, BY TYPE, 2020-2029 (USD MILLION)
TABLE 666 SOUTH AMERICA FUNCTIONAL FOOD IN FAT REPLACERS MARKET, BY TYPE, 2020-2029 (USD MILLION)
TABLE 667 SOUTH AMERICA SAUCES, SOUPS, & DRESSINGS IN FAT REPLACERS MARKET, BY TYPE, 2020-2029 (USD MILLION)
TABLE 668 SOUTH AMERICA BEVERAGES IN FAT REPLACERS MARKET, BY TYPE, 2020-2029 (USD MILLION)
TABLE 669 SOUTH AMERICA OTHERS IN FAT REPLACERS MARKET, BY TYPE, 2020-2029 (USD MILLION)
TABLE 670 BRAZIL FAT REPLACERS MARKET, BY TYPE, 2020-2029 (USD MILLION)
TABLE 671 BRAZIL CARBOHYDRATE-BASED IN FAT REPLACERS MARKET, BY TYPE, 2020-2029 (USD MILLION)
TABLE 672 BRAZIL PROTEIN-BASED IN FAT REPLACERS MARKET, BY TYPE, 2020-2029 (USD MILLION)
TABLE 673 BRAZIL FAT-BASED IN FAT REPLACERS MARKET, BY TYPE, 2020-2029 (USD MILLION)
TABLE 674 BRAZIL FAT REPLACERS MARKET, BY SOURCE, 2020-2029 (USD MILLION)
TABLE 675 BRAZIL FAT REPLACERS MARKET, BY CATEGORY, 2020-2029 (USD MILLION)
TABLE 676 BRAZIL FAT REPLACERS MARKET, BY FORM, 2020-2029 (USD MILLION)
TABLE 677 BRAZIL FAT REPLACERS MARKET, BY APPLICATION, 2020-2029 (USD MILLION)
TABLE 678 BRAZIL BAKERY IN FAT REPLACERS MARKET, BY PRODUCT TYPE, 2020-2029 (USD MILLION)
TABLE 679 BRAZIL BAKERY IN FAT REPLACERS MARKET, BY TYPE, 2020-2029 (USD MILLION)
TABLE 680 BRAZIL DIARY PRODUCTS IN FAT REPLACERS MARKET, BY PRODUCT TYPE, 2020-2029 (USD MILLION)
TABLE 681 BRAZIL YOGURT IN FAT REPLACERS MARKET, BY PRODUCT TYPE, 2020-2029 (USD MILLION)
TABLE 682 BRAZIL MILK IN FAT REPLACERS MARKET, BY PRODUCT TYPE, 2020-2029 (USD MILLION)
TABLE 683 BRAZIL DAIRY PRODUCTS IN FAT REPLACERS MARKET, BY TYPE, 2020-2029 (USD MILLION)
TABLE 684 BRAZIL CONVENIENCE FOOD IN FAT REPLACERS MARKET, BY PRODUCT TYPE, 2020-2029 (USD MILLION)
TABLE 685 BRAZIL CONVENIENCE FOOD IN FAT REPLACERS MARKET, BY TYPE, 2020-2029 (USD MILLION)
TABLE 686 BRAZIL PROCESSED MEAT IN FAT REPLACERS MARKET, BY TYPE, 2020-2029 (USD MILLION)
TABLE 687 BRAZIL CONFECTIONERY IN FAT REPLACERS MARKET, BY PRODUCT TYPE, 2020-2029 (USD MILLION)
TABLE 688 BRAZIL CONFECTIONERY IN FAT REPLACERS MARKET, BY TYPE, 2020-2029 (USD MILLION)
TABLE 689 BRAZIL FUNCTIONAL FOOD IN FAT REPLACERS MARKET, BY TYPE, 2020-2029 (USD MILLION)
TABLE 690 BRAZIL SAUCES, SOUPS, & DRESSINGS IN FAT REPLACERS MARKET, BY TYPE, 2020-2029 (USD MILLION)
TABLE 691 BRAZIL BEVERAGES IN FAT REPLACERS MARKET, BY TYPE, 2020-2029 (USD MILLION)
TABLE 692 BRAZIL OTHERS IN FAT REPLACERS MARKET, BY TYPE, 2020-2029 (USD MILLION)
TABLE 693 ARGENTINA FAT REPLACERS MARKET, BY TYPE, 2020-2029 (USD MILLION)
TABLE 694 ARGENTINA CARBOHYDRATE-BASED IN FAT REPLACERS MARKET, BY TYPE, 2020-2029 (USD MILLION)
TABLE 695 ARGENTINA PROTEIN-BASED IN FAT REPLACERS MARKET, BY TYPE, 2020-2029 (USD MILLION)
TABLE 696 ARGENTINA FAT-BASED IN FAT REPLACERS MARKET, BY TYPE, 2020-2029 (USD MILLION)
TABLE 697 ARGENTINA FAT REPLACERS MARKET, BY SOURCE, 2020-2029 (USD MILLION)
TABLE 698 ARGENTINA FAT REPLACERS MARKET, BY CATEGORY, 2020-2029 (USD MILLION)
TABLE 699 ARGENTINA FAT REPLACERS MARKET, BY FORM, 2020-2029 (USD MILLION)
TABLE 700 ARGENTINA FAT REPLACERS MARKET, BY APPLICATION, 2020-2029 (USD MILLION)
TABLE 701 ARGENTINA BAKERY IN FAT REPLACERS MARKET, BY PRODUCT TYPE, 2020-2029 (USD MILLION)
TABLE 702 ARGENTINA BAKERY IN FAT REPLACERS MARKET, BY TYPE, 2020-2029 (USD MILLION)
TABLE 703 ARGENTINA DIARY PRODUCTS IN FAT REPLACERS MARKET, BY PRODUCT TYPE, 2020-2029 (USD MILLION)
TABLE 704 ARGENTINA YOGURT IN FAT REPLACERS MARKET, BY PRODUCT TYPE, 2020-2029 (USD MILLION)
TABLE 705 ARGENTINA MILK IN FAT REPLACERS MARKET, BY PRODUCT TYPE, 2020-2029 (USD MILLION)
TABLE 706 ARGENTINA DAIRY PRODUCTS IN FAT REPLACERS MARKET, BY TYPE, 2020-2029 (USD MILLION)
TABLE 707 ARGENTINA CONVENIENCE FOOD IN FAT REPLACERS MARKET, BY PRODUCT TYPE, 2020-2029 (USD MILLION)
TABLE 708 ARGENTINA CONVENIENCE FOOD IN FAT REPLACERS MARKET, BY TYPE, 2020-2029 (USD MILLION)
TABLE 709 ARGENTINA PROCESSED MEAT IN FAT REPLACERS MARKET, BY TYPE, 2020-2029 (USD MILLION)
TABLE 710 ARGENTINA CONFECTIONERY IN FAT REPLACERS MARKET, BY PRODUCT TYPE, 2020-2029 (USD MILLION)
TABLE 711 ARGENTINA CONFECTIONERY IN FAT REPLACERS MARKET, BY TYPE, 2020-2029 (USD MILLION)
TABLE 712 ARGENTINA FUNCTIONAL FOOD IN FAT REPLACERS MARKET, BY TYPE, 2020-2029 (USD MILLION)
TABLE 713 ARGENTINA SAUCES, SOUPS, & DRESSINGS IN FAT REPLACERS MARKET, BY TYPE, 2020-2029 (USD MILLION)
TABLE 714 ARGENTINA BEVERAGES IN FAT REPLACERS MARKET, BY TYPE, 2020-2029 (USD MILLION)
TABLE 715 ARGENTINA OTHERS IN FAT REPLACERS MARKET, BY TYPE, 2020-2029 (USD MILLION)
TABLE 716 ARGENTINA FAT REPLACERS MARKET, BY TYPE, 2020-2029 (USD MILLION)
TABLE 717 MIDDLE EAST AND AFRICA FAT REPLACERS MARKET, BY COUNTRY, 2020-2029 (USD MILLION)
TABLE 718 MIDDLE EAST AND AFRICA FAT REPLACERS MARKET, BY TYPE, 2020-2029 (USD MILLION)
TABLE 719 MIDDLE EAST AND AFRICA CARBOHYDRATE-BASED IN FAT REPLACERS MARKET, BY TYPE, 2020-2029 (USD MILLION)
TABLE 720 MIDDLE EAST AND AFRICA PROTEIN-BASED IN FAT REPLACERS MARKET, BY TYPE, 2020-2029 (USD MILLION)
TABLE 721 MIDDLE EAST AND AFRICA FAT-BASED IN FAT REPLACERS MARKET, BY TYPE, 2020-2029 (USD MILLION)
TABLE 722 MIDDLE EAST AND AFRICA REPLACERS MARKET, BY SOURCE, 2020-2029 (USD MILLION)
TABLE 723 MIDDLE EAST AND AFRICA FAT REPLACERS MARKET, BY CATEGORY, 2020-2029 (USD MILLION)
TABLE 724 MIDDLE EAST AND AFRICA FAT REPLACERS MARKET, BY FORM, 2020-2029 (USD MILLION)
TABLE 725 MIDDLE EAST AND AFRICA FAT REPLACERS MARKET, BY APPLICATION, 2020-2029 (USD MILLION)
TABLE 726 MIDDLE EAST AND AFRICA BAKERY IN FAT REPLACERS MARKET, BY PRODUCT TYPE, 2020-2029 (USD MILLION)
TABLE 727 MIDDLE EAST AND AFRICA BAKERY IN FAT REPLACERS MARKET, BY TYPE, 2020-2029 (USD MILLION)
TABLE 728 MIDDLE EAST AND AFRICA DAIRY PRODUCTS IN FAT REPLACERS MARKET, BY PRODUCT TYPE, 2020-2029 (USD MILLION)
TABLE 729 MIDDLE EAST AND AFRICA YOGURT IN FAT REPLACERS MARKET, BY PRODUCT TYPE, 2020-2029 (USD MILLION)
TABLE 730 MIDDLE EAST AND AFRICA MILK IN FAT REPLACERS MARKET, BY PRODUCT TYPE, 2020-2029 (USD MILLION)
TABLE 731 MIDDLE EAST AND AFRICA DAIRY PRODUCTS IN FAT REPLACERS MARKET, BY TYPE, 2020-2029 (USD MILLION)
TABLE 732 MIDDLE EAST AND AFRICA CONVENIENCE FOOD IN FAT REPLACERS MARKET, BY PRODUCT TYPE, 2020-2029 (USD MILLION)
TABLE 733 MIDDLE EAST AND AFRICA CONVENIENCE FOOD IN FAT REPLACERS MARKET, BY TYPE, 2020-2029 (USD MILLION)
TABLE 734 MIDDLE EAST AND AFRICA PROCESSED MEAT IN FAT REPLACERS MARKET, BY TYPE, 2020-2029 (USD MILLION)
TABLE 735 MIDDLE EAST AND AFRICA CONFECTIONERY IN FAT REPLACERS MARKET, BY PRODUCT TYPE, 2020-2029 (USD MILLION)
TABLE 736 MIDDLE EAST AND AFRICA CONFECTIONERY IN FAT REPLACERS MARKET, BY TYPE, 2020-2029 (USD MILLION)
TABLE 737 MIDDLE EAST AND AFRICA FUNCTIONAL FOOD IN FAT REPLACERS MARKET, BY TYPE, 2020-2029 (USD MILLION)
TABLE 738 MIDDLE EAST AND AFRICA SAUCES, SOUPS, & DRESSINGS IN FAT REPLACERS MARKET, BY TYPE, 2020-2029 (USD MILLION)
TABLE 739 MIDDLE EAST AND AFRICA BEVERAGES IN FAT REPLACERS MARKET, BY TYPE, 2020-2029 (USD MILLION)
TABLE 740 MIDDLE EAST AND AFRICA OTHERS IN FAT REPLACERS MARKET, BY TYPE, 2020-2029 (USD MILLION)
TABLE 741 SOUTH AFRICA FAT REPLACERS MARKET, BY TYPE, 2020-2029 (USD MILLION)
TABLE 742 SOUTH AFRICA CARBOHYDRATE-BASED IN FAT REPLACERS MARKET, BY TYPE, 2020-2029 (USD MILLION)
TABLE 743 SOUTH AFRICA PROTEIN-BASED IN FAT REPLACERS MARKET, BY TYPE, 2020-2029 (USD MILLION)
TABLE 744 SOUTH AFRICA FAT-BASED IN FAT REPLACERS MARKET, BY TYPE, 2020-2029 (USD MILLION)
TABLE 745 SOUTH AFRICA REPLACERS MARKET, BY SOURCE, 2020-2029 (USD MILLION)
TABLE 746 SOUTH AFRICA FAT REPLACERS MARKET, BY CATEGORY, 2020-2029 (USD MILLION)
TABLE 747 SOUTH AFRICA FAT REPLACERS MARKET, BY FORM, 2020-2029 (USD MILLION)
TABLE 748 SOUTH AFRICA FAT REPLACERS MARKET, BY APPLICATION, 2020-2029 (USD MILLION)
TABLE 749 SOUTH AFRICA BAKERY IN FAT REPLACERS MARKET, BY PRODUCT TYPE, 2020-2029 (USD MILLION)
TABLE 750 SOUTH AFRICA BAKERY IN FAT REPLACERS MARKET, BY TYPE, 2020-2029 (USD MILLION)
TABLE 751 SOUTH AFRICA DAIRY PRODUCTS IN FAT REPLACERS MARKET, BY PRODUCT TYPE, 2020-2029 (USD MILLION)
TABLE 752 SOUTH AFRICA YOGURT IN FAT REPLACERS MARKET, BY PRODUCT TYPE, 2020-2029 (USD MILLION)
TABLE 753 SOUTH AFRICA MILK IN FAT REPLACERS MARKET, BY PRODUCT TYPE, 2020-2029 (USD MILLION)
TABLE 754 SOUTH AFRICA DAIRY PRODUCTS IN FAT REPLACERS MARKET, BY TYPE, 2020-2029 (USD MILLION)
TABLE 755 SOUTH AFRICA CONVENIENCE FOOD IN FAT REPLACERS MARKET, BY PRODUCT TYPE, 2020-2029 (USD MILLION)
TABLE 756 SOUTH AFRICA CONVENIENCE FOOD IN FAT REPLACERS MARKET, BY TYPE, 2020-2029 (USD MILLION)
TABLE 757 SOUTH AFRICA PROCESSED MEAT IN FAT REPLACERS MARKET, BY TYPE, 2020-2029 (USD MILLION)
TABLE 758 SOUTH AFRICA CONFECTIONERY IN FAT REPLACERS MARKET, BY PRODUCT TYPE, 2020-2029 (USD MILLION)
TABLE 759 SOUTH AFRICA CONFECTIONERY IN FAT REPLACERS MARKET, BY TYPE, 2020-2029 (USD MILLION)
TABLE 760 SOUTH AFRICA FUNCTIONAL FOOD IN FAT REPLACERS MARKET, BY TYPE, 2020-2029 (USD MILLION)
TABLE 761 SOUTH AFRICA SAUCES, SOUPS, & DRESSINGS IN FAT REPLACERS MARKET, BY TYPE, 2020-2029 (USD MILLION)
TABLE 762 SOUTH AFRICA BEVERAGES IN FAT REPLACERS MARKET, BY TYPE, 2020-2029 (USD MILLION)
TABLE 763 SOUTH AFRICA OTHERS IN FAT REPLACERS MARKET, BY TYPE, 2020-2029 (USD MILLION)
TABLE 764 SAUDI ARABIA FAT REPLACERS MARKET, BY TYPE, 2020-2029 (USD MILLION)
TABLE 765 SAUDI ARABIA CARBOHYDRATE-BASED IN FAT REPLACERS MARKET, BY TYPE, 2020-2029 (USD MILLION)
TABLE 766 SAUDI ARABIA PROTEIN-BASED IN FAT REPLACERS MARKET, BY TYPE, 2020-2029 (USD MILLION)
TABLE 767 SAUDI ARABIA FAT-BASED IN FAT REPLACERS MARKET, BY TYPE, 2020-2029 (USD MILLION)
TABLE 768 SAUDI ARABIA REPLACERS MARKET, BY SOURCE, 2020-2029 (USD MILLION)
TABLE 769 SAUDI ARABIA FAT REPLACERS MARKET, BY CATEGORY, 2020-2029 (USD MILLION)
TABLE 770 SAUDI ARABIA FAT REPLACERS MARKET, BY FORM, 2020-2029 (USD MILLION)
TABLE 771 SAUDI ARABIA FAT REPLACERS MARKET, BY APPLICATION, 2020-2029 (USD MILLION)
TABLE 772 SAUDI ARABIA BAKERY IN FAT REPLACERS MARKET, BY PRODUCT TYPE, 2020-2029 (USD MILLION)
TABLE 773 SAUDI ARABIA BAKERY IN FAT REPLACERS MARKET, BY TYPE, 2020-2029 (USD MILLION)
TABLE 774 SAUDI ARABIA DAIRY PRODUCTS IN FAT REPLACERS MARKET, BY PRODUCT TYPE, 2020-2029 (USD MILLION)
TABLE 775 SAUDI ARABIA YOGURT IN FAT REPLACERS MARKET, BY PRODUCT TYPE, 2020-2029 (USD MILLION)
TABLE 776 SAUDI ARABIA MILK IN FAT REPLACERS MARKET, BY PRODUCT TYPE, 2020-2029 (USD MILLION)
TABLE 777 SAUDI ARABIA DAIRY PRODUCTS IN FAT REPLACERS MARKET, BY TYPE, 2020-2029 (USD MILLION)
TABLE 778 SAUDI ARABIA CONVENIENCE FOOD IN FAT REPLACERS MARKET, BY PRODUCT TYPE, 2020-2029 (USD MILLION)
TABLE 779 SAUDI ARABIA CONVENIENCE FOOD IN FAT REPLACERS MARKET, BY TYPE, 2020-2029 (USD MILLION)
TABLE 780 SAUDI ARABIA PROCESSED MEAT IN FAT REPLACERS MARKET, BY TYPE, 2020-2029 (USD MILLION)
TABLE 781 SAUDI ARABIA CONFECTIONERY IN FAT REPLACERS MARKET, BY PRODUCT TYPE, 2020-2029 (USD MILLION)
TABLE 782 SAUDI ARABIA CONFECTIONERY IN FAT REPLACERS MARKET, BY TYPE, 2020-2029 (USD MILLION)
TABLE 783 SAUDI ARABIA FUNCTIONAL FOOD IN FAT REPLACERS MARKET, BY TYPE, 2020-2029 (USD MILLION)
TABLE 784 SAUDI ARABIA SAUCES, SOUPS, & DRESSINGS IN FAT REPLACERS MARKET, BY TYPE, 2020-2029 (USD MILLION)
TABLE 785 SAUDI ARABIA BEVERAGES IN FAT REPLACERS MARKET, BY TYPE, 2020-2029 (USD MILLION)
TABLE 786 SAUDI ARABIA OTHERS IN FAT REPLACERS MARKET, BY TYPE, 2020-2029 (USD MILLION)
TABLE 787 U.A.E. FAT REPLACERS MARKET, BY TYPE, 2020-2029 (USD MILLION)
TABLE 788 U.A.E. CARBOHYDRATE-BASED IN FAT REPLACERS MARKET, BY TYPE, 2020-2029 (USD MILLION)
TABLE 789 U.A.E. PROTEIN-BASED IN FAT REPLACERS MARKET, BY TYPE, 2020-2029 (USD MILLION)
TABLE 790 U.A.E. FAT-BASED IN FAT REPLACERS MARKET, BY TYPE, 2020-2029 (USD MILLION)
TABLE 791 U.A.E. REPLACERS MARKET, BY SOURCE, 2020-2029 (USD MILLION)
TABLE 792 U.A.E. FAT REPLACERS MARKET, BY CATEGORY, 2020-2029 (USD MILLION)
TABLE 793 U.A.E. FAT REPLACERS MARKET, BY FORM, 2020-2029 (USD MILLION)
TABLE 794 U.A.E. FAT REPLACERS MARKET, BY APPLICATION, 2020-2029 (USD MILLION)
TABLE 795 U.A.E. BAKERY IN FAT REPLACERS MARKET, BY PRODUCT TYPE, 2020-2029 (USD MILLION)
TABLE 796 U.A.E. BAKERY IN FAT REPLACERS MARKET, BY TYPE, 2020-2029 (USD MILLION)
TABLE 797 U.A.E. DAIRY PRODUCTS IN FAT REPLACERS MARKET, BY PRODUCT TYPE, 2020-2029 (USD MILLION)
TABLE 798 U.A.E. YOGURT IN FAT REPLACERS MARKET, BY PRODUCT TYPE, 2020-2029 (USD MILLION)
TABLE 799 U.A.E. MILK IN FAT REPLACERS MARKET, BY PRODUCT TYPE, 2020-2029 (USD MILLION)
TABLE 800 U.A.E. DAIRY PRODUCTS IN FAT REPLACERS MARKET, BY TYPE, 2020-2029 (USD MILLION)
TABLE 801 U.A.E. CONVENIENCE FOOD IN FAT REPLACERS MARKET, BY PRODUCT TYPE, 2020-2029 (USD MILLION)
TABLE 802 U.A.E. CONVENIENCE FOOD IN FAT REPLACERS MARKET, BY TYPE, 2020-2029 (USD MILLION)
TABLE 803 U.A.E. PROCESSED MEAT IN FAT REPLACERS MARKET, BY TYPE, 2020-2029 (USD MILLION)
TABLE 804 U.A.E. CONFECTIONERY IN FAT REPLACERS MARKET, BY PRODUCT TYPE, 2020-2029 (USD MILLION)
TABLE 805 U.A.E. CONFECTIONERY IN FAT REPLACERS MARKET, BY TYPE, 2020-2029 (USD MILLION)
TABLE 806 U.A.E. FUNCTIONAL FOOD IN FAT REPLACERS MARKET, BY TYPE, 2020-2029 (USD MILLION)
TABLE 807 U.A.E. SAUCES, SOUPS, & DRESSINGS IN FAT REPLACERS MARKET, BY TYPE, 2020-2029 (USD MILLION)
TABLE 808 U.A.E. BEVERAGES IN FAT REPLACERS MARKET, BY TYPE, 2020-2029 (USD MILLION)
TABLE 809 U.A.E. OTHERS IN FAT REPLACERS MARKET, BY TYPE, 2020-2029 (USD MILLION)
TABLE 810 KUWAIT FAT REPLACERS MARKET, BY TYPE, 2020-2029 (USD MILLION)
TABLE 811 KUWAIT CARBOHYDRATE-BASED IN FAT REPLACERS MARKET, BY TYPE, 2020-2029 (USD MILLION)
TABLE 812 KUWAIT PROTEIN-BASED IN FAT REPLACERS MARKET, BY TYPE, 2020-2029 (USD MILLION)
TABLE 813 KUWAIT FAT-BASED IN FAT REPLACERS MARKET, BY TYPE, 2020-2029 (USD MILLION)
TABLE 814 KUWAIT REPLACERS MARKET, BY SOURCE, 2020-2029 (USD MILLION)
TABLE 815 KUWAIT FAT REPLACERS MARKET, BY CATEGORY, 2020-2029 (USD MILLION)
TABLE 816 KUWAIT FAT REPLACERS MARKET, BY FORM, 2020-2029 (USD MILLION)
TABLE 817 KUWAIT FAT REPLACERS MARKET, BY APPLICATION, 2020-2029 (USD MILLION)
TABLE 818 KUWAIT BAKERY IN FAT REPLACERS MARKET, BY PRODUCT TYPE, 2020-2029 (USD MILLION)
TABLE 819 KUWAIT BAKERY IN FAT REPLACERS MARKET, BY TYPE, 2020-2029 (USD MILLION)
TABLE 820 KUWAIT DAIRY PRODUCTS IN FAT REPLACERS MARKET, BY PRODUCT TYPE, 2020-2029 (USD MILLION)
TABLE 821 KUWAIT YOGURT IN FAT REPLACERS MARKET, BY PRODUCT TYPE, 2020-2029 (USD MILLION)
TABLE 822 KUWAIT MILK IN FAT REPLACERS MARKET, BY PRODUCT TYPE, 2020-2029 (USD MILLION)
TABLE 823 KUWAIT DAIRY PRODUCTS IN FAT REPLACERS MARKET, BY TYPE, 2020-2029 (USD MILLION)
TABLE 824 KUWAIT CONVENIENCE FOOD IN FAT REPLACERS MARKET, BY PRODUCT TYPE, 2020-2029 (USD MILLION)
TABLE 825 KUWAIT CONVENIENCE FOOD IN FAT REPLACERS MARKET, BY TYPE, 2020-2029 (USD MILLION)
TABLE 826 KUWAIT PROCESSED MEAT IN FAT REPLACERS MARKET, BY TYPE, 2020-2029 (USD MILLION)
TABLE 827 KUWAIT CONFECTIONERY IN FAT REPLACERS MARKET, BY PRODUCT TYPE, 2020-2029 (USD MILLION)
TABLE 828 KUWAIT CONFECTIONERY IN FAT REPLACERS MARKET, BY TYPE, 2020-2029 (USD MILLION)
TABLE 829 KUWAIT FUNCTIONAL FOOD IN FAT REPLACERS MARKET, BY TYPE, 2020-2029 (USD MILLION)
TABLE 830 KUWAIT SAUCES, SOUPS, & DRESSINGS IN FAT REPLACERS MARKET, BY TYPE, 2020-2029 (USD MILLION)
TABLE 831 KUWAIT BEVERAGES IN FAT REPLACERS MARKET, BY TYPE, 2020-2029 (USD MILLION)
TABLE 832 KUWAIT OTHERS IN FAT REPLACERS MARKET, BY TYPE, 2020-2029 (USD MILLION)
TABLE 833 REST OF MIDDLE EAST AND AFRICA FAT REPLACERS MARKET, BY TYPE, 2020-2029 (USD MILLION)
Liste des figures
FIGURE 1 GLOBAL FAT REPLACERS MARKET: SEGMENTATION
FIGURE 2 GLOBAL FAT REPLACERS MARKET: DATA TRIANGULATION
FIGURE 3 GLOBAL FAT REPLACERS MARKET: DROC ANALYSIS
FIGURE 4 GLOBAL FAT REPLACERS MARKET: GLOBAL VS REGIONAL ANALYSIS
FIGURE 5 GLOBAL FAT REPLACERS MARKET: COMPANY RESEARCH ANALYSIS
FIGURE 6 GLOBAL FAT REPLACERS MARKET: INTERVIEW DEMOGRAPHICS
FIGURE 7 GLOBAL FAT REPLACERS MARKET: DBMR MARKET POSITION GRID
FIGURE 8 GLOBAL FAT REPLACERS MARKET: VENDOR SHARE ANALYSIS
FIGURE 9 GLOBAL FAT REPLACERS MARKET: SEGMENTATION
FIGURE 10 NORTH AMERICA REGION IS EXPECTED TO DOMINATE THE GLOBAL FAT REPLACERS MARKET AND GROWING WITH THE HIGHEST CAGR IN THE FORECAST PERIOD OF 2022 TO 2029
FIGURE 11 INCREASING AWARENESS AMONG PEOPLE ABOUT EXCESSIVE CONSUMPTION OF FAT IS EXPECTED TO DRIVE THE GROWTH OF THE GLOBAL FAT REPLACERS MARKET IN THE FORECAST PERIOD OF 2022 TO 2029
FIGURE 12 CARBOHYDRATE-BASED IN PRODUCT SEGMENT IS EXPECTED TO ACCOUNT FOR THE LARGEST SHARE OF THE GLOBAL FAT REPLACERS MARKET IN 2022 & 2029
FIGURE 13 NORTH AMERICA IS THE FASTEST-GROWING MARKET FOR FAT REPLACERS MANUFACTURERS IN THE FORECAST PERIOD OF 2022 TO 2029
FIGURE 14 DRIVERS, RESTRAINTS, OPPORTUNITIES, AND CHALLENGE OF GLOBAL FAT REPLACERS MARKET
FIGURE 15 MAJOR SOURCES OF FAT IN U.S. DIET
FIGURE 16 GLOBAL FAT REPLACERS MARKET: BY TYPE, 2021
FIGURE 17 GLOBAL FAT REPLACERS MARKET: BY SOURCE, 2021
FIGURE 18 GLOBAL FAT REPLACERS MARKET: BY CATEGORY, 2021
FIGURE 19 GLOBAL FAT REPLACERS MARKET, BY FORM, 2021
FIGURE 20 GLOBAL FAT REPLACERS MARKET: BY APPLICATION, 2021
FIGURE 21 GLOBAL FAT REPLACERS MARKET: SNAPSHOT (2021)
FIGURE 22 GLOBAL FAT REPLACERS MARKET: BY REGION (2021)
FIGURE 23 GLOBAL FAT REPLACERS MARKET: BY REGION (2022 & 2029)
FIGURE 24 GLOBAL FAT REPLACERS MARKET: BY REGION (2021 & 2029)
FIGURE 25 GLOBAL FAT REPLACERS MARKET: BY TYPE (2022-2029)
FIGURE 26 NORTH AMERICA FAT REPLACERS MARKET: SNAPSHOT (2021)
FIGURE 27 NORTH AMERICA FAT REPLACERS MARKET: BY COUNTRY (2021)
FIGURE 28 NORTH AMERICA FAT REPLACERS MARKET: BY COUNTRY (2022 & 2029)
FIGURE 29 NORTH AMERICA FAT REPLACERS MARKET: BY COUNTRY (2021 & 2029)
FIGURE 30 NORTH AMERICA FAT REPLACERS MARKET: BY TYPE (2022 & 2029)
FIGURE 31 EUROPE FAT REPLACERS MARKET: SNAPSHOT (2021)
FIGURE 32 EUROPE FAT REPLACERS MARKET: BY COUNTRY (2021)
FIGURE 33 EUROPE FAT REPLACERS MARKET: BY COUNTRY (2022 & 2029)
FIGURE 34 EUROPE FAT REPLACERS MARKET: BY COUNTRY (2021 & 2029)
FIGURE 35 EUROPE FAT REPLACERS MARKET: BY TYPE (2022 & 2029)
FIGURE 36 ASIA-PACIFIC FAT REPLACERS MARKET: SNAPSHOT (2021)
FIGURE 37 ASIA-PACIFIC FAT REPLACERS MARKET: BY COUNTRY (2021)
FIGURE 38 ASIA-PACIFIC FAT REPLACERS MARKET: BY COUNTRY (2022 & 2029)
FIGURE 39 ASIA-PACIFIC FAT EPLACERS MARKET: BY COUNTRY (2021 & 2029)
FIGURE 40 ASIA-PACIFIC FAT REPLACERS MARKET: BY TYPE (2022 & 2029)
FIGURE 41 SOUTH AMERICA FAT REPLACERS MARKET: SNAPSHOT (2021)
FIGURE 42 SOUTH AMERICA FAT REPLACERS MARKET: BY COUNTRY (2021)
FIGURE 43 SOUTH AMERICA FAT REPLACERS MARKET: BY COUNTRY (2022 & 2029)
FIGURE 44 SOUTH AMERICA FAT REPLACERS MARKET: BY COUNTRY (2021 & 2029)
FIGURE 45 SOUTH AMERICA FAT REPLACERS MARKET: BY TYPE (2022 & 2029)
FIGURE 46 MIDDLE EAST AND AFRICA FAT REPLACERS MARKET: SNAPSHOT (2021)
FIGURE 47 MIDDLE EAST AND AFRICA FAT REPLACERS MARKET: BY COUNTRY (2021)
FIGURE 48 MIDDLE EAST AND AFRICA FAT REPLACERS MARKET: BY COUNTRY (2022 & 2029)
FIGURE 49 MIDDLE EAST AND AFRICA FAT REPLACERS MARKET: BY COUNTRY (2021 & 2029)
FIGURE 50 MIDDLE EAST AND AFRICA FAT REPLACERS MARKET: BY TYPE (2022 & 2029)
FIGURE 51 GLOBAL FAT REPLACERS MARKET: COMPANY SHARE 2021 (%)
FIGURE 52 NORTH AMERICA FAT REPLACERS MARKET: COMPANY SHARE 2021 (%)
FIGURE 53 EUROPE FAT REPLACERS MARKET: COMPANY SHARE 2021 (%)
FIGURE 54 ASIA-PACIFIC FAT REPLACERS MARKET: COMPANY SHARE 2021 (%)
Méthodologie de recherche
La collecte de données et l'analyse de l'année de base sont effectuées à l'aide de modules de collecte de données avec des échantillons de grande taille. L'étape consiste à obtenir des informations sur le marché ou des données connexes via diverses sources et stratégies. Elle comprend l'examen et la planification à l'avance de toutes les données acquises dans le passé. Elle englobe également l'examen des incohérences d'informations observées dans différentes sources d'informations. Les données de marché sont analysées et estimées à l'aide de modèles statistiques et cohérents de marché. De plus, l'analyse des parts de marché et l'analyse des tendances clés sont les principaux facteurs de succès du rapport de marché. Pour en savoir plus, veuillez demander un appel d'analyste ou déposer votre demande.
La méthodologie de recherche clé utilisée par l'équipe de recherche DBMR est la triangulation des données qui implique l'exploration de données, l'analyse de l'impact des variables de données sur le marché et la validation primaire (expert du secteur). Les modèles de données incluent la grille de positionnement des fournisseurs, l'analyse de la chronologie du marché, l'aperçu et le guide du marché, la grille de positionnement des entreprises, l'analyse des brevets, l'analyse des prix, l'analyse des parts de marché des entreprises, les normes de mesure, l'analyse globale par rapport à l'analyse régionale et des parts des fournisseurs. Pour en savoir plus sur la méthodologie de recherche, envoyez une demande pour parler à nos experts du secteur.
Personnalisation disponible
Data Bridge Market Research est un leader de la recherche formative avancée. Nous sommes fiers de fournir à nos clients existants et nouveaux des données et des analyses qui correspondent à leurs objectifs. Le rapport peut être personnalisé pour inclure une analyse des tendances des prix des marques cibles, une compréhension du marché pour d'autres pays (demandez la liste des pays), des données sur les résultats des essais cliniques, une revue de la littérature, une analyse du marché des produits remis à neuf et de la base de produits. L'analyse du marché des concurrents cibles peut être analysée à partir d'une analyse basée sur la technologie jusqu'à des stratégies de portefeuille de marché. Nous pouvons ajouter autant de concurrents que vous le souhaitez, dans le format et le style de données que vous recherchez. Notre équipe d'analystes peut également vous fournir des données sous forme de fichiers Excel bruts, de tableaux croisés dynamiques (Fact book) ou peut vous aider à créer des présentations à partir des ensembles de données disponibles dans le rapport.

