Australia And New Zealand Concrete Admixture Market
Taille du marché en milliards USD
TCAC :
% 
 USD
339,203.34 Billion
USD
483,271.85 Billion
2022
2030
USD
339,203.34 Billion
USD
483,271.85 Billion
2022
2030
| 2023 –2030 | |
| USD 339,203.34 Billion | |
| USD 483,271.85 Billion | |
|
|
|
Marché des adjuvants pour béton en Australie et en Nouvelle-Zélande, par produit (réducteurs d'eau, superplastifiants, retardateurs, adjuvants spéciaux, accélérateurs et entraîneurs d'air), application (résidentielle, infrastructure et commerciale) - Tendances et prévisions de l'industrie jusqu'en 2030.
Analyse et taille du marché des adjuvants pour béton en Australie et en Nouvelle-Zélande
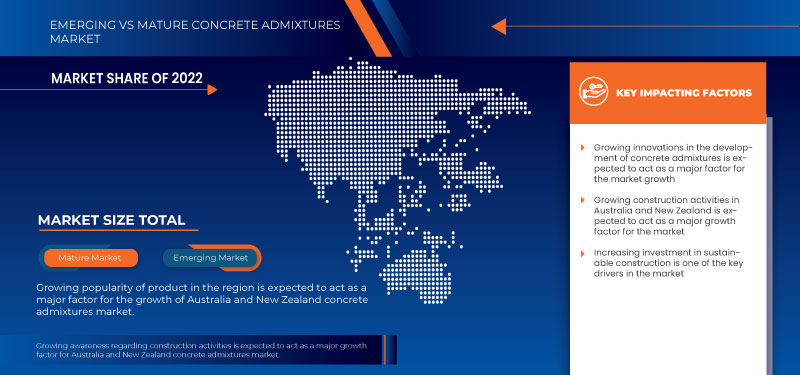
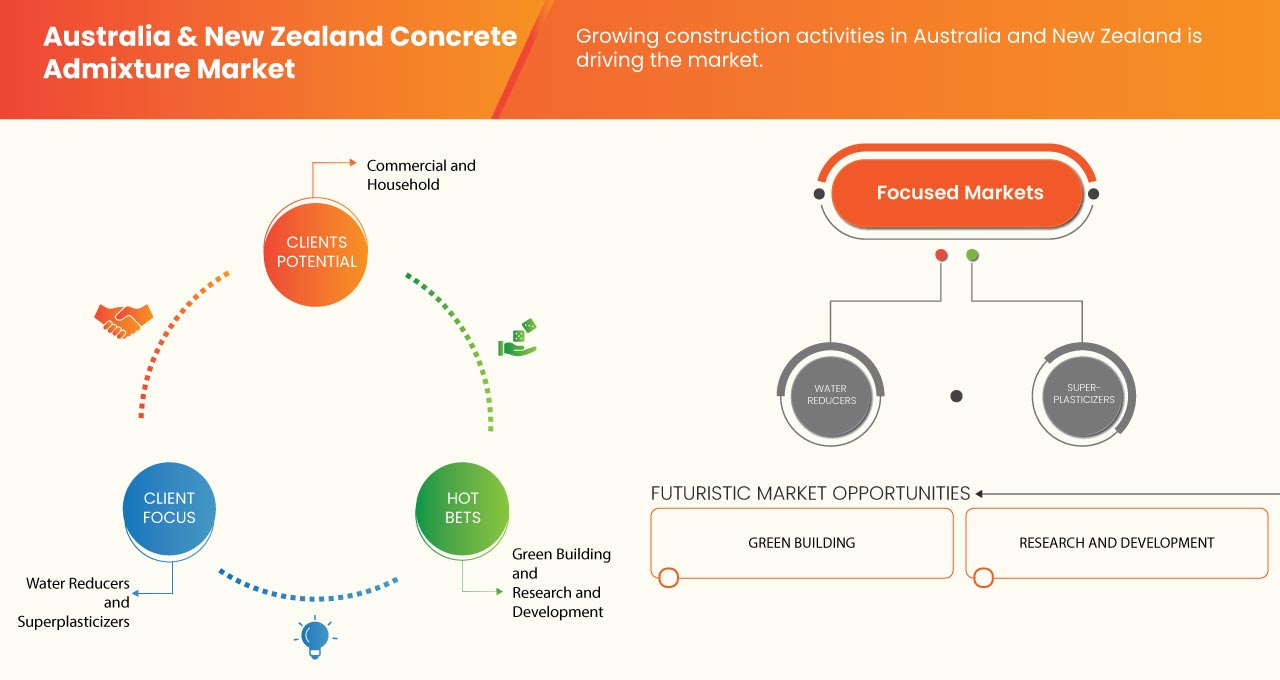
Le marché australien et néo-zélandais des adjuvants pour béton devrait atteindre 483 271,85 milliers USD d'ici 2030, contre 339 203,34 milliers USD en 2022, avec un TCAC substantiel de 4,6 % au cours de la période de prévision de 2023 à 2030. Le principal facteur à l'origine de la croissance du marché des adjuvants pour béton est la croissance des activités de construction en Australie et en Nouvelle-Zélande.
Le marché des adjuvants pour béton connaît une croissance constante et une demande croissante, tirée par des facteurs tels que l'expansion du secteur de la construction, l'augmentation des investissements dans la construction durable, la croissance démographique dans les deux pays, l'augmentation de la construction de logements et de bâtiments, et l'augmentation de l'utilisation des adjuvants pour béton dans les activités d'infrastructure comme les aéroports, les barrages, les chemins de fer et le métro, entre autres. Le marché est caractérisé par une concurrence intense entre les principaux acteurs, stimulant l'innovation et les avancées technologiques en termes de fonctionnalités, de formulation et de durabilité. De plus, l'accent croissant mis sur la durabilité et les solutions respectueuses de l'environnement influence le développement des produits et les habitudes d'achat des consommateurs. Dans l'ensemble, le marché des adjuvants pour béton devrait poursuivre sa trajectoire ascendante dans les années à venir.
Le rapport sur le marché des adjuvants pour béton en Australie et en Nouvelle-Zélande fournit des détails sur la part de marché, les nouveaux développements et l'impact des acteurs du marché national et localisé, analyse les opportunités en termes de poches de revenus émergentes, de changements dans la réglementation du marché, d'approbations de produits, de décisions stratégiques, de lancements de produits, d'expansions géographiques et d'innovations technologiques sur le marché. Pour comprendre l'analyse et le scénario du marché, contactez-nous pour un briefing d'analyste. Notre équipe vous aidera à créer une solution d'impact sur les revenus pour atteindre votre objectif souhaité.
|
Rapport métrique |
Détails |
|
Période de prévision |
2023 à 2030 |
|
Année de base |
2022 |
|
Années historiques |
2021 (personnalisable de 2015 à 2020) |
|
Unités quantitatives |
Chiffre d'affaires en milliers de dollars américains et volume en tonnes |
|
Segments couverts |
Produit (réducteurs d'eau, superplastifiants, retardateurs, adjuvants spéciaux, accélérateurs et entraîneurs d'air), application (résidentielle, infrastructure et commerciale) |
|
Pays couverts |
Australie et Nouvelle-Zélande |
|
Acteurs du marché couverts |
Sika AG (Suisse), Fosroc International Limited (Royaume-Uni), Master Builders Solutions (Allemagne), GCP Applied Technologies (une filiale de Saint-Gobain) (États-Unis), Tremco Incorporated (une filiale de RPM International Inc.) (États-Unis), Xypex Chemical Corporation (Canada), Normet (Finlande), MAPEI SpA (Italie), Yara (Norvège), Rockbond (Nouvelle-Zélande), Cemix Products Limited (Nouvelle-Zélande) et Permacolour (Nouvelle-Zélande), entre autres. |
Définition du marché
Les adjuvants pour béton sont des substances, artificielles ou naturelles, qui sont ajoutées au mélange à tout moment. L'objectif principal de l'ajout de ces adjuvants est de fournir des caractéristiques structurelles telles que la résistance à la corrosion, la maniabilité, la durabilité, la résistance à la compression et la capacité de finition. L'utilisation du béton sera accélérée par l'expansion rapide du secteur de la construction, ce qui augmente le besoin d'adjuvants. La capacité du produit à réduire le temps de durcissement du béton, combinée à la construction rapide d'infrastructures, alimentera davantage l'expansion du marché tout au long de la période prévue.
Dynamique du marché des adjuvants pour béton en Australie et en Nouvelle-Zélande
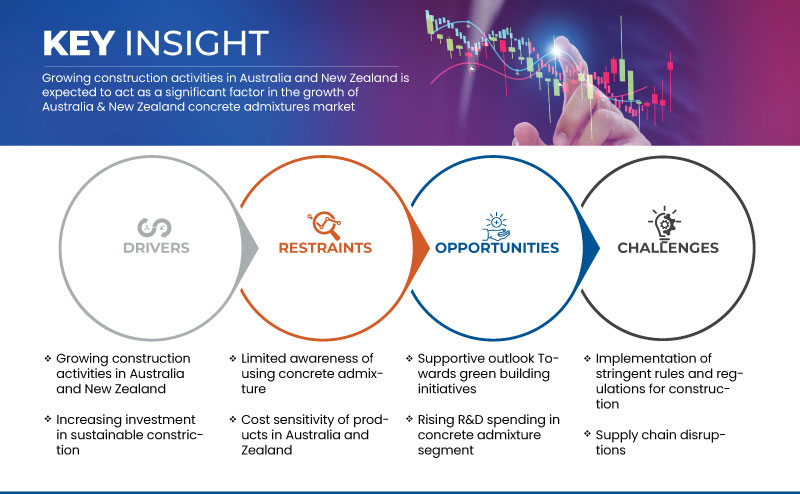
Cette section traite de la compréhension des moteurs, des avantages, des contraintes et des défis du marché. Tout cela est discuté en détail ci-dessous :
Conducteurs
- Croissance des activités de construction en Australie et en Nouvelle-Zélande
Le secteur de la construction en Australie et en Nouvelle-Zélande a connu une croissance rapide ces dernières années, ce qui a entraîné une augmentation significative de la demande d'adjuvants pour béton. La demande de logements a augmenté en raison de la croissance démographique et de l'urbanisation. Les projets de construction résidentielle, tels que les complexes d'appartements, les maisons de ville et les maisons unifamiliales, n'ont cessé d'augmenter. Pour répondre à la demande croissante de structures résidentielles de haute qualité et durables, les constructeurs se sont tournés vers les adjuvants pour béton afin d'améliorer les performances du béton.
Les secteurs commercial et industriel connaissent également une croissance importante. La construction d'immeubles de bureaux, de centres commerciaux, d'entrepôts et d'installations industrielles a créé un marché substantiel pour les adjuvants pour béton. Ces projets nécessitent souvent des formulations de béton spécialisées pour répondre à des critères de performance spécifiques, tels que la résistance, la durabilité et la résistance au feu.
- Augmenter les investissements dans la construction durable
Les gens sont de plus en plus conscients de l'impact du secteur de la construction sur l'environnement, notamment en termes de consommation d'énergie, d'émissions de gaz à effet de serre et d'épuisement des ressources. Pour limiter ces préoccupations environnementales et encourager des produits plus respectueux de l'environnement, on assiste à un investissement croissant dans la construction durable. Les gouvernements d'Australie et de Nouvelle-Zélande ont mis en place des mesures incitatives et des politiques pour encourager la construction durable. Cela comprend des allègements fiscaux, des subventions, des incitations financières et des procédures d'approbation simplifiées pour les projets de construction écologique. Le soutien du gouvernement encourage les investissements dans les projets de construction durable.
Enfin, les investissements croissants dans les pratiques de construction durables en Australie et en Nouvelle-Zélande ont créé des conditions favorables pour l'industrie des adjuvants pour béton. L'accent mis sur les certifications de construction écologique, l'efficacité énergétique, la réduction de l'empreinte carbone, la gestion des déchets, la conservation de l'eau, la durabilité et le soutien gouvernemental a accru la demande d'adjuvants qui améliorent la durabilité et les performances du béton. Les efforts continus d'innovation et de recherche de l'industrie s'alignent sur l'engagement de la région en faveur du développement durable, positionnant les adjuvants pour béton comme des composants essentiels pour atteindre les objectifs de construction durable.
Opportunités
- Perspectives favorables aux initiatives de construction écologique
La disponibilité de produits de construction durables, tels que les adjuvants pour béton respectueux de l'environnement, a augmenté dans les secteurs de la construction des deux pays. Les fabricants et les fournisseurs investissent dans la recherche et le développement pour créer des solutions d'adjuvants innovantes, à faible émission de carbone et respectueuses de l'environnement, qui s'alignent sur les initiatives écologiques du secteur. L'Australie et la Nouvelle-Zélande sont de plus en plus conscientes de l'impact environnemental des activités de construction. Les parties prenantes, notamment les agences gouvernementales, les associations industrielles, les promoteurs et les entrepreneurs, sont de plus en plus conscientes de la nécessité de pratiques de construction durables pour répondre aux problèmes environnementaux tels que le changement climatique, l'épuisement des ressources et la pollution. Le grand public est de plus en plus conscient des problèmes environnementaux et de l'importance de la construction durable. Les propriétaires, les locataires et les entreprises préfèrent de plus en plus les bâtiments respectueux de l'environnement qui offrent une efficacité énergétique, une qualité de l'air intérieur et un impact environnemental réduit. Cette demande de bâtiments écologiques a incité les acteurs de la construction à adopter des pratiques durables et à intégrer des produits respectueux de l'environnement tels que les adjuvants pour béton.
- Augmentation des dépenses de R&D dans le secteur des adjuvants pour béton
Pour améliorer la durabilité, le secteur de la construction adopte de nouvelles technologies et solutions telles que le béton auto-cicatrisant, le CCU et d'autres. Les progrès des adjuvants pour béton ont permis le développement d'options écologiques qui améliorent la durabilité, les performances et les attributs environnementaux du béton. La nature concurrentielle du secteur de la construction pousse les entreprises à investir dans la R&D pour obtenir un avantage concurrentiel. Les fabricants et fournisseurs d'adjuvants travaillent dur pour créer des produits uniques et performants qui répondent aux demandes changeantes du marché, et ces produits sont des superplastifiants, des accélérateurs, etc. Cet environnement concurrentiel encourage les efforts continus de R&D pour améliorer les formulations existantes, développer de nouveaux adjuvants et étudier des techniques de fabrication avancées.
Contraintes/Défis
- Mise en œuvre de règles et réglementations strictes en matière de construction
Des règles et réglementations plus strictes obligent les entreprises de construction à utiliser des adjuvants conformément aux normes de sécurité. Cela comprend la manipulation, le stockage et l'application appropriés des adjuvants pour éviter les accidents, les blessures ou les risques pour la santé des ouvriers et des occupants du bâtiment. Le respect des réglementations de sécurité garantit un environnement de travail sûr et réduit les risques associés à l'utilisation d'adjuvants. L'utilisation d'adjuvants doit être documentée et signalée conformément à des réglementations strictes. Les entreprises de construction sont souvent tenues de conserver des registres des adjuvants utilisés, ainsi que de leurs sources et de leurs spécifications. La mise en œuvre de réglementations strictes peut augmenter le coût des projets de construction. Les entreprises de construction peuvent avoir besoin de formation, d'équipement ou de tests supplémentaires pour garantir la conformité. Les adjuvants conformes aux normes requises peuvent être plus chers. Ces coûts supplémentaires peuvent poser des difficultés financières, en particulier pour les petites entreprises de construction ou les projets aux budgets limités.
- Perturbations de la chaîne d'approvisionnement
Les catastrophes naturelles telles que les tremblements de terre, les inondations et les feux de brousse sont courantes en Australie et en Nouvelle-Zélande. Ces événements peuvent endommager les infrastructures, perturber les réseaux de transport et provoquer la fermeture temporaire des installations de fabrication, affectant ainsi la chaîne d'approvisionnement. Les pénuries de main-d'œuvre sont courantes dans les secteurs de la construction en Australie et en Nouvelle-Zélande, ce qui peut perturber les calendriers de production et de livraison. Une disponibilité insuffisante de la main-d'œuvre ou un manque de travailleurs qualifiés peuvent entraîner des retards dans la fabrication et la livraison des adjuvants pour béton. En outre, les changements dans les politiques commerciales, l'imposition de droits de douane ou les conflits commerciaux peuvent tous avoir un impact sur l'importation et l'exportation de matières premières et de produits finis. Ces perturbations peuvent entraîner des retards, une augmentation des coûts et des inefficacités dans la chaîne d'approvisionnement.
Développements récents
- En mai 2023, Sika AG a finalisé l'acquisition du groupe MBCC. Sika est désormais plus forte dans toutes les zones géographiques, notamment aux États-Unis, au Royaume-Uni, en Australie et en Nouvelle-Zélande. Elle a également élargi son portefeuille de produits et de services pour couvrir l'ensemble du cycle de vie de la construction et accélère la transformation durable du secteur de la construction. Les capacités d'innovation combinées de Sika et de MBCC accéléreront la transformation durable globale du secteur de la construction.
- En septembre 2022, la transaction qui sera rachetée par Saint-Gobain a été finalisée, selon un communiqué de GCP Applied Technologies. Dans le cadre d'une transaction d'une valeur d'environ 2,3 milliards de dollars, Saint-Gobain a acheté la totalité des actions en circulation de GCP Applied Technologies pour 32,00 dollars par action en numéraire. Les activités de Saint-Gobain et de Chryso seront intégrées aux marques bien connues et aux décennies d'expertise de GCP.
Portée du marché des adjuvants pour béton en Australie et en Nouvelle-Zélande
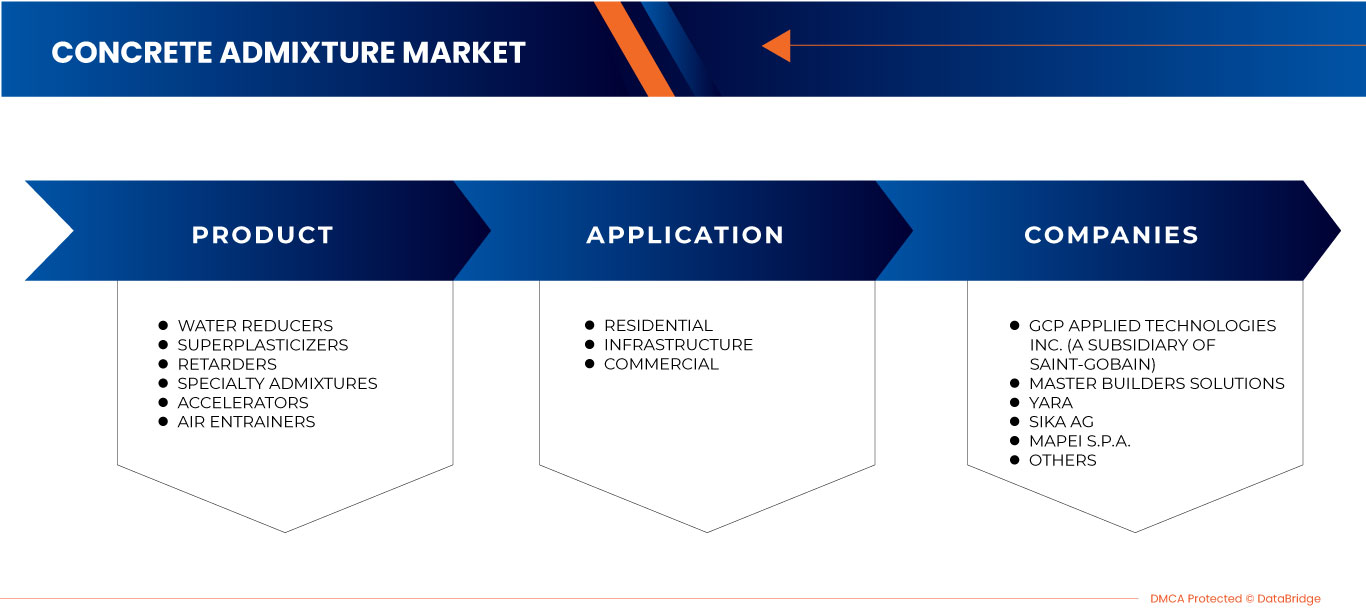
Le marché australien et néo-zélandais des adjuvants pour béton est segmenté en deux segments notables en fonction du produit et de l'application. La croissance de ces segments vous aidera à analyser les principaux segments de croissance des industries et à fournir aux utilisateurs un aperçu précieux du marché et des informations sur le marché pour prendre des décisions stratégiques afin d'identifier les principales applications du marché.
Produit
- Réducteurs d'eau
- Superplastifiants
- Retardateurs
- Adjuvants spéciaux
- Accélérateurs
- Entraîneurs d'air
Sur la base du produit, le marché est segmenté en réducteurs d’eau, superplastifiants, retardateurs, adjuvants spéciaux, accélérateurs et entraîneurs d’air.
Application
- Résidentiel
- Infrastructure
- Commercial
Sur la base des applications, le marché est segmenté en résidentiel, infrastructure et commercial.
Analyse du paysage concurrentiel et des parts de marché des adjuvants pour béton en Australie et en Nouvelle-Zélande
Le paysage concurrentiel du marché des adjuvants pour béton en Australie et en Nouvelle-Zélande fournit des détails par concurrents. Les détails inclus sont la présentation de l'entreprise, les finances de l'entreprise, les revenus générés, le potentiel du marché, les investissements dans la recherche et le développement, les nouvelles initiatives du marché, les sites et installations de production, les forces et les faiblesses de l'entreprise, le lancement de produits, les pipelines d'essais de produits, les approbations de produits, les brevets, la largeur et l'étendue du produit, la domination des applications, la courbe de survie technologique. Les points de données ci-dessus fournis ne concernent que l'orientation des entreprises liées au marché des adjuvants pour béton en Australie et en Nouvelle-Zélande.
Français Certains des principaux acteurs du marché opérant sur le marché sont Sika AG (Suisse), Fosroc International Limited (Royaume-Uni), Master Builders Solutions (Allemagne), GCP Applied Technologies (une filiale de Saint-Gobain) (États-Unis), Tremco Incorporated (une filiale de RPM International Inc.) (États-Unis), Xypex Chemical Corporation (Canada), Normet (Finlande), MAPEI SpA (Italie), Yara (Norvège), Rockbond (Nouvelle-Zélande), Cemix Products Limited (Nouvelle-Zélande) et Permacolour (Nouvelle-Zélande), entre autres.
SKU-
Accédez en ligne au rapport sur le premier cloud mondial de veille économique
- Tableau de bord d'analyse de données interactif
- Tableau de bord d'analyse d'entreprise pour les opportunités à fort potentiel de croissance
- Accès d'analyste de recherche pour la personnalisation et les requêtes
- Analyse de la concurrence avec tableau de bord interactif
- Dernières actualités, mises à jour et analyse des tendances
- Exploitez la puissance de l'analyse comparative pour un suivi complet de la concurrence
Table des matières
1 INTRODUCTION
1.1 OBJECTIVES OF THE STUDY
1.2 MARKET DEFINITION
1.3 OVERVIEW
1.4 LIMITATIONS
1.5 MARKETS COVERED
2 MARKET SEGMENTATION
2.1 MARKETS COVERED
2.2 GEOGRAPHICAL SCOPE
2.3 YEARS CONSIDERED FOR THE STUDY
2.4 CURRENCY AND PRICING
2.5 DBMR TRIPOD DATA VALIDATION MODEL
2.6 APPLICATION LIFE LINE CURVE
2.7 MULTIVARIATE MODELING
2.8 PRIMARY INTERVIEWS WITH KEY OPINION LEADERS
2.9 DBMR MARKET POSITION GRID
2.1 MARKET APPLICATION COVERAGE GRID
2.11 DBMR MARKET CHALLENGE MATRIX
2.12 DBMR VENDOR SHARE ANALYSIS
2.13 SECONDARY SOURCES
2.14 ASSUMPTIONS
3 EXECUTIVE SUMMARY
4 PREMIUM INSIGHTS
4.1 PESTLE ANALYSIS
4.1.1 POLITICAL FACTORS:
4.1.2 ECONOMIC FACTORS:
4.1.3 SOCIAL FACTORS:
4.1.4 TECHNOLOGICAL FACTORS:
4.1.5 LEGAL FACTORS:
4.1.6 ENVIRONMENTAL FACTORS:
4.2 PORTER’S FIVE FORCES:
4.2.1 THREAT OF NEW ENTRANTS:
4.2.2 THE THREAT OF SUBSTITUTES:
4.2.3 CUSTOMER BARGAINING POWER:
4.2.4 SUPPLIER BARGAINING POWER:
4.2.5 INTERNAL COMPETITION (RIVALRY):
4.3 VENDOR SELECTION CRITERIA
4.4 CLIMATE CHANGE SCENARIO
4.4.1 ENVIRONMENTAL CONCERNS
4.4.2 INDUSTRY RESPONSE
4.4.3 GOVERNMENT’S ROLE
4.4.4 ANALYST RECOMMENDATION
4.5 IMPORT EXPORT SCENARIO
4.6 PRICE INDEX SCENARIO
4.7 PRODUCTION CONSUMPTION ANALYSIS
4.8 PRODUCTION CAPACITY OVERVIEW
4.9 RAW MATERIAL COVERAGE
4.9.1 RETARDERS
4.9.2 ACCELERATORS
4.9.3 WATER-REDUCERS
4.9.4 AIR-ENTERTAINERS
4.9.5 SUPER-PLASTICIZERS
4.9.6 WATERPROOFING
4.9.7 ANTI-FREEZERS
4.1 SUPPLY CHAIN ANALYSIS
4.10.1 OVERVIEW
4.10.2 LOGISTIC COST SCENARIO
4.10.3 IMPORTANCE OF LOGISTICS SERVICE PROVIDERS
4.11 TECHNOLOGICAL ADVANCEMENTS BY MANUFACTURERS
5 REGULATION COVERAGE
6 MARKET OVERVIEW
6.1 DRIVERS
6.1.1 GROWING CONSTRUCTION ACTIVITIES IN AUSTRALIA AND NEW ZEALAND
6.1.2 INCREASING INVESTMENT IN SUSTAINABLE CONSTRUCTION
6.2 RESTRAINTS
6.2.1 LIMITED AWARENESS OF USING CONCRETE ADMIXTURE
6.2.2 COST SENSITIVITY OF PRODUCTS IN AUSTRALIA AND NEW ZEALAND
6.3 OPPORTUNITIES
6.3.1 SUPPORTIVE OUTLOOK TOWARDS GREEN BUILDING INITIATIVES
6.3.2 RISING R&D SPENDING IN THE CONCRETE ADMIXTURE SEGMENT
6.4 CHALLENGES
6.4.1 IMPLEMENTATION OF STRINGENT RULES AND REGULATIONS FOR CONSTRUCTION
6.4.2 SUPPLY CHAIN DISRUPTIONS
7 AUSTRALIA & NEW ZEALAND CONCRETE ADMIXTURE MARKET, BY COUNTRY
7.1 AUSTRALIA
7.2 NEW ZEALAND
8 COMPANY SHARE ANALYSIS: AUSTRALIA & NEW ZEALAND
8.1 ACQUISITION
8.2 NEW FACILITY
8.3 PRODUCT LAUNCH
8.4 AGREEMENT
9 COMPANY PROFILES
9.1 GCP APPLIED TECHNOLOGIES INC. (A SUBSIDIARY OF SAINT-GOBAIN)
9.1.1 COMPANY SNAPSHOT
9.1.2 SWOT ANALYSIS
9.1.3 PRODUCT PORTFOLIO
9.1.4 RECENT DEVELOPMENT
9.2 MASTER BUILDERS SOLUTIONS
9.2.1 COMPANY SNAPSHOT
9.2.2 SWOT ANALYSIS
9.2.3 PRODUCT PORTFOLIO
9.2.4 RECENT DEVELOPMENT
9.3 YARA
9.3.1 COMPANY SNAPSHOT
9.3.2 REVENUE ANALYSIS
9.3.3 PRODUCT PORTFOLIO
9.3.4 SWOT ANALYSIS
9.3.5 RECENT DEVELOPMENT
9.4 SIKA AG
9.4.1 COMPANY SNAPSHOT
9.4.2 REVENUE ANALYSIS
9.4.3 PRODUCT PORTFOLIO
9.4.4 SWOT ANALYSIS
9.4.5 RECENT DEVELOPMENT
9.5 MAPEI S.P.A
9.5.1 COMPANY SNAPSHOT
9.5.2 REVENUE ANALYSIS
9.5.3 PRODUCT PORTFOLIO
9.5.4 SWOT ANALYSIS
9.5.5 RECENT DEVELOPMENT
9.6 CEMIX PRODUCTS LIMITED
9.6.1 COMPANY SNAPSHOT
9.6.2 SWOT ANALYSIS
9.6.3 PRODUCT PORTFOLIO
9.6.4 RECENT DEVELOPMENT
9.7 FOSROC INTERNATIONAL LIMITED
9.7.1 COMPANY SNAPSHOT
9.7.2 SWOT ANALYSIS
9.7.3 PRODUCT PORTFOLIO
9.7.4 RECENT DEVELOPMENT
9.8 NORMET
9.8.1 COMPANY SNAPSHOT
9.8.2 REVENUE ANALYSIS
9.8.3 SWOT ANALYSIS
9.8.4 PRODUCT PORTFOLIO
9.8.5 RECENT DEVELOPMENTS
9.9 PERMACOLOUR.
9.9.1 COMPANY SNAPSHOT
9.9.2 SWOT ANALYSIS
9.9.3 PRODUCT PORTFOLIO
9.9.4 RECENT DEVELOPMENT
9.1 ROCKBOND
9.10.1 COMPANY SNAPSHOT
9.10.2 SWOT ANALYSIS
9.10.3 PRODUCT PORTFOLIO
9.10.4 RECENT DEVELOPMENT
9.11 XYPEX CHEMICAL CORPORATION
9.11.1 COMPANY SNAPSHOT
9.11.2 SWOT ANALYSIS
9.11.3 PRODUCT PORTFOLIO
9.11.4 RECENT DEVELOPMENTS
9.12 TREMCO INCORPORATED
9.12.1 COMPANY SNAPSHOT
9.12.2 SWOT ANALYSIS
9.12.3 PRODUCT PORTFOLIO
9.12.4 RECENT DEVELOPMENT
10 QUESTIONNAIRE
11 RELATED REPORTS
Liste des tableaux
TABLE 1 REGULATORY COVERAGE
TABLE 2 AUSTRALIA & NEW ZEALAND CONCRETE ADMIXTURE MARKET, BY COUNTRY, 2021-2030 (USD THOUSAND)
TABLE 3 AUSTRALIA & NEW ZEALAND CONCRETE ADMIXTURE MARKET, BY COUNTRY, 2021-2030 (TONS)
TABLE 4 AUSTRALIA & NEW ZEALAND CONCRETE ADMIXTURE MARKET, BY PRODUCT, 2021-2030 (USD THOUSAND)
TABLE 5 AUSTRALIA & NEW ZEALAND CONCRETE ADMIXTURE MARKET, BY PRODUCT, 2021-2030 (TONS)
TABLE 6 AUSTRALIA & NEW ZEALAND SPECIALTY ADMIXTURES IN CONCRETE ADMIXTURE MARKET, BY TYPE, 2021-2030 (USD THOUSAND)
TABLE 7 AUSTRALIA & NEW ZEALAND CONCRETE ADMIXTURE MARKET, BY APPLICATION, 2021-2030 (USD THOUSAND)
TABLE 8 AUSTRALIA & NEW ZEALAND CONCRETE ADMIXTURE MARKET, BY APPLICATION, 2021-2030 (TONS)
TABLE 9 AUSTRALIA & NEW ZEALAND RESIDENTIAL IN CONCRETE ADMIXTURE MARKET, BY SEGMENT, 2021-2030 (USD THOUSAND)
TABLE 10 AUSTRALIA & NEW ZEALAND INFRASTRUCTURE IN CONCRETE ADMIXTURE MARKET, BY SEGMENT, 2021-2030 (USD THOUSAND)
TABLE 11 AUSTRALIA & NEW ZEALAND COMMERCIAL IN CONCRETE ADMIXTURE MARKET, BY SEGMENT, 2021-2030 (USD THOUSAND)
TABLE 12 AUSTRALIA & NEW ZEALAND RETAIL IN CONCRETE ADMIXTURE MARKET, BY SEGMENT, 2021-2030 (USD THOUSAND)
TABLE 13 AUSTRALIA & NEW ZEALAND OFFICES IN CONCRETE ADMIXTURE MARKET, BY SEGMENT, 2021-2030 (USD THOUSAND)
TABLE 14 AUSTRALIA CONCRETE ADMIXTURE MARKET, BY PRODUCT, 2021-2030 (USD THOUSAND)
TABLE 15 AUSTRALIA CONCRETE ADMIXTURE MARKET, BY PRODUCT, 2021-2030 (TONS)
TABLE 16 AUSTRALIA SPECIALTY ADMIXTURES IN CONCRETE ADMIXTURE MARKET, BY TYPE, 2021-2030 (USD THOUSAND)
TABLE 17 AUSTRALIA CONCRETE ADMIXTURE MARKET, BY APPLICATION, 2021-2030 (USD THOUSAND)
TABLE 18 AUSTRALIA CONCRETE ADMIXTURE MARKET, BY APPLICATION, 2021-2030 (TONS)
TABLE 19 AUSTRALIA RESIDENTIAL IN CONCRETE ADMIXTURE MARKET, BY SEGMENT, 2021-2030 (USD THOUSAND)
TABLE 20 AUSTRALIA INFRASTRUCTURE IN CONCRETE ADMIXTURE MARKET, BY SEGMENT, 2021-2030 (USD THOUSAND)
TABLE 21 AUSTRALIA COMMERCIAL IN CONCRETE ADMIXTURE MARKET, BY SEGMENT, 2021-2030 (USD THOUSAND)
TABLE 22 AUSTRALIA RETAIL IN CONCRETE ADMIXTURE MARKET, BY SEGMENT, 2021-2030 (USD THOUSAND)
TABLE 23 AUSTRALIA OFFICES IN CONCRETE ADMIXTURE MARKET, BY SEGMENT, 2021-2030 (USD THOUSAND)
TABLE 24 NEW ZEALAND CONCRETE ADMIXTURE MARKET, BY PRODUCT, 2021-2030 (USD THOUSAND)
TABLE 25 NEW ZEALAND CONCRETE ADMIXTURE MARKET, BY PRODUCT, 2021-2030 (TONS)
TABLE 26 NEW ZEALAND SPECIALTY ADMIXTURES IN CONCRETE ADMIXTURE MARKET, BY TYPE, 2021-2030 (USD THOUSAND)
TABLE 27 NEW ZEALAND CONCRETE ADMIXTURE MARKET, BY APPLICATION, 2021-2030 (USD THOUSAND)
TABLE 28 NEW ZEALAND CONCRETE ADMIXTURE MARKET, BY APPLICATION, 2021-2030 (TONS)
TABLE 29 NEW ZEALAND RESIDENTIAL IN CONCRETE ADMIXTURE MARKET, BY SEGMENT, 2021-2030 (USD THOUSAND)
TABLE 30 NEW ZEALAND COMMERCIAL IN CONCRETE ADMIXTURE MARKET, BY SEGMENT, 2021-2030 (USD THOUSAND)
TABLE 31 NEW ZEALAND RETAIL IN CONCRETE ADMIXTURE MARKET, BY SEGMENT, 2021-2030 (USD THOUSAND)
TABLE 32 NEW ZEALAND OFFICES IN CONCRETE ADMIXTURE MARKET, BY SEGMENT, 2021-2030 (USD THOUSAND)
TABLE 33 NEW ZEALAND INFRASTRUCTURE IN CONCRETE ADMIXTURE MARKET, BY SEGMENT, 2021-2030 (USD THOUSAND)
Liste des figures
FIGURE 1 AUSTRALIA & NEW ZEALAND CONCRETE ADMIXTURE MARKET
FIGURE 2 AUSTRALIA & NEW ZEALAND CONCRETE ADMIXTURE MARKET: DATA TRIANGULATION
FIGURE 3 AUSTRALIA & NEW ZEALAND CONCRETE ADMIXTURE MARKET: DROC ANALYSIS
FIGURE 4 AUSTRALIA & NEW ZEALAND CONCRETE ADMIXTURE MARKET: COUNTRIES MARKET ANALYSIS
FIGURE 5 AUSTRALIA & NEW ZEALAND CONCRETE ADMIXTURE MARKET: COMPANY RESEARCH ANALYSIS
FIGURE 6 AUSTRALIA & NEW ZEALAND CONCRETE ADMIXTURE MARKET: THE APPLICATION LIFE LINE CURVE
FIGURE 7 AUSTRALIA & NEW ZEALAND CONCRETE ADMIXTURE MARKET: MULTIVARIATE MODELLING
FIGURE 8 AUSTRALIA & NEW ZEALAND CONCRETE ADMIXTURE MARKET: INTERVIEW DEMOGRAPHICS
FIGURE 9 AUSTRALIA & NEW ZEALAND CONCRETE ADMIXTURE MARKET: DBMR MARKET POSITION GRID
FIGURE 10 AUSTRALIA & NEW ZEALAND CONCRETE ADMIXTURE MARKET: MARKET APPLICATION COVERAGE GRID
FIGURE 11 AUSTRALIA & NEW ZEALAND CONCRETE ADMIXTURE MARKET: THE MARKET CHALLENGE MATRIX
FIGURE 12 AUSTRALIA & NEW ZEALAND CONCRETE ADMIXTURE MARKET: VENDOR SHARE ANALYSIS
FIGURE 13 AUSTRALIA & NEW ZEALAND CONCRETE ADMIXTURE MARKET: SEGMENTATION
FIGURE 14 GROWING CONSTRUCTION ACTIVITIES IN AUSTRALIA AND NEW ZEALAND ARE EXPECTED TO DRIVE THE AUSTRALIA & NEW ZEALAND CONCRETE ADMIXTURE MARKET IN THE FORECAST PERIOD
FIGURE 15 THE WATER REDUCERS ARE EXPECTED TO ACCOUNT FOR THE LARGEST SHARE OF THE AUSTRALIA & NEW ZEALAND CONCRETE ADMIXTURE MARKET IN 2023 AND 2030
FIGURE 16 VENDOR SELECTION CRITERIA
FIGURE 17 IMPORT EXPORT SCENARIO (USD THOUSAND)
FIGURE 18 IMPORT EXPORT SCENARIO (USD THOUSAND)
FIGURE 19 DRIVERS, RESTRAINTS, OPPORTUNITIES, AND CHALLENGES OF THE AUSTRALIA & NEW ZEALAND CONCRETE ADMIXTURE MARKET
FIGURE 20 AUSTRALIA & NEW ZEALAND CONCRETE ADMIXTURE MARKET: COMPANY SHARE 2022 (%)

Méthodologie de recherche
La collecte de données et l'analyse de l'année de base sont effectuées à l'aide de modules de collecte de données avec des échantillons de grande taille. L'étape consiste à obtenir des informations sur le marché ou des données connexes via diverses sources et stratégies. Elle comprend l'examen et la planification à l'avance de toutes les données acquises dans le passé. Elle englobe également l'examen des incohérences d'informations observées dans différentes sources d'informations. Les données de marché sont analysées et estimées à l'aide de modèles statistiques et cohérents de marché. De plus, l'analyse des parts de marché et l'analyse des tendances clés sont les principaux facteurs de succès du rapport de marché. Pour en savoir plus, veuillez demander un appel d'analyste ou déposer votre demande.
La méthodologie de recherche clé utilisée par l'équipe de recherche DBMR est la triangulation des données qui implique l'exploration de données, l'analyse de l'impact des variables de données sur le marché et la validation primaire (expert du secteur). Les modèles de données incluent la grille de positionnement des fournisseurs, l'analyse de la chronologie du marché, l'aperçu et le guide du marché, la grille de positionnement des entreprises, l'analyse des brevets, l'analyse des prix, l'analyse des parts de marché des entreprises, les normes de mesure, l'analyse globale par rapport à l'analyse régionale et des parts des fournisseurs. Pour en savoir plus sur la méthodologie de recherche, envoyez une demande pour parler à nos experts du secteur.
Personnalisation disponible
Data Bridge Market Research est un leader de la recherche formative avancée. Nous sommes fiers de fournir à nos clients existants et nouveaux des données et des analyses qui correspondent à leurs objectifs. Le rapport peut être personnalisé pour inclure une analyse des tendances des prix des marques cibles, une compréhension du marché pour d'autres pays (demandez la liste des pays), des données sur les résultats des essais cliniques, une revue de la littérature, une analyse du marché des produits remis à neuf et de la base de produits. L'analyse du marché des concurrents cibles peut être analysée à partir d'une analyse basée sur la technologie jusqu'à des stratégies de portefeuille de marché. Nous pouvons ajouter autant de concurrents que vous le souhaitez, dans le format et le style de données que vous recherchez. Notre équipe d'analystes peut également vous fournir des données sous forme de fichiers Excel bruts, de tableaux croisés dynamiques (Fact book) ou peut vous aider à créer des présentations à partir des ensembles de données disponibles dans le rapport.


