U.S. Leather Furniture Market, By Category (Full Grain, Top Grain, Genuine, Bicast, Bonded and Synthetic), Finish (Aniline, Semi-Aniline, Brush-Colored, Degrained, Die-Cut, Embossed, Handworked, Metallic, Nappa, Nubuck, Oily, Patent, Suede, Waxy and Others), Product (Sofa, Chair, Bean Bags, Corner Sofa, Recliner, Stool, Ottoman, Pouf, Table, Foot Stools and Others), Distribution Channel (E-Commerce, B2B, Third Party Distributors and Others), Application (Residential and Commercial) -Industry Trends and Forecast to 2029
Market Analysis and Size
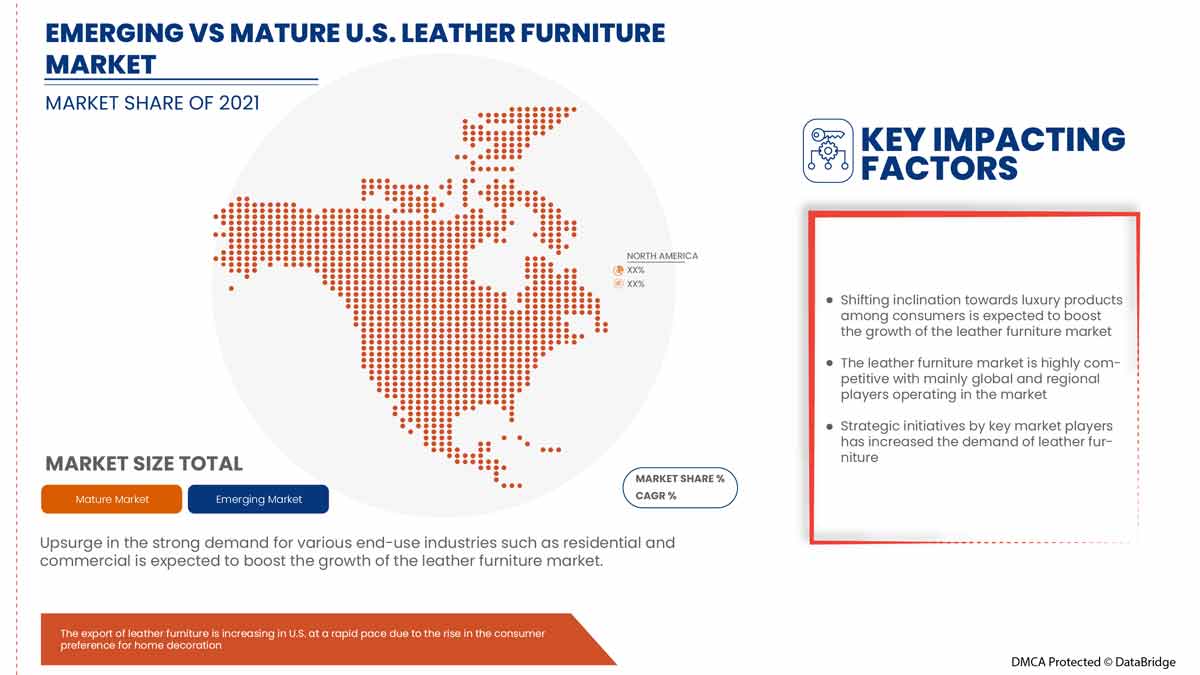
Leather is the most durable type and is used in the majority of furniture upholstery. Leather furniture is widely used to bring aesthetics to the space. It is considered as luxurious goods and display people class and standard. Leather furniture is more robust than cotton or fabrics furniture and can last for years. The leather furniture can be cleaned quickly with a wipe and dusting, which increases its demand in the market.


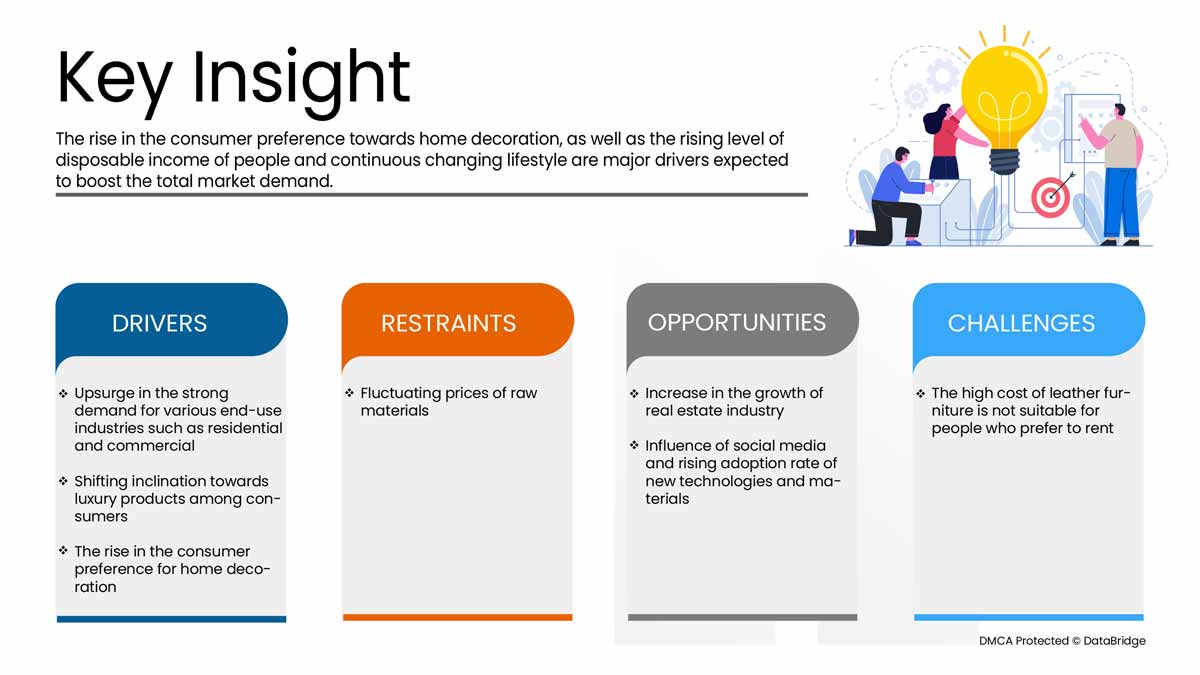
The rise in the consumer preference for home decoration, the increasing disposable income of people, and the continuously changing lifestyle are expected to drive the demand for the U.S. leather furniture market. However, the fluctuating prices of raw materials may further restrict the market's growth.
Several boosters, such as an increase in the growth of the real estate industry, the influence of social media, and the rising adoption rate of new technologies and materials, are expected to create opportunities for the U.S. leather furniture market. However, the high cost of leather furniture is unsuitable for people who prefer to rent and is likely to challenge the market's growth during the forecast period.
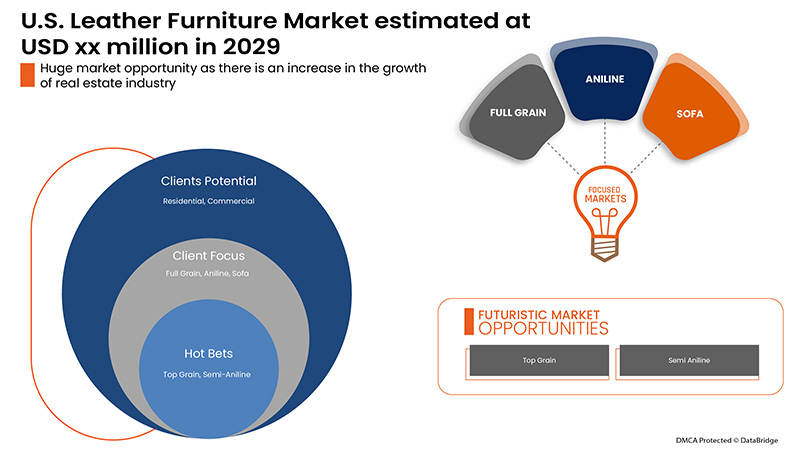
Data Bridge Market Research analyses that the U.S. leather furniture market is expected to reach USD 13,383.68 million by 2029, at a CAGR of 7.3% during the forecast period. “Residential" accounts for the most prominent application segment in the respective market, owing to the rise in the real estate industry. The market report curated by the Data Bridge Market Research team includes in-depth expert analysis, import/export analysis, pricing analysis, production consumption analysis, and climate chain scenario.
|
Report Metric |
Details |
|
Forecast Period |
2022 to 2029 |
|
Base Year |
2021 |
|
Historic Years |
2020 (Customizable to 2019 - 2014) |
|
Quantitative Units |
Revenue in USD Million, Volume in Units, Pricing in USD |
|
Segments Covered |
Por categoría (grano completo, grano superior, genuino, bicast, adherido y sintético), acabado (anilina, semianilina, coloreado a pincel, desgranado, troquelado, grabado, trabajado a mano, metálico, napa, nobuck, aceitoso, charol, gamuza, encerado y otros), producto (sofá, silla, puf, sofá de esquina, sillón reclinable, taburete, otomana, puf, mesa, reposapiés y otros), canal de distribución (comercio electrónico, B2B, distribuidores externos y otros), aplicación (residencial y comercial) |
|
País cubierto |
A NOSOTROS |
|
Actores del mercado cubiertos |
Norwalk, Rowe Furniture, NELLA VETRINA, DOMICILE FURNITURE, entre otros |
Definición de mercado
Los muebles de cuero son muebles sintéticos que incluyen sillas, sofás, pufs, sillones reclinables, mesas, pufs y taburetes, entre otros. Tienen una gran demanda debido a la creciente preferencia de los consumidores por la decoración del hogar con el mobiliario adecuado. Se consideran muebles de lujo. Los muebles de lujo están compuestos por partes móviles que muestran lo mejor de la artesanía y el diseño excepcionales de una época específica. Los muebles de cuero de alta calidad conservan su forma y apariencia durante muchos años.
Marco regulatorio
- Según la Comisión Federal de Comercio 16 CFR Parte 24, las guías de cuero abordan las tergiversaciones sobre la composición y las características de ciertos productos de cuero y cuero de imitación y establecen que se debe divulgar el contenido que no es de cuero para el material que parece ser, pero no es, cuero.
La dinámica del mercado de muebles de cuero de EE. UU. incluye:

Impulsores/Oportunidades
- El aumento de la preferencia del consumidor por la decoración del hogar
La gente cree que la decoración del hogar aumenta sus valores, aspiraciones y gustos. Incorporar estética al hogar o la oficina lo hace personal, mental y estéticamente agradable. Mejorar la estética de hogares, oficinas y otras áreas incluye renovaciones; agregar espejos, muebles y más puede agregar vida al espacio o área y es relajante para la vista y la mente. Ayuda a cambiar el mal humor y brinda una sensación de calma y relajación, que se considera una de las razones clave para estar prácticamente saludable y como complemento para fines estéticos. Por lo tanto, se espera que la creciente conciencia sobre la decoración y el mobiliario del hogar impulse el mercado en los próximos años.
- El aumento del nivel de ingresos disponibles de las personas y el continuo cambio en el estilo de vida
El aumento de los ingresos disponibles de los consumidores y la urbanización han dado lugar a un elevado coste de vida en las megaciudades. Así, surgió el concepto de compartir espacios habitables, lo que aumentó la demanda de ideas que permitan ahorrar espacio, como los muebles de cuero. Por tanto, se prevé que el aumento del nivel de vida debido al aumento de los ingresos disponibles de los consumidores y la urbanización aumente el mercado de muebles de cuero de los Estados Unidos.
- Cambio de inclinación de los consumidores hacia los productos de lujo
Las personas son muy conscientes a la hora de comprar productos o muebles de lujo para sus hogares. Tienden a optar por la calidad y la comodidad independientemente de sus ahorros e ingresos. Debido a los diversos beneficios de comprar muebles de lujo, la decisión de compra de las personas mejora. Las personas dan la máxima importancia al color, la forma, la tela y el acabado de los muebles para su sala de estar, cocina, dormitorio o incluso el patio trasero. Los muebles de lujo de alta gama le dan un atractivo atemporal al hogar. Con la ayuda del asesoramiento profesional, las personas obtienen un mejor asesoramiento sobre los muebles adecuados para su espacio.
- Aumento de la fuerte demanda de diversas industrias de uso final, como la residencial y la comercial.
Las industrias residencial y comercial utilizan estratégicamente muebles de cuero para mejorar la decoración. En la mayoría de los casos, los muebles de cuero o los muebles de cuero móviles se camuflan como un elegante armario en una pequeña sala de reuniones, que se puede bajar cuando sea necesario, lo que genera más espacio para varios propósitos. El aumento de las actividades de construcción en diversas industrias de uso final, como la residencial y la comercial, brindará oportunidades de crecimiento a la industria del mueble. Se espera que el aumento en la instalación de muebles de cuero en estas industrias impulse el mercado.
Restricciones/Desafíos
- Precios fluctuantes de las materias primas
A las empresas les resulta difícil evaluar correctamente el riesgo de grandes fluctuaciones en los costos de las materias primas. Si sólo retrasan mínimamente, o de manera demasiado conservadora, el aumento de los costos, o si el aumento de los costos de las materias primas y la disminución de los precios de venta ocurren al mismo tiempo, entonces la disminución de la rentabilidad es inevitable. Los costos de las materias primas altamente fluctuantes y la gestión ineficaz de los precios pueden poner en grave peligro el éxito de las empresas. Además, el aumento del comercio global, la urbanización, las necesidades de transporte y las tendencias fluctuantes del mercado ejercen una presión adicional sobre el costo de los intermediarios necesarios para la fabricación de muebles. Por lo tanto, los cambios en los costos de producción de las materias primas pueden actuar como factores restrictivos para el mercado.
- El alto costo de los muebles de cuero no es adecuado para personas que alquilan
Algunas personas prefieren trasladar sus muebles de cuero cuando se mudan de casa, pero el proceso es tedioso y puede requerir un equipo de trabajadores, lo que les cuesta una buena cantidad de dinero. Además, los muebles de cuero personalizados se fabrican de acuerdo con el espacio disponible en el apartamento. No todos los apartamentos tendrán el mismo espacio y altura, lo que puede dificultar el traslado de los muebles de cuero. Por lo tanto, la mayoría de las personas que viven de alquiler no prefieren comprar muebles de cuero, ya que no es fácil trasladar los muebles de cuero sin pagar costos adicionales de traslado, desmontaje e instalación. Por lo tanto, los muebles de cuero no son adecuados para las personas que alquilan. Teniendo en cuenta el alto costo de vida, la mayoría de las personas prefieren vivir en apartamentos alquilados o compartidos para dividir los costos. Por lo tanto, esto actúa como un desafío para el mercado.
El COVID-19 tuvo un impacto mínimo en el mercado de muebles de cuero de EE. UU.
El COVID-19 afectó a varias industrias manufactureras en el año 2020-2021, ya que provocó el cierre de lugares de trabajo, la interrupción de las cadenas de suministro y restricciones al transporte. Sin embargo, no se notó un impacto significativo en sus operaciones y cadena de suministro de muebles de cuero en EE. UU., ya que la importación y exportación de vacunas y productos esenciales provocó una creciente demanda de muebles de cuero. Esta creciente demanda de los consumidores aumenta el crecimiento del mercado de muebles de cuero de EE. UU.
Desarrollo reciente
- En septiembre de 2021, Norwalk presentó seis colecciones de tapicería de cuero muy duraderas y elegantes en el próximo mercado de Las Vegas. Esto ayudará a la empresa a aumentar el valor de su marca y sus clientes en Las Vegas.
Panorama del mercado de muebles de cuero en EE.UU.
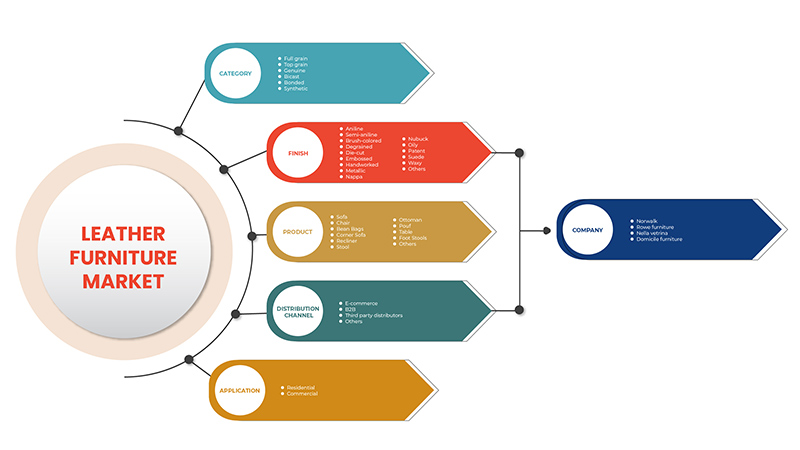
El mercado estadounidense de muebles de cuero está segmentado en función de la categoría, el acabado, el producto, el canal de distribución y la aplicación. El crecimiento entre estos segmentos le ayudará a analizar los segmentos de crecimiento reducido de las industrias y brindará a los usuarios una valiosa descripción general del mercado y conocimientos del mercado para ayudarlos a tomar decisiones estratégicas para identificar las principales aplicaciones del mercado.
Categoría
- Grano completo
- Grano superior
- Genuino
- Bidifusión
- Garantizado
- Sintético
Sobre la base de la categoría, el mercado estadounidense de muebles de cuero está segmentado en grano completo, grano superior, genuino, bicast, adherido y sintético.
Finalizar
- Anilina
- Semianilina
- Pincel de color
- Desgranado
- Troquelado
- En relieve
- Hecho a mano
- Metálico
- Napa
- Nubuck
- Aceitoso
- Patentar
- Ante
- De cera
- Otros
En función del acabado, el mercado estadounidense de muebles de cuero se segmenta en anilina, semianilina, coloreado a pincel, desgranado, troquelado, grabado en relieve, trabajado a mano, metalizado, napa, nobuck, aceitoso, charol, gamuza, encerado y otros.
Producto
- Sofá
- Silla
- Bolsas de frijoles
- Sofá de esquina
- Sillón reclinable
- Heces
- otomano
- Puff
- Mesa
- Taburetes para pies
- Otros
Sobre la base del producto, el mercado estadounidense de muebles de cuero está segmentado en sofás, sillas, pufs, sofás de esquina, sillones reclinables, taburetes, otomanas, pufs, mesas, reposapiés y otros.
Canal de distribución
- Comercio electrónico
- B2B
- Distribuidores de terceros
- Otros
Sobre la base del canal de distribución, el mercado estadounidense de muebles de cuero está segmentado en comercio electrónico, B2B, distribuidores externos y otros.
Solicitud
- Residencial
- Comercial

Sobre la base de la aplicación, el mercado estadounidense de muebles de cuero está segmentado en residencial y comercial.
Análisis del panorama competitivo y de la cuota de mercado de muebles de cuero en EE. UU.
El panorama competitivo del mercado de muebles de cuero de EE. UU. proporciona detalles de los competidores. Los detalles incluyen una descripción general de la empresa, las finanzas de la empresa, los ingresos generados, el potencial de mercado, la inversión en investigación y desarrollo, las nuevas iniciativas de mercado, la presencia en EE. UU., los sitios e instalaciones de producción, las capacidades de producción, las fortalezas y debilidades de la empresa, el lanzamiento de productos, la amplitud y variedad de productos, el dominio de las aplicaciones. Los puntos de datos anteriores proporcionados solo están relacionados con el enfoque de las empresas en el mercado de muebles de cuero de EE. UU.
Algunos de los principales actores que operan en el mercado de muebles de cuero de EE. UU. son Norwalk, Rowe Furniture, NELLA VETRINA, DOMICILE FURNITURE, entre otros.
SKU-
Obtenga acceso en línea al informe sobre la primera nube de inteligencia de mercado del mundo
- Panel de análisis de datos interactivo
- Panel de análisis de empresas para oportunidades con alto potencial de crecimiento
- Acceso de analista de investigación para personalización y consultas
- Análisis de la competencia con panel interactivo
- Últimas noticias, actualizaciones y análisis de tendencias
- Aproveche el poder del análisis de referencia para un seguimiento integral de la competencia
Tabla de contenido
1 INTRODUCTION
1.1 OBJECTIVES OF THE STUDY
1.2 MARKET DEFINITION
1.3 OVERVIEW OF U.S. LEATHER FURNITURE MARKET
1.4 LIMITATION
1.5 MARKETS COVERED
2 MARKET SEGMENTATION
2.1 MARKETS COVERED
2.2 GEOGRAPHICAL SCOPE
2.3 YEARS CONSIDERED FOR THE STUDY
2.4 CURRENCY AND PRICING
2.5 DBMR TRIPOD DATA VALIDATION MODEL
2.6 DISTRIBUTION CHANNEL LINE CURVE
2.7 MULTIVARIATE MODELING
2.8 PRIMARY INTERVIEWS WITH KEY OPINION LEADERS
2.9 DBMR MARKET POSITION GRID
2.1 MARKET CONSUMER CATEGORY COVERAGE GRID
2.11 DBMR MARKET CHALLENGE MATRIX
2.12 DBMR VENDOR SHARE ANALYSIS
2.13 IMPORT-EXPORT DATA
2.14 SECONDARY SOURCES
2.15 ASSUMPTIONS
3 EXECUTIVE SUMMARY
4 PREMIUM INSIGHTS
4.1 BRAND COMPARATIVE ANALYSIS
4.2 FACTORS INFLUENCING BUYING DECISION
4.3 PESTLE ANALYSIS
4.4 PORTER’S FIVE FORCES:
4.5 PRODUCT ADOPTION CRITERIA
4.5.1 OVERVIEW
4.5.1.1 PRODUCT AWARENESS
4.5.1.2 PRODUCT INTEREST
4.5.1.3 PRODUCT EVALUATION
4.5.1.4 PRODUCT TRIAL
4.5.1.5 PRODUCT ADOPTION
4.5.1.6 CONCLUSION
4.6 CONSUMERS BUYING BEHAVIOUR
4.6.1 OVERVIEW
4.6.1.1 COMPLEX BUYING BEHAVIOR
4.6.1.2 DISSONANCE-REDUCING BUYING BEHAVIOR
4.6.1.3 HABITUAL BUYING BEHAVIOR
4.6.1.4 VARIETY SEEKING BEHAVIOR
4.6.1.5 CONCLUSION
5 LEATHER FURNITURE MARKET
5.1 U.S.
6 MARKET OVERVIEW
6.1 DRIVERS
6.1.1 THE RISE IN THE CONSUMER PREFERENCE FOR HOME DECORATION
6.1.2 THE RISE IN LEVEL OF DISPOSABLE INCOME OF PEOPLE AND CONTINUOUS CHANGING LIFESTYLE
6.1.3 SHIFT IN INCLINATION TOWARD LUXURY PRODUCTS AMONG CONSUMERS
6.1.4 UPSURGE IN THE STRONG DEMAND FOR VARIOUS END-USE INDUSTRIES SUCH AS RESIDENTIAL AND COMMERCIAL
6.2 RESTRAINT
6.2.1 FLUCTUATION IN THE PRICES OF RAW MATERIALS
6.3 OPPORTUNITIES
6.3.1 INCREASE IN THE GROWTH OF THE REAL ESTATE INDUSTRY
6.3.2 INFLUENCE OF SOCIAL MEDIA AND RISING ADOPTION RATE OF NEW TECHNOLOGIES AND MATERIALS
6.4 CHALLENGE
6.4.1 HIGH COST OF LEATHER FURNITURE IS NOT SUITABLE FOR PEOPLE WHO PREFER TO RENT
7 U.S. LEATHER FURNITURE MARKET, BY CATEGORY
7.1 OVERVIEW
7.2 FULL GRAIN
7.3 TOP GRAIN
7.4 GENUINE
7.5 BICAST
7.6 BONDED
7.7 SYNTHETIC
8 U.S. LEATHER FURNITURE MARKET, BY FINISH
8.1 OVERVIEW
8.2 ANILINE
8.3 SEMI-ANILINE
8.4 BRUSH-COLORED
8.5 DEGRAINED
8.6 DIE-CUT
8.7 EMBOSSED
8.8 HANDWORKED
8.9 METALLIC
8.1 NAPPA
8.11 NUBUCK
8.12 OILY
8.13 PATENT
8.14 SUEDE
8.15 WAXY
8.16 OTHERS
9 U.S. LEATHER FURNITURE MARKET, BY PRODUCT
9.1 OVERVIEW
9.2 SOFA
9.3 CHAIR
9.4 BEAN BAGS
9.5 CORNER SOFA
9.6 RECLINER
9.7 STOOL
9.8 OTTOMAN
9.9 POUF
9.1 TABLE
9.11 FOOT STOOL
9.12 OTHERS
10 U.S. LEATHER FURNITURE MARKET, BY APPLICATION
10.1 OVERVIEW
10.2 RESIDENTIAL
10.3 COMMERCIAL
10.3.1 COMMERCIAL, BY APPLICATION
10.3.1.1 HOTELS
10.3.1.2 RESORTS
10.3.1.3 UNIVERSITY
10.3.1.4 HOSPITAL
10.3.1.5 PUBLIC OFFICES
10.3.1.6 RESTAURANTS
10.3.1.7 PRIVATE OFFICES
10.3.1.8 SHOPPING MALLS
10.3.1.9 OTHERS
11 U.S. LEATHER FURNITURE MARKET, BY DISTRIBUTION CHANNEL
11.1 OVERVIEW
11.2 B2B
11.3 THIRD PARTY DISTRIBUTORS
11.4 E-COMMERCE
11.5 OTHERS
12 EUROPE LEATHER FURNITURE MARKET, COMPANY LANDSCAPE
12.1 COMPANY SHARE ANALYSIS: U.S.
12.1.1 NEW PRODUCT DEVELOPMENT
13 SWOT ANALYSIS
14 COMPANY PROFILES
14.1 LA-Z-BOY INCORPORATED
14.1.1 COMPANY SNAPSHOT
14.1.2 REVENUE ANALYSIS
14.1.3 PRODUCT PORTFOLIO
14.1.4 RECENT UPDATE
14.2 B&B ITALIA SPA
14.2.1 COMPANY SNAPSHOT
14.2.2 PRODUCT PORTFOLIO
14.2.3 RECENT DEVELOPMENTS
14.3 INTER IKEA SYSTEMS B.V.
14.3.1 COMPANY SNAPSHOT
14.3.2 REVENUE ANALYSIS
14.3.3 PRODUCT PORTFOLIO
14.3.4 RECENT DEVELOPMENT
14.4 NATUZZI S.P.A.
14.4.1 COMPANY SNAPSHOT
14.4.2 REVENUE ANALYSIS
14.4.3 PRODUCT PORTFOLIO
14.4.4 RECENT UPDATE
14.5 DOMICILE FURNITURE
14.5.1 COMPANY SNAPSHOT
14.5.2 PRODUCT PORTFOLIO
14.5.3 RECENT DEVELOPMENTS
14.6 DURESTA
14.6.1 COMPANY SNAPSHOT
14.6.2 PRODUCT PORTFOLIO
14.6.3 RECENT DEVELOPMENTS
14.7 NELLA VETRINA
14.7.1 COMPANY SNAPSHOT
14.7.2 PRODUCT PORTFOLIO
14.7.3 RECENT DEVELOPMENTS
14.8 NORWALK
14.8.1 COMPANY SNAPSHOT
14.8.2 PRODUCT PORTFOLIO
14.8.3 RECENT DEVELOPMENT
14.9 PALLISER FURNITURE
14.9.1 COMPANY SNAPSHOT
14.9.2 PRODUCT PORTFOLIO
14.9.3 RECENT DEVELOPMENTS
14.1 ROWE FURNITURE
14.10.1 COMPANY SNAPSHOT
14.10.2 PRODUCT PORTFOLIO
14.10.3 RECENT DEVELOPMENTS
15 QUESTIONNAIRE
16 RELATED REPORTS
Lista de Tablas
TABLE 1 IMPORT DATA OF LEATHER OF PATENT LEATHER AND PATENT LAMINATED LEATHER; METALLISED LEATHER (EXCLUDING LACQUERED OR METALLISED RECONSTITUTED LEATHER); HS CODE - 411420 (USD THOU.S.ND)
TABLE 2 EXPORT DATA OF LEATHER OF PATENT LEATHER AND PATENT LAMINATED LEATHER; METALLISED LEATHER (EXCLUDING LACQUERED OR METALLISED RECONSTITUTED LEATHER) – 411420 (USD THOU.S.ND)
TABLE 3 U.S. LEATHER FURNITURE MARKET, BY CATEGORY, 2020-2029 (USD MILLION)
TABLE 4 U.S. LEATHER FURNITURE MARKET, BY CATEGORY, 2020-2029 (MILLION UNITS)
TABLE 5 U.S. LEATHER FURNITURE MARKET, BY FINISH, 2020-2029 (USD MILLION)
TABLE 6 U.S. LEATHER FURNITURE MARKET, BY PRODUCT, 2020-2029 (USD MILLION)
TABLE 7 U.S. LEATHER FURNITURE MARKET, BY APPLICATION, 2020-2029 (USD MILLION)
TABLE 8 U.S. COMMERCIAL IN LEATHER FURNITURE MARKET, BY APPLICATION, 2020-2029 (USD MILLION)
TABLE 9 U.S. LEATHER FURNITURE MARKET, BY DISTRIBUTION CHANNEL, 2020-2029 (USD MILLION)
Lista de figuras
FIGURE 1 U.S. LEATHER FURNITURE MARKET: SEGMENTATION
FIGURE 2 U.S. LEATHER FURNITURE MARKET: DATA TRIANGULATION
FIGURE 3 U.S. LEATHER FURNITURE MARKET: DROC ANALYSIS
FIGURE 4 U.S. LEATHER FURNITURE MARKET: REGIONAL VS COUNTRY MARKET ANALYSIS
FIGURE 5 U.S. LEATHER FURNITURE MARKET: COMPANY RESEARCH ANALYSIS
FIGURE 6 U.S. LEATHER FURNITURE MARKET: DISTRIBUTION CHANNEL LIFE LINE CURVE
FIGURE 7 U.S. LEATHER FURNITURE MARKET: MULTIVARIATE MODELLING
FIGURE 8 U.S. LEATHER FURNITURE MARKET: INTERVIEW DEMOGRAPHICS
FIGURE 9 U.S. LEATHER FURNITURE MARKET: DBMR MARKET POSITION GRID
FIGURE 10 U.S. LEATHER FURNITURE MARKET: CONSUMER CATEGORY COVERAGE GRID
FIGURE 11 U.S. LEATHER FURNITURE MARKET: CHALLENGE MATRIX
FIGURE 12 U.S. LEATHER FURNITURE MARKET: VENDOR SHARE ANALYSIS
FIGURE 13 U.S. LEATHER FURNITURE MARKET: SEGMENTATION
FIGURE 14 THE RISING LEVEL OF DISPOSABLE INCOME OF PEOPLE AND CONTINUOUS CHANGING LIFESTYLE IS EXPECTED TO DRIVE THE U.S. LEATHER FURNITURE MARKET IN THE FORECAST PERIOD OF 2022 TO 2029
FIGURE 15 FULL GRAIN SEGMENT IS EXPECTED TO ACCOUNT FOR THE LARGEST SHARE OF THE U.S. LEATHER FURNITURE MARKET IN 2022 & 2029
FIGURE 16 U.S. LEATHER FURNITURE MARKET: PRODUCT ADOPTION SCENARIO
FIGURE 17 U.S. LEATHER FURNITURE MARKET: TYPES OF CONSUMER BUYING BEHAVIOUR
FIGURE 18 DRIVERS, RESTRAINTS, OPPORTUNITIES, AND CHALLENGES OF U.S. LEATHER FURNITURE MARKET
FIGURE 19 URBANIZATION IN DIFFERENT REGIONS
FIGURE 20 RENTER OCCUPIED HOUSING UNITS IN U.S. IN QUARTER FOUR OF 2015 TO 2021
FIGURE 21 U.S. LEATHER FURNITURE MARKET, BY CATEGORY, 2021
FIGURE 22 U.S. LEATHER FURNITURE MARKET, BY FINISH, 2021
FIGURE 23 U.S. LEATHER FURNITURE MARKET, BY PRODUCT, 2021
FIGURE 24 U.S. LEATHER FURNITURE MARKET, BY APPLICATION, 2021
FIGURE 25 U.S. LEATHER FURNITURE MARKET, BY DISTRIBUTION CHANNEL, 2021
FIGURE 26 USA LEATHER FURNITURE MARKET: COMPANY SHARE 2021 (%)

Metodología de investigación
La recopilación de datos y el análisis del año base se realizan utilizando módulos de recopilación de datos con muestras de gran tamaño. La etapa incluye la obtención de información de mercado o datos relacionados a través de varias fuentes y estrategias. Incluye el examen y la planificación de todos los datos adquiridos del pasado con antelación. Asimismo, abarca el examen de las inconsistencias de información observadas en diferentes fuentes de información. Los datos de mercado se analizan y estiman utilizando modelos estadísticos y coherentes de mercado. Además, el análisis de la participación de mercado y el análisis de tendencias clave son los principales factores de éxito en el informe de mercado. Para obtener más información, solicite una llamada de un analista o envíe su consulta.
La metodología de investigación clave utilizada por el equipo de investigación de DBMR es la triangulación de datos, que implica la extracción de datos, el análisis del impacto de las variables de datos en el mercado y la validación primaria (experto en la industria). Los modelos de datos incluyen cuadrícula de posicionamiento de proveedores, análisis de línea de tiempo de mercado, descripción general y guía del mercado, cuadrícula de posicionamiento de la empresa, análisis de patentes, análisis de precios, análisis de participación de mercado de la empresa, estándares de medición, análisis global versus regional y de participación de proveedores. Para obtener más información sobre la metodología de investigación, envíe una consulta para hablar con nuestros expertos de la industria.
Personalización disponible
Data Bridge Market Research es líder en investigación formativa avanzada. Nos enorgullecemos de brindar servicios a nuestros clientes existentes y nuevos con datos y análisis que coinciden y se adaptan a sus objetivos. El informe se puede personalizar para incluir análisis de tendencias de precios de marcas objetivo, comprensión del mercado de países adicionales (solicite la lista de países), datos de resultados de ensayos clínicos, revisión de literatura, análisis de mercado renovado y base de productos. El análisis de mercado de competidores objetivo se puede analizar desde análisis basados en tecnología hasta estrategias de cartera de mercado. Podemos agregar tantos competidores sobre los que necesite datos en el formato y estilo de datos que esté buscando. Nuestro equipo de analistas también puede proporcionarle datos en archivos de Excel sin procesar, tablas dinámicas (libro de datos) o puede ayudarlo a crear presentaciones a partir de los conjuntos de datos disponibles en el informe.


