

Mercado de sabores de alimentos de América del Norte, por tipo de producto (extracto natural, ingrediente de sabor), tipo (sabores de frutas, sabores de especias, sabores de hierbas, sabores cítricos , sabores lácteos , sabores de nueces, extractos vegetales, sabores de café, sabor a chocolate, derivados de dátiles, aceites vegetales, derivados de algarroba, otros), origen (natural, idéntico al natural, artificial), categoría (etiqueta limpia, estable al calor, regular, no alergénico, otros), solubilidad (soluble en agua, soluble en aceite, dispersable en grasa, otros), forma (líquido, polvo, jarabe), aplicación (confitería, panadería, comida preparada, bocadillos y bocadillos extruidos, productos de postres congelados, productos de carne y aves de corral, cereales para el desayuno, alimentos procesados, alimentos para bebés, nutrición deportiva, suplementos dietéticos, bebidas) - Tendencias de la industria y pronóstico hasta 2030.
Análisis y perspectivas del mercado de sabores alimentarios de América del Norte
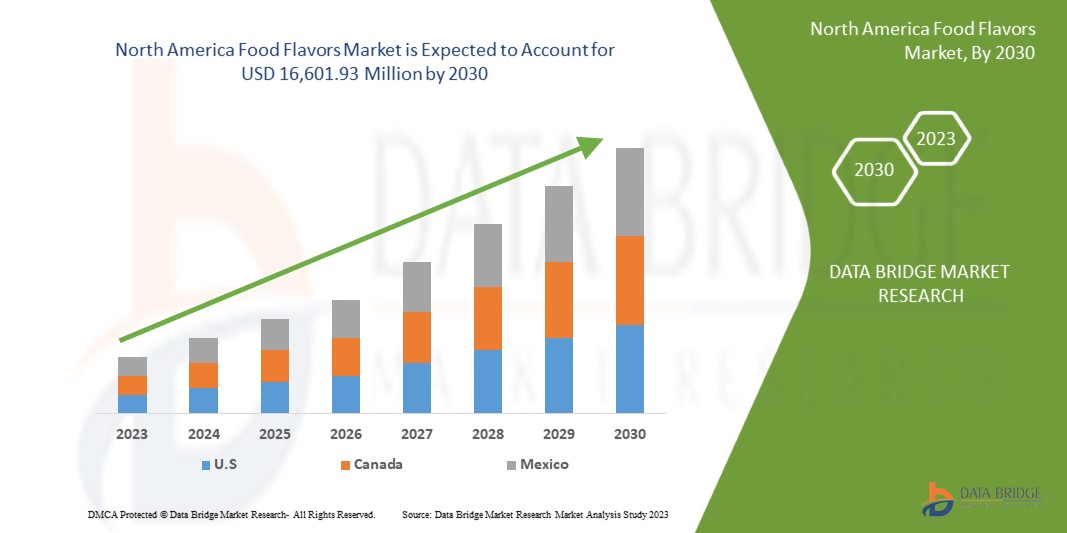
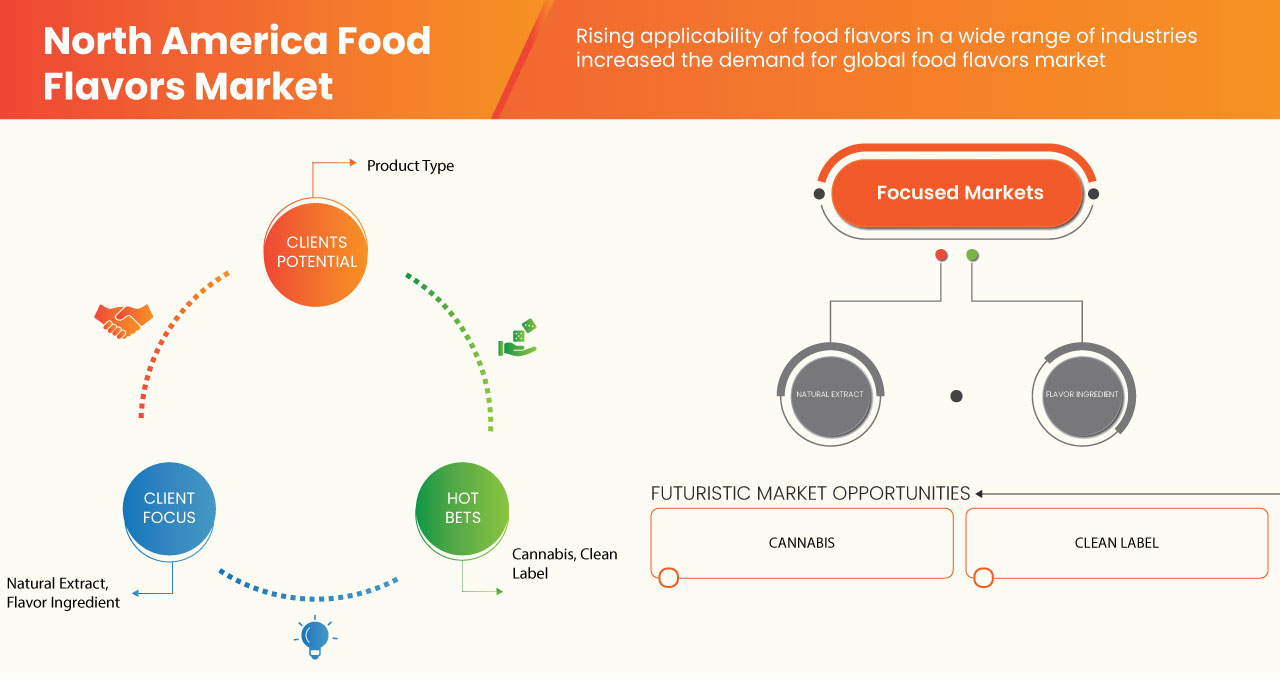
Los sabores de alimentos se aplican rutinariamente a los alimentos para mejorar su sabor. Los principales aditivos de sabor son sabores sintéticos y naturales. Los alimentos perecederos, después de procesarse y conservarse, tienden a perder su sabor con el tiempo, lo que provoca la necesidad de utilizar sustancias aromatizantes para ayudar a retener el sabor. La industria de alimentos y bebidas necesita sabores por una variedad de razones, incluida la creación de nuevos productos, la incorporación de nuevas ofertas de productos y la modificación de los sabores de los productos existentes. La alta demanda de nuevos sabores y el crecimiento continuo de la industria de alimentos y bebidas son precisamente lo que impulsa la expansión del mercado. Además, durante el período proyectado, se anticipa que el mercado de sabores de alimentos experimente un crecimiento debido a un aumento en la demanda del sector de comida rápida.
Data Bridge Market Research analiza que se espera que el mercado de sabores de alimentos de América del Norte alcance un valor de USD 16.601,93 millones para 2030, a una CAGR del 6,3% durante el período de pronóstico. Los extractos naturales representan el segmento de tipo de producto más grande en el mercado debido a su sabor natural y beneficios para la salud, mientras que los sabores naturales a menudo contienen una combinación de compuestos vegetales aislados para recrear el sabor de productos frescos o alimentos cocidos que aceleraron la demanda de extractos o sabores naturales en el mercado de sabores de alimentos.
|
Métrica del informe |
Detalles |
|
Período de pronóstico |
2023 a 2030 |
|
Año base |
2022 |
|
Años históricos |
2021 (Personalizable para 2015-2020) |
|
Unidades cuantitativas |
Ingresos en millones de USD, precios en USD |
|
Segmentos cubiertos |
Por tipo de producto (extracto natural, ingrediente de sabor), tipo (sabores de frutas, sabores de especias, sabores de hierbas, sabores cítricos, sabores lácteos, sabores de nueces, extractos vegetales, sabores de café, sabor a chocolate, derivados de dátiles, aceites vegetales, derivados de algarroba, otros), origen (natural, idéntico al natural, artificial), categoría (etiqueta limpia, estable al calor, regular, no alergénico, otros), solubilidad (soluble en agua, soluble en aceite, dispersable en grasa, otros), forma (líquido, polvo, jarabe), aplicación (confitería, panadería, comida preparada, bocadillos y bocadillos extruidos, productos de postres congelados, productos de carne y aves de corral, cereales para el desayuno, alimentos procesados, alimentos para bebés, nutrición deportiva, suplementos dietéticos , bebidas) |
|
Países cubiertos |
Estados Unidos, Canadá, México |
|
Actores del mercado cubiertos |
McCormick & Company, Inc., MartinBauer, Prinova Group LLC., Synthite Industries Ltd., GOLD COAST INGREDIENTS, INC., HHOYA, Sensient Technologies Corporation, International Flavors & Fragrances Inc, Axxence Aromatic GmbH, Huabao International Holdings Limited, Blue Pacific Flavors, Inc, ADM, Capella Flavors, Inc., FLAVOR PRODUCERS, LLC, Firmenich SA., CUSTOM FLAVORS, FLAVORCAN INTERNATIONAL INC., Döhler, Abelei Inc, Trilogy Flavors, Givaudan, Stringer Flavor. Lt, Cargill, Incorporate, Synergy Flavor, Kerry Group plc, Taiyo International, T. Hasegawa USA Inc, Flavorchem & Orchidia Fragrance, Honeyberry International LLP, San-Ei Gen FFI, Inc., MANE y otros. |
Definición de mercado
Los aromas alimentarios son ingredientes que se utilizan para realzar el sabor o el aroma de los alimentos y las bebidas. Modifican la percepción de los alimentos y aumentan el interés del consumidor. Estos aditivos alimentarios desempeñan un papel importante en la aceptación del producto y, por lo tanto, han ganado una enorme popularidad en todo el mundo.
Sabor innovador para satisfacer los cambios en los requisitos de gusto de los clientes. Las aplicaciones de tecnologías avanzadas proporcionan sabores innovadores y novedosos en los alimentos. Se espera que el mercado de sabores alimentarios de América del Norte crezca en el año de pronóstico debido al aumento de los actores del mercado y la disponibilidad de servicios avanzados. Junto con esto, los fabricantes están involucrados en la actividad de I+D para lanzar nuevos agentes aromatizantes al mercado. Se espera que la creciente investigación en el campo de la industria alimentaria impulse aún más el crecimiento del mercado. Sin embargo, se espera que las estrictas regulaciones gubernamentales y los efectos adversos de los sabores sintéticos en la salud humana obstaculicen el crecimiento del mercado de sabores alimentarios de América del Norte en el período de pronóstico.
Dinámica del mercado de sabores alimentarios en América del Norte
En esta sección se aborda la comprensión de los factores impulsores, las ventajas, las oportunidades, las limitaciones y los desafíos del mercado. Todo esto se analiza en detalle a continuación:
Conductores
- Demanda creciente de diferentes sabores en alimentos y bebidas, panadería y otras industrias diversas debido a sus beneficios para la salud.
Los fabricantes de alimentos y bebidas han utilizado sabores artificiales durante décadas, y estos brindan importantes beneficios. También permiten que las personas disfruten de una variedad de sabores de alimentos incluso cuando no son de temporada. Los sabores pueden ayudar a mantener la comida placentera, con un sabor verdaderamente auténtico y sin notas desagradables. Los diferentes sabores de alimentos frutales y naturales se han vuelto más populares en las industrias alimentarias debido a sus diferentes sabores y fragancias y sus beneficios para la salud. Los sabores artificiales son aquellos que no se extraen de la naturaleza, sino que se reproducen en el laboratorio. En general, se asume que lo "natural" es mejor, pero la ciencia de los sabores es tan avanzada que muchos sabores artificiales en realidad tienen exactamente la misma estructura química que los que se producen de forma natural. Los sabores a menudo no son una sola sustancia química, sino una combinación de sustancias químicas.
Los sabores frutales tienen una gran demanda en las industrias de alimentos y bebidas, principalmente debido al compuesto químico propionato de etilo. El sabor a fruta es una combinación de sensaciones de aroma y sabor. La conjugación de azúcares, ácidos, fenólicos y cientos de compuestos volátiles contribuyen al sabor a fruta. Estos incluyen sabores de tipo cítrico y sabores de tipo bayas. Estos incluyen pomelo, naranja, manzana, plátano, etc. Aquí me gustaría proporcionar un ejemplo de agua infusionada con sabor a fruta disponible en el mercado que tiene una gran demanda ya que proporciona varios beneficios para la salud:
Por lo tanto, la creciente demanda de diferentes sabores en todos los grupos de edad por sus propiedades beneficiosas para la salud y sus gustos está aumentando la demanda de sabores en el mercado de alimentos y, por lo tanto, se espera que impulse el mercado de sabores de alimentos de América del Norte.
- Inclinación del consumidor hacia los sabores florales y naturales
A los productos de panadería se les añaden diferentes aromas naturales florales y frutales, lo que aporta un aroma y un sabor naturales a los consumidores. Los aromas frutales suelen prepararse con productos naturales y combinarse con aromas botánicos para dar un aroma natural a los productos comestibles. En los últimos años, los aromas florales y naturales han pasado de ser un sector de nicho a un gran mercado. La mayoría de las esencias florales se utilizan en productos horneados y la tasa de crecimiento de estos aromas.
Algunos ejemplos de los sabores utilizados en los productos de panadería son las galletas de limón y lavanda, el helado de miel y lavanda, la granola de limón y violeta, los malvaviscos de mora y rosa, entre otros. La adopción de los sabores florales como tendencia se atribuye a la disposición del consumidor a gastar en productos alimenticios e ingredientes naturales.
A medida que aumenta la demanda de diferentes sabores y la adopción de diferentes sabores por parte de una gran población, se atribuye a la disposición del consumidor a gastar en productos e ingredientes alimenticios naturales. La demanda de nuevos sabores está aumentando de manera integral por parte de la población y, por lo tanto, se espera que impulse el mercado de sabores alimentarios de América del Norte.
Oportunidad
-
AUMENTO DEL NÚMERO DE LANZAMIENTOS DE NUEVOS SABORES EN ALIMENTOS Y BEBIDAS NUTRICIONALES
Las bebidas nutritivas están en auge en América del Norte debido a su variedad de sabores, beneficios para la salud y excelente sabor. Los actores del mercado de sabores alimentarios de América del Norte. Además, los actores están lanzando constantemente nuevos sabores para alimentos al mercado.
Una parte esencial del plan de lanzamiento es validar el producto y sus beneficios rápidamente. Esto se hace mediante el Net Promoter Score (NPS), y el Customer Satisfaction Score (CSAT) puede verse alterado cuando se reciben comentarios negativos de usuarios que no están destinados a probar la primera versión de su producto o característica. De esta manera, los fabricantes de nuevos sabores para alimentos crean constantemente nuevas estrategias de lanzamiento que ayudan a la empresa a crecer.
De esta manera, las nuevas estrategias de lanzamiento se aplican en todo el mundo para impulsar el mercado. Esta es una oportunidad excepcional para los fabricantes, ya que estos lanzamientos explican el contenido y la calidad de los productos, lo que permite a los consumidores comprar más sabores para los alimentos.
Por lo tanto, se espera que el aumento en el número de lanzamientos de nuevos sabores para alimentos y bebidas nutricionales cree oportunidades para el mercado de sabores alimentarios de América del Norte en el período de pronóstico.
-
Adopción del cannabis como ingrediente natural para el desarrollo del sabor
Los terpenos y cannabinoides como el tetrahidrocannabinol (THC) y el cannabinol (CBD) tienen un enorme potencial de aplicación en la medicina y la salud. Además, los productos químicos derivados del cannabis tienen características únicas que pueden influir en los sabores distintivos de las comidas y bebidas. Se están realizando estudios para demostrar que el cannabis puede mejorar la respuesta gustativa y aumentar el atractivo sensorial de los alimentos. Además, la combinación de cannabis con ingredientes botánicos, como el ginseng, la ashwagandha y los cítricos, no solo crea nuevos perfiles de sabor, sino que también mejora el efecto del cannabis en la concentración, el sueño y el alivio del estrés. La adaptación del cannabis como ingrediente de sabor puede crear una oportunidad para que el mercado de los sabores de los alimentos crezca exponencialmente.
-
Por lo tanto, se espera que la adopción del cannabis como ingrediente natural para el desarrollo de sabores impulse el negocio en varias dimensiones y lidere el crecimiento del mercado de sabores alimentarios.
Restricción/Desafío
- Efectos secundarios causados por los sabores sintéticos
Las sustancias artificiales conocidas como sabores sintéticos se añaden a los alimentos para mejorar su sabor, su vida útil, su frescura y su valor nutricional. Además de en el yogur, las patatas fritas, el pan, los aderezos para ensaladas y los productos horneados, se pueden encontrar en muchos alimentos diferentes. Sin embargo, la evidencia de numerosos estudios científicos indica que los aditivos alimentarios artificiales pueden causar cáncer. En particular, los nitritos y nitratos, que suelen estar presentes en las carnes procesadas, se han asociado con un riesgo elevado de cáncer colorrectal cuando se consumen en cantidades elevadas. Se están realizando investigaciones relacionadas con el impacto de los aditivos alimentarios artificiales en los problemas de conducta o las anomalías del desarrollo neurológico de los niños. Los efectos perjudiciales de los sabores sintéticos pueden, por tanto, frenar el crecimiento del mercado de los sabores alimentarios.
Otros riesgos de los sabores artificiales incluyen su capacidad de engañar a nuestro cerebro para que prefiera su sabor al de los alimentos integrales. Descuidar los alimentos ricos en nutrientes puede conducir a una serie de deficiencias nutricionales, que están vinculadas a una gran cantidad de problemas de salud.
Los efectos secundarios nocivos pueden generar temor en la población en relación con los aromas alimentarios. Además, afectan a la credibilidad de los fabricantes de aromas alimentarios sintéticos, lo que afecta a las ventas de los productos. Por lo tanto, los efectos secundarios provocados por los aromas sintéticos pueden obstaculizar el crecimiento del mercado de los aromas alimentarios.
Acontecimientos recientes
- En febrero de 2022, Kerry anunció que había realizado dos importantes adquisiciones biotecnológicas que ampliarán su experiencia, su cartera de tecnologías y sus capacidades de fabricación. La empresa anunció que había llegado a un acuerdo para adquirir la empresa líder en innovación biotecnológica, c-LEcta, y también confirmó que había adquirido el fabricante de enzimas con sede en México, Enmex. Esta combinación estratégicamente atractiva con Kerry acelerará las capacidades de innovación en ingeniería de enzimas, fermentación y desarrollo de bioprocesos.
- En mayo de 2022, Givaudan anuncia el desarrollo de Customer Foresight, que combina las tecnologías de datos más avanzadas con la información y el conocimiento de los expertos de Givaudan para ayudar a los clientes a satisfacer las necesidades futuras de los consumidores.
- En mayo de 2022, Symrise presenta una visión general de los desarrollos actuales y futuros en alimentos y bebidas. El estudio combina métodos de investigación cualitativos y cuantitativos y sirve como base importante para el desarrollo de soluciones de sabor, nutrición y salud preferidas por los consumidores. Esto identifica las tendencias actuales de los clientes en alimentos y bebidas.
- En noviembre de 2022, Mane anunció la instalación de un nuevo centro de innovación de sabores en Hyderabad. El centro de innovación, que ocupa una superficie de 13.900 pies cuadrados en una zona de alta tecnología, se centrará en el desarrollo de sabores de principio a fin para atender al mercado de alimentos y bebidas en la India y otros mercados de Asia y el Pacífico.
Alcance del mercado de sabores alimentarios en América del Norte
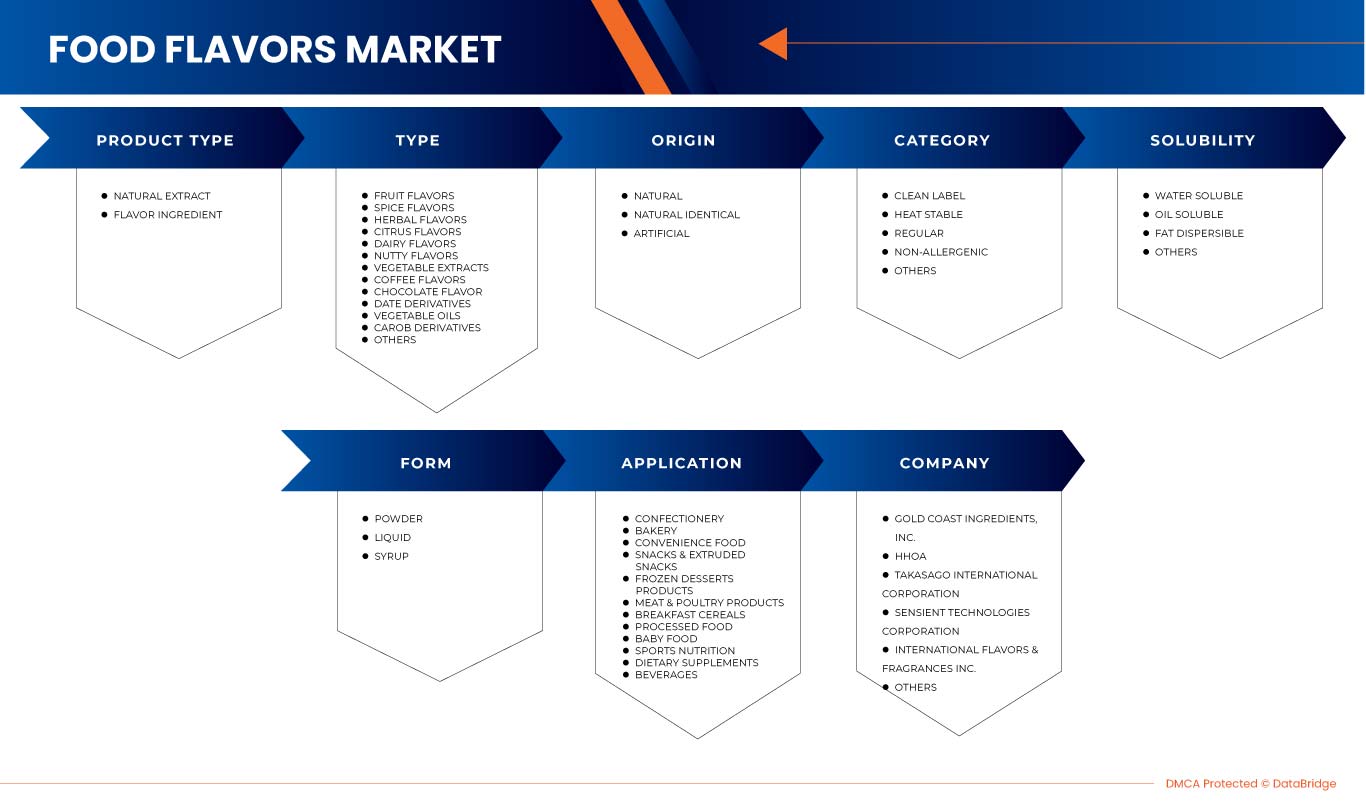
El mercado de sabores alimentarios de América del Norte está segmentado en seis segmentos notables según el tipo de producto, el tipo, el origen, la categoría, la solubilidad y la aplicación. El crecimiento entre segmentos le ayuda a analizar nichos de crecimiento y estrategias para abordar el mercado y determinar sus áreas de aplicación principales y la diferencia en sus mercados objetivo.
POR TIPO DE PRODUCTO
- Extracto natural
- Ingrediente de sabor
Sobre la base del tipo de producto, el mercado de sabores alimentarios de América del Norte está segmentado en extracto natural e ingrediente saborizante.
POR TIPO
- Sabores de frutas
- Sabores de especias
- Sabores a base de hierbas
- Sabores cítricos
- Sabores lácteos
- Sabores de nueces
- Extractos vegetales
- Sabores de café
- Sabor a chocolate
- Derivados de fecha
- Aceites vegetales
- Derivados de la algarroba
- Otros
On the basis of type, the North America food flavors market is segmented into fruit flavors, spice flavors, herbal flavors, citrus flavors, dairy flavors, nutty flavors, vegetable extracts, coffee flavors, chocolate flavor, date derivatives, vegetable oils, carob derivatives and others.
BY ORIGIN
- Natural
- Natural Identical
- Artificial
On the basis of origin, the North America food flavors market is segmented into natural, natural identical and artificial.
BY CATEGORY
- Clean Label
- Heat Stable
- Regular
- Non-Allergenic
- Others
On the basis of category, the North America food flavors market is segmented into clean label, heat stable, regular, non-allergenic, and others.
BY SOLUBILITY
- Water Soluble
- Oil Soluble
- Fat Dispersible
- Others
On the basis of solubility, the North America food flavors market is segmented into water soluble, oil soluble, fat dispersible and others.
BY APPLICATION
- Confectionery
- Bakery
- Convenience Food
- Snacks & Extruded Snacks
- Frozen Desserts Products
- Meat & Poultry Products
- Breakfast Cereals
- Processed Food
- Baby Food
- Sports Nutrition
- Dietary Supplements
- Beverages
On the basis of application, the North America food flavors market is segmented into confectioner, baker, convenience food, snacks & extruded snacks, frozen desserts product, meat & poultry products, breakfast cereal, processed food, baby food, sports nutrition, dietary supplements, beverages.
North America Food Flavors Market Regional Analysis/Insights
The North America food flavors market is segmented into six notable segments based on product type, type, origin, category, solubility and application.
Some countries covered in this North America market report are the U.S., Canada, Mexico.
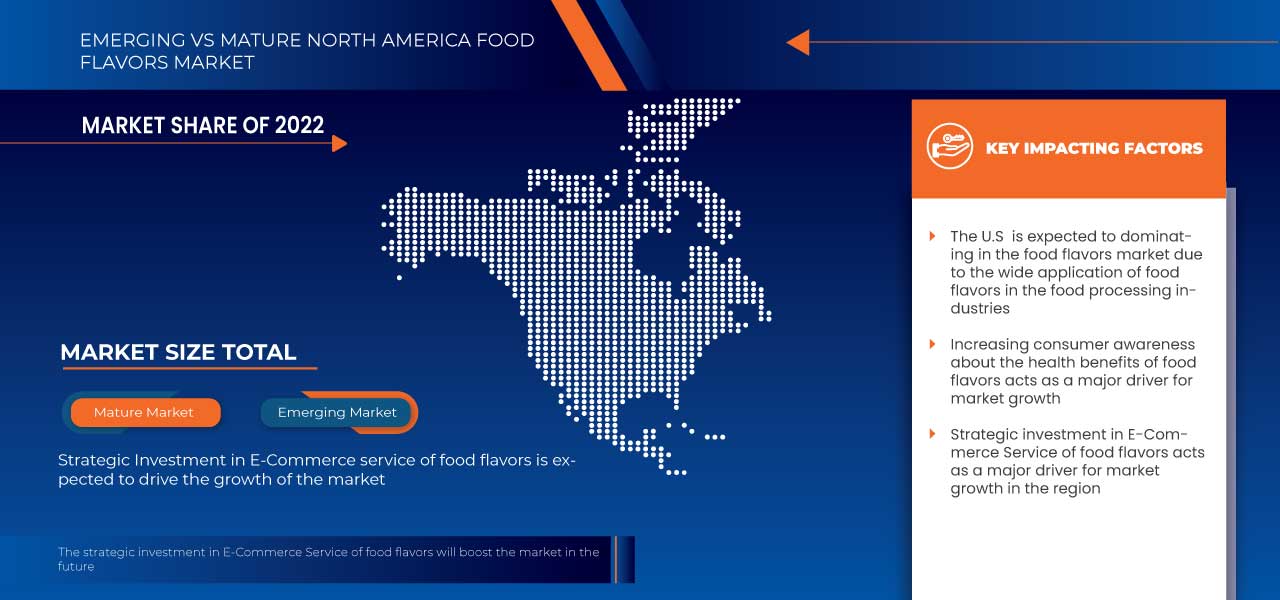
The U.S. dominates the North America region due to strong presence of key players due to increasing customer inclinations towards natural and authentic flavors.
The country section of the report also provides individual market impacting factors and changes in regulation in the market domestically that impact the current and future trends of the market. Data points such as new sales, replacement sales, country demographics, regulatory acts, and import-export tariffs are some of the major pointers used to forecast the market scenario for individual countries. Also, presence and availability of North American brands and their challenges faced due to large or scarce competition from local and domestic brands, and the impact of sales channels are considered while providing forecast analysis of the country data.
Competitive Landscape and North America Food Flavors Market Share Analysis
El panorama competitivo del mercado de sabores alimentarios de América del Norte proporciona detalles por competidor. Los detalles incluidos son una descripción general de la empresa, las finanzas de la empresa, los ingresos generados, el potencial de mercado, la inversión en I+D, las nuevas iniciativas de mercado, los sitios e instalaciones de producción, las fortalezas y debilidades de la empresa, el lanzamiento de productos, las aprobaciones de productos, la amplitud y amplitud de los productos, el dominio de las aplicaciones y la curva de vida del tipo de producto. Los puntos de datos anteriores proporcionados solo están relacionados con el enfoque de la empresa en el mercado de sabores alimentarios de América del Norte.
Algunos de los principales actores que operan en el mercado son McCormick & Company, Inc., MartinBauer, Prinova Group LLC., Synthite Industries Ltd., GOLD COAST INGREDIENTS, INC., HHOYA, Sensient Technologies Corporation, International Flavors & Fragrances Inc, Axxence Aromatic GmbH, Huabao International Holdings Limited, Blue Pacific Flavors, Inc, ADM, Capella Flavors, Inc., FLAVOR PRODUCERS, LLC, Firmenich SA., CUSTOM FLAVORS, FLAVORCAN INTERNATIONAL INC., Döhler, Abelei Inc, Trilogy Flavors, Givaudan, Stringer Flavor. Lt, Cargill, Incorporate, Synergy Flavor, Kerry Group plc, Taiyo Internationa, T.Hasegawa USA Inc, Flavorchem & Orchidia Fragrance, Honeyberry International LLP, San-Ei Gen FFI, Inc., MANE y entre otros.
SKU-
Obtenga acceso en línea al informe sobre la primera nube de inteligencia de mercado del mundo

- Panel de análisis de datos interactivo
- Panel de análisis de empresas para oportunidades con alto potencial de crecimiento
- Acceso de analista de investigación para personalización y consultas
- Análisis de la competencia con panel interactivo
- Últimas noticias, actualizaciones y análisis de tendencias
- Aproveche el poder del análisis de referencia para un seguimiento integral de la competencia
Tabla de contenido
1 INTRODUCTION
1.1 OBJECTIVES OF THE STUDY
1.2 MARKET DEFINITION
1.3 OVERVIEW OF THE NORTH AMERICA FOOD FLAVORS MARKET
1.4 LIMITATIONS
1.5 MARKETS COVERED
2 MARKET SEGMENTATION
2.1 MARKETS COVERED
2.2 GEOGRAPHICAL SCOPE
2.3 YEARS CONSIDERED FOR THE STUDY
2.4 CURRENCY AND PRICING
2.5 DBMR TRIPOD DATA VALIDATION MODEL
2.6 MULTIVARIATE MODELLING
2.7 PRODUCT LIFELINE CURVE
2.8 PRIMARY INTERVIEWS WITH KEY OPINION LEADERS
2.9 DBMR MARKET POSITION GRID
2.1 VENDOR SHARE ANALYSIS
2.11 MARKET END COVERAGE GRID
2.12 SECONDARY SOURCES
2.13 ASSUMPTIONS
3 EXECUTIVE SUMMARY
4 PREMIUM INSIGHT
4.1 VALUE CHAIN ANALYSIS
4.2 SUPPLY CHAIN ANALYSIS
4.2.1 MAJOR FUNCTIONARIES INVOLVED IN THE SUPPLY CHAIN OF SPICES.
4.2.1.1 PRODUCER:
4.2.1.2 COMMISSION AGENT:
4.2.1.3 TRADER/EXPORTER:
4.2.1.4 WHOLESALER:
4.2.1.5 PROCESSOR:
4.2.1.6 RETAILER:
4.2.1.7 FINAL USERS:
4.3 IMPORT-EXPORT ANALYSIS
4.3.1 IMPORT (AUGUST 2022)
4.3.1.1 VIETNAM (FEBRUARY 2023)
4.3.1.2 INDIA (FEBRUARY 2023)
4.3.1.3 PHILIPPINES (FEBRUARY 2023)
4.3.2 EXPORT (TILL AUGUST 2022)
4.3.2.1 THAILAND (FEBRUARY 2023)
4.3.2.2 INDONESIA (FEBRUARY 2023)
4.3.2.3 SINGAPORE (FEBRUARY 2023)
4.4 PORTER’S FIVE FORCES
4.4.1 BARGAINING POWER OF BUYERS/CONSUMERS
4.4.2 BARGAINING POWER OF SUPPLIERS
4.4.3 THREAT OF NEW ENTRANTS
4.4.4 THREAT OF SUBSTITUTES
4.4.5 RIVALRY AMONG EXISTING COMPETITORS
4.5 RAW MATERIAL SOURCING ANALYSIS
4.5.1 FLAVOR INDUSTRY
4.5.1.1 NATURAL FLAVORING MATERIALS
4.6 OVERVIEW OF TECHNOLOGICAL INNOVATIONS
4.7 INDUSTRY TRENDS AND FUTURE PERSPECTIVE
4.8 GROWTH STRATEGIES ADOPTED BY KEY MARKET PLAYERS
4.9 FACTORS INFLUENCING PURCHASING DECISION OF END-USER
4.9.1 NEW FLAVOURS
4.9.2 ONLINE PLATFORMS
4.9.3 QUALITY INGREDIENTS
4.1 LIST OF COMPANIES PRODUCING NATURAL EXTRACT
4.11 IMPACT OF ECONOMIC SLOWDOWN ON MARKET
4.12 OVERVIEW
4.12.1 IMPACT ON PRICE
4.12.2 IMPACT ON SUPPLY CHAIN
4.12.3 IMPACT ON SHIPMENT
4.12.4 IMPACT ON COMPANY’S STRATEGIC DECISIONS
4.13 LIST OF KEY CUSTOMERS BY GEOGRAPHY
4.13.1 NORTH AMERICA
4.13.2 EUROPE
4.13.3 ASIA- PACIFIC
4.13.4 MIDDLE EAST AND AFRICA
4.13.5 SOUTH AFRICA
5 NATURAL INGREDIENTS USED AS FOOD FLAVORS CAN ALSO BE USED IN FEED FLAVORS
5.1 OVERVIEW
5.2 PRICING INDEX
5.3 OVERVIEW
5.4 PRICE AT B2B
5.5 PRICE AT FOB
5.6 PRODUCTION CAPACITY OF KEY MANUFACTURERS
5.7 OVERVIEW
6 REGULATORY FRAMEWORK AND GUIDELINES
7 MARKET OVERVIEW
7.1 DRIVERS
7.1.1 INCREASING DEMAND FOR DIFFERENT FLAVORS IN FOOD AND BEVERAGE, BAKERY AND OTHER SEVERAL INDUSTRIES DUE TO THEIR HEALTH BENEFITS
7.1.2 CONSUMER INCLINATION TOWARD FLORAL AND NATURAL FLAVOURS
7.1.3 EXPANSION OF FOOD & BEVERAGE, BAKERY, AMONG OTHER INDUSTRIES
7.1.4 INCREASING DEMAND FOR FLAVOR-BASED VEGAN OR PLANT-BASED NUTRITIONAL FOOD AND BEVERAGES
7.2 RESTRAINTS
7.2.1 INCREASING REGULATION ON FLAVORED FORTIFIED FOOD
7.2.2 HIGHER PRICES OF FLAVORED NUTRITIONAL PRODUCTS
7.3 OPPORTUNITIES
7.3.1 INCREASE IN THE NUMBER OF LAUNCHES OF NEW FLAVOURS IN NUTRITIONAL FOOD AND BEVERAGES
7.3.2 ADOPTION OF CANNABIS AS A NATURAL INGREDIENT FOR FLAVOR DEVELOPMENT
7.4 CHALLENGES
7.4.1 SIDE EFFECTS CAUSED BY SYNTHETIC FLAVORS
8 NORTH AMERICA FOOD FLAVORS MARKET, BY PRODUCT TYPE
8.1 OVERVIEW
8.2 NATURAL EXTRACT
8.3 FLAVOR INGREDIENT
9 NORTH AMERICA FOOD FLAVORS MARKET, BY TYPE
9.1 OVERVIEW
9.2 FRUIT FLAVORS
9.2.1 TYPE
9.2.1.1 BERRIES
9.2.1.1.1 STRAWBERRY
9.2.1.1.2 BLUEBERRY
9.2.1.1.3 RASPBERRY STRAWBERRY
9.2.1.1.4 BLACKCURRANT
9.2.1.1.5 RED RASPBERRY
9.2.1.1.6 BLACK RASPBERRY
9.2.1.1.7 GRAPES
9.2.1.1.8 CRANBERRY
9.2.1.1.9 GOOSEBERRY
9.2.1.1.10 ACAI BERRY
9.2.1.1.11 GOJI BERRY
9.2.1.1.12 MARIONBERRY
9.2.1.1.13 MULBERRY
9.2.1.1.14 ARONIA BERRY
9.2.1.1.15 CITRUS BERRY
9.2.1.2 APPLE
9.2.1.3 BANANA
9.2.1.4 MANGO
9.2.1.5 PLUM
9.2.1.6 NECTARINES
9.2.1.7 PAPAYA
9.2.1.8 CANTALOUPE
9.2.1.9 HONEYDEW
9.2.1.10 APRICOT
9.2.1.11 PASSIONFRUIT
9.2.2 PRODUCT TYPE
9.2.2.1 NATURAL EXTRACT
9.2.2.2 FLAVOR INGREDIENT
9.2.3 SPICE FLAVORS
9.2.3.1 GINGER
9.2.3.2 PEPPER
9.2.3.3 CINNAMON
9.2.3.4 MUSTARD
9.2.3.5 TURMERIC
9.2.3.6 CARDAMOM
9.2.3.7 CUMIN
9.2.3.8 CORIANDER
9.2.3.9 CLOVES
9.2.3.10 NUTMEG
9.2.3.11 FENNEL
9.2.3.12 FENUGREEK
9.2.3.13 SAFFRON
9.2.3.14 OTHERS
9.2.4 PRODUCT TYPE
9.2.4.1 NATURAL EXTRACT
9.2.4.2 FLAVOR INGREDIENT
9.2.5 HERBAL FLAVORS
9.2.5.1 MINT
9.2.5.2 PEPPERMINT
9.2.5.3 SPEARMINT
9.2.5.4 WINTERGREEN
9.2.5.5 MENTHOL
9.2.5.6 BASIL
9.2.5.7 OREGANO
9.2.5.8 THYM
9.2.5.9 SAGE
9.2.5.10 ROSE ROSEMARY
9.2.5.11 LAVENDER
9.2.5.12 CHAMOMILE
9.2.5.13 GREEN TEA
9.2.5.14 HIBISCUS JASMINE
9.2.5.15 BERGAMOT
9.2.5.16 ORANGE BLOSSOM
9.2.5.17 VERBENA
9.2.5.18 SARSAPARILLA
9.2.5.19 SASSAFRAS
9.2.5.20 ALOE VERA
9.2.5.21 BLACK TEA
9.2.5.22 EUCALYPTUS
9.2.5.23 OTHERS
9.2.6 PRODUCT TYPE
9.2.6.1 NATURAL EXTRACT
9.2.6.2 FLAVOR INGREDIENT
9.2.7 CITRUS FLAVORS
9.2.7.1 ORANGE
9.2.7.2 LEMON
9.2.7.3 LIME MANDARIN ORANGE
9.2.7.4 TANGERINE
9.2.7.5 GRAPEFRUIT
9.2.7.6 BLOOD ORANGE
9.2.7.7 KEY LIMEKUMQUAT
9.2.7.8 OTHERS
9.2.8 PRODUCT TYPE
9.2.8.1 NATURAL EXTRACT
9.2.8.2 FLAVOR INGREDIENT
9.2.9 DAIRY FLAVORS
9.2.9.1 CREAM
9.2.9.2 BUTTER FLAVOR
9.2.9.2.1 MEDIUM BUTTERY FLAVOR NOTES
9.2.9.2.2 MEDIUM STRONG BUTTERY FLAVOR NOTES
9.2.9.2.3 STRONG BUTTERY FLAVOR NOTES
9.2.9.2.4 OTHERS
9.2.9.3 WHIPPED CREAM
9.2.9.4 BAVARIAN CREAM
9.2.9.5 CREAM CHEESE ICE CREAM
9.2.9.6 NUTELLA TYPE SWEET CREAM
9.2.9.7 YOGURT TYPE
9.2.9.8 WHITE CHOCOLATE
9.2.9.9 IRISH CREAM
9.2.9.10 MOCHA
9.2.9.11 OTHERS
9.2.10 PRODUCT TYPE
9.2.10.1 NATURAL EXTRACT
9.2.10.2 FLAVOR INGREDIENT
9.2.11 NUTTY FLAVORS
9.2.11.1 ALMOND
9.2.11.2 CASHEW
9.2.11.3 HAZELNUT MACADAMIA NUT
9.2.11.4 PEANUT
9.2.11.5 PISTACHIO
9.2.11.6 WALNUT
9.2.11.7 PECAN PINE NUT
9.2.11.8 OTHERS
9.2.12 PRODUCT TYPE
9.2.12.1 NATURAL EXTRACT
9.2.12.2 FLAVOR INGREDIENT
9.2.13 VEGETABLE FLAVORS
9.2.13.1 GARLIC
9.2.13.2 TOMATO
9.2.13.3 MUSHROOM
9.2.13.4 ONION
9.2.13.5 CUCUMBER
9.2.13.6 WATERMELON
9.2.13.7 CHERRY TOMATO
9.2.13.8 TOMATO BASIL
9.2.13.9 OTHERS
9.2.14 PRODUCT TYPE
9.2.14.1 NATURAL EXTRACT
9.2.14.2 FLAVOR INGREDIENT
9.3 COFFEE FLAVORS
9.3.1 PRODUCT TYPE
9.3.1.1 NATURAL EXTRACT
9.3.1.2 FLAVOR INGREDIENT
9.4 CHOCOLATE FLAVORS
9.4.1 PRODUCT TYPE
9.4.1.1 NATURAL EXTRACT
9.4.1.2 FLAVOR INGREDIENT
9.5 DATE DERIVATIVES
9.5.1 PRODUCT TYPE
9.5.1.1 NATURAL EXTRACT
9.5.1.2 FLAVOR INGREDIENT
9.5.2 VEGETABLE OILS
9.5.2.1 CULINARY ARGON OIL
9.5.2.2 POMEGRANATE SEED OIL
9.5.2.3 NIGELLA SEEDS OIL
9.5.2.4 MELON SEEDS OIL
9.5.3 PRODUCT TYPE
9.5.3.1 NATURAL EXTRACT
9.5.3.2 FLAVOR INGREDIENT
9.5.4 CANOB DERIVATIVES
9.5.5 OTHERS
9.5.5.1 FLORAL HYDROLATES
9.5.5.2 OTHERS
10 NORTH AMERICA FOOD FLAVORS MARKET, BY ORIGIN
10.1 OVERVIEW
10.2 NATURAL
10.3 NATURAL IDENTICAL
10.4 ARTIFICIAL
11 NORTH AMERICA FOOD FLAVORS MARKET, BY CATEGORY
11.1 OVERVIEW
11.2 CLEAN LABEL
11.3 HEAT STABLE
11.4 REGULAR
11.5 NON-ALLERGIC
11.6 OTHERS
12 NORTH AMERICA FOOD FLAVORS MARKET, BY SOLUBILITY
12.1 OVERVIEW
12.2 WATER SOLUBLE
12.3 OIL SOLUBLE
12.4 FAT SOLUBLE
12.5 OTHERS
13 NORTH AMERICA FOOD FLAVORS MARKET, BY FORM
13.1 OVERVIEW
13.2 LIQUID
13.3 POWDER
13.4 SYRUP
14 NORTH AMERICA FOOD FLAVORS MARKET, BY APPLICATION
14.1 OVERVIEW
14.2 CONFECTIONERY
14.2.1 TYPE
14.2.1.1 HARD-BOILED SWEETS
14.2.1.2 GUMS & JELLIES
14.2.1.3 CHOCOLATE
14.2.1.4 MINTS
14.2.1.5 CARAMELS & TOFFEES
14.2.1.6 CHOCOLATE SYRUPS
14.2.1.7 OTHERS
14.2.2 FLAVOR TYPE
14.2.2.1 FRUIT FLAVORS
14.2.2.2 CITRUS FLAVORS
14.2.2.3 CHOCOLATE FLAVORS
14.2.2.4 DAIRY FLAVORS
14.2.2.5 SPICE FLAVORS
14.2.2.6 HERABL FLAVORS
14.2.2.7 NUTTY FLAVORS
14.2.2.8 COFFEE FLAVORS
14.2.2.9 DATE DERIVATIVES
14.2.2.10 VEGETABLE EXTRACTS
14.2.2.11 VEGETABLE OILS
14.2.2.12 OTHERS
14.2.3 PRODUCT TYPE
14.2.3.1 NATURAL EXTRACT
14.2.3.2 FLAVOR INGREDIENT
14.3 BAKERY
14.3.1 TYPE
14.3.1.1 BREAD & ROLLS
14.3.1.2 CAKES, PASTRIES & TRUFFLE
14.3.1.3 BISCUIT
14.3.1.4 TART & PIES
14.3.1.5 BROWNIES
14.3.1.6 COOKIES & CRACKERS
14.3.1.7 TORTILLA
14.3.1.8 OTHERS
14.3.2 FLAVORS TYPE
14.3.2.1 FRUIT FLAVORS
14.3.2.2 CHOCOLATE FLAVOR
14.3.2.3 SPICE FLAVORS
14.3.2.4 CITRUS FLAVORS
14.3.2.5 NUTTY FLAVORS
14.3.2.6 COFFEE FLAVORS
14.3.2.7 HERBAL FLAVORS
14.3.2.8 DAIRY FLAVORS
14.3.2.9 VEGETABLE EXTRACTS
14.3.2.10 DATE DERIVATIVES
14.3.2.11 VEGETABLE OILS
14.3.2.12 OTHERS
14.3.3 PRODUCT TYPE
14.3.3.1 NATURAL EXTRACT
14.3.3.2 FLAVOR INGREDIENT
14.4 CONVENIENCE FOOD
14.4.1 TYPE
14.4.1.1 INSTANT NOODLES
14.4.1.2 PIZZA & PASTA
14.4.1.3 FRENCH FRIES
14.4.1.4 NUGGETS
14.4.1.5 WEDGES
14.4.1.6 OTHERS
14.4.2 FLAVOR TYPE
14.4.2.1 DAIRY FLAVORS
14.4.2.2 FRUIT FLAVORS
14.4.2.3 CHOCOLATE FLAVOR
14.4.2.4 COFFEE FLAVORS
14.4.2.5 SPICE FLAVORS
14.4.2.6 CITRUS FLAVORS
14.4.2.7 HERBAL FLAVORS
14.4.2.8 NUTTY FLAVORS
14.4.2.9 VEGETABLE EXTRACTS
14.4.2.10 DATE DERIVATIVES
14.4.2.11 VEGETABLE OILS
14.4.2.12 OTHERS
14.4.3 PRODUCT TYPE
14.4.3.1 NATURAL EXTRACT
14.4.3.2 FLAVOR INGREDIENT
14.5 SNACKS & EXTRUDED SNACKS
14.5.1 FLAVOR TYPE
14.5.1.1 SPICE FLAVORS
14.5.1.2 DAIRY FLAVORS
14.5.1.3 VEGETABLE EXTRACTS
14.5.1.4 FRUIT FLAVORS
14.5.1.5 NUTTY FLAVORS
14.5.1.6 CITRUS FLAVORS
14.5.1.7 HERBAL FLAVORS
14.5.1.8 CHOCOLATE FLAVOR
14.5.1.9 COFFEE FLAVORS
14.5.1.10 DATE DERIVATIVES
14.5.1.11 VEGETABLE OILS
14.5.1.12 OTHERS
14.5.2 PRODUCT TYPE
14.5.2.1 NATURAL EXTRACT
14.5.2.2 FLAVOR INGREDIENT
14.6 FROZEN DESSERTS
14.6.1 TYPE
14.6.1.1 GELATO
14.6.1.2 FROZEN CUSTARD
14.6.1.3 SHERBETS
14.6.1.4 OTHERS
14.6.2 FLAVOR TYPE
14.6.2.1 FRUIT FLAVORS
14.6.2.2 DAIRY FLAVORS
14.6.2.3 CHOCOLATE FLAVOR
14.6.2.4 NUTTY FLAVORS
14.6.2.5 CITRUS FLAVORS
14.6.2.6 VEGETABLE EXTRACTS
14.6.2.7 COFFEE FLAVORS
14.6.2.8 SPICE FLAVORS
14.6.2.9 HERBAL FLAVORS
14.6.2.10 DATE DERIVATIVES
14.6.2.11 VEGETABLE OILS
14.6.2.12 OTHERS
14.6.3 PRODUCT TYPE
14.6.3.1 NATURAL EXTRACT
14.6.3.2 FLAVOR INGREDIENT
14.7 MEAT & POULTRY PRODUCTS
14.7.1 TYPE
14.7.1.1 CHICKEN
14.7.1.2 BEEF
14.7.1.3 PORK
14.7.1.4 SEAFOOD
14.7.1.5 LAMB
14.7.1.6 OTHERS
14.7.2 FLAVOR TYPE
14.7.2.1 SPICE FLAVORS
14.7.2.2 CITRUS FLAVORS
14.7.2.3 DAIRY FLAVORS
14.7.2.4 VEGETABLE EXTRACTS
14.7.2.5 NUTTY FLAVORS
14.7.2.6 CHOCOLATE FLAVOR
14.7.2.7 HERBAL FLAVORS
14.7.2.8 COFFEE FLAVORS
14.7.2.9 FRUIT FLAVORS
14.7.2.10 DATE DERIVATIVES
14.7.2.11 VEGETABLE OILS
14.7.2.12 OTHERS
14.7.3 PRODUCT TYPE
14.7.3.1 NATURAL EXTRACT
14.7.3.2 FLAVOR INGREDIENT
14.8 BREAKFAST CEREALS
14.8.1 FLAVOR TYPE
14.8.1.1 FRUIT FLAVORS
14.8.1.2 SPICE FLAVORS
14.8.1.3 DAIRY FLAVORS
14.8.1.4 NUTTY FLAVORS
14.8.1.5 HERBAL FLAVORS
14.8.1.6 CITRUS FLAVORS
14.8.1.7 VEGETABLE EXTRACTS
14.8.1.8 COFFEE FLAVORS
14.8.1.9 CHOCOLATE FLAVOR
14.8.1.10 DATE DERIVATIVES
14.8.1.11 VEGETABLE OILS
14.8.1.12 OTHERS
14.8.2 PRODUCT TYPE
14.8.2.1 NATURAL EXTRACT
14.8.2.2 FLAVOR INGREDIENT
14.9 PROCESSED FOOD
14.9.1 TYPE
14.9.1.1 READY MEALS
14.9.1.2 SAUCES, DRESSINGS AND CONDIMENTS
14.9.1.3 SOUPS
14.9.1.4 JAMS, PRESERVES & MARMALADES
14.9.1.5 CANNED FRUITS & VEGETABLES
14.9.1.6 FRUIT & VEGETABLE PUREE
14.9.1.7 PICKLES
14.9.1.8 OTHERS
14.9.2 FLAVOR TYPE
14.9.2.1 FRUIT FLAVORS
14.9.2.2 DAIRY FLAVORS
14.9.2.3 VEGETABLE EXTRACTS
14.9.2.4 SPICE FLAVORS
14.9.2.5 CITRUS FLAVORS
14.9.2.6 CHOCOLATE FLAVOR
14.9.2.7 COFFEE FLAVORS
14.9.2.8 NUTTY FLAVORS
14.9.2.9 HERBAL FLAVORS
14.9.2.10 DATE DERIVATIVES
14.9.2.11 VEGETABLE OILS
14.9.2.12 OTHERS
14.9.3 PRODUCT TYPE
14.9.3.1 NATURAL EXTRACT
14.9.3.2 FLAVOR INGREDIENT
14.1 BABY FOOD
14.10.1 FLAVOR TYPE
14.10.1.1 FRUIT FLAVORS
14.10.1.2 VEGETABLE EXTRACTS
14.10.1.3 DAIRY FLAVORS
14.10.1.4 SPICE FLAVORS
14.10.1.5 HERBAL FLAVORS
14.10.1.6 CITRUS FLAVORS
14.10.1.7 NUTTY FLAVORS
14.10.1.8 CHOCOLATE FLAVOR
14.10.1.9 COFFEE FLAVORS
14.10.1.10 DATE DERIVATIVES
14.10.1.11 VEGETABLE OILS
14.10.1.12 OTHERS
14.10.2 PRODUCT TYPE
14.10.2.1 NATURAL EXTRACT
14.10.2.2 FLAVOR INGREDIENT
14.11 SPORTS NUTRITION
14.11.1 TYPE
14.11.1.1 PROTEIN POWDERS
14.11.1.2 SPORT DRINKS
14.11.1.3 OTHERS
14.11.2 FLAVOR TYPE
14.11.2.1 CHOCOLATE FLAVOR
14.11.2.2 FRUIT FLAVORS
14.11.2.3 NUTTY FLAVORS
14.11.2.4 COFFEE FLAVORS
14.11.2.5 SPICE FLAVORS
14.11.2.6 CITRUS FLAVORS
14.11.2.7 DAIRY FLAVORS
14.11.2.8 HERBAL FLAVORS
14.11.2.9 DATE DERIVATIVES
14.11.2.10 VEGETABLE OILS
14.11.2.11 VEGETABLE EXTRACTS
14.11.2.12 OTHERS
14.11.3 PRODUCT TYPE
14.11.3.1 NATURAL EXTRACT
14.11.3.2 FLAVOR INGREDIENT
14.12 DIETARY SUPPLEMENTS
14.12.1 TYPE
14.12.1.1 CAPSULES
14.12.1.2 TABLETS
14.12.1.3 POWDER SUPPLEMENTS
14.12.1.4 GUMMIES
14.12.1.5 OTHERS
14.12.2 FLAVOR TYPE
14.12.2.1 CHOCOLATE FLAVOR
14.12.2.2 FRUIT FLAVORS
14.12.2.3 CITRUS FLAVORS
14.12.2.4 HERBAL FLAVORS
14.12.2.5 NUTTY FLAVORS
14.12.2.6 SPICE FLAVORS
14.12.2.7 DAIRY FLAVORS
14.12.2.8 VEGETABLE EXTRACTS
14.12.2.9 COFFEE FLAVORS
14.12.2.10 DATE DERIVATIVES
14.12.2.11 VEGETABLE OILS
14.12.2.12 OTHERS
14.12.3 PRODUCT TYPE
14.12.3.1 NATURAL EXTRACT
14.12.3.2 FLAVOR INGREDIENT
14.13 BEVERAGES
14.13.1 TYPE
14.13.1.1 CARBONATED DRINKS
14.13.1.2 TEA
14.13.1.3 COFFEE
14.13.1.4 PLANT-BASED MILK
14.13.1.5 JUICES
14.13.1.6 SMOOTHIES
14.13.1.7 SOFT DRINKS
14.13.1.8 OTHERS
14.13.2 FLAVOR TYPE
14.13.2.1 FRUIT FLAVORS
14.13.2.2 CITRUS FLAVORS
14.13.2.3 HERBAL FLAVORS
14.13.2.4 SPICE FLAVORS
14.13.2.5 CHOCOLATE FLAVOR
14.13.2.6 COFFEE FLAVORS
14.13.2.7 NUTTY FLAVORS
14.13.2.8 DAIRY FLAVORS
14.13.2.9 VEGETABLE EXTRACTS
14.13.2.10 DATE DERIVATIVES
14.13.2.11 VEGETABLE OILS
14.13.2.12 OTHERS
14.13.3 PRODUCT TYPE
14.13.3.1 NATURAL EXTRACT
14.13.3.2 FLAVOR INGREDIENT
15 NORTH AMERICA FOOD FLAVORS MARKET, BY REGION
15.1 NORTH AMERICA
15.1.1 U.S.
15.1.2 CANADA
15.1.3 MEXICO
16 NORTH AMERICA FOOD AND FLAVORS MARKET, COMPANY LANDSCAPE
16.1 COMPANY SHARE ANALYSIS: NORTH AMERICA
17 SWOT ANALYSIS
18 COMPANY PROFILE
18.1 GIVAUDAN (2022)
18.1.1 COMPANY SNAPSHOT
18.1.2 REVENUE ANALYSIS
18.1.3 COMPANY SHARE ANALYSIS
18.1.4 PRODUCT PORTFOLIO
18.1.5 RECENT DEVELOPMENT
18.2 SYMRISE (2022)
18.2.1 COMPANY SNAPSHOT
18.2.2 REVENUE ANALYSIS
18.2.3 COMPANY SHARE ANALYSIS
18.2.4 PRODUCT PORTFOLIO
18.2.5 RECENT DEVELOPMENT
18.3 MANE
18.3.1 COMPANY SNAPSHOT
18.3.2 COMPANY SHARE ANALYSIS
18.3.3 PRODUCT PORTFOLIO
18.3.4 RECENT DEVELOPMENTS
18.4 FIRMENISCH SA
18.4.1 COMPANY SNAPSHOT
18.4.2 REVENUE ANALYSIS
18.4.3 COMPANY SHARE ANALYSIS
18.4.4 PRODUCT PORTFOLIO
18.4.5 RECENT DEVELOPMENTS
18.5 KERRY GROUP PLC (2022)
18.5.1 COMPANY SNAPSHOT
18.5.2 REVENUE ANALYSIS
18.5.3 COMPANY SHARE ANALYSIS
18.5.4 PRODUCT PORTFOLIO
18.5.5 RECENT DEVELOPMENT
18.6 ABELEI INC.
18.6.1 COMPANY SNAPSHOT
18.6.2 PRODUCT PORTFOLIO
18.6.3 RECENT DEVELOPMENT
18.7 ADM (2022)
18.7.1 COMPANY SNAPSHOT
18.7.2 REVENUE ANALYSIS
18.7.3 PRODUCT PORTFOLIO
18.7.4 RECENT DEVELOPMENTS
18.8 AROMATICA
18.8.1 COMPANY SNAPSHOT
18.8.2 PRODUCT PORTFOLIO
18.8.3 RECENT DEVELOPMENT
18.9 AXXENCE AROMATIC GMBH
18.9.1 COMPANY SNAPSHOT
18.9.2 PRODUCT PORTFOLIO
18.9.3 RECENT DEVELOPMENT
18.1 BLUE PACIFIC FLAVORS INC
18.10.1 COMPANY SNAPSHOT
18.10.2 PRODUCT PORTFOLIO
18.10.3 RECENT DEVELOPMENT
18.11 CARGILL, INCORPORATED.
18.11.1 COMPANY SNAPSHOT
18.11.2 PRODUCT PORTFOLIO
18.11.3 RECENT DEVELOPMENTS
18.12 CAPELLA FLAVORS
18.12.1 COMPANY SNAPSHOT
18.12.2 PRODUCT PORTFOLIO
18.12.3 RECENT DEVELOPMENT
18.13 CUSTOM FLAVORS
18.13.1 COMPANY SNAPSHOT
18.13.2 PRODUCT PORTFOLIO
18.13.3 RECENT DEVELOPMENT
18.14 DÖHLER
18.14.1 COMPANY SNAPSHOT
18.14.2 PRODUCT PORTFOLIO
18.14.3 RECENT DEVELOPMENT
18.15 ESSENTIAL FLAVORS
18.15.1 COMPANY SNAPSHOT
18.15.2 PRODUCT PORTFOLIO
18.15.3 RECENT DEVELOPMENT
18.16 FLAVORCAN INTERNATIONAL INC.
18.16.1 COMPANY SNAPSHOT
18.16.2 PRODUCT PORTFOLIO
18.16.3 RECENT DEVELOPMENT
18.17 FLAVOR PRODUCERS, LLC
18.17.1 COMPANY SNAPSHOT
18.17.2 PRODUCT PORTFOLIO
18.17.3 RECENT DEVELOPMENTS
18.18 FLAVORCHEM & ORCHIDIA FRAGRANCES
18.18.1 COMPANY SNAPSHOT
18.18.2 PRODUCT PORTFOLIO
18.18.3 RECENT DEVELOPMENTS
18.19 GOLD COAST INGREDIENTS
18.19.1 COMPANY SNAPSHOT
18.19.2 PRODUCT PORTFOLIO
18.19.3 RECENT DEVELOPMENT
18.2 HHOYA
18.20.1 COMPANY SNAPSHOT
18.20.2 PRODUCT PORTFOLIO
18.20.3 RECENT DEVELOPMENT
18.21 HONEYBERRY INTERNATIONAL LLP
18.21.1 COMPANY SNAPSHOT
18.21.2 PRODUCT PORTFOLIO
18.21.3 RECENT DEVELOPMENT
18.22 HUABAO INTERNATIONAL HOLDING LIMITED.
18.22.1 COMPANY SNAPSHOT
18.22.2 REVENUE ANALYSIS
18.22.3 PRODUCT PORTFOLIO
18.22.4 RECENT DEVELOPMENT
18.23 INTERNATIONAL FLAVORS & FRAGRANCES INC.
18.23.1 COMPANY SNAPSHOT
18.23.2 REVENUE ANALYSIS
18.23.3 PRODUCT PORTFOLIO
18.23.4 RECENT DEVELOPMENTS
18.24 KANEGRADE.
18.24.1 COMPANY SNAPSHOT
18.24.2 PRODUCT PORTFOLIO
18.24.3 RECENT DEVELOPMENT
18.25 KEVA FLAVOURS PVT. LTD.
18.25.1 COMPANY SNAPSHOT
18.25.2 PRODUCT PORTFOLIO
18.25.3 RECENT DEVELOPMENTS
18.26 MARTINBAUER
18.26.1 COMPANY SNAPSHOT
18.26.2 PRODUCT PORTFOLIO
18.26.3 RECENT DEVELOPMENT
18.27 MCCORMICK & COMPANY, INC.
18.27.1 COMPANY SNAPSHOT
18.27.2 REVENUE ANALYSIS
18.27.3 PRODUCT PORTFOLIO
18.27.4 RECENT DEVELOPMENT
18.28 NUTRADRY
18.28.1 COMPANY SNAPSHOT
18.28.2 PRODUCT PORTFOLIO
18.28.3 RECENT DEVELOPMENTS
18.29 PRINOVA GROUP LLC.
18.29.1 COMPANY SNAPSHOT
18.29.2 PRODUCT PORTFOLIO
18.29.3 RECENT DEVELOPMENTS
18.3 SYNTHITE INDUSTRIES
18.30.1 COMPANY SNAPSHOT
18.30.2 PRODUCT PORTFOLIO
18.30.3 RECENT DEVELOPMENT
18.31 SYNERGY FLAVORS, INC.,
18.31.1 COMPANY SNAPSHOT
18.31.2 PRODUCT PORTFOLIO
18.31.3 RECENT DEVELOPMENTS
18.32 SAN-EI GEN F.F.I, INC.
18.32.1 COMPANY SNAPSHOT
18.32.2 PRODUCT PORTFOLIO
18.32.3 RECENT DEVELOPMENT
18.33 STRINGER FLAVOR LTD.
18.33.1 COMPANY SNAPSHOT
18.33.2 PRODUCT PORTFOLIO
18.33.3 RECENT DEVELOPMENT
18.34 SENSIENT TECHNOLOGIES CORPORATION
18.34.1 COMPANY SNAPSHOT
18.34.2 REVENUE ANALYSIS
18.34.3 PRODUCT PORTFOLIO
18.34.4 RECENT DEVELOPMENT
18.35 T.HASEGAWA USA INC.
18.35.1 COMPANY SNAPSHOT
18.35.2 PRODUCT PORTFOLIO
18.35.3 RECENT DEVELOPMENTS
18.36 TAIYO INTERNATIONAL
18.36.1 COMPANY SNAPSHOT
18.36.2 PRODUCT PORTFOLIO
18.36.3 RECENT DEVELOPMENT
18.37 TAKASAGO INTERNATIONAL CORPORATION
18.37.1 COMPANY SNAPSHOT
18.37.2 REVENUE ANALYSIS
18.37.3 PRODUCT PORTFOLIO
18.37.4 RECENT DEVELOPMENT
18.38 TRILOGY FLAVORS
18.38.1 COMPANY SNAPSHOT
18.38.2 PRODUCT PORTFOLIO
18.38.3 RECENT DEVELOPMENT
19 QUESTIONNAIRE
20 RELATED REPORTS
Lista de Tablas
TABLE 1 COMPANY LIST FOR FEED FLAVORS
TABLE 2 COMPANY LIST FOR FOOD FLAVORS
TABLE 3 FREE ON BOARD (FOB)
TABLE 4 PRODUCTION CAPACITY OF KEY MARKET PLAYERS IN THE FOOD FLAVOR INDUSTRY
TABLE 5 NORTH AMERICA FOOD FLAVORS MARKET, BY PRODUCT TYPE, 2021-2030 (USD MILLION)
TABLE 6 NORTH AMERICA NATURAL EXTRACT IN FOOD FLAVORS MARKET, BY REGION, 2021-2030 (USD MILLION)
TABLE 7 NORTH AMERICA FLAVOR INGREDIENTS IN FOOD FLAVORS MARKET, BY REGION, 2021-2030 (USD MILLION)
TABLE 8 NORTH AMERICA FOOD FLAVORS MARKET, BY TYPE, 2021-2030 (USD MILLION)
TABLE 9 NORTH AMERICA FRUIT FLAVORS IN FOOD FLAVORS MARKET, BY REGION, 2021-2030 (USD MILLION)
TABLE 10 NORTH AMERICA FRUIT FLAVORS IN FOOD FLAVORS MARKET, BY TYPE, 2021-2030 (USD MILLION)
TABLE 11 NORTH AMERICA BERRIES IN FOOD FLAVORS MARKET, BY TYPE, 2021-2030 (USD MILLION)
TABLE 12 NORTH AMERICA FRUIT FLAVORS IN FOOD FLAVORS MARKET, BY PRODUCT TYPE, 2021-2030 (USD MILLION)
TABLE 13 NORTH AMERICA SPICES FLAVOS IN FOOD FLAVORS MARKET, BY REGION, 2021-2030 (USD MILLION)
TABLE 14 NORTH AMERICA SPICE FLAVORS IN FOOD FLAVORS MARKET, BY TYPE, 2021-2030 (USD MILLION)
TABLE 15 NORTH AMERICA SPICE FLAVORS IN FOOD FLAVORS MARKET, BY PRODUCT TYPE, 2021-2030 (USD MILLION)
TABLE 16 NORTH AMERICA HERBAL FLAVORS IN FOOD FLAVORS MARKET, BY REGION, 2021-2030 (USD MILLION)
TABLE 17 NORTH AMERICA HERBAL FLAVORS IN FOOD FLAVORS MARKET, BY TYPE, 2021-2030 (USD MILLION)
TABLE 18 NORTH AMERICA HERBAL FLAVORS IN FOOD FLAVORS MARKET, BY PRODUCT TYPE, 2021-2030 (USD MILLION)
TABLE 19 NORTH AMERICA CITRUS FLAVORS IN FOOD FLAVORS MARKET, BY REGION, 2021-2030 (USD MILLION)
TABLE 20 NORTH AMERICA CITRUS FLAVORS IN FOOD FLAVORS MARKET, BY TYPE, 2021-2030 (USD MILLION)
TABLE 21 NORTH AMERICA CITRUS FLAVORS IN FOOD FLAVORS MARKET, BY PRODUCT TYPE, 2021-2030 (USD MILLION)
TABLE 22 NORTH AMERICA DAIRY FLAVORS IN FOOD FLAVORS MARKET, BY REGION, 2021-2030 (USD MILLION)
TABLE 23 NORTH AMERICA DAIRY FLAVORS IN FOOD FLAVORS MARKET, BY TYPE, 2021-2030 (USD MILLION)
TABLE 24 NORTH AMERICA BUTTER FLAVOR IN FOOD FLAVORS MARKET, BY TYPE, 2021-2030 (USD MILLION)
TABLE 25 NORTH AMERICA DAIRY FLAVORS IN FOOD FLAVORS MARKET, BY PRODUCT TYPE, 2021-2030 (USD MILLION)
TABLE 26 NORTH AMERICA NUTTY FLAVORS IN FOOD FLAVORS MARKET, BY REGION, 2021-2030 (USD MILLION)
TABLE 27 NORTH AMERICA NUTTY FLAVORS IN FOOD FLAVORS MARKET, BY TYPE, 2021-2030 (USD MILLION)
TABLE 28 NORTH AMERICA NUTTY FLAVORS IN FOOD FLAVORS MARKET, BY PRODUCT TYPE, 2021-2030 (USD MILLION)
TABLE 29 NORTH AMERICA VEGETABLE FLAVORS IN FOOD FLAVORS MARKET, BY REGION, 2021-2030 (USD MILLION)
TABLE 30 NORTH AMERICA VEGETABLE FLAVORS IN FOOD FLAVORS MARKET, BY TYPE, 2021-2030 (USD MILLION)
TABLE 31 NORTH AMERICA VEGETABLE FLAVORS IN FOOD FLAVORS MARKET, BY PRODUCT TYPE, 2021-2030 (USD MILLION)
TABLE 32 NORTH AMERICA COFFEE FLAVORS IN FOOD FLAVORS MARKET, BY REGION, 2021-2030 (USD MILLION)
TABLE 33 NORTH AMERICA COFFEE FLAVORS IN FOOD FLAVORS MARKET, BY PRODUCT TYPE, 2021-2030 (USD MILLION)
TABLE 34 NORTH AMERICA CHOCOLATE FLAVORS IN FOOD FLAVORS MARKET, BY REGION, 2021-2030 (USD MILLION)
TABLE 35 NORTH AMERICA CHOCOLATE FLAVORS IN FOOD FLAVORS MARKET, BY PRODUCT TYPE, 2021-2030 (USD MILLION)
TABLE 36 NORTH AMERICA DATE DERIVATIVES IN FOOD FLAVORS MARKET, BY REGION, 2021-2030 (USD MILLION)
TABLE 37 NORTH AMERICA DATE DERIVATIVES IN FOOD FLAVORS MARKET, BY PRODUCT TYPE, 2021-2030 (USD MILLION)
TABLE 38 NORTH AMERICA DATE DERIVATIVES IN FOOD FLAVORS MARKET, BY REGION, 2021-2030 (USD MILLION)
TABLE 39 NORTH AMERICA VEGETABLE OILS IN FOOD FLAVORS MARKET, BY PRODUCT TYPE, 2021-2030 (USD MILLION)
TABLE 40 NORTH AMERICA VEGETABLE OILS IN FOOD FLAVORS MARKET, BY PRODUCT TYPE, 2021-2030 (USD MILLION)
TABLE 41 NORTH AMERICA CANOB DERIVATIVES IN FOOD FLAVORS MARKET, BY REGION, 2021-2030 (USD MILLION)
TABLE 42 NORTH AMERICA OTHERS IN FOOD FLAVORS MARKET, BY REGION, 2021-2030 (USD MILLION)
TABLE 43 NORTH AMERICA OTHERS IN FOOD FLAVORS MARKET, BY PRODUCT TYPE, 2021-2030 (USD MILLION)
TABLE 44 NORTH AMERICA FOOD FLAVORS MARKET, BY ORIGIN, 2021-2030 (USD MILLION)
TABLE 45 NORTH AMERICA NATURAL IN FOOD FLAVORS MARKET, BY REGION, 2021-2030 (USD MILLION)
TABLE 46 NORTH AMERICA NATURAL IDENTICAL IN FOOD FLAVORS MARKET, BY REGION, 2021-2030 (USD MILLION)
TABLE 47 NORTH AMERICA ARTIFICIAL IN FOOD FLAVORS MARKET, BY REGION, 2021-2030 (USD MILLION)
TABLE 48 NORTH AMERICA FOOD FLAVORS MARKET, BY CATEGORY, 2021-2030 (USD MILLION)
TABLE 49 NORTH AMERICA CLEAN LABEL IN FOOD FLAVORS MARKET, BY REGION, 2021-2030 (USD MILLION)
TABLE 50 NORTH AMERICA HEAT STABLE IN FOOD FLAVORS MARKET, BY REGION, 2021-2030 (USD MILLION)
TABLE 51 NORTH AMERICA REGULAR IN FOOD FLAVORS MARKET, BY REGION, 2021-2030 (USD MILLION)
TABLE 52 NORTH AMERICA NON-ALLERGIC IN FOOD FLAVORS MARKET, BY REGION, 2021-2030 (USD MILLION)
TABLE 53 NORTH AMERICA OTHERS IN FOOD FLAVORS MARKET, BY REGION, 2021-2030 (USD MILLION)
TABLE 54 NORTH AMERICA FOOD FLAVORS MARKET, BY SOLUBILITY, 2021-2030 (USD MILLION)
TABLE 55 NORTH AMERICA WATER SOLUBLE IN FOOD FLAVORS MARKET, BY REGION, 2021-2030 (USD MILLION)
TABLE 56 NORTH AMERICA OIL SOLUBLE IN FOOD FLAVORS MARKET, BY REGION, 2021-2030 (USD MILLION)
TABLE 57 NORTH AMERICA FAT DISPERSIBLE IN FOOD FLAVORS MARKET, BY REGION, 2021-2030 (USD MILLION)
TABLE 58 NORTH AMERICA OTHERS IN FOOD FLAVORS MARKET, BY REGION, 2021-2030 (USD MILLION)
TABLE 59 NORTH AMERICA FOOD FLAVORS MARKET, BY FORM, 2021-2030 (USD MILLION)
TABLE 60 NORTH AMERICA LIQUID IN FOOD FLAVORS MARKET, BY REGION, 2021-2030 (USD MILLION)
TABLE 61 NORTH AMERICA POWDER IN FOOD FLAVORS MARKET, BY REGION, 2021-2030 (USD MILLION)
TABLE 62 NORTH AMERICA SYRUP IN FOOD FLAVORS MARKET, BY REGION, 2021-2030 (USD MILLION)
TABLE 63 NORTH AMERICA FOOD FLAVORS MARKET, BY APPLICATION, 2021-2030 (USD MILLION)
TABLE 64 NORTH AMERICA CONFECTIONERY IN FOOD FLAVORS MARKET, BY REGION, 2021-2030 (USD MILLION)
TABLE 65 NORTH AMERICA CONFECTIONERY IN FOOD FLAVORS MARKET, BY TYPE, 2021-2030 (USD MILLION)
TABLE 66 NORTH AMERICA CONFECTIONERY IN FOOD FLAVORS MARKET, BY FLAVOR TYPE, 2021-2030 (USD MILLION)
TABLE 67 NORTH AMERICA CONFECTIONERY IN FOOD FLAVORS MARKET, BY PRODUCT TYPE, 2021-2030 (USD MILLION)
TABLE 68 NORTH AMERICA BAKERY IN FOOD FLAVORS MARKET, BY REGION, 2021-2030 (USD MILLION)
TABLE 69 NORTH AMERICA BAKERY IN FOOD FLAVORS MARKET, BY TYPE, 2021-2030 (USD MILLION)
TABLE 70 NORTH AMERICA BAKERY IN FOOD FLAVORS MARKET, BY FLAVORS TYPE, 2021-2030 (USD MILLION)
TABLE 71 NORTH AMERICA BAKERY IN FOOD FLAVORS MARKET, BY PRODUCT TYPE, 2021-2030 (USD MILLION)
TABLE 72 NORTH AMERICA CONVENIENCE FOOD IN FOOD FLAVORS MARKET, BY REGION, 2021-2030 (USD MILLION)
TABLE 73 NORTH AMERICA CONVENIENCE FOOD IN FOOD FLAVORS MARKET, BY TYPE, 2021-2030 (USD MILLION)
TABLE 74 NORTH AMERICA CONVENIENCE FOOD IN FOOD FLAVORS MARKET, BY FLAVOR TYPE, 2021-2030 (USD MILLION)
TABLE 75 NORTH AMERICA CONVENIENCE FOOD IN FOOD FLAVORS MARKET, BY PRODUCT TYPE, 2021-2030 (USD MILLION)
TABLE 76 NORTH AMERICA SNACKS & EXTRUDED SNACKS IN FOOD FLAVORS MARKET, BY REGION, 2021-2030 (USD MILLION)
TABLE 77 NORTH AMERICA SNACKS & EXTRUDED SNACKS IN FOOD FLAVORS MARKET, BY FLAVOR TYPE, 2021-2030 (USD MILLION)
TABLE 78 NORTH AMERICA SNACKS & EXTRUDED SNACKS IN FOOD FLAVORS MARKET, BY PRODUCT TYPE, 2021-2030 (USD MILLION)
TABLE 79 NORTH AMERICA FROZEN DESSERTS PRODUCTS IN FOOD FLAVORS MARKET, BY REGION, 2021-2030 (USD MILLION)
TABLE 80 NORTH AMERICA FROZEN DESSERTS IN FOOD FLAVORS MARKET, BY TYPE, 2021-2030 (USD MILLION)
TABLE 81 NORTH AMERICA FROZEN DESSERTS IN FOOD FLAVORS MARKET, BY FLAVOR TYPE, 2021-2030 (USD MILLION)
TABLE 82 NORTH AMERICA FROZEN DESSERTS IN FOOD FLAVORS MARKET, BY PRODUCT TYPE, 2021-2030 (USD MILLION)
TABLE 83 NORTH AMERICA MEAT & POULTRY PRODUCTS IN FOOD FLAVORS MARKET, BY REGION, 2021-2030 (USD MILLION)
TABLE 84 NORTH AMERICA MEAT AND POULTRY PRODUCTS IN FOOD FLAVORS MARKET, BY TYPE, 2021-2030 (USD MILLION)
TABLE 85 NORTH AMERICA MEAT AND POULTRY PRODUCTS IN FOOD FLAVORS MARKET, BY FLAVOR TYPE, 2021-2030 (USD MILLION)
TABLE 86 NORTH AMERICA MEAT AND POULTRY PRODUCTS IN FOOD FLAVORS MARKET, BY PRODUCT TYPE, 2021-2030 (USD MILLION)
TABLE 87 NORTH AMERICA BREAKFAST CEREALS IN FOOD FLAVORS MARKET, BY REGION, 2021-2030 (USD MILLION)
TABLE 88 NORTH AMERICA BREAKFAST CEREALS IN FOOD FLAVORS MARKET, BY FLAVOR TYPE, 2021-2030 (USD MILLION)
TABLE 89 NORTH AMERICA BREAKFAST CEREALS IN FOOD FLAVORS MARKET, BY PRODUCT TYPE, 2021-2030 (USD MILLION)
TABLE 90 NORTH AMERICA PROCESSED FOOD IN FOOD FLAVORS MARKET, BY REGION, 2021-2030 (USD MILLION)
TABLE 91 NORTH AMERICA PROCESSED FOOD IN FOOD FLAVORS MARKET, BY TYPE, 2021-2030 (USD MILLION)
TABLE 92 NORTH AMERICA PROCESSED FOOD IN FOOD FLAVORS MARKET, BY FLAVOR TYPE, 2021-2030 (USD MILLION)
TABLE 93 NORTH AMERICA PROCESSED FOOD IN FOOD FLAVORS MARKET, BY PRODUCT TYPE, 2021-2030 (USD MILLION)
TABLE 94 NORTH AMERICA BABY FOOD IN FOOD FLAVORS MARKET, BY REGION, 2021-2030 (USD MILLION)
TABLE 95 NORTH AMERICA BABY FOOD IN FOOD FLAVORS MARKET, BY FLAVOR TYPE, 2021-2030 (USD MILLION)
TABLE 96 NORTH AMERICA BABY FOOD IN FOOD FLAVORS MARKET, BY PRODUCT TYPE, 2021-2030 (USD MILLION)
TABLE 97 NORTH AMERICA SPORTS NUTRITION IN FOOD FLAVORS MARKET, BY REGION, 2021-2030 (USD MILLION)
TABLE 98 NORTH AMERICA SPORTS NUTRITION IN FOOD FLAVORS MARKET, BY TYPE, 2021-2030 (USD MILLION)
TABLE 99 NORTH AMERICA SPORTS NUTRITION IN FOOD FLAVORS MARKET, BY FLAVOR TYPE, 2021-2030 (USD MILLION)
TABLE 100 NORTH AMERICA SPORTS NUTRITION IN FOOD FLAVORS MARKET, BY PRODUCT TYPE, 2021-2030 (USD MILLION)
TABLE 101 NORTH AMERICA DIETARY SUPPLEMENTS IN FOOD FLAVORS MARKET, BY REGION, 2021-2030 (USD MILLION)
TABLE 102 NORTH AMERICA DIETARY SUPPLEMENTS IN FOOD FLAVORS MARKET, BY TYPE, 2021-2030 (USD MILLION)
TABLE 103 NORTH AMERICA DIETARY SUPPLEMENTS IN FOOD FLAVORS MARKET, BY FLAVOR TYPE, 2021-2030 (USD MILLION)
TABLE 104 NORTH AMERICA DIETARY SUPPLEMENTS IN FOOD FLAVORS MARKET, BY PRODUCT TYPE, 2021-2030 (USD MILLION)
TABLE 105 NORTH AMERICA BEVERAGES IN FOOD FLAVORS MARKET, BY REGION, 2021-2030 (USD MILLION)
TABLE 106 NORTH AMERICA BEVERAGES IN FOOD FLAVORS MARKET, BY TYPE, 2021-2030 (USD MILLION)
TABLE 107 NORTH AMERICA BEVERAGES IN FOOD FLAVORS MARKET, BY FLAVOR TYPE, 2021-2030 (USD MILLION)
TABLE 108 NORTH AMERICA BEVERAGES IN FOOD FLAVORS MARKET, BY PRODUCT TYPE, 2021-2030 (USD MILLION)
TABLE 109 NORTH AMERICA FOOD FLAVORS MARKET, BY COUNTRY, 2021-2030 (USD MILLION)
TABLE 110 NORTH AMERICA FOOD FLAVORS MARKET, BY PRODUCT TYPE, 2021-2030 (USD MILLION)
TABLE 111 NORTH AMERICA FOOD FLAVORS MARKET, BY TYPE, 2021-2030 (USD MILLION)
TABLE 112 NORTH AMERICA FRUIT FLAVORS IN FOOD FLAVORS MARKET, BY TYPE, 2021-2030 (USD MILLION)
TABLE 113 NORTH AMERICA FRUIT FLAVORS IN FOOD FLAVORS MARKET, BY PRODUCT TYPE, 2021-2030, VOLUME (KILO LITERS)
TABLE 114 NORTH AMERICA BERRIES IN FOOD FLAVORS MARKET, BY TYPE, 2021-2030 (USD MILLION)
TABLE 115 NORTH AMERICA BERRIES IN FOOD FLAVORS MARKET, BY PRODUCT TYPE, 2021-2030, VOLUME (KILO LITERS)
TABLE 116 NORTH AMERICA FRUIT FLAVORS IN FOOD FLAVORS MARKET, BY PRODUCT TYPE, 2021-2030 (USD MILLION)
TABLE 117 NORTH AMERICA SPICE FLAVORS IN FOOD FLAVORS MARKET, BY TYPE, 2021-2030 (USD MILLION)
TABLE 118 NORTH AMERICA SPICE FLAVORS IN FOOD FLAVORS MARKET, BY PRODUCT TYPE, 2021-2030, VOLUME (KILO LITERS)
TABLE 119 NORTH AMERICA SPICE FLAVORS IN FOOD FLAVORS MARKET, BY PRODUCT TYPE, 2021-2030 (USD MILLION)
TABLE 120 NORTH AMERICA HERBAL FLAVORS IN FOOD FLAVORS MARKET, BY TYPE, 2021-2030 (USD MILLION)
TABLE 121 NORTH AMERICA HERBAL FLAVORS IN FOOD FLAVORS MARKET, BY PRODUCT TYPE, 2021-2030, VOLUME (KILO LITERS)
TABLE 122 NORTH AMERICA HERBAL FLAVORS IN FOOD FLAVORS MARKET, BY PRODUCT TYPE, 2021-2030 (USD MILLION)
TABLE 123 NORTH AMERICA CITRUS FLAVORS IN FOOD FLAVORS MARKET, BY TYPE, 2021-2030 (USD MILLION)
TABLE 124 NORTH AMERICA CITRUS FLAVORS IN FOOD FLAVORS MARKET, BY PRODUCT TYPE, 2021-2030, VOLUME (KILO LITERS)
TABLE 125 NORTH AMERICA CITRUS FLAVORS IN FOOD FLAVORS MARKET, BY PRODUCT TYPE, 2021-2030 (USD MILLION)
TABLE 126 NORTH AMERICA DAIRY FLAVORS IN FOOD FLAVORS MARKET, BY TYPE, 2021-2030 (USD MILLION)
TABLE 127 NORTH AMERICA DAIRY FLAVORS IN FOOD FLAVORS MARKET, BY PRODUCT TYPE, 2021-2030, VOLUME (KILO LITERS)
TABLE 128 NORTH AMERICA BUTTER FLAVOR IN FOOD FLAVORS MARKET, BY TYPE, 2021-2030 (USD MILLION)
TABLE 129 NORTH AMERICA DAIRY FLAVORS IN FOOD FLAVORS MARKET, BY PRODUCT TYPE, 2021-2030 (USD MILLION)
TABLE 130 NORTH AMERICA NUTTY FLAVORS IN FOOD FLAVORS MARKET, BY TYPE, 2021-2030 (USD MILLION)
TABLE 131 NORTH AMERICA NUTTY FLAVORS IN FOOD FLAVORS MARKET, BY PRODUCT TYPE, 2021-2030, VOLUME (KILO LITERS)
TABLE 132 NORTH AMERICA NUTTY FLAVORS IN FOOD FLAVORS MARKET, BY PRODUCT TYPE, 2021-2030 (USD MILLION)
TABLE 133 NORTH AMERICA VEGETABLE EXTRACTS IN FOOD FLAVORS MARKET, BY TYPE, 2021-2030 (USD MILLION)
TABLE 134 NORTH AMERICA VEGETABLE EXTRACT IN FOOD FLAVORS MARKET, BY PRODUCT TYPE, 2021-2030, VOLUME (KILO LITERS)
TABLE 135 NORTH AMERICA VEGETABLE EXTRACTS IN FOOD FLAVORS MARKET, BY PRODUCT TYPE, 2021-2030 (USD MILLION)
TABLE 136 NORTH AMERICA COFFEE FLAVORS IN FOOD FLAVORS MARKET, BY PRODUCT TYPE, 2021-2030 (USD MILLION)
TABLE 137 NORTH AMERICA COFFEE FLAVORS IN FOOD FLAVORS MARKET, BY PRODUCT TYPE, 2021-2030, VOLUME (KILO LITERS)
TABLE 138 NORTH AMERICA CHOCOLATE FLAVORS IN FOOD FLAVORS MARKET, BY PRODUCT TYPE, 2021-2030 (USD MILLION)
TABLE 139 NORTH AMERICA CHOCOLATE FLAVORS IN FOOD FLAVORS MARKET, BY PRODUCT TYPE, 2021-2030, VOLUME (KILO LITERS)
TABLE 140 NORTH AMERICA DATE DERIVATIVES IN FOOD FLAVORS MARKET, BY PRODUCT TYPE, 2021-2030 (USD MILLION)
TABLE 141 NORTH AMERICA VEGETABLE OILS IN FOOD FLAVORS MARKET, BY TYPE, 2021-2030 (USD MILLION)
TABLE 142 NORTH AMERICA VEGETABLE OILS IN FOOD FLAVORS MARKET, BY PRODUCT TYPE, 2021-2030, VOLUME (KILO LITERS)
TABLE 143 NORTH AMERICA VEGETABLE OILS IN FOOD FLAVORS MARKET, BY PRODUCT TYPE, 2021-2030 (USD MILLION)
TABLE 144 NORTH AMERICA OTHERS IN FOOD FLAVORS MARKET, BY TYPE, 2021-2030 (USD MILLION)
TABLE 145 NORTH AMERICA FOOD FLAVORS MARKET, BY ORIGIN, 2021-2030 (USD MILLION)
TABLE 146 NORTH AMERICA FOOD FLAVORS MARKET, BY CATEGORY, 2021-2030 (USD MILLION)
TABLE 147 NORTH AMERICA FOOD FLAVORS MARKET, BY SOLUBILITY, 2021-2030 (USD MILLION)
TABLE 148 NORTH AMERICA FOOD FLAVORS MARKET, BY FORM, 2021-2030 (USD MILLION)
TABLE 149 NORTH AMERICA FOOD FLAVORS MARKET, BY APPLICATION, 2021-2030 (USD MILLION)
TABLE 150 NORTH AMERICA CONFECTIONERY IN FOOD FLAVORS MARKET, BY TYPE, 2021-2030 (USD MILLION)
TABLE 151 NORTH AMERICA CONFECTIONERY IN FOOD FLAVORS MARKET, BY FLAVOR TYPE, 2021-2030 (USD MILLION)
TABLE 152 NORTH AMERICA CONFECTIONERY IN FOOD FLAVORS MARKET, BY PRODUCT TYPE, 2021-2030 (USD MILLION)
TABLE 153 NORTH AMERICA BAKERY IN FOOD FLAVORS MARKET, BY TYPE, 2021-2030 (USD MILLION)
TABLE 154 NORTH AMERICA BAKERY IN FOOD FLAVORS MARKET, BY FLAVOR TYPE, 2021-2030 (USD MILLION)
TABLE 155 NORTH AMERICA BAKERY IN FOOD FLAVORS MARKET, BY PRODUCT TYPE, 2021-2030 (USD MILLION)
TABLE 156 NORTH AMERICA CONVENIENCE FOOD IN FOOD FLAVORS MARKET, BY TYPE, 2021-2030 (USD MILLION)
TABLE 157 NORTH AMERICA CONVENIENCE FOOD IN FOOD FLAVORS MARKET, BY FLAVOR TYPE, 2021-2030 (USD MILLION)
TABLE 158 NORTH AMERICA CONVENIENCE FOOD IN FOOD FLAVORS MARKET, BY PRODUCT TYPE, 2021-2030 (USD MILLION)
TABLE 159 NORTH AMERICA SNACKS & EXTRUDED SNACKS IN FOOD FLAVORS MARKET, BY FLAVOR TYPE, 2021-2030 (USD MILLION)
TABLE 160 NORTH AMERICA SNACKS & EXTRUDED SNACKS IN FOOD FLAVORS MARKET, BY PRODUCT TYPE, 2021-2030 (USD MILLION)
TABLE 161 NORTH AMERICA FROZEN DESSERTS IN FOOD FLAVORS MARKET, BY TYPE, 2021-2030 (USD MILLION)
TABLE 162 NORTH AMERICA FROZEN DESSERTS IN FOOD FLAVORS MARKET, BY FLAVOR TYPE, 2021-2030 (USD MILLION)
TABLE 163 NORTH AMERICA FROZEN DESSERTS IN FOOD FLAVORS MARKET, BY PRODUCT TYPE, 2021-2030 (USD MILLION)
TABLE 164 NORTH AMERICA MEAT AND POULTRY PRODUCTS IN FOOD FLAVORS MARKET, BY TYPE, 2021-2030 (USD MILLION)
TABLE 165 NORTH AMERICA MEAT AND POULTRY PRODUCTS IN FOOD FLAVORS MARKET, BY FLAVOR TYPE, 2021-2030 (USD MILLION)
TABLE 166 NORTH AMERICA MEAT AND POULTRY PRODUCTS IN FOOD FLAVORS MARKET, BY PRODUCT TYPE, 2021-2030 (USD MILLION)
TABLE 167 NORTH AMERICA BREAKFAST CEREALS IN FOOD FLAVORS MARKET, BY FLAVOR TYPE, 2021-2030 (USD MILLION)
TABLE 168 NORTH AMERICA BREAKFAST CEREALS IN FOOD FLAVORS MARKET, BY PRODUCT TYPE, 2021-2030 (USD MILLION)
TABLE 169 NORTH AMERICA PROCESSED FOOD IN FOOD FLAVORS MARKET, BY TYPE, 2021-2030 (USD MILLION)
TABLE 170 NORTH AMERICA PROCESSED FOOD IN FOOD FLAVORS MARKET, BY FLAVOR TYPE, 2021-2030 (USD MILLION)
TABLE 171 NORTH AMERICA PROCESSED FOOD IN FOOD FLAVORS MARKET, BY PRODUCT TYPE, 2021-2030 (USD MILLION)
TABLE 172 NORTH AMERICA BABY FOOD IN FOOD FLAVORS MARKET, BY FLAVOR TYPE, 2021-2030 (USD MILLION)
TABLE 173 NORTH AMERICA BABY FOOD IN FOOD FLAVORS MARKET, BY PRODUCT TYPE, 2021-2030 (USD MILLION)
TABLE 174 NORTH AMERICA SPORTS NUTRITION IN FOOD FLAVORS MARKET, BY TYPE, 2021-2030 (USD MILLION)
TABLE 175 NORTH AMERICA SPORTS NUTRITION IN FOOD FLAVORS MARKET, BY FLAVOR TYPE, 2021-2030 (USD MILLION)
TABLE 176 NORTH AMERICA SPORTS NUTRITION IN FOOD FLAVORS MARKET, BY PRODUCT TYPE, 2021-2030 (USD MILLION)
TABLE 177 NORTH AMERICA DIETARY SUPPLEMENTS IN FOOD FLAVORS MARKET, BY TYPE, 2021-2030 (USD MILLION)
TABLE 178 NORTH AMERICA DIETARY SUPPLEMENTS IN FOOD FLAVORS MARKET, BY FLAVOR TYPE, 2021-2030 (USD MILLION)
TABLE 179 NORTH AMERICA DIETARY SUPPLEMENTS IN FOOD FLAVORS MARKET, BY PRODUCT TYPE, 2021-2030 (USD MILLION)
TABLE 180 NORTH AMERICA BEVERAGES IN FOOD FLAVORS MARKET, BY TYPE, 2021-2030 (USD MILLION)
TABLE 181 NORTH AMERICA BEVERAGES IN FOOD FLAVORS MARKET, BY FLAVOR TYPE, 2021-2030 (USD MILLION)
TABLE 182 NORTH AMERICA BEVERAGES IN FOOD FLAVORS MARKET, BY PRODUCT TYPE, 2021-2030 (USD MILLION)
TABLE 183 U.S. FOOD FLAVORS MARKET, BY PRODUCT TYPE, 2021-2030 (USD MILLION)
TABLE 184 U.S. FOOD FLAVORS MARKET, BY TYPE, 2021-2030 (USD MILLION)
TABLE 185 U.S. FRUIT FLAVORS IN FOOD FLAVORS MARKET, BY TYPE, 2021-2030 (USD MILLION)
TABLE 186 U.S. FRUIT FLAVORS IN FOOD FLAVORS MARKET, BY PRODUCT TYPE, 2021-2030, VOLUME (KILO LITERS)
TABLE 187 U.S. FRUIT FLAVORS IN FOOD FLAVORS MARKET, BY PRODUCT TYPE, 2021-2030 (ASP)
TABLE 188 U.S. BERRIES IN FOOD FLAVORS MARKET, BY TYPE, 2021-2030 (USD MILLION)
TABLE 189 U.S. BERRIES IN FOOD FLAVORS MARKET, BY PRODUCT TYPE, 2021-2030, VOLUME (KILO LITERS)
TABLE 190 U.S. BERRIES IN FOOD FLAVORS MARKET, BY PRODUCT TYPE, 2021-2030 (ASP)
TABLE 191 U.S. FRUIT FLAVORS IN FOOD FLAVORS MARKET, BY PRODUCT TYPE, 2021-2030 (USD MILLION)
TABLE 192 U.S. SPICE FLAVORS IN FOOD FLAVORS MARKET, BY TYPE, 2021-2030 (USD MILLION)
TABLE 193 U.S. SPICE FLAVORS IN FOOD FLAVORS MARKET, BY PRODUCT TYPE, 2021-2030, VOLUME (KILO LITERS)
TABLE 194 U.S. SPICE FLAVORS IN FOOD FLAVORS MARKET, BY PRODUCT TYPE, 2021-2030 (ASP)
TABLE 195 U.S. SPICE FLAVORS IN FOOD FLAVORS MARKET, BY PRODUCT TYPE, 2021-2030 (USD MILLION)
TABLE 196 U.S. HERBAL FLAVORS IN FOOD FLAVORS MARKET, BY TYPE, 2021-2030 (USD MILLION)
TABLE 197 U.S. HERBAL FLAVORS IN FOOD FLAVORS MARKET, BY PRODUCT TYPE, 2021-2030, VOLUME (KILO LITERS)
TABLE 198 U.S. HERBAL FLAVORS IN FOOD FLAVORS MARKET, BY PRODUCT TYPE, 2021-2030 (ASP)
TABLE 199 U.S. HERBAL FLAVORS IN FOOD FLAVORS MARKET, BY PRODUCT TYPE, 2021-2030 (USD MILLION)
TABLE 200 U.S. CITRUS FLAVORS IN FOOD FLAVORS MARKET, BY TYPE, 2021-2030 (USD MILLION)
TABLE 201 U.S. CITRUS FLAVORS IN FOOD FLAVORS MARKET, BY PRODUCT TYPE, 2021-2030, VOLUME (KILO LITERS)
TABLE 202 U.S. CITRUS FLAVORS IN FOOD FLAVORS MARKET, BY PRODUCT TYPE, 2021-2030 (ASP)
TABLE 203 U.S. CITRUS FLAVORS IN FOOD FLAVORS MARKET, BY PRODUCT TYPE, 2021-2030 (USD MILLION)
TABLE 204 U.S. DAIRY FLAVORS IN FOOD FLAVORS MARKET, BY TYPE, 2021-2030 (USD MILLION)
TABLE 205 U.S. DAIRY FLAVORS IN FOOD FLAVORS MARKET, BY PRODUCT TYPE, 2021-2030, VOLUME (KILO LITERS)
TABLE 206 U.S. DAIRY FLAVORS IN FOOD FLAVORS MARKET, BY PRODUCT TYPE, 2021-2030 (ASP)
TABLE 207 U.S. BUTTER FLAVOR IN FOOD FLAVORS MARKET, BY TYPE, 2021-2030 (USD MILLION)
TABLE 208 U.S. DAIRY FLAVORS IN FOOD FLAVORS MARKET, BY PRODUCT TYPE, 2021-2030 (USD MILLION)
TABLE 209 U.S. NUTTY FLAVORS IN FOOD FLAVORS MARKET, BY TYPE, 2021-2030 (USD MILLION)
TABLE 210 U.S. NUTTY FLAVORS IN FOOD FLAVORS MARKET, BY PRODUCT TYPE, 2021-2030, VOLUME (KILO LITERS)
TABLE 211 U.S. NUTTY FLAVORS IN FOOD FLAVORS MARKET, BY PRODUCT TYPE, 2021-2030 (ASP)
TABLE 212 U.S. NUTTY FLAVORS IN FOOD FLAVORS MARKET, BY PRODUCT TYPE, 2021-2030 (USD MILLION)
TABLE 213 U.S. VEGETABLE EXTRACTS IN FOOD FLAVORS MARKET, BY TYPE, 2021-2030 (USD MILLION)
TABLE 214 U.S. VEGETABLE EXTRACT IN FOOD FLAVORS MARKET, BY PRODUCT TYPE, 2021-2030, VOLUME (KILO LITERS)
TABLE 215 U.S.VEGETABLE EXTRACT IN FOOD FLAVORS MARKET, BY PRODUCT TYPE, 2021-2030 (ASP)
TABLE 216 U.S. VEGETABLE EXTRACTS IN FOOD FLAVORS MARKET, BY PRODUCT TYPE, 2021-2030 (USD MILLION)
TABLE 217 U.S. COFFEE FLAVORS IN FOOD FLAVORS MARKET, BY PRODUCT TYPE, 2021-2030 (USD MILLION)
TABLE 218 U.S. COFFEE FLAVORS IN FOOD FLAVORS MARKET, BY PRODUCT TYPE, 2021-2030, VOLUME (KILO LITERS)
TABLE 219 U.S. COFFEE FLAVORS IN FOOD FLAVORS MARKET, BY PRODUCT TYPE, 2021-2030, VOLUME (ASP)
TABLE 220 U.S. CHOCOLATE FLAVORS IN FOOD FLAVORS MARKET, BY PRODUCT TYPE, 2021-2030 (USD MILLION)
TABLE 221 U.S. CHOCOLATE FLAVORS IN FOOD FLAVORS MARKET, BY PRODUCT TYPE, 2021-2030, VOLUME (KILO LITERS)
TABLE 222 U.S. CHOCOLATE FLAVORS IN FOOD FLAVORS MARKET, BY PRODUCT TYPE, 2021-2030, VOLUME (ASP)
TABLE 223 U.S. DATE DERIVATIVES IN FOOD FLAVORS MARKET, BY PRODUCT TYPE, 2021-2030 (USD MILLION)
TABLE 224 U.S. VEGETABLE OILS IN FOOD FLAVORS MARKET, BY TYPE, 2021-2030 (USD MILLION)
TABLE 225 U.S. VEGETABLE OILS IN FOOD FLAVORS MARKET, BY PRODUCT TYPE, 2021-2030, VOLUME (KILO LITERS)
TABLE 226 U.S. VEGETABLE OILS IN FOOD FLAVORS MARKET, BY PRODUCT TYPE, 2021-2030 (ASP)
TABLE 227 U.S. VEGETABLE OILS IN FOOD FLAVORS MARKET, BY PRODUCT TYPE, 2021-2030 (USD MILLION)
TABLE 228 U.S. OTHERS IN FOOD FLAVORS MARKET, BY TYPE, 2021-2030 (USD MILLION)
TABLE 229 U.S. FOOD FLAVORS MARKET, BY ORIGIN, 2021-2030 (USD MILLION)
TABLE 230 U.S. FOOD FLAVORS MARKET, BY CATEGORY, 2021-2030 (USD MILLION)
TABLE 231 U.S. FOOD FLAVORS MARKET, BY SOLUBILITY, 2021-2030 (USD MILLION)
TABLE 232 U.S. FOOD FLAVORS MARKET, BY FORM, 2021-2030 (USD MILLION)
TABLE 233 U.S. FOOD FLAVORS MARKET, BY APPLICATION, 2021-2030 (USD MILLION)
TABLE 234 U.S. CONFECTIONERY IN FOOD FLAVORS MARKET, BY TYPE, 2021-2030 (USD MILLION)
TABLE 235 U.S. CONFECTIONERY IN FOOD FLAVORS MARKET, BY FLAVOR TYPE, 2021-2030 (USD MILLION)
TABLE 236 U.S. CONFECTIONERY IN FOOD FLAVORS MARKET, BY PRODUCT TYPE, 2021-2030 (USD MILLION)
TABLE 237 U.S. BAKERY IN FOOD FLAVORS MARKET, BY TYPE, 2021-2030 (USD MILLION)
TABLE 238 U.S. BAKERY IN FOOD FLAVORS MARKET, BY FLAVOR TYPE, 2021-2030 (USD MILLION)
TABLE 239 U.S. BAKERY IN FOOD FLAVORS MARKET, BY PRODUCT TYPE, 2021-2030 (USD MILLION)
TABLE 240 U.S. CONVENIENCE FOOD IN FOOD FLAVORS MARKET, BY TYPE, 2021-2030 (USD MILLION)
TABLE 241 U.S. CONVENIENCE FOOD IN FOOD FLAVORS MARKET, BY FLAVOR TYPE, 2021-2030 (USD MILLION)
TABLE 242 U.S. CONVENIENCE FOOD IN FOOD FLAVORS MARKET, BY PRODUCT TYPE, 2021-2030 (USD MILLION)
TABLE 243 U.S. SNACKS & EXTRUDED SNACKS IN FOOD FLAVORS MARKET, BY FLAVOR TYPE, 2021-2030 (USD MILLION)
TABLE 244 U.S. SNACKS & EXTRUDED SNACKS IN FOOD FLAVORS MARKET, BY PRODUCT TYPE, 2021-2030 (USD MILLION)
TABLE 245 U.S. FROZEN DESSERTS IN FOOD FLAVORS MARKET, BY TYPE, 2021-2030 (USD MILLION)
TABLE 246 U.S. FROZEN DESSERTS IN FOOD FLAVORS MARKET, BY FLAVOR TYPE, 2021-2030 (USD MILLION)
TABLE 247 U.S. FROZEN DESSERTS IN FOOD FLAVORS MARKET, BY PRODUCT TYPE, 2021-2030 (USD MILLION)
TABLE 248 U.S. MEAT AND POULTRY PRODUCTS IN FOOD FLAVORS MARKET, BY TYPE, 2021-2030 (USD MILLION)
TABLE 249 U.S. MEAT AND POULTRY PRODUCTS IN FOOD FLAVORS MARKET, BY FLAVOR TYPE, 2021-2030 (USD MILLION)
TABLE 250 U.S. MEAT AND POULTRY PRODUCTS IN FOOD FLAVORS MARKET, BY PRODUCT TYPE, 2021-2030 (USD MILLION)
TABLE 251 U.S. BREAKFAST CEREALS IN FOOD FLAVORS MARKET, BY FLAVOR TYPE, 2021-2030 (USD MILLION)
TABLE 252 U.S. BREAKFAST CEREALS IN FOOD FLAVORS MARKET, BY PRODUCT TYPE, 2021-2030 (USD MILLION)
TABLE 253 U.S. PROCESSED FOOD IN FOOD FLAVORS MARKET, BY TYPE, 2021-2030 (USD MILLION)
TABLE 254 U.S. PROCESSED FOOD IN FOOD FLAVORS MARKET, BY FLAVOR TYPE, 2021-2030 (USD MILLION)
TABLE 255 U.S. PROCESSED FOOD IN FOOD FLAVORS MARKET, BY PRODUCT TYPE, 2021-2030 (USD MILLION)
TABLE 256 U.S. BABY FOOD IN FOOD FLAVORS MARKET, BY FLAVOR TYPE, 2021-2030 (USD MILLION)
TABLE 257 U.S. BABY FOOD IN FOOD FLAVORS MARKET, BY PRODUCT TYPE, 2021-2030 (USD MILLION)
TABLE 258 U.S. SPORTS NUTRITION IN FOOD FLAVORS MARKET, BY TYPE, 2021-2030 (USD MILLION)
TABLE 259 U.S. SPORTS NUTRITION IN FOOD FLAVORS MARKET, BY FLAVOR TYPE, 2021-2030 (USD MILLION)
TABLE 260 U.S. SPORTS NUTRITION IN FOOD FLAVORS MARKET, BY PRODUCT TYPE, 2021-2030 (USD MILLION)
TABLE 261 U.S. DIETARY SUPPLEMENTS IN FOOD FLAVORS MARKET, BY TYPE, 2021-2030 (USD MILLION)
TABLE 262 U.S. DIETARY SUPPLEMENTS IN FOOD FLAVORS MARKET, BY FLAVOR TYPE, 2021-2030 (USD MILLION)
TABLE 263 U.S. DIETARY SUPPLEMENTS IN FOOD FLAVORS MARKET, BY PRODUCT TYPE, 2021-2030 (USD MILLION)
TABLE 264 U.S. BEVERAGES IN FOOD FLAVORS MARKET, BY TYPE, 2021-2030 (USD MILLION)
TABLE 265 U.S. BEVERAGES IN FOOD FLAVORS MARKET, BY FLAVOR TYPE, 2021-2030 (USD MILLION)
TABLE 266 U.S. BEVERAGES IN FOOD FLAVORS MARKET, BY PRODUCT TYPE, 2021-2030 (USD MILLION)
TABLE 267 CANADA FOOD FLAVORS MARKET, BY PRODUCT TYPE, 2021-2030 (USD MILLION)
TABLE 268 CANADA FOOD FLAVORS MARKET, BY TYPE, 2021-2030 (USD MILLION)
TABLE 269 CANADA FRUIT FLAVORS IN FOOD FLAVORS MARKET, BY TYPE, 2021-2030 (USD MILLION)
TABLE 270 CANADA FRUIT FLAVORS IN FOOD FLAVORS MARKET, BY PRODUCT TYPE, 2021-2030, VOLUME (KILO LITERS)
TABLE 271 CANADA FRUIT FLAVORS IN FOOD FLAVORS MARKET, BY PRODUCT TYPE, 2021-2030 (ASP)
TABLE 272 CANADA BERRIES IN FOOD FLAVORS MARKET, BY TYPE, 2021-2030 (USD MILLION)
TABLE 273 CANADA BERRIES IN FOOD FLAVORS MARKET, BY TYPE, 2021-2030 (USD MILLION)
TABLE 274 CANADA BERRIES IN FOOD FLAVORS MARKET, BY PRODUCT TYPE, 2021-2030, VOLUME (KILO LITERS)
TABLE 275 CANADA FRUIT FLAVORS IN FOOD FLAVORS MARKET, BY PRODUCT TYPE, 2021-2030 (USD MILLION)
TABLE 276 CANADA SPICE FLAVORS IN FOOD FLAVORS MARKET, BY TYPE, 2021-2030 (USD MILLION)
TABLE 277 CANADA SPICE FLAVORS IN FOOD FLAVORS MARKET, BY PRODUCT TYPE, 2021-2030, VOLUME (KILO LITERS)
TABLE 278 CANADA SPICE FLAVORS IN FOOD FLAVORS MARKET, BY PRODUCT TYPE, 2021-2030 (ASP)
TABLE 279 CANADA SPICE FLAVORS IN FOOD FLAVORS MARKET, BY PRODUCT TYPE, 2021-2030 (USD MILLION)
TABLE 280 CANADA HERBAL FLAVORS IN FOOD FLAVORS MARKET, BY TYPE, 2021-2030 (USD MILLION)
TABLE 281 CANADA HERBAL FLAVORS IN FOOD FLAVORS MARKET, BY PRODUCT TYPE, 2021-2030, VOLUME (KILO LITERS)
TABLE 282 CANADA HERBAL FLAVORS IN FOOD FLAVORS MARKET, BY PRODUCT TYPE, 2021-2030, VOLUME (ASP)
TABLE 283 CANADA HERBAL FLAVORS IN FOOD FLAVORS MARKET, BY PRODUCT TYPE, 2021-2030 (USD MILLION)
TABLE 284 CANADA CITRUS FLAVORS IN FOOD FLAVORS MARKET, BY TYPE, 2021-2030 (USD MILLION)
TABLE 285 CANADA CITRUS FLAVORS IN FOOD FLAVORS MARKET, BY PRODUCT TYPE, 2021-2030, VOLUME (KILO LITERS)
TABLE 286 CANADA CITRUS FLAVORS IN FOOD FLAVORS MARKET, BY PRODUCT TYPE, 2021-2030 (ASP)
TABLE 287 CANADA CITRUS FLAVORS IN FOOD FLAVORS MARKET, BY PRODUCT TYPE, 2021-2030 (USD MILLION)
TABLE 288 CANADA DAIRY FLAVORS IN FOOD FLAVORS MARKET, BY TYPE, 2021-2030 (USD MILLION)
TABLE 289 CANADA DAIRY FLAVORS IN FOOD FLAVORS MARKET, BY PRODUCT TYPE, 2021-2030, VOLUME (KILO LITERS)
TABLE 290 CANADA DAIRY FLAVORS IN FOOD FLAVORS MARKET, BY PRODUCT TYPE, 2021-2030 (ASP)
TABLE 291 CANADA BUTTER FLAVOR IN FOOD FLAVORS MARKET, BY TYPE, 2021-2030 (USD MILLION)
TABLE 292 CANADA DAIRY FLAVORS IN FOOD FLAVORS MARKET, BY PRODUCT TYPE, 2021-2030 (USD MILLION)
TABLE 293 CANADA NUTTY FLAVORS IN FOOD FLAVORS MARKET, BY TYPE, 2021-2030 (USD MILLION)
TABLE 294 CANADA NUTTY FLAVORS IN FOOD FLAVORS MARKET, BY PRODUCT TYPE, 2021-2030, VOLUME (KILO LITERS)
TABLE 295 CANADA NUTTY FLAVORS IN FOOD FLAVORS MARKET, BY PRODUCT TYPE, 2021-2030 (ASP)
TABLE 296 CANADA NUTTY FLAVORS IN FOOD FLAVORS MARKET, BY PRODUCT TYPE, 2021-2030 (USD MILLION)
TABLE 297 CANADA VEGETABLE EXTRACTS IN FOOD FLAVORS MARKET, BY TYPE, 2021-2030 (USD MILLION)
TABLE 298 CANADA VEGETABLE EXTRACT IN FOOD FLAVORS MARKET, BY PRODUCT TYPE, 2021-2030, VOLUME (KILO LITERS)
TABLE 299 CANADA VEGETABLE EXTRACT IN FOOD FLAVORS MARKET, BY PRODUCT TYPE, 2021-2030, VOLUME (ASP)
TABLE 300 CANADA VEGETABLE EXTRACTS IN FOOD FLAVORS MARKET, BY PRODUCT TYPE, 2021-2030 (USD MILLION)
TABLE 301 CANADA COFFEE FLAVORS IN FOOD FLAVORS MARKET, BY PRODUCT TYPE, 2021-2030 (USD MILLION)
TABLE 302 CANADA COFFEE FLAVORS IN FOOD FLAVORS MARKET, BY PRODUCT TYPE, 2021-2030, VOLUME (KILO LITERS)
TABLE 303 CANADA COFFEE FLAVORS IN FOOD FLAVORS MARKET, BY PRODUCT TYPE, 2021-2030 (ASP)
TABLE 304 CANADA CHOCOLATE FLAVORS IN FOOD FLAVORS MARKET, BY PRODUCT TYPE, 2021-2030 (USD MILLION)
TABLE 305 CANADA CHOCOLATE FLAVORS IN FOOD FLAVORS MARKET, BY PRODUCT TYPE, 2021-2030, VOLUME (KILO LITERS)
TABLE 306 CANADA CHOCOLATE FLAVORS IN FOOD FLAVORS MARKET, BY PRODUCT TYPE, 2021-2030 (ASP)
TABLE 307 CANADA DATE DERIVATIVES IN FOOD FLAVORS MARKET, BY PRODUCT TYPE, 2021-2030 (USD MILLION)
TABLE 308 CANADA VEGETABLE OILS IN FOOD FLAVORS MARKET, BY TYPE, 2021-2030 (USD MILLION)
TABLE 309 CANADA VEGETABLE OILS IN FOOD FLAVORS MARKET, BY PRODUCT TYPE, 2021-2030, VOLUME (KILO LITERS)
TABLE 310 CANADA VEGETABLE OILS IN FOOD FLAVORS MARKET, BY PRODUCT TYPE, 2021-2030 (ASP)
TABLE 311 CANADA VEGETABLE OILS IN FOOD FLAVORS MARKET, BY PRODUCT TYPE, 2021-2030 (USD MILLION)
TABLE 312 CANADA OTHERS IN FOOD FLAVORS MARKET, BY TYPE, 2021-2030 (USD MILLION)
TABLE 313 CANADA FOOD FLAVORS MARKET, BY ORIGIN, 2021-2030 (USD MILLION)
TABLE 314 CANADA FOOD FLAVORS MARKET, BY CATEGORY, 2021-2030 (USD MILLION)
TABLE 315 CANADA FOOD FLAVORS MARKET, BY SOLUBILITY, 2021-2030 (USD MILLION)
TABLE 316 CANADA FOOD FLAVORS MARKET, BY FORM, 2021-2030 (USD MILLION)
TABLE 317 CANADA FOOD FLAVORS MARKET, BY APPLICATION, 2021-2030 (USD MILLION)
TABLE 318 CANADA CONFECTIONERY IN FOOD FLAVORS MARKET, BY TYPE, 2021-2030 (USD MILLION)
TABLE 319 CANADA CONFECTIONERY IN FOOD FLAVORS MARKET, BY FLAVOR TYPE, 2021-2030 (USD MILLION)
TABLE 320 CANADA CONFECTIONERY IN FOOD FLAVORS MARKET, BY PRODUCT TYPE, 2021-2030 (USD MILLION)
TABLE 321 CANADA BAKERY IN FOOD FLAVORS MARKET, BY TYPE, 2021-2030 (USD MILLION)
TABLE 322 CANADA BAKERY IN FOOD FLAVORS MARKET, BY FLAVOR TYPE, 2021-2030 (USD MILLION)
TABLE 323 CANADA BAKERY IN FOOD FLAVORS MARKET, BY PRODUCT TYPE, 2021-2030 (USD MILLION)
TABLE 324 CANADA CONVENIENCE FOOD IN FOOD FLAVORS MARKET, BY TYPE, 2021-2030 (USD MILLION)
TABLE 325 CANADA CONVENIENCE FOOD IN FOOD FLAVORS MARKET, BY FLAVOR TYPE, 2021-2030 (USD MILLION)
TABLE 326 CANADA CONVENIENCE FOOD IN FOOD FLAVORS MARKET, BY PRODUCT TYPE, 2021-2030 (USD MILLION)
TABLE 327 CANADA SNACKS & EXTRUDED SNACKS IN FOOD FLAVORS MARKET, BY FLAVOR TYPE, 2021-2030 (USD MILLION)
TABLE 328 CANADA SNACKS & EXTRUDED SNACKS IN FOOD FLAVORS MARKET, BY PRODUCT TYPE, 2021-2030 (USD MILLION)
TABLE 329 CANADA FROZEN DESSERTS IN FOOD FLAVORS MARKET, BY TYPE, 2021-2030 (USD MILLION)
TABLE 330 CANADA FROZEN DESSERTS IN FOOD FLAVORS MARKET, BY FLAVOR TYPE, 2021-2030 (USD MILLION)
TABLE 331 CANADA FROZEN DESSERTS IN FOOD FLAVORS MARKET, BY PRODUCT TYPE, 2021-2030 (USD MILLION)
TABLE 332 CANADA MEAT AND POULTRY PRODUCTS IN FOOD FLAVORS MARKET, BY TYPE, 2021-2030 (USD MILLION)
TABLE 333 CANADA MEAT AND POULTRY PRODUCTS IN FOOD FLAVORS MARKET, BY FLAVOR TYPE, 2021-2030 (USD MILLION)
TABLE 334 CANADA MEAT AND POULTRY PRODUCTS IN FOOD FLAVORS MARKET, BY PRODUCT TYPE, 2021-2030 (USD MILLION)
TABLE 335 CANADA BREAKFAST CEREALS IN FOOD FLAVORS MARKET, BY FLAVOR TYPE, 2021-2030 (USD MILLION)
TABLE 336 CANADA BREAKFAST CEREALS IN FOOD FLAVORS MARKET, BY PRODUCT TYPE, 2021-2030 (USD MILLION)
TABLE 337 CANADA PROCESSED FOOD IN FOOD FLAVORS MARKET, BY TYPE, 2021-2030 (USD MILLION)
TABLE 338 CANADA PROCESSED FOOD IN FOOD FLAVORS MARKET, BY FLAVOR TYPE, 2021-2030 (USD MILLION)
TABLE 339 CANADA PROCESSED FOOD IN FOOD FLAVORS MARKET, BY PRODUCT TYPE, 2021-2030 (USD MILLION)
TABLE 340 CANADA BABY FOOD IN FOOD FLAVORS MARKET, BY FLAVOR TYPE, 2021-2030 (USD MILLION)
TABLE 341 CANADA BABY FOOD IN FOOD FLAVORS MARKET, BY PRODUCT TYPE, 2021-2030 (USD MILLION)
TABLE 342 CANADA SPORTS NUTRITION IN FOOD FLAVORS MARKET, BY TYPE, 2021-2030 (USD MILLION)
TABLE 343 CANADA SPORTS NUTRITION IN FOOD FLAVORS MARKET, BY FLAVOR TYPE, 2021-2030 (USD MILLION)
TABLE 344 CANADA SPORTS NUTRITION IN FOOD FLAVORS MARKET, BY PRODUCT TYPE, 2021-2030 (USD MILLION)
TABLE 345 CANADA DIETARY SUPPLEMENTS IN FOOD FLAVORS MARKET, BY TYPE, 2021-2030 (USD MILLION)
TABLE 346 CANADA DIETARY SUPPLEMENTS IN FOOD FLAVORS MARKET, BY FLAVOR TYPE, 2021-2030 (USD MILLION)
TABLE 347 CANADA DIETARY SUPPLEMENTS IN FOOD FLAVORS MARKET, BY PRODUCT TYPE, 2021-2030 (USD MILLION)
TABLE 348 CANADA BEVERAGES IN FOOD FLAVORS MARKET, BY TYPE, 2021-2030 (USD MILLION)
TABLE 349 CANADA BEVERAGES IN FOOD FLAVORS MARKET, BY FLAVOR TYPE, 2021-2030 (USD MILLION)
TABLE 350 CANADA BEVERAGES IN FOOD FLAVORS MARKET, BY PRODUCT TYPE, 2021-2030 (USD MILLION)
TABLE 351 MEXICO FOOD FLAVORS MARKET, BY PRODUCT TYPE, 2021-2030 (USD MILLION)
TABLE 352 MEXICO FOOD FLAVORS MARKET, BY TYPE, 2021-2030 (USD MILLION)
TABLE 353 MEXICO FRUIT FLAVORS IN FOOD FLAVORS MARKET, BY TYPE, 2021-2030 (USD MILLION)
TABLE 354 MEXICO FRUIT FLAVORS IN FOOD FLAVORS MARKET, BY PRODUCT TYPE, 2021-2030, VOLUME (KILO LITERS)
TABLE 355 MEXICO FRUIT FLAVORS IN FOOD FLAVORS MARKET, BY PRODUCT TYPE, 2021-2030, VOLUME (ASP)
TABLE 356 MEXICO BERRIES IN FOOD FLAVORS MARKET, BY TYPE, 2021-2030 (USD MILLION)
TABLE 357 MEXICO BERRIES IN FOOD FLAVORS MARKET, BY PRODUCT TYPE, 2021-2030, VOLUME (KILO LITERS)
TABLE 358 MEXICO BERRIES IN FOOD FLAVORS MARKET, BY PRODUCT TYPE, 2021-2030, VOLUME (ASP)
TABLE 359 MEXICO FRUIT FLAVORS IN FOOD FLAVORS MARKET, BY PRODUCT TYPE, 2021-2030 (USD MILLION)
TABLE 360 MEXICO SPICE FLAVORS IN FOOD FLAVORS MARKET, BY TYPE, 2021-2030 (USD MILLION)
TABLE 361 MEXICO SPICE FLAVORS IN FOOD FLAVORS MARKET, BY PRODUCT TYPE, 2021-2030, VOLUME (KILO LITERS)
TABLE 362 MEXICO SPICE FLAVORS IN FOOD FLAVORS MARKET, BY PRODUCT TYPE, 2021-2030, VOLUME (ASP)
TABLE 363 MEXICO SPICE FLAVORS IN FOOD FLAVORS MARKET, BY PRODUCT TYPE, 2021-2030 (USD MILLION)
TABLE 364 MEXICO HERBAL FLAVORS IN FOOD FLAVORS MARKET, BY TYPE, 2021-2030 (USD MILLION)
TABLE 365 MEXICO HERBAL FLAVORS IN FOOD FLAVORS MARKET, BY PRODUCT TYPE, 2021-2030, VOLUME (KILO LITERS)
TABLE 366 MEXICO HERBAL FLAVORS IN FOOD FLAVORS MARKET, BY PRODUCT TYPE, 2021-2030, VOLUME (ASP)
TABLE 367 MEXICO HERBAL FLAVORS IN FOOD FLAVORS MARKET, BY PRODUCT TYPE, 2021-2030 (USD MILLION)
TABLE 368 MEXICO CITRUS FLAVORS IN FOOD FLAVORS MARKET, BY TYPE, 2021-2030 (USD MILLION)
TABLE 369 MEXICO CITRUS FLAVORS IN FOOD FLAVORS MARKET, BY PRODUCT TYPE, 2021-2030, VOLUME (KILO LITERS)
TABLE 370 MEXICO CITRUS FLAVORS IN FOOD FLAVORS MARKET, BY PRODUCT TYPE, 2021-2030, VOLUME (ASP)
TABLE 371 MEXICO CITRUS FLAVORS IN FOOD FLAVORS MARKET, BY PRODUCT TYPE, 2021-2030 (USD MILLION)
TABLE 372 MEXICO DAIRY FLAVORS IN FOOD FLAVORS MARKET, BY TYPE, 2021-2030 (USD MILLION)
TABLE 373 MEXICO DAIRY FLAVORS IN FOOD FLAVORS MARKET, BY PRODUCT TYPE, 2021-2030, VOLUME (KILO LITERS)
TABLE 374 MEXICO DAIRY FLAVORS IN FOOD FLAVORS MARKET, BY PRODUCT TYPE, 2021-2030, VOLUME (ASP)
TABLE 375 MEXICO BUTTER FLAVOR IN FOOD FLAVORS MARKET, BY TYPE, 2021-2030 (USD MILLION)
TABLE 376 MEXICO DAIRY FLAVORS IN FOOD FLAVORS MARKET, BY PRODUCT TYPE, 2021-2030 (USD MILLION)
TABLE 377 MEXICO NUTTY FLAVORS IN FOOD FLAVORS MARKET, BY TYPE, 2021-2030 (USD MILLION)
TABLE 378 MEXICO NUTTY FLAVORS IN FOOD FLAVORS MARKET, BY PRODUCT TYPE, 2021-2030, VOLUME (KILO LITERS)
TABLE 379 MEXICO NUTTY FLAVORS IN FOOD FLAVORS MARKET, BY PRODUCT TYPE, 2021-2030, VOLUME (ASP)
TABLE 380 MEXICO NUTTY FLAVORS IN FOOD FLAVORS MARKET, BY PRODUCT TYPE, 2021-2030 (USD MILLION)
TABLE 381 MEXICO VEGETABLE EXTRACTS IN FOOD FLAVORS MARKET, BY TYPE, 2021-2030 (USD MILLION)
TABLE 382 MEXICO VEGETABLE EXTRACT IN FOOD FLAVORS MARKET, BY PRODUCT TYPE, 2021-2030, VOLUME (KILO LITERS)
TABLE 383 MEXICO VEGETABLE EXTRACT IN FOOD FLAVORS MARKET, BY PRODUCT TYPE, 2021-2030, VOLUME (ASP)
TABLE 384 MEXICO VEGETABLE EXTRACTS IN FOOD FLAVORS MARKET, BY PRODUCT TYPE, 2021-2030 (USD MILLION)
TABLE 385 MEXICO COFFEE FLAVORS IN FOOD FLAVORS MARKET, BY PRODUCT TYPE, 2021-2030 (USD MILLION)
TABLE 386 MEXICO COFFEE FLAVORS IN FOOD FLAVORS MARKET, BY PRODUCT TYPE, 2021-2030, VOLUME (KILO LITERS)
TABLE 387 MEXICO COFFEE FLAVORS IN FOOD FLAVORS MARKET, BY PRODUCT TYPE, 2021-2030, VOLUME (ASP)
TABLE 388 MEXICO CHOCOLATE FLAVORS IN FOOD FLAVORS MARKET, BY PRODUCT TYPE, 2021-2030 (USD MILLION)
TABLE 389 MEXICO CHOCOLATE FLAVORS IN FOOD FLAVORS MARKET, BY PRODUCT TYPE, 2021-2030, VOLUME (KILO LITERS)
TABLE 390 MEXICO CHOCOLATE FLAVORS IN FOOD FLAVORS MARKET, BY PRODUCT TYPE, 2021-2030, VOLUME (ASP)
TABLE 391 MEXICO DATE DERIVATIVES IN FOOD FLAVORS MARKET, BY PRODUCT TYPE, 2021-2030 (USD MILLION)
TABLE 392 MEXICO VEGETABLE OILS IN FOOD FLAVORS MARKET, BY TYPE, 2021-2030 (USD MILLION)
TABLE 393 MEXICO VEGETABLE OILS IN FOOD FLAVORS MARKET, BY PRODUCT TYPE, 2021-2030, VOLUME (KILO LITERS)
TABLE 394 MEXICO VEGETABLE OILS IN FOOD FLAVORS MARKET, BY PRODUCT TYPE, 2021-2030, VOLUME (ASP)
TABLE 395 MEXICO VEGETABLE OILS IN FOOD FLAVORS MARKET, BY PRODUCT TYPE, 2021-2030 (USD MILLION)
TABLE 396 MEXICO OTHERS IN FOOD FLAVORS MARKET, BY TYPE, 2021-2030 (USD MILLION)
TABLE 397 MEXICO FOOD FLAVORS MARKET, BY ORIGIN, 2021-2030 (USD MILLION)
TABLE 398 MEXICO FOOD FLAVORS MARKET, BY CATEGORY, 2021-2030 (USD MILLION)
TABLE 399 MEXICO FOOD FLAVORS MARKET, BY SOLUBILITY, 2021-2030 (USD MILLION)
TABLE 400 MEXICO FOOD FLAVORS MARKET, BY FORM, 2021-2030 (USD MILLION)
TABLE 401 MEXICO FOOD FLAVORS MARKET, BY APPLICATION, 2021-2030 (USD MILLION)
TABLE 402 MEXICO CONFECTIONERY IN FOOD FLAVORS MARKET, BY TYPE, 2021-2030 (USD MILLION)
TABLE 403 MEXICO CONFECTIONERY IN FOOD FLAVORS MARKET, BY FLAVOR TYPE, 2021-2030 (USD MILLION)
TABLE 404 MEXICO CONFECTIONERY IN FOOD FLAVORS MARKET, BY PRODUCT TYPE, 2021-2030 (USD MILLION)
TABLE 405 MEXICO BAKERY IN FOOD FLAVORS MARKET, BY TYPE, 2021-2030 (USD MILLION)
TABLE 406 MEXICO BAKERY IN FOOD FLAVORS MARKET, BY FLAVOR TYPE, 2021-2030 (USD MILLION)
TABLE 407 MEXICO BAKERY IN FOOD FLAVORS MARKET, BY PRODUCT TYPE, 2021-2030 (USD MILLION)
TABLE 408 MEXICO CONVENIENCE FOOD IN FOOD FLAVORS MARKET, BY TYPE, 2021-2030 (USD MILLION)
TABLE 409 MEXICO CONVENIENCE FOOD IN FOOD FLAVORS MARKET, BY FLAVOR TYPE, 2021-2030 (USD MILLION)
TABLE 410 MEXICO CONVENIENCE FOOD IN FOOD FLAVORS MARKET, BY PRODUCT TYPE, 2021-2030 (USD MILLION)
TABLE 411 MEXICO SNACKS & EXTRUDED SNACKS IN FOOD FLAVORS MARKET, BY FLAVOR TYPE, 2021-2030 (USD MILLION)
TABLE 412 MEXICO SNACKS & EXTRUDED SNACKS IN FOOD FLAVORS MARKET, BY PRODUCT TYPE, 2021-2030 (USD MILLION)
TABLE 413 MEXICO FROZEN DESSERTS IN FOOD FLAVORS MARKET, BY TYPE, 2021-2030 (USD MILLION)
TABLE 414 MEXICO FROZEN DESSERTS IN FOOD FLAVORS MARKET, BY FLAVOR TYPE, 2021-2030 (USD MILLION)
TABLE 415 MEXICO FROZEN DESSERTS IN FOOD FLAVORS MARKET, BY PRODUCT TYPE, 2021-2030 (USD MILLION)
TABLE 416 MEXICO MEAT AND POULTRY PRODUCTS IN FOOD FLAVORS MARKET, BY TYPE, 2021-2030 (USD MILLION)
TABLE 417 MEXICO MEAT AND POULTRY PRODUCTS IN FOOD FLAVORS MARKET, BY FLAVOR TYPE, 2021-2030 (USD MILLION)
TABLE 418 MEXICO MEAT AND POULTRY PRODUCTS IN FOOD FLAVORS MARKET, BY PRODUCT TYPE, 2021-2030 (USD MILLION)
TABLE 419 MEXICO BREAKFAST CEREALS IN FOOD FLAVORS MARKET, BY FLAVOR TYPE, 2021-2030 (USD MILLION)
TABLE 420 MEXICO BREAKFAST CEREALS IN FOOD FLAVORS MARKET, BY PRODUCT TYPE, 2021-2030 (USD MILLION)
TABLE 421 MEXICO PROCESSED FOOD IN FOOD FLAVORS MARKET, BY TYPE, 2021-2030 (USD MILLION)
TABLE 422 MEXICO PROCESSED FOOD IN FOOD FLAVORS MARKET, BY FLAVOR TYPE, 2021-2030 (USD MILLION)
TABLE 423 MEXICO PROCESSED FOOD IN FOOD FLAVORS MARKET, BY PRODUCT TYPE, 2021-2030 (USD MILLION)
TABLE 424 MEXICO BABY FOOD IN FOOD FLAVORS MARKET, BY FLAVOR TYPE, 2021-2030 (USD MILLION)
TABLE 425 MEXICO BABY FOOD IN FOOD FLAVORS MARKET, BY PRODUCT TYPE, 2021-2030 (USD MILLION)
TABLE 426 MEXICO SPORTS NUTRITION IN FOOD FLAVORS MARKET, BY TYPE, 2021-2030 (USD MILLION)
TABLE 427 MEXICO SPORTS NUTRITION IN FOOD FLAVORS MARKET, BY FLAVOR TYPE, 2021-2030 (USD MILLION)
TABLE 428 MEXICO SPORTS NUTRITION IN FOOD FLAVORS MARKET, BY PRODUCT TYPE, 2021-2030 (USD MILLION)
TABLE 429 MEXICO DIETARY SUPPLEMENTS IN FOOD FLAVORS MARKET, BY TYPE, 2021-2030 (USD MILLION)
TABLE 430 MEXICO DIETARY SUPPLEMENTS IN FOOD FLAVORS MARKET, BY FLAVOR TYPE, 2021-2030 (USD MILLION)
TABLE 431 MEXICO DIETARY SUPPLEMENTS IN FOOD FLAVORS MARKET, BY PRODUCT TYPE, 2021-2030 (USD MILLION)
TABLE 432 MEXICO BEVERAGES IN FOOD FLAVORS MARKET, BY TYPE, 2021-2030 (USD MILLION)
TABLE 433 MEXICO BEVERAGES IN FOOD FLAVORS MARKET, BY FLAVOR TYPE, 2021-2030 (USD MILLION)
TABLE 434 MEXICO BEVERAGES IN FOOD FLAVORS MARKET, BY PRODUCT TYPE, 2021-2030 (USD MILLION)
Lista de figuras
FIGURE 1 NORTH AMERICA FOOD FLAVORS MARKET: SEGMENTATION
FIGURE 2 NORTH AMERICA FOOD FLAVORS MARKET: DATA TRIANGULATION
FIGURE 3 NORTH AMERICA FOOD FLAVORS MARKET: DROC ANALYSIS
FIGURE 4 NORTH AMERICA FOOD FLAVORS MARKET: NORTH AMERICA VS. REGIONAL MARKET ANALYSIS
FIGURE 5 NORTH AMERICA FOOD FLAVORS MARKET: COMPANY RESEARCH ANALYSIS
FIGURE 6 NORTH AMERICA FOOD FLAVORS MARKET: MULTIVARIATE MODELLING
FIGURE 7 NORTH AMERICA FOOD FLAVORS MARKET: INTERVIEW DEMOGRAPHICS
FIGURE 8 NORTH AMERICA FOOD FLAVORS MARKET: DBMR MARKET POSITION GRID
FIGURE 9 NORTH AMERICA FOOD FLAVORS MARKET: VENDOR SHARE ANALYSIS
FIGURE 10 NORTH AMERICA FOOD FLAVORS MARKET: MARKET END COVERAGE GRID
FIGURE 11 NORTH AMERICA FOOD FLAVORS MARKET: SEGMENTATION
FIGURE 12 AN INCREASE IN THE INCIDENCE OF GASTROINTESTINAL TUMORS, LYMPHOMA, AND ADENOCARCINOMA IS EXPECTED TO DRIVE THE NORTH AMERICA FOOD FLAVORS MARKET GROWTH IN THE FORECAST PERIOD OF 2023 TO 2030
FIGURE 13 APPLICATION SEGMENT IS EXPECTED TO ACCOUNT FOR THE LARGEST SHARE OF THE NORTH AMERICA FOOD FLAVORS MARKET IN 2023 & 2030
FIGURE 14 FLAVORS AND FRAGRANCES VALUE CHAIN
FIGURE 15 DRIVERS, RESTRAINTS, OPPORTUNITIES AND CHALLENGES OF THE NORTH AMERICA FOOD FLAVORS MARKET
FIGURE 16 NORTH AMERICA FOOD FLAVORS MARKET: BY PRODUCT TYPE, 2022
FIGURE 17 NORTH AMERICA FOOD FLAVORS MARKET: BY PRODUCT TYPE, 2023-2030 (USD MILLION)
FIGURE 18 NORTH AMERICA FOOD FLAVORS MARKET: BY PRODUCT TYPE, CAGR (2023-2030)
FIGURE 19 NORTH AMERICA FOOD FLAVORS MARKET: BY PRODUCT TYPE, LIFELINE CURVE
FIGURE 20 NORTH AMERICA FOOD FLAVORS MARKET: BY TYPE, 2022
FIGURE 21 NORTH AMERICA FOOD FLAVORS MARKET: BY TYPE, 2023-2030 (USD MILLION)
FIGURE 22 NORTH AMERICA FOOD FLAVORS MARKET: BY TYPE, CAGR (2023-2030)
FIGURE 23 NORTH AMERICA FOOD FLAVORS MARKET: BY TYPE, LIFELINE CURVE
FIGURE 24 NORTH AMERICA FOOD FLAVORS MARKET: BY ORIGIN, 2022
FIGURE 25 NORTH AMERICA FOOD FLAVORS MARKET: BY ORIGIN, 2023-2030 (USD MILLION)
FIGURE 26 NORTH AMERICA FOOD FLAVORS MARKET: BY ORIGIN, CAGR (2023-2030)
FIGURE 27 NORTH AMERICA FOOD FLAVORS MARKET: BY ORIGIN, LIFELINE CURVE
FIGURE 28 NORTH AMERICA FOOD FLAVORS MARKET: BY CATEGORY, 2022
FIGURE 29 NORTH AMERICA FOOD FLAVORS MARKET: BY CATEGORY, 2023-2030 (USD MILLION)
FIGURE 30 NORTH AMERICA FOOD FLAVORS MARKET: BY CATEGORY, CAGR (2023-2030)
FIGURE 31 NORTH AMERICA FOOD FLAVORS MARKET: BY CATEGORY, LIFELINE CURVE
FIGURE 32 NORTH AMERICA FOOD FLAVORS MARKET: BY SOLUBILITY, 2022
FIGURE 33 NORTH AMERICA FOOD FLAVORS MARKET: BY SOLUBILITY, 2023-2030 (USD MILLION)
FIGURE 34 NORTH AMERICA FOOD FLAVORS MARKET: BY SOLUBILITY, CAGR (2023-2030)
FIGURE 35 NORTH AMERICA FOOD FLAVORS MARKET: BY SOLUBILITY, LIFELINE CURVE
FIGURE 36 NORTH AMERICA FOOD FLAVORS MARKET: BY FORM, 2022
FIGURE 37 NORTH AMERICA FOOD FLAVORS MARKET: BY FORM, 2023-2030 (USD MILLION)
FIGURE 38 NORTH AMERICA FOOD FLAVORS MARKET: BY FORM, CAGR (2023-2030)
FIGURE 39 NORTH AMERICA FOOD FLAVORS MARKET: BY FORM, LIFELINE CURVE
FIGURE 40 NORTH AMERICA FOOD FLAVORS MARKET: BY APPLICATION, 2022
FIGURE 41 NORTH AMERICA FOOD FLAVORS MARKET: BY APPLICATION, 2023-2030 (USD MILLION)
FIGURE 42 NORTH AMERICA FOOD FLAVORS MARKET: BY APPLICATION, CAGR (2023-2030)
FIGURE 43 NORTH AMERICA FOOD FLAVORS MARKET: BY APPLICATION, LIFELINE CURVE
FIGURE 44 NORTH AMERICA FOOD FLAVORS MARKET: SNAPSHOT (2022)
FIGURE 45 NORTH AMERICA FOOD FLAVORS MARKET: BY COUNTRY (2022)
FIGURE 46 NORTH AMERICA FOOD FLAVORS MARKET: BY COUNTRY (2023 & 2030)
FIGURE 47 NORTH AMERICA FOOD FLAVORS MARKET: BY COUNTRY (2022 & 2030)
FIGURE 48 NORTH AMERICA FOOD FLAVORS MARKET: BY PRODUCT TYPE (2023-2030)
FIGURE 49 NORTH AMERICA FOOD AND FLAVORS MARKET: COMPANY SHARE 2022 (%)
Metodología de investigación
La recopilación de datos y el análisis del año base se realizan utilizando módulos de recopilación de datos con muestras de gran tamaño. La etapa incluye la obtención de información de mercado o datos relacionados a través de varias fuentes y estrategias. Incluye el examen y la planificación de todos los datos adquiridos del pasado con antelación. Asimismo, abarca el examen de las inconsistencias de información observadas en diferentes fuentes de información. Los datos de mercado se analizan y estiman utilizando modelos estadísticos y coherentes de mercado. Además, el análisis de la participación de mercado y el análisis de tendencias clave son los principales factores de éxito en el informe de mercado. Para obtener más información, solicite una llamada de un analista o envíe su consulta.
La metodología de investigación clave utilizada por el equipo de investigación de DBMR es la triangulación de datos, que implica la extracción de datos, el análisis del impacto de las variables de datos en el mercado y la validación primaria (experto en la industria). Los modelos de datos incluyen cuadrícula de posicionamiento de proveedores, análisis de línea de tiempo de mercado, descripción general y guía del mercado, cuadrícula de posicionamiento de la empresa, análisis de patentes, análisis de precios, análisis de participación de mercado de la empresa, estándares de medición, análisis global versus regional y de participación de proveedores. Para obtener más información sobre la metodología de investigación, envíe una consulta para hablar con nuestros expertos de la industria.
Personalización disponible
Data Bridge Market Research es líder en investigación formativa avanzada. Nos enorgullecemos de brindar servicios a nuestros clientes existentes y nuevos con datos y análisis que coinciden y se adaptan a sus objetivos. El informe se puede personalizar para incluir análisis de tendencias de precios de marcas objetivo, comprensión del mercado de países adicionales (solicite la lista de países), datos de resultados de ensayos clínicos, revisión de literatura, análisis de mercado renovado y base de productos. El análisis de mercado de competidores objetivo se puede analizar desde análisis basados en tecnología hasta estrategias de cartera de mercado. Podemos agregar tantos competidores sobre los que necesite datos en el formato y estilo de datos que esté buscando. Nuestro equipo de analistas también puede proporcionarle datos en archivos de Excel sin procesar, tablas dinámicas (libro de datos) o puede ayudarlo a crear presentaciones a partir de los conjuntos de datos disponibles en el informe.

