
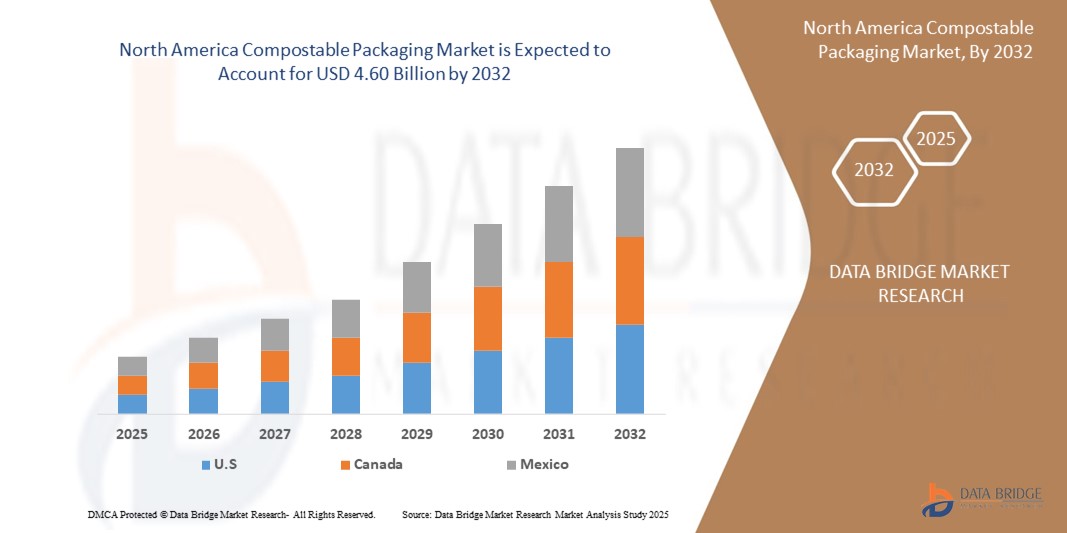
North America Compostable Packaging Market
Tamaño del mercado en miles de millones de dólares
Tasa de crecimiento anual compuesta (CAGR) :
% 
 USD
1.32 Billion
USD
4.60 Billion
2024
2032
USD
1.32 Billion
USD
4.60 Billion
2024
2032
| 2025 –2032 | |
| USD 1.32 Billion | |
| USD 4.60 Billion | |
| % | |
|
Segmentación del mercado de envases compostables en Norteamérica por tipo de producto (bolsas, bandejas, vasos, platos, películas, tapas, pajitas, cubiertos, tazones, envases tipo almeja, bolsas y sobres, entre otros), material (plástico, papel y cartón, entre otros), capa de envasado (envase primario, secundario y terciario), canal de distribución (B2B, supermercados/hipermercados, tiendas departamentales, tiendas de conveniencia, tiendas especializadas, comercio electrónico, entre otros), usuario final (alimentos y bebidas, medicina, automoción, electricidad y electrónica, agricultura, productos textiles, cuidado personal y del hogar, productos químicos, entre otros): tendencias del sector y pronóstico hasta 2032.
Tamaño del mercado de envases compostables
- El tamaño del mercado de envases compostables de América del Norte se valoró en 1.320 millones de dólares en 2024 y se espera que alcance los 4.600 millones de dólares en 2032 , con una CAGR del 16,90 % durante el período de pronóstico.
- El crecimiento del mercado se debe en gran medida a la creciente conciencia ambiental y a las estrictas regulaciones gubernamentales destinadas a reducir los desechos plásticos, lo que impulsa a las industrias y a los consumidores a cambiar hacia alternativas de embalaje ecológicas y compostables.
- Además, la rápida expansión de los sectores de entrega de alimentos y comercio electrónico, especialmente en las economías emergentes, está impulsando la demanda de soluciones de embalaje sostenibles que sean funcionales y biodegradables, lo que acelera significativamente la adopción en el mercado.
Análisis del mercado de envases compostables
- Los envases compostables, diseñados para descomponerse naturalmente en componentes no tóxicos, están ganando terreno en las industrias debido a las crecientes preocupaciones ambientales, las regulaciones gubernamentales sobre plásticos de un solo uso y la creciente demanda de alternativas sostenibles en aplicaciones de envases industriales y de consumo.
- La creciente demanda de envases compostables se debe principalmente a una mayor conciencia ambiental entre los consumidores, la expansión del comercio electrónico y los servicios de entrega de alimentos, y una creciente preferencia por materiales de embalaje biodegradables y ecológicos en lugar de los plásticos convencionales.
- Estados Unidos dominó el mercado de envases compostables con la mayor participación en los ingresos en 2024, impulsado por tecnologías de envasado avanzadas, marcos regulatorios sólidos que promueven la sostenibilidad y la creciente preferencia de los consumidores por soluciones de envasado ecológicas.
- Se espera que Canadá sea el mercado de más rápido crecimiento para los envases compostables durante el período de pronóstico, debido a las prohibiciones a nivel nacional sobre los plásticos de un solo uso, la creciente conciencia ambiental y las iniciativas federales y provinciales de apoyo que fomentan alternativas compostables en todas las industrias.
- El segmento de bolsas tuvo la mayor participación de mercado en 2024, valorada en aproximadamente USD 9,6 millones, impulsado por su amplia aplicación en los sectores minorista, de servicios de alimentación y de comestibles, las crecientes prohibiciones de las bolsas de plástico convencionales y la creciente preferencia de los consumidores por soluciones de transporte compostables.
Alcance del informe y segmentación del mercado de envases compostables
|
Atributos |
Perspectivas clave del mercado de envases compostables |
|
Segmentos cubiertos |
|
|
Países cubiertos |
América del norte
|
|
Actores clave del mercado |
|
|
Oportunidades de mercado |
|
|
Conjuntos de información de datos de valor añadido |
Además de los conocimientos sobre escenarios de mercado como valor de mercado, tasa de crecimiento, segmentación, cobertura geográfica y actores principales, los informes de mercado seleccionados por Data Bridge Market Research también incluyen análisis de importación y exportación, descripción general de la capacidad de producción, análisis del consumo de producción, análisis de tendencias de precios, escenario de cambio climático, análisis de la cadena de suministro, análisis de la cadena de valor, descripción general de materias primas/consumibles, criterios de selección de proveedores, análisis PESTLE, análisis de Porter y marco regulatorio. |
Tendencias del mercado de envases compostables
Innovación creciente en materiales biopoliméricos e infraestructura de compostaje
- Una tendencia significativa y en auge en el mercado norteamericano de envases compostables es el rápido avance en la innovación de biopolímeros, en particular materiales como PLA (ácido poliláctico), PHA (polihidroxialcanoatos) y mezclas de almidón, que ofrecen mayor durabilidad, compostabilidad y versatilidad en diversas aplicaciones de envasado. Estas innovaciones están ayudando a reducir la brecha de rendimiento entre los plásticos tradicionales y las alternativas compostables, lo que permite una adopción más amplia en los sectores de alimentación y bebidas, salud y comercio minorista.
- Por ejemplo, NatureWorks LLC ha ampliado su línea de biopolímeros Ingeo™ PLA, diseñados para ofrecer alta resistencia al calor y una transparencia superior, atributos ideales para aplicaciones de envasado de alimentos como envases tipo concha y vasos para bebidas frías. De igual manera, las películas NatureFlex™ de Futamura Group siguen ganando terreno gracias a sus altas propiedades de barrera y a sus certificaciones para compostaje industrial y doméstico.
- Paralelamente, desarrollos de infraestructura como programas municipales de compostaje, sistemas descentralizados de compostaje y colaboraciones entre gobiernos locales y proveedores de envases están transformando la gestión de residuos en la región. Varios estados de EE. UU. y provincias de Canadá están implementando iniciativas piloto de compostaje en la acera y formalizando directrices para envases compostables en los sistemas públicos de gestión de residuos.
- Otra tendencia importante es el cambio de imagen de marca hacia la responsabilidad ambiental. Las empresas aprovechan cada vez más los envases compostables para su posicionamiento de sostenibilidad, utilizando etiquetas ecológicas visibles, diseños de impresión minimalistas y características biodegradables para atraer al consumidor con conciencia ambiental, especialmente en zonas urbanas de Estados Unidos y Canadá.
Dinámica del mercado de envases compostables
Conductor
Prohibiciones gubernamentales y compromisos corporativos con la sostenibilidad
- Uno de los principales impulsores del crecimiento de los envases compostables en Norteamérica es el aumento de las medidas gubernamentales para reducir los plásticos de un solo uso. Legislaciones como la prohibición canadiense de los plásticos nocivos de un solo uso y diversas restricciones estatales en EE. UU. (por ejemplo, California, Nueva York y Washington) están impulsando una rápida transición del mercado hacia las alternativas compostables.
- Por ejemplo, el Pacto de los Plásticos de EE. UU. y la Estrategia Cero Residuos Plásticos de Canadá incentivan a la industria a sustituir los envases de plástico convencionales por soluciones compostables. Este impulso regulatorio se ve reforzado por objetivos corporativos voluntarios. Grandes marcas como Unilever, Nestlé y PepsiCo se han comprometido a utilizar exclusivamente envases reciclables, compostables o reutilizables para 2025-2030, acelerando así la innovación y la adopción en toda la cadena de suministro.
- Estos esfuerzos están respaldados por una creciente conciencia ambiental entre los consumidores y el aumento de las inversiones públicas y privadas en instalaciones de compostaje industrial y tecnologías de clasificación de residuos que mejoran la eficiencia de la recolección y eliminación.
Restricción/Desafío
Falta de infraestructura para el compostaje y alto costo de los materiales
- Un desafío crítico que enfrenta el mercado norteamericano de envases compostables es la insuficiente disponibilidad de infraestructura para el compostaje industrial. Muchas zonas urbanas y rurales de EE. UU. y Canadá carecen de instalaciones de compostaje certificadas, lo que dificulta la correcta eliminación de los materiales compostables, anulando así sus beneficios ambientales.
- Como resultado, los envases compostables a menudo terminan en vertederos o incineradores, donde no se descomponen adecuadamente, lo que genera escepticismo entre los consumidores y una adopción limitada por parte de las empresas.
- Además, el alto costo de las materias primas, como el PLA y el PHA, en comparación con los plásticos tradicionales derivados del petróleo, restringe su uso entre las empresas sensibles a los precios, especialmente las pequeñas y medianas empresas (PYME).
- Para superar estos problemas, se necesitan esfuerzos coordinados, incluyendo inversiones impulsadas por políticas en infraestructura de compostaje, subsidios o incentivos fiscales para la adopción de envases sostenibles e I+D de materiales de origen biológico asequibles y de origen local que puedan cumplir con los requisitos de rendimiento y al mismo tiempo reducir los costos.
Alcance del mercado de envases compostables
El mercado está segmentado según el tipo de producto, material, capa de embalaje, canal de distribución y usuario final.
• Por tipo de producto
Según el tipo de producto, el mercado de envases compostables de Norteamérica se segmenta en bolsas, bandejas, vasos, platos, películas, tapas, pajitas, cubiertos, tazones, envases tipo clamshell, bolsas y sobres, entre otros. El segmento de bolsas registró la mayor cuota de mercado en 2024, principalmente debido a su amplia aplicación en los sectores de alimentación, comercio minorista y reparto de comida a domicilio. El aumento de las prohibiciones de las bolsas de plástico convencionales en países como India, Tailandia y Australia ha generado una importante demanda de alternativas compostables. Las bolsas compostables son valoradas por su biodegradabilidad, cumplimiento normativo y atractivo para el consumidor, especialmente en los mercados urbanos con conciencia ecológica.
Se prevé que el segmento de envases clamshell registre la tasa de crecimiento anual compuesta (TCAC) más rápida entre 2025 y 2032. Su popularidad está aumentando rápidamente en los envases de comida lista para consumir y en los servicios de comida para llevar gracias a su comodidad, robustez y compostabilidad. Las innovaciones en envases clamshell resistentes al calor, tanto a base de PLA como de papel, contribuyen aún más al impulso de este segmento.
• Por material
Según el material, el mercado se segmenta en plástico, papel y cartón, entre otros. El segmento de plástico dominó el mercado en 2024, impulsado principalmente por el uso extensivo de bioplásticos como el PLA y polímeros a base de almidón, que imitan la flexibilidad y resistencia de los plásticos convencionales, a la vez que ofrecen propiedades compostables. La rentabilidad y la facilidad de procesamiento del PLA lo convierten en la opción preferida para la producción en masa, especialmente en aplicaciones de un solo uso en el sector de la restauración.
Se prevé que el segmento de papel y cartón crezca a la mayor tasa de crecimiento anual compuesta (TCAC) durante el período de pronóstico. La biodegradabilidad natural, la reciclabilidad y el atractivo estético de los envases de papel han impulsado su uso, especialmente para marcas ecológicas en los sectores del cuidado personal y la alimentación y bebidas.
• Por capa de embalaje
Según la capa de envasado, el mercado se segmenta en envases primarios, secundarios y terciarios. El segmento de envases primarios representó la mayor cuota de mercado en 2024, debido a su contacto directo con productos de los sectores alimentario, médico y minorista. Esto incluye bandejas, vasos y bolsas compostables que mantienen la frescura y garantizan la seguridad alimentaria, a la vez que cumplen con las normativas de reducción de plástico.
Se espera que el segmento de embalaje secundario registre el mayor crecimiento durante el período de pronóstico, a medida que las marcas optan cada vez más por embalajes exteriores sostenibles para envíos, presentaciones y desarrollo de marca. El cartón corrugado compostable y las soluciones de pulpa moldeada están ganando terreno en la electrónica y los bienes de consumo.
• Por canal de distribución
Según el canal de distribución, el mercado se segmenta en B2B, supermercados/hipermercados, tiendas departamentales, tiendas de conveniencia, tiendas especializadas, comercio electrónico, entre otros. El segmento B2B tuvo la mayor participación en 2024, ya que las cadenas de alimentación, las empresas de hostelería y los mayoristas de envases adquirieron envases compostables a granel para su uso operativo y reventa. Las alianzas entre fabricantes de envases y cadenas de restaurantes, especialmente en los mercados urbanos de Japón y Singapur, impulsan este segmento.
Se prevé que el segmento del comercio electrónico experimente la CAGR más alta entre 2025 y 2032. La creciente tendencia de las plataformas de compra en línea ecológicas y la disponibilidad de opciones de embalaje compostables personalizables a través de canales digitales están mejorando la accesibilidad y la concienciación entre las pymes y las empresas emergentes.
• Por el usuario final
Por usuario final, el mercado se segmenta en alimentos y bebidas, medicina, automoción, electricidad y electrónica, agricultura, productos textiles, cuidado personal y del hogar, productos químicos, entre otros. El segmento de alimentos y bebidas mantuvo la cuota de mercado dominante en 2024, impulsado por la demanda de alternativas ecológicas para vajillas, envases y embalajes desechables para comida para llevar. La presión regulatoria sobre los establecimientos de restauración y la creciente preferencia de los consumidores por la alimentación sostenible han impulsado el crecimiento en países como Australia, Corea del Sur e India.
Se prevé que el segmento de cuidado personal y del hogar crezca a un ritmo acelerado durante el período de pronóstico, a medida que las marcas de cosméticos y bienestar adoptan envases sostenibles para alinearse con sus estrategias de marketing ecológico. Los sobres y frascos compostables fabricados con materiales de origen biológico están ganando popularidad entre los consumidores con conciencia ambiental.
Análisis regional del mercado de envases compostables de América del Norte
- Estados Unidos dominó el mercado de envases compostables con la mayor participación en los ingresos en 2024, impulsado por tecnologías de envasado avanzadas, marcos regulatorios sólidos que promueven la sostenibilidad y la creciente preferencia de los consumidores por soluciones de envasado ecológicas.
- Los fabricantes colaboran cada vez más con las principales cadenas de servicios de alimentación y minoristas para ofrecer envases compostables a medida que se ajustan tanto a las exigencias ambientales como al posicionamiento de la marca. La expansión de las líneas automatizadas de envasado compostable está mejorando la eficiencia de la producción y la personalización.
- La expansión del mercado también está respaldada por el aumento de las inversiones de capital de riesgo en empresas emergentes de embalajes sustentables y por iniciativas políticas como el Pacto de Plásticos de EE. UU. y las leyes de Responsabilidad Extendida del Productor (EPR) de California destinadas a reducir los desechos plásticos.
Perspectiva del mercado de envases compostables de Canadá
Se prevé que Canadá experimente un crecimiento significativo durante el período de pronóstico, impulsado por el Reglamento de Prohibición de Plásticos de un Solo Uso del gobierno federal y la fuerte demanda de envases sostenibles por parte de los consumidores. Los programas municipales de compostaje en provincias como Columbia Británica y Ontario están mejorando la capacidad de procesamiento de residuos. Además, la colaboración entre empresas locales y empresas innovadoras en envases está impulsando el desarrollo de soluciones de compostaje doméstico adaptadas a las normas ambientales canadienses y las preferencias de los consumidores.
Cuota de mercado de los envases compostables
La industria de los envases compostables está liderada principalmente por empresas bien establecidas, entre las que se incluyen:
- International Paper (EE. UU.)
- Mondi (Reino Unido)
- BASF SE (Alemania)
- Sede de Be Green Packaging (EE. UU.)
- Grupo Futamura (Japón)
- WestRock Company (EE. UU.)
- BIOPAK (Australia)
- Amcor plc (Suiza)
- Wuxi Topteam Co. Ltd (China)
- NatureWorks LLC (EE. UU.)
- Ecolifellc.com (EE. UU.)
- Lithey Inc. (India)
- Biotec Pvt. Ltd. (India)
- Avani Eco (Indonesia)
SKU-
Obtenga acceso en línea al informe sobre la primera nube de inteligencia de mercado del mundo

- Panel de análisis de datos interactivo
- Panel de análisis de empresas para oportunidades con alto potencial de crecimiento
- Acceso de analista de investigación para personalización y consultas
- Análisis de la competencia con panel interactivo
- Últimas noticias, actualizaciones y análisis de tendencias
- Aproveche el poder del análisis de referencia para un seguimiento integral de la competencia
Metodología de investigación
La recopilación de datos y el análisis del año base se realizan utilizando módulos de recopilación de datos con muestras de gran tamaño. La etapa incluye la obtención de información de mercado o datos relacionados a través de varias fuentes y estrategias. Incluye el examen y la planificación de todos los datos adquiridos del pasado con antelación. Asimismo, abarca el examen de las inconsistencias de información observadas en diferentes fuentes de información. Los datos de mercado se analizan y estiman utilizando modelos estadísticos y coherentes de mercado. Además, el análisis de la participación de mercado y el análisis de tendencias clave son los principales factores de éxito en el informe de mercado. Para obtener más información, solicite una llamada de un analista o envíe su consulta.
La metodología de investigación clave utilizada por el equipo de investigación de DBMR es la triangulación de datos, que implica la extracción de datos, el análisis del impacto de las variables de datos en el mercado y la validación primaria (experto en la industria). Los modelos de datos incluyen cuadrícula de posicionamiento de proveedores, análisis de línea de tiempo de mercado, descripción general y guía del mercado, cuadrícula de posicionamiento de la empresa, análisis de patentes, análisis de precios, análisis de participación de mercado de la empresa, estándares de medición, análisis global versus regional y de participación de proveedores. Para obtener más información sobre la metodología de investigación, envíe una consulta para hablar con nuestros expertos de la industria.
Personalización disponible
Data Bridge Market Research es líder en investigación formativa avanzada. Nos enorgullecemos de brindar servicios a nuestros clientes existentes y nuevos con datos y análisis que coinciden y se adaptan a sus objetivos. El informe se puede personalizar para incluir análisis de tendencias de precios de marcas objetivo, comprensión del mercado de países adicionales (solicite la lista de países), datos de resultados de ensayos clínicos, revisión de literatura, análisis de mercado renovado y base de productos. El análisis de mercado de competidores objetivo se puede analizar desde análisis basados en tecnología hasta estrategias de cartera de mercado. Podemos agregar tantos competidores sobre los que necesite datos en el formato y estilo de datos que esté buscando. Nuestro equipo de analistas también puede proporcionarle datos en archivos de Excel sin procesar, tablas dinámicas (libro de datos) o puede ayudarlo a crear presentaciones a partir de los conjuntos de datos disponibles en el informe.

