

Middle East And Africa Plastic Compounding Market
Tamaño del mercado en miles de millones de dólares
Tasa de crecimiento anual compuesta (CAGR) :
% 
 USD
10.48 Billion
USD
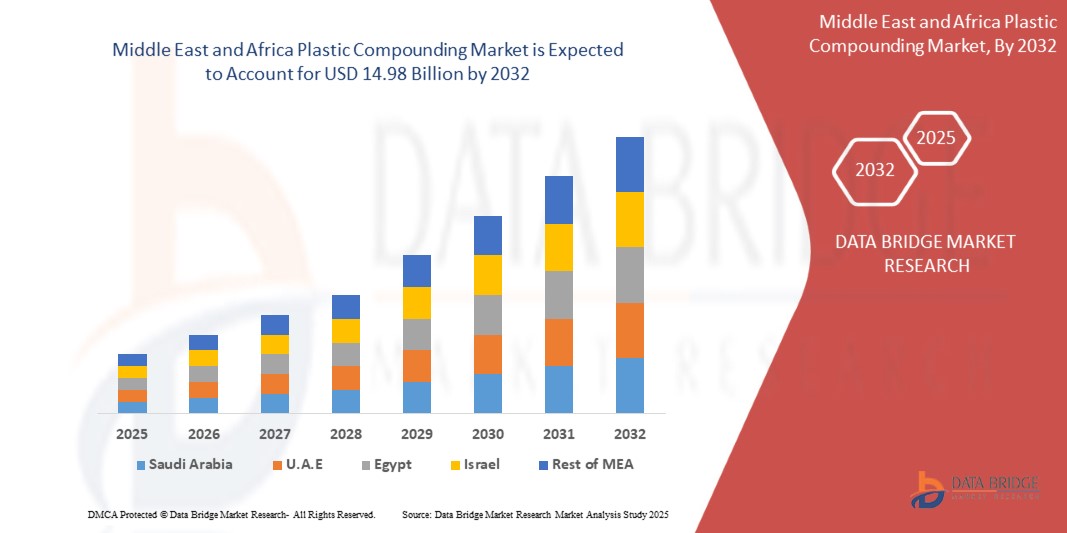
14.98 Billion
2024
2032
USD
10.48 Billion
USD
14.98 Billion
2024
2032
| 2025 –2032 | |
| USD 10.48 Billion | |
| USD 14.98 Billion | |
| % | |
|
Segmentación del mercado de compuestos plásticos en Oriente Medio y África por tipo de polímero (termoplásticos, termoestables, plásticos de ingeniería, bioplásticos, etc.), tipo de relleno (rellenos minerales, refuerzos, aditivos, etc.), proceso de fabricación (extrusión, compactación/prensado, amasadora/mezcla Banbury, compuestos por moldeo por inyección, etc.), propiedades (resistencia, durabilidad, flexibilidad, resistencia al impacto, rigidez, etc.), aplicación (aeroespacial y defensa, embalaje, electricidad y electrónica, energía, construcción, automoción, dispositivos médicos, mobiliario, etc.): tendencias y pronóstico del sector hasta 2032.
Tamaño del mercado de compuestos plásticos en Oriente Medio y África
- El tamaño del mercado de compuestos plásticos de Oriente Medio y África se valoró en 10.480 millones de dólares en 2024 y se espera que alcance los 14.980 millones de dólares en 2032 , con una CAGR del 4,61 % durante el período de pronóstico mediante un cambio hacia compuestos plásticos reciclables y biodegradables debido a las regulaciones ambientales, los avances en las tecnologías de compuestos que mejoran el rendimiento y la rentabilidad de los productos y las políticas e iniciativas gubernamentales de apoyo que promueven el uso de plásticos en diversas industrias.
- Además, se espera que el mercado aumente el uso de bioplásticos y alternativas de compuestos sostenibles, el aumento en la adopción de vehículos eléctricos que requieren polímeros avanzados y la creciente demanda de soluciones plásticas reciclables y circulares.
Análisis del mercado de compuestos plásticos en Oriente Medio y África
- El aumento global en el cambio hacia compuestos plásticos reciclables y biodegradables debido a las regulaciones ambientales, los avances en las tecnologías de compuestos que mejoran el rendimiento del producto y la rentabilidad.
- Los factores clave incluyen el aumento global en el cambio hacia compuestos plásticos reciclables y biodegradables debido a las regulaciones ambientales, los avances en tecnologías de compuestos que mejoran el rendimiento y la rentabilidad de los productos, la creciente demanda de los sectores de transmisión de energía y el aumento de las inversiones en la modernización de la red y la infraestructura transfronteriza.
- Arabia Saudita domina el mercado de compuestos plásticos de Medio Oriente y África, con la mayor participación en los ingresos del 24,38 % en 2024, atribuida a su amplia base poblacional, la creciente prevalencia del prolapso de órganos pélvicos (POP) y la incontinencia urinaria (IU), el aumento del gasto en salud y la rápida adopción de dispositivos médicos innovadores en ciudades de nivel 1 y nivel 2.
- Se proyecta que Arabia Saudita será el país de más rápido crecimiento en el mercado durante el período de pronóstico, impulsado por su adopción generalizada de compuestos eficientes y continuos y la creciente demanda de compuestos plásticos de alta calidad en diversas industrias.
- Se espera que el segmento de termoplásticos domine el mercado de compuestos plásticos de Medio Oriente y África, con una participación de mercado del 63,58 % en 2025, debido a su adopción generalizada para compuestos eficientes y continuos y la creciente demanda de compuestos plásticos de alta calidad en varias industrias.
Alcance del informe y segmentación del mercado de compuestos plásticos en Oriente Medio y África
|
Atributos |
Perspectivas clave del mercado de compuestos plásticos en Oriente Medio y África |
|
Segmentos cubiertos |
|
|
Países cubiertos |
Oriente Medio y África
|
|
Actores clave del mercado |
|
|
Oportunidades de mercado |
|
|
Conjuntos de información de datos de valor añadido |
Además de los conocimientos sobre escenarios de mercado como valor de mercado, tasa de crecimiento, segmentación, cobertura geográfica y actores principales, los informes de mercado seleccionados por Data Bridge Market Research también incluyen análisis de importación y exportación, descripción general de la capacidad de producción, análisis del consumo de producción, análisis de tendencias de precios, escenario de cambio climático, análisis de la cadena de suministro, análisis de la cadena de valor, descripción general de materias primas/consumibles, criterios de selección de proveedores, análisis PESTLE, análisis de Porter y marco regulatorio. |
Tendencias del mercado de compuestos plásticos en Oriente Medio y África
Creciente demanda de plásticos de alto rendimiento
- La demanda de compuestos plásticos de alto rendimiento está creciendo rápidamente, impulsada por la creciente urbanización, la actividad industrial y el creciente uso de vehículos eléctricos e infraestructuras inteligentes. Los compuestos plásticos avanzados abordan estos desafíos ofreciendo mayor durabilidad, eficiencia energética y un rendimiento superior del producto.
- A medida que los países se centran en reducir las emisiones de carbono y mejorar la estabilidad de la red eléctrica, se observa una tendencia creciente hacia la modernización de la infraestructura eléctrica mediante el uso de compuestos plásticos innovadores. Esta transición es crucial para satisfacer la creciente demanda de electricidad, a la vez que se promueven sistemas de transmisión más limpios y eficientes.
- Los principales actores de la industria, como Covestro, LyondellBasell y BASF, están aumentando significativamente sus esfuerzos de I+D para desarrollar compuestos plásticos de próxima generación que sean más sostenibles, flexibles y de alto rendimiento, impulsando aún más la innovación y el crecimiento del mercado.
- Los avances en la tecnología de compuestos plásticos, caracterizados por una mejor estabilidad térmica, aislamiento eléctrico y resistencia mecánica, impulsan el crecimiento del mercado. Los principales fabricantes desarrollan activamente compuestos especializados para apoyar la integración de energías renovables a gran escala y mejorar la infraestructura energética interregional, impulsando la expansión del mercado global de compuestos plásticos en Oriente Medio y África.
Dinámica del mercado de compuestos plásticos en Oriente Medio y África
Conductor
Cambio hacia compuestos plásticos reciclables y biodegradables debido a las regulaciones ambientales
- La creciente demanda mundial de materiales sostenibles, impulsada por estrictas regulaciones ambientales, la creciente concienciación de los consumidores y los objetivos de sostenibilidad de las empresas, está ejerciendo una enorme presión sobre los métodos tradicionales de producción de plástico. Para afrontar este desafío, muchos fabricantes están acelerando las inversiones en compuestos plásticos reciclables y biodegradables para reducir el impacto ambiental y apoyar iniciativas de economía circular. Estos avances están creando soluciones de materiales más ecológicas, eficientes y preparadas para el futuro, de forma similar a cómo las tecnologías de eficiencia energética optimizan el uso de recursos.
- Por ejemplo, en 2024, varias importantes empresas químicas anunciaron proyectos a gran escala centrados en ampliar la capacidad de fabricación de compuestos de plásticos biodegradables, con el objetivo de satisfacer la creciente demanda de los sectores del embalaje, la automoción y los bienes de consumo. Estas iniciativas se centran en reducir los residuos plásticos, mejorar la reciclabilidad y cumplir con los marcos regulatorios globales, como el Plan de Acción para la Economía Circular de la UE.
- Estas inversiones no solo están transformando las formulaciones de materiales, sino que también permiten una mayor adopción de plásticos sostenibles en todas las industrias. Empresas líderes como BASF, Covestro y LyondellBasell están invirtiendo fuertemente en I+D para desarrollar compuestos plásticos de origen biológico y reciclables de nueva generación, garantizando un mejor rendimiento y cumplimiento ambiental.
- Además, el compromiso continuo de gobiernos, empresas privadas y organismos reguladores desempeña un papel fundamental en la promoción de plásticos reciclables y biodegradables como componente esencial de las iniciativas globales de sostenibilidad. Estas iniciativas están consolidando los compuestos plásticos ecológicos como un factor clave de la economía circular y un importante motor de crecimiento en el mercado global de compuestos plásticos en Oriente Medio y África.
Restricción/Desafío
Volatilidad en los precios de las materias primas, especialmente las derivadas del petróleo, como el polipropileno y el polietileno
- La volatilidad de los precios de las materias primas, en particular las derivadas del petróleo, como el polipropileno y el polietileno, sigue siendo un obstáculo importante para el mercado de compuestos plásticos en Oriente Medio y África. La fluctuación de los precios afecta los costes de producción y la rentabilidad, generando incertidumbre tanto para los fabricantes como para los usuarios finales.
- Además, la dependencia de los mercados de petróleo crudo expone a la industria de compuestos a tensiones geopolíticas, interrupciones en la cadena de suministro y políticas comerciales cambiantes, que pueden conducir a picos repentinos de precios o escasez.
- Por ejemplo, a principios de 2025, las fluctuaciones del precio mundial del petróleo crudo provocaron que los precios del polipropileno variaran más de un 20% en cuestión de meses, lo que afectó directamente los costos de insumos de los fabricantes de compuestos plásticos y obligó a realizar ajustes en las estrategias de precios.
- Además, las materias primas alternativas, como las materias primas de origen biológico, si bien son prometedoras, actualmente están limitadas por los mayores costos y los desafíos de escalabilidad, lo que impide mitigar por completo la volatilidad de los precios del petróleo.
- Esta inestabilidad de precios plantea desafíos para la planificación y la inversión a largo plazo en el sector de compuestos plásticos, especialmente para los pequeños fabricantes y las regiones con menor resiliencia financiera. A pesar de los esfuerzos por diversificar las fuentes de materias primas y mejorar la flexibilidad de la cadena de suministro, la volatilidad de los precios de las materias primas sigue siendo un obstáculo clave para un crecimiento estable.
Alcance del mercado de compuestos plásticos en Oriente Medio y África
El mercado está segmentado según el tipo de polímero, tipo de relleno, proceso de fabricación, propiedades y aplicación.
- Tipo de polímero
Según el tipo de polímero, el mercado se segmenta en termoplásticos, plásticos termoestables, plásticos de ingeniería, bioplásticos y otros. En 2025, se prevé que el segmento de termoplásticos domine el mercado con una cuota de mercado del 63,58 %, con una tasa de crecimiento anual compuesta (TCAC) del 4,22 % entre 2025 y 2032, impulsada por la creciente demanda de materiales ligeros y duraderos en todas las industrias y un mayor enfoque en compuestos plásticos reciclables y sostenibles.
- Tipo de relleno
Según el tipo de relleno, el mercado se segmenta en rellenos minerales, refuerzos, aditivos y otros. En 2025, se prevé que el segmento de rellenos minerales domine el mercado con una cuota de mercado del 50,75 %, con una tasa de crecimiento anual compuesta (TCAC) del 5,24 % entre 2025 y 2032, impulsada por la creciente demanda de mejores propiedades de los materiales, la rentabilidad y su creciente adopción en diversas aplicaciones industriales.
- Proceso de fabricación
Según el proceso de fabricación, el mercado se segmenta en extrusión, compactación/prensado, amasadora/mezcla Banbury, compuestos basados en moldeo por inyección, entre otros. En 2025, se prevé que el segmento de extrusión domine el mercado con una cuota de mercado del 47,19 %, con una tasa de crecimiento anual compuesta (TCAC) del 4,90 % entre 2025 y 2032, impulsada por su adopción generalizada para un compuesto eficiente y continuo, y la creciente demanda de compuestos plásticos de alta calidad en diversas industrias.
- Propiedades
Según sus propiedades, el mercado se segmenta en resistencia, durabilidad, flexibilidad, resistencia al impacto, rigidez, entre otras. En 2025, se prevé que el segmento de resistencia domine el mercado con una cuota de mercado del 32,03 %, con una tasa de crecimiento anual compuesta (TCAC) del 5,10 % entre 2025 y 2032, impulsada por la creciente demanda de compuestos plásticos duraderos y de alto rendimiento en las industrias automotriz, de construcción y de bienes de consumo.
- Solicitud
Según su aplicación, el mercado se segmenta en aeroespacial y defensa, embalaje, electricidad y electrónica, energía y electricidad, construcción, automoción, dispositivos médicos, mobiliario, entre otros. En 2025, se prevé que el segmento automotriz domine el mercado con una cuota de mercado del 30,83 %, con una tasa de crecimiento anual compuesta (TCAC) del 3,67 % entre 2025 y 2032, impulsada por la creciente demanda de compuestos plásticos ligeros, duraderos y reciclables para mejorar la eficiencia del combustible y cumplir con las estrictas normativas ambientales.
Análisis regional del mercado de compuestos plásticos en Oriente Medio y África
- Se espera que el mercado de compuestos plásticos de Oriente Medio y África alcance los 14.980 millones de dólares en 2032, desde los 10.480 millones de dólares en 2024, con un crecimiento de una CAGR del 4,61 % en el período de pronóstico de 2025 a 2032.
- Oriente Medio y África destinan una parte significativa de su PIB a la manufactura y el desarrollo industrial, lo que garantiza una sólida financiación para materiales avanzados y tecnologías innovadoras de compuestos plásticos. Por el contrario, los mercados emergentes están incrementando sus inversiones en compuestos plásticos, impulsados por la creciente industrialización, la urbanización y la creciente demanda de materiales sostenibles y de alto rendimiento. La disponibilidad de financiación, tanto del sector público como del privado, desempeña un papel crucial en la expansión de la capacidad de producción y la adopción de compuestos plásticos avanzados a nivel mundial.
- En Oriente Medio y África, las tecnologías avanzadas de compuestos plásticos se adoptan e integran ampliamente en diversas aplicaciones industriales, impulsando sectores como la automoción, la aeroespacial y la electrónica. Por el contrario, los mercados emergentes con infraestructura de fabricación en desarrollo experimentan un rápido crecimiento de la demanda de compuestos plásticos especializados, impulsado por la expansión de las bases industriales y el aumento de las necesidades en los sectores de la salud, la automoción y el envasado. A medida que estos sistemas sanitarios e industriales se centralizan o privatizan, a menudo se produce un aumento de la inversión en tecnologías de vanguardia para compuestos plásticos, lo que promueve el crecimiento del mercado y la accesibilidad.
Perspectiva del mercado de compuestos plásticos de Arabia Saudita, Oriente Medio y África
Se espera que Arabia Saudita registre una CAGR del 5,86 % entre 2025 y 2032 en la región de Medio Oriente y África, impulsada por la creciente demanda de mejores propiedades de los materiales, mayor rentabilidad y una mayor adopción en diversas aplicaciones industriales.
Perspectiva del mercado de compuestos plásticos de Egipto, Oriente Medio y África
Se espera que Egipto registre una CAGR del 4,51 % entre 2025 y 2032, impulsada por la creciente demanda de materiales livianos y duraderos en todas las industrias y un enfoque cada vez mayor en compuestos plásticos reciclables y sostenibles.
Cuota de mercado de compuestos plásticos en Oriente Medio y África
El mercado de compuestos plásticos de Oriente Medio y África está liderado principalmente por empresas bien establecidas, entre las que se incluyen:
- LyondellBasell Industries Holdings BV (EE. UU.)
- BASF (Alemania)
- Dow (EE.UU.)
- SABIC (Arabia Saudita)
- Covestro AG (Alemania)
- LANXESS (Alemania)
- Corporación Celanese (EE. UU.)
- Borealis GmbH (Austria)
- Mitsubishi Chemical Group Corporation (Japón)
- DuPont (EE. UU.)
- Corporación Avient (EE. UU.)
- Syensqo (Bélgica)
- Arkema (Francia)
- Trinseo (Estados Unidos)
- KANEKA CORPORATION (Japón)
- TORAY INDUSTRIES, INC. (Japón)
- SCG (Tailandia)
- CLARIANT (Suiza)
Últimos avances en el mercado de compuestos plásticos en Oriente Medio y África
- En junio de 2025, Envalior, en colaboración con SENTImotion y Frencken Group, anunció una innovación de producto que consiste en un nuevo concepto de caja de engranajes para brazos robóticos, fabricado con plástico de ingeniería Stanyl PA46. Este desarrollo permite cajas de engranajes un 50 % más ligeras y rentables que las alternativas metálicas, lo que facilita la producción a gran escala de robots ligeros y energéticamente eficientes. Esta innovación beneficia significativamente a Envalior, ya que amplía su presencia en los sectores de la robótica y la movilidad, abriendo nuevas oportunidades de crecimiento en la automatización industrial y de consumo.
- En mayo de 2024, Envalior anunció su participación en la conferencia SKZ "Plásticos en aplicaciones de ingeniería eléctrica y eléctrica", donde presentó innovaciones de producto, como compuestos sostenibles de poliamida 6 y un nuevo PBT ignífugo sin halógenos (p. ej., Pocan BFN4221Z). Este desarrollo se centra en ampliar la cartera de plásticos de ingeniería de Envalior con una mayor proporción de materias primas sostenibles, lo que permite a los clientes reducir su huella de carbono y su dependencia de insumos fósiles. Los materiales destacados ofrecen un rendimiento mecánico mejorado y una mayor resistencia al fuego, lo que posiciona a Envalior para satisfacer mejor la creciente demanda en sectores como la electromovilidad, el 5G y los sistemas autónomos, a la vez que refuerza su liderazgo en termoplásticos sostenibles.
- En julio de 2025, Arkema lanzó Zenimid, una nueva marca para su gama de poliimidas de ultraalto rendimiento, lo que marca un desarrollo estratégico de producto. Esta innovación enriquece la cartera de materiales especiales de Arkema, satisfaciendo sectores de alta demanda como el aeroespacial, la electrónica y la automoción. Con una excepcional resistencia térmica, mecánica y química, Zenimid impulsa el crecimiento de la empresa en aplicaciones avanzadas. Este lanzamiento refuerza la posición de Arkema en el mercado de polímeros de alto rendimiento.
- En junio de 2025, Trinseo presentó LIGOS A9615, un nuevo adhesivo acrílico diseñado para el segmento de etiquetas de uso general (GPL), lanzado el 9 de junio de 2025, dirigido a etiquetas de película en el mercado del sudeste asiático. Este desarrollo representa un lanzamiento estratégico que refuerza la fortaleza de Trinseo en innovación adhesiva. Entre sus principales ventajas se incluyen una excelente resistencia al envejecimiento, una removibilidad limpia con capacidad de reposicionamiento y resistencia a los plastificantes, lo que permite una adhesión fiable incluso en superficies curvas de PVC, comunes en bienes de consumo y aplicaciones de embalaje.
- En febrero de 2025, Trinseo anunció el lanzamiento del primer producto de resina de poliestireno (rPS) transparente y reciclado por disolución en Oriente Medio y África, específicamente aprobado para el contacto directo con alimentos y que cumple oficialmente con el Reglamento (UE) 2022/1616. Este hito regulatorio se produjo tras extensas pruebas, incluyendo una "Prueba de Desafío" realizada con el Instituto Fraunhofer para validar la eficacia de la descontaminación y el cumplimiento de la seguridad alimentaria de la resina final. Producida en las instalaciones de Trinseo en Schkopau y con aproximadamente un 30 % de contenido reciclado, la nueva resina rPS ofrece una reducción de la huella de carbono de aproximadamente el 18 % en comparación con el poliestireno virgen. Para Trinseo, este desarrollo representa un avance estratégico en sostenibilidad, que permite a la empresa satisfacer la creciente demanda de soluciones de materiales circulares y respaldar los objetivos de contenido reciclado de sus clientes.
SKU-
Obtenga acceso en línea al informe sobre la primera nube de inteligencia de mercado del mundo

- Panel de análisis de datos interactivo
- Panel de análisis de empresas para oportunidades con alto potencial de crecimiento
- Acceso de analista de investigación para personalización y consultas
- Análisis de la competencia con panel interactivo
- Últimas noticias, actualizaciones y análisis de tendencias
- Aproveche el poder del análisis de referencia para un seguimiento integral de la competencia
Tabla de contenido
1 INTRODUCTION
1.1 OBJECTIVES OF THE STUDY
1.2 MARKET DEFINITION
1.3 OVERVIEW
1.4 LIMITATIONS
1.5 MARKETS COVERED
2 MARKET SEGMENTATION
2.1 MARKETS COVERED
2.2 GEOGRAPHICAL SCOPE
2.3 YEARS CONSIDERED FOR THE STUDY
2.4 CURRENCY AND PRICING
2.5 DBMR TRIPOD DATA VALIDATION MODEL
2.6 MULTIVARIATE MODELING
2.7 PRIMARY INTERVIEWS WITH KEY OPINION LEADERS
2.8 DBMR MARKET POSITION GRID
2.9 MARKET APPLICATION COVERAGE GRID
2.1 SECONDARY SOURCES
2.11 ASSUMPTIONS
3 EXECUTIVE SUMMARY
4 PREMIUM INSIGHTS
4.1 PORTER’S FIVE FORCES ANALYSIS
4.1.1 THREAT OF NEW ENTRANTS
4.1.2 BARGAINING POWER OF SUPPLIERS
4.1.3 BARGAINING POWER OF BUYERS
4.1.4 THREAT OF SUBSTITUTES
4.1.5 INTERNAL COMPETITION
4.2 INNOVATION TRACKER AND STRATEGIC ANALYSIS
4.2.1 MAJOR DEALS AND STRATEGIC ALLIANCES ANALYSIS
4.2.1.1 JOINT VENTURES
4.2.1.2 MERGERS AND ACQUISITIONS
4.2.1.3 LICENSING AND PARTNERSHIP
4.2.1.4 TECHNOLOGY COLLABORATIONS
4.2.1.5 STRATEGIC DIVESTMENTS
4.2.2 NUMBER OF PRODUCTS IN DEVELOPMENT
4.2.3 STAGE OF DEVELOPMENT
4.2.4 TIMELINES AND MILESTONES
4.2.5 INNOVATION STRATEGIES AND METHODOLOGIES
4.2.6 RISK ASSESSMENT AND MITIGATION
4.2.7 FUTURE OUTLOOK
4.3 VALUE CHAIN ANALYSIS
4.4 IMPORT EXPORT SCENARIO
4.5 PRODUCTION CAPACITY FOR TOP MANUFACTURERS
4.6 BRAND OUTLOOK
4.7 CONSUMER BUYING BEHAVIOUR
4.8 DATA BASE OF COMPOUNDERS & THE EQUIPMENT THEY HAVE IN USE
4.9 PATENT ANALYSIS
4.9.1 PATENT QUALITY AND STRENGTH
4.9.2 PATENT FAMILIES
4.9.3 LICENSING AND COLLABORATIONS
4.9.4 REGION PATENT LANDSCAPE
4.9.5 IP STRATEGY AND MANAGEMENT
4.1 RAW MATERIAL COVERAGE
4.11 SUPPLY CHAIN ANALYSIS OF THE MIDDLE EAST AND AFRICA PLASTIC COMPOUNDING MARKET
4.11.1 OVERVIEW
4.11.2 LOGISTIC COST SCENARIOS
4.11.3 IMPORTANCE OF LOGISTICS SERVICE PROVIDERS (LSPS)
4.12 TECHNOLOGICAL ADVANCEMENTS IN THE MIDDLE EAST AND AFRICA PLASTIC COMPOUNDING MARKET
4.12.1 AI AND DIGITAL PROCESS OPTIMIZATION
4.12.2 ADVANCED EXTRUSION AND MATERIAL HANDLING TECHNOLOGIES
4.12.3 BIO-BASED AND FUNCTIONALIZED POLYMER COMPOUNDS
4.12.4 SMART AND RESPONSIVE COMPOUNDING SOLUTIONS
4.12.5 AUTOMATION AND INDUSTRY 4.0 IN COMPOUNDING OPERATIONS
4.12.6 SUSTAINABILITY AND CIRCULAR ECONOMY INNOVATIONS
4.12.7 DIGITAL CUSTOMER ENGAGEMENT AND FORMULATION PLATFORMS
4.13 VENDOR SELECTION CRITERIA
4.14 COMPANY EVALUATION QUADRANT
4.15 PRICING ANALYSIS
5 ROLE OF TARIFFS IN THE MIDDLE EAST AND AFRICA PLASTIC COMPOUNDING MARKET
5.1 TARIFF LANDSCAPE: DUTIES ON POLYMERS, ADDITIVES, AND MACHINERY
5.2 IMPACT OF TARIFFS ON COST STRUCTURES AND SUPPLY CHAIN DYNAMICS
5.3 INFLUENCE OF TRADE AGREEMENTS AND REGULATORY POLICIES
5.4 MARKET TRENDS AMPLIFYING TARIFF IMPACTS
5.5 COMPETITIVE IMPLICATIONS FOR INDUSTRY PARTICIPANTS
5.6 CHALLENGES AND OPPORTUNITIES ARISING FROM TARIFFS
5.7 KEY COMPANIES AND TARIFF STRATEGY SNAPSHOT
6 REGULATION COVERAGE: MIDDLE EAST AND AFRICA PLASTIC COMPOUNDING MARKET
7 MARKET OVERVIEW
7.1 DRIVERS
7.1.1 SHIFT TOWARDS RECYCLABLE AND BIODEGRADABLE PLASTIC COMPOUNDS DUE TO ENVIRONMENTAL REGULATIONS
7.1.2 ADVANCEMENTS IN COMPOUNDING TECHNOLOGIES IMPROVING PRODUCT PERFORMANCE AND COST-EFFICIENCY
7.1.3 DEVELOPMENT OF NANOCOMPOSITE PLASTICS OFFERING SUPERIOR MECHANICAL AND BARRIER PROPERTIES
7.1.4 INCREASED USE OF COMPOUNDED PLASTICS IN MEDICAL DEVICES DUE TO BIOCOMPATIBILITY AND STERILIZATION COMPATIBILITY
7.2 RESTRAINTS
7.2.1 VOLATILITY IN RAW MATERIAL PRICES, ESPECIALLY PETROLEUM-BASED FEEDSTOCKS LIKE POLYPROPYLENE AND POLYETHYLENE
7.2.2 COMPLEX RECYCLING PROCESSES AND LACK OF PROPER INFRASTRUCTURE FOR PLASTIC COMPOUND WASTE MANAGEMENT
7.3 OPPORTUNITIES
7.3.1 GROWING USE OF BIOPLASTICS AND SUSTAINABLE COMPOUND ALTERNATIVES
7.3.2 SURGE IN ELECTRIC VEHICLE ADOPTION REQUIRING ADVANCED POLYMERS
7.3.3 INCREASING DEMAND FOR RECYCLABLE AND CIRCULAR PLASTIC SOLUTIONS
7.4 CHALLENGES
7.4.1 PERFORMANCE LIMITATIONS OF SUSTAINABLE ALTERNATIVES
7.4.2 REGULATORY AND STANDARDS FRAGMENTATION ACROSS REGIONS
8 MIDDLE EAST AND AFRICA PLASTIC COMPOUNDING MARKET, BY POLYMER TYPE
8.1 OVERVIEW
8.2 THERMOPLASTICS
8.2.1 THERMOPLASTICS, BY TYPE
8.2.2 POLYETHYLENE (PE), BY TYPE
8.3 ENGINEERING PLASTICS
8.3.1 ENGINEERING PLASTICS, BY TYPE
8.4 THERMOSETTING PLASTICS
8.4.1 THERMOSETTING PLASTICS, BY TYPE
8.5 BIOPLASTICS
8.5.1 BIOPLASTICS, BY TYPE
8.6 OTHERS
9 MIDDLE EAST AND AFRICA PLASTIC COMPOUNDING MARKET, BY FILLER TYPE
9.1 OVERVIEW
9.2 MINERAL FILLERS
9.2.1 MINERAL FILLERS, BY TYPE
9.3 REINFORCEMENTS
9.3.1 REINFORCEMENTS, BY TYPE
9.4 ADDITIVES
9.4.1 ADDITIVES, BY TYPE
9.5 OTHERS
10 MIDDLE EAST AND AFRICA PLASTIC COMPOUNDING MARKET, BY MANUFACTURING PROCESS
10.1 OVERVIEW
10.2 EXTRUSION
10.2.1 EXTRUSION, BY TYPE
10.2.2 EXTRUSION, BY PELLETIZING SYSTEM
10.3 INJECTION MOLDING BASED COMPOUNDING
10.3.1 INJECTION MOLDING BASED COMPOUNDING, BY PELLETIZING SYSTEM
10.4 COMPACTION/PRESSING
10.4.1 COMPACTION/PRESSING, BY PELLETIZING SYSTEM
10.5 KNEADER/BANBURY MIXING
10.5.1 KNEADER/BANBURY MIXING, BY PELLETIZING SYSTEM
10.6 OTHERS
11 MIDDLE EAST AND AFRICA PLASTIC COMPOUNDING MARKET, BY PROPERTIES
11.1 OVERVIEW
11.2 RESISTANCE
11.3 DURABILITY
11.4 FLEXIBILITY
11.5 IMPACT RESISTANCE
11.6 RIGIDITY
11.7 OTHERS
12 MIDDLE EAST AND AFRICA PLASTIC COMPOUNDING MARKET, BY APPLICATION
12.1 OVERVIEW
12.2 AUTOMOTIVE
12.2.1 AUTOMOTIVE, BY CATEGORY
12.2.1.1 INTERIOR COMPONENTS, BY TYPE
12.2.1.2 EXTERIOR BODY PARTS, BY TYPE
12.2.1.3 UNDER-THE-HOOD APPLICATIONS, BY TYPE
12.3 PACKAGING
12.3.1 PACKAGING, BY CATEGORY
12.3.1.1 FOOD & BEVERAGE PACKAGING, BY TYPE
12.3.1.2 INDUSTRIAL PACKAGING, BY TYPE
12.3.1.3 CONSUMER GOODS PACKAGING, BY TYPE
12.4 BUILDING & CONSTRUCTION
12.4.1 BUILDING & CONSTRUCTION, BY CATEGORY
12.5 ELECTRICAL & ELECTRONICS
12.5.1 ELECTRICAL & ELECTRONICS, BY CATEGORY
12.6 MEDICAL DEVICES
12.6.1 MEDICAL DEVICES, BY CATEGORY
12.7 FURNITURE
12.7.1 FURNITURE, BY CATEGORY
12.8 ENERGY AND POWER
12.8.1 ENERGY & POWER, BY CATEGORY
12.9 AEROSPACE AND DEFENSE
12.9.1 AEROSPACE AND DEFENSE, BY CATEGORY
12.1 OTHERS
13 MIDDLE EAST AND AFRICA PLASTIC COMPOUNDING MARKET BY COUNTRIES
13.1 MIDDLE EAST AND AFRICA
13.1.1 SAUDI ARABIA
13.1.2 EGYPT
13.1.3 U.A.E.
13.1.4 SOUTH AFRICA
13.1.5 ISRAEL
13.1.6 KUWAIT
13.1.7 OMAN
13.1.8 QATAR
13.1.9 BAHRAIN
13.1.10 REST OF MIDDLE EAST AND AFRICA
14 MIDDLE EAST AND AFRICA PLASTIC COMPOUNDING MARKET: COMPANY LANDSCAPE
14.1 COMPANY SHARE ANALYSIS: MIDDLE EAST AND AFRICA
15 SWOT ANALYSIS
16 COMPANY PROFILES
16.1 SABIC
16.1.1 COMPANY SNAPSHOT
16.1.2 REVENUE ANALYSIS
16.1.3 COMPANY SHARE ANALYSIS
16.1.4 PRODUCT PORTFOLIO
16.1.5 RECENT DEVELOPMENT
16.2 LYONDELLBASELL INDUSTRIES HOLDINGS B.V.
16.2.1 COMPANY SNAPSHOT
16.2.2 REVENUE ANALYSIS
16.2.3 COMPANY SHARE ANALYSIS
16.2.4 PRODUCT PORTFOLIO
16.2.5 RECENT DEVELOPMENTS/NEWS
16.3 DOW
16.3.1 COMPANY SNAPSHOT
16.3.2 REVENUE ANALYSIS
16.3.3 COMPANY SHARE ANALYSIS
16.3.4 PRODUCT PORTFOLIO
16.3.5 RECENT DEVELOPMENT
16.4 DUPONT
16.4.1 COMPANY SNAPSHOT
16.4.2 REVENUE ANALYSIS
16.4.3 COMPANY SHARE ANALYSIS
16.4.4 PRODUCT PORTFOLIO
16.4.5 RECENT DEVELOPMENT
16.5 ARKEMA
16.5.1 COMPANY SNAPSHOT
16.5.2 REVENUE ANALYSIS
16.5.3 COMPANY SHARE ANALYSIS
16.5.4 PRODUCT PORTFOLIO
16.5.5 RECENT DEVELOPMENTS
16.6 ASAHI KASEI CORP.
16.6.1 COMPANY SNAPSHOT
16.6.2 REVENUE ANALYSIS
16.6.3 PRODUCT PORTFOLIO
16.6.4 RECENT DEVELOPMENT
16.7 AVIENT CORPORATION
16.7.1 COMPANY SNAPSHOT
16.7.2 REVENUE ANALYSIS
16.7.3 PRODUCT PORTFOLIO
16.7.4 RECENT DEVELOPMENT
16.8 BOREALIS GMBH
16.8.1 COMPANY SNAPSHOT
16.8.2 PRODUCT PORTFOLIO
16.8.3 RECENT DEVELOPMENT
16.9 BASF
16.9.1 COMPANY SNAPSHOT
16.9.2 REVENUE ANALYSIS
16.9.3 PRODUCT PORTFOLIO
16.9.4 RECENT DEVELOPMENT
16.1 CLEANESE CORPORATION
16.10.1 COMPANY SNAPSHOT
16.10.2 REVENUE ANALYSIS
16.10.3 PRODUCT PORTFOLIO
16.10.4 RECENT DEVELOPMENT
16.11 CHIMEI
16.11.1 COMPANY SNAPSHOT
16.11.2 REVENUE ANALYSIS
16.11.3 PRODUCT PORTFOLIO
16.11.4 RECENT DEVELOPMENT
16.12 CLARIANT
16.12.1 COMPANY SNAPSHOT
16.12.2 REVENUE ANALYSIS
16.12.3 PRODUCT PORTFOLIO
16.12.4 RECENT DEVELOPMENT
16.13 COVESTRO AG
16.13.1 COMPANY SNAPSHOT
16.13.2 REVENUE ANALYSIS
16.13.3 PRODUCT PORTFOLIO
16.13.4 RECENT DEVELOPMENT
16.14 DAICEL CORPORATION
16.14.1 COMPANY SNAPSHOT
16.14.2 REVENUE ANALYSIS
16.14.3 PRODUCT PORTFOLIO
16.14.4 RECENT DEVELOPMENTS
16.15 ENSINGER GMBH
16.15.1 COMPANY SNAPSHOT
16.15.2 PRODUCT PORTFOLIO
16.15.3 RECENT DEVELOPMENT
16.16 ENVALIOR
16.16.1 COMPANY SNAPSHOT
16.16.2 PRODUCT PORTFOLIO
16.16.3 RECENT DEVELOPMENTS
16.17 INEOS
16.17.1 COMPANY SNAPSHOT
16.17.2 PRODUCT PORTFOLIO
16.17.3 RECENT DEVELOPMENT
16.18 KANEKA CORPORATION
16.18.1 COMPANY SNAPSHOT
16.18.2 REVENUE ANALYSIS
16.18.3 PRODUCT PORTFOLIO
16.18.4 RECENT DEVELOPMENT
16.19 KINGFA SCI.&TECH. CO.,LTD.
16.19.1 COMPANY SNAPSHOT
16.19.2 REVENUE ANALYSIS
16.19.3 PRODUCT PORTFOLIO
16.19.4 RECENT DEVELOPMENT
16.2 LANXESS
16.20.1 COMPANY SNAPSHOT
16.20.2 REVENUE ANALYSIS
16.20.3 BUSINESS PORTFOLIO
16.20.4 RECENT DEVELOPMENT
16.21 LG CHEM
16.21.1 COMPANY SNAPSHOT
16.21.2 REVENUE ANALYSIS
16.21.3 PRODUCT PORTFOLIO
16.21.4 RECENT DEVELOPMENT
16.22 MITSUBISHI CHEMICAL GROUP CORPORATION.
16.22.1 COMPANY SNAPSHOT
16.22.2 REVENUE ANALYSIS
16.22.3 PRODUCT PORTFOLIO
16.22.4 RECENT DEVELOPMENT
16.23 MITSUI CHEMICALS, INC
16.23.1 COMPANY SNAPSHOT
16.23.2 REVENUE ANALYSIS
16.23.3 PRODUCT PORTFOLIO
16.23.4 RECENT DEVELOPMENT
16.24 RTP COMPANY
16.24.1 COMPANY SNAPSHOT
16.24.2 PRODUCT PORTFOLIO
16.24.3 RECENT DEVELOPMENT
16.25 SCG
16.25.1 COMPANY SNAPSHOT
16.25.2 REVENUE ANALYSIS
16.25.3 PRODUCT PORTFOLIO
16.25.4 RECENT DEVELOPMENT
16.26 SYENSQO
16.26.1 COMPANY SNAPSHOT
16.26.2 REVENUE ANALYSIS
16.26.3 PRODUCT PORTFOLIO
16.26.4 RECENT DEVELOPMENTS
16.27 TEKNOR APEX
16.27.1 COMPANY SNAPSHOT
16.27.2 PRODUCT PORTFOLIO
16.27.3 RECENT DEVELOPMENT
16.28 TORAY INDUSTRIES, INC.
16.28.1 COMPANY SNAPSHOT
16.28.2 REVENUE ANALYSIS
16.28.3 PRODUCT PORTFOLIO
16.28.4 RECENT DEVELOPMENT
16.29 TRINSEO
16.29.1 COMPANY SNAPSHOT
16.29.2 REVENUE ANALYSIS
16.29.3 SOLUTION PORTFOLIO
16.29.4 RECENT DEVELOPMENTS
16.3 WASHINGTON PENN
16.30.1 COMPANY SNAPSHOT
16.30.2 PRODUCT PORTFOLIO
16.30.3 RECENT DEVELOPMENT
17 QUESTIONNAIRE
18 RELATED REPORTS
Lista de Tablas
TABLE 1 STAGES OF VALUE CHAIN
TABLE 2 BRAND OUTLOOK: MIDDLE EAST AND AFRICA PLASTIC COMPOUNDING MARKET
TABLE 3 CONSUMER BUYING BEHAVIOUR
TABLE 4 MIDDLE EAST AND AFRICA PLAYERS IN PLASTIC COMPOUNDING
TABLE 5 NUMBER OF PATENTS PER YEAR
TABLE 6 NUMBER OF PATENTS PER REGION/COUNTRY
TABLE 7 TOP PATENT APPLICANTS
TABLE 8 TARIFF EXPOSURE AND STRATEGIC RESPONSE BY COMPANY TYPE
TABLE 9 TARIFF EXPOSURE AND STRATEGIC RESPONSE OF KEY PLAYERS
TABLE 10 MIDDLE EAST AND AFRICA PLASTIC COMPOUNDING MARKET, BY POLYMER TYPE, 2018-2032 (USD THOUSAND)
TABLE 11 MIDDLE EAST AND AFRICA PLASTIC COMPOUNDING MARKET, BY POLYMER TYPE, 2018-2032 (KILO TONS)
TABLE 12 MIDDLE EAST AND AFRICA THERMOPLASTICS IN PLASTIC COMPOUNDING MARKET, BY REGION, 2018-2032 (USD THOUSAND)
TABLE 13 MIDDLE EAST AND AFRICA THERMOPLASTICS IN PLASTIC COMPOUNDING MARKET, BY REGION, 2018-2032 (KILO TONS)
TABLE 14 MIDDLE EAST AND AFRICA THERMOPLASTICS IN PLASTIC COMPOUNDING MARKET, BY TYPE, 2018-2032 (USD THOUSAND)
TABLE 15 MIDDLE EAST AND AFRICA POLYETHYLENE (PE) IN PLASTIC COMPOUNDING MARKET, BY TYPE, 2018-2032 (USD THOUSAND)
TABLE 16 MIDDLE EAST AND AFRICA ENGINEERING PLASTICS IN PLASTIC COMPOUNDING MARKET, BY REGION, 2018-2032 (USD THOUSAND )
TABLE 17 MIDDLE EAST AND AFRICA ENGINEERING PLASTICS IN PLASTIC COMPOUNDING MARKET, BY REGION, 2018-2032 (KILO TONS)
TABLE 18 MIDDLE EAST AND AFRICA ENGINEERING PLASTICS IN PLASTIC COMPOUNDING MARKET, BY TYPE, 2018-2032 (USD THOUSAND)
TABLE 19 MIDDLE EAST AND AFRICA THERMOSETTING PLASTICS IN PLASTIC COMPOUNDING MARKET, BY REGION, 2018-2032 (USD THOUSAND)
TABLE 20 MIDDLE EAST AND AFRICA THERMOSETTING PLASTICS IN PLASTIC COMPOUNDING MARKET, BY REGION, 2018-2032 (KILO TONS)
TABLE 21 MIDDLE EAST AND AFRICA THERMOSETTING PLASTICS IN PLASTIC COMPOUNDING MARKET, BY TYPE, 2018-2032 (USD THOUSAND)
TABLE 22 MIDDLE EAST AND AFRICA BIOPLASTICS IN PLASTIC COMPOUNDING MARKET, BY REGION, 2018-2032 (USD THOUSAND)
TABLE 23 MIDDLE EAST AND AFRICA BIOPLASTICS IN PLASTIC COMPOUNDING MARKET, BY REGION, 2018-2032 (KILO TONS)
TABLE 24 MIDDLE EAST AND AFRICA BIOPLASTICS IN PLASTIC COMPOUNDING MARKET, BY TYPE, 2018-2032 (USD THOUSAND)
TABLE 25 MIDDLE EAST AND AFRICA OTHERS IN PLASTIC COMPOUNDING MARKET, BY REGION, 2018-2032 (USD THOUSAND)
TABLE 26 MIDDLE EAST AND AFRICA OTHERS IN PLASTIC COMPOUNDING MARKET, BY REGION, 2018-2032 (KILO TONS)
TABLE 27 MIDDLE EAST AND AFRICA PLASTIC COMPOUNDING MARKET, BY FILTER TYPE, 2018-2032 (USD THOUSAND)
TABLE 28 MIDDLE EAST AND AFRICA MINERAL FILLERS IN PLASTIC COMPOUNDING MARKET, BY REGION, 2018-2032 (USD THOUSAND)
TABLE 29 MIDDLE EAST AND AFRICA MINERAL FILLERS IN PLASTIC COMPOUNDING MARKET, BY TYPE, 2018-2032 (USD THOUSAND)
TABLE 30 MIDDLE EAST AND AFRICA REINFORCEMENTS IN PLASTIC COMPOUNDING MARKET, BY REGION, 2018-2032 (USD THOUSAND)
TABLE 31 MIDDLE EAST AND AFRICA REINFORCEMENTS IN PLASTIC COMPOUNDING MARKET, BY TYPE, 2018-2032 (USD THOUSAND)
TABLE 32 MIDDLE EAST AND AFRICA ADDITIVES IN PLASTIC COMPOUNDING MARKET, BY REGION, 2018-2032 (USD THOUSAND)
TABLE 33 MIDDLE EAST AND AFRICA ADDITIVES IN PLASTIC COMPOUNDING MARKET, BY TYPE, 2018-2032 (USD THOUSAND)
TABLE 34 MIDDLE EAST AND AFRICA OTHERS IN PLASTIC COMPOUNDING MARKET, BY REGION, 2018-2032 (USD THOUSAND)
TABLE 35 MIDDLE EAST AND AFRICA PLASTIC COMPOUNDING MARKET, BY MANUFACTURING PROCESS, 2018-2032 (USD THOUSAND)
TABLE 36 MIDDLE EAST AND AFRICA PLASTIC COMPOUNDING MARKET, BY MANUFACTURING PROCESS, 2018-2032 (KILO TONS)
TABLE 37 MIDDLE EAST AND AFRICA EXTRUSION IN PLASTIC COMPOUNDING MARKET, BY REGION, 2018-2032 (USD THOUSAND)
TABLE 38 MIDDLE EAST AND AFRICA EXTRUSION IN PLASTIC COMPOUNDING MARKET, BY REGION, 2018-2032 (KILO TONS)
TABLE 39 MIDDLE EAST AND AFRICA EXTRUSION IN PLASTIC COMPOUNDING MARKET, BY TYPE, 2018-2032 (USD THOUSAND)
TABLE 40 MIDDLE EAST AND AFRICA EXTRUSION IN PLASTIC COMPOUNDING MARKET, BY PELLETIZING SYSTEM, 2018-2032 (USD THOUSAND)
TABLE 41 MIDDLE EAST AND AFRICA INJECTION MOLDING BASED COMPOUNDING IN PLASTIC COMPOUNDING MARKET, BY REGION, 2018-2032 (USD THOUSAND)
TABLE 42 MIDDLE EAST AND AFRICA INJECTION MOLDING BASED COMPOUNDING IN PLASTIC COMPOUNDING MARKET, BY REGION, 2018-2032 (KILO TONS)
TABLE 43 MIDDLE EAST AND AFRICA INJECTION MOLDING BASED COMPOUNDING IN PLASTIC COMPOUNDING MARKET, BY PELLETIZING SYSTEM, 2018-2032 (USD THOUSAND)
TABLE 44 MIDDLE EAST AND AFRICA COMPACTION/PRESSING IN PLASTIC COMPOUNDING MARKET, BY REGION, 2018-2032 (USD THOUSAND)
TABLE 45 MIDDLE EAST AND AFRICA COMPACTION/PRESSING IN PLASTIC COMPOUNDING MARKET, BY REGION, 2018-2032 (KILO TONS)
TABLE 46 MIDDLE EAST AND AFRICA COMPACTION/PRESSING IN PLASTIC COMPOUNDING MARKET, BY PELLETIZING SYSTEM, 2018-2032 (USD THOUSAND)
TABLE 47 MIDDLE EAST AND AFRICA KNEADER/BANBURY MIXING IN PLASTIC COMPOUNDING MARKET, BY REGION, 2018-2032 (USD THOUSAND)
TABLE 48 MIDDLE EAST AND AFRICA KNEADER/BANBURY MIXING IN PLASTIC COMPOUNDING MARKET, BY REGION, 2018-2032 (KILO TONS)
TABLE 49 MIDDLE EAST AND AFRICA KNEADER/BANBURY MIXING IN PLASTIC COMPOUNDING MARKET, BY PELLETIZING SYSTEM, 2018-2032 (USD THOUSAND)
TABLE 50 MIDDLE EAST AND AFRICA OTHERS IN PLASTIC COMPOUNDING MARKET, BY REGION, 2018-2032 (USD THOUSAND)
TABLE 51 MIDDLE EAST AND AFRICA OTHERS IN PLASTIC COMPOUNDING MARKET, BY REGION, 2018-2032 (KILO TONS)
TABLE 52 MIDDLE EAST AND AFRICA PLASTIC COMPOUNDING MARKET, BY PROPERTIES, 2018-2032 (USD THOUSAND)
TABLE 53 MIDDLE EAST AND AFRICA RESISTANCE IN PLASTIC COMPOUNDING MARKET, BY REGION, 2018-2032 (USD THOUSAND)
TABLE 54 MIDDLE EAST AND AFRICA DURABILITY IN PLASTIC COMPOUNDING MARKET, BY REGION, 2018-2032 (USD THOUSAND)
TABLE 55 MIDDLE EAST AND AFRICA FLEXIBILITY IN PLASTIC COMPOUNDING MARKET, BY REGION, 2018-2032 (USD THOUSAND)
TABLE 56 MIDDLE EAST AND AFRICA IMPACT RESISTANCE IN PLASTIC COMPOUNDING MARKET, BY REGION, 2018-2032 (USD THOUSAND)
TABLE 57 MIDDLE EAST AND AFRICA RIGIDITY IN PLASTIC COMPOUNDING MARKET, BY REGION, 2018-2032 (USD THOUSAND)
TABLE 58 MIDDLE EAST AND AFRICA OTHERS IN PLASTIC COMPOUNDING MARKET, BY REGION, 2018-2032 (USD THOUSAND)
TABLE 59 MIDDLE EAST AND AFRICA PLASTIC COMPOUNDING MARKET, BY APPLICATION, 2018-2032 (USD THOUSAND)
TABLE 60 MIDDLE EAST AND AFRICA PLASTIC COMPOUNDING MARKET, BY APPLICATION, 2018-2032 (KILO TONS)
TABLE 61 MIDDLE EAST AND AFRICA AUTOMOTIVE IN PLASTIC COMPOUNDING MARKET, BY REGION, 2018-2032 (USD THOUSAND)
TABLE 62 MIDDLE EAST AND AFRICA AUTOMOTIVE IN PLASTIC COMPOUNDING MARKET, BY REGION, 2018-2032 (KILO TONS)
TABLE 63 MIDDLE EAST AND AFRICA AUTOMOTIVE IN PLASTIC COMPOUNDING MARKET, BY CATEGORY, 2018-2032 (USD THOUSAND)
TABLE 64 MIDDLE EAST AND AFRICA INTERIOR COMPONENTS IN PLASTIC COMPOUNDING MARKET, BY TYPE, 2018-2032 (USD THOUSAND)
TABLE 65 MIDDLE EAST AND AFRICA EXTERIOR BODY PARTS IN PLASTIC COMPOUNDING MARKET, BY TYPE, 2018-2032 (USD THOUSAND)
TABLE 66 MIDDLE EAST AND AFRICA UNDER-THE-HOOD APPLICATIONS IN PLASTIC COMPOUNDING MARKET, BY TYPE, 2018-2032 (USD THOUSAND)
TABLE 67 MIDDLE EAST AND AFRICA PACKAGING IN PLASTIC COMPOUNDING MARKET, BY REGION, 2018-2032 (USD THOUSAND)
TABLE 68 MIDDLE EAST AND AFRICA PACKAGING IN PLASTIC COMPOUNDING MARKET, BY REGION, 2018-2032 (KILO TONS)
TABLE 69 MIDDLE EAST AND AFRICA PACKAGING IN PLASTIC COMPOUNDING MARKET, BY CATEGORY, 2018-2032 (USD THOUSAND)
TABLE 70 MIDDLE EAST AND AFRICA FOOD & BEVERAGE PACKAGING IN PLASTIC COMPOUNDING MARKET, BY TYPE, 2018-2032 (USD THOUSAND)
TABLE 71 MIDDLE EAST AND AFRICA INDUSTRIAL PACKAGING IN PLASTIC COMPOUNDING MARKET, BY TYPE, 2018-2032 (USD THOUSAND)
TABLE 72 MIDDLE EAST AND AFRICA CONSUMER GOODS PACKAGING IN PLASTIC COMPOUNDING MARKET, BY TYPE, 2018-2032 (USD THOUSAND)
TABLE 73 MIDDLE EAST AND AFRICA BUILDING & CONSTRUCTION IN PLASTIC COMPOUNDING MARKET, BY REGION, 2018-2032 (USD THOUSAND)
TABLE 74 MIDDLE EAST AND AFRICA BUILDING & CONSTRUCTION IN PLASTIC COMPOUNDING MARKET, BY REGION, 2018-2032 (KILO TONS)
TABLE 75 MIDDLE EAST AND AFRICA BUILDING & CONSTRUCTION IN PLASTIC COMPOUNDING MARKET, BY CATEGORY, 2018-2032 (USD THOUSAND)
TABLE 76 MIDDLE EAST AND AFRICA ELECTRICAL & ELECTRONICS IN PLASTIC COMPOUNDING MARKET, BY REGION, 2018-2032 (USD THOUSAND)
TABLE 77 MIDDLE EAST AND AFRICA ELECTRICAL & ELECTRONICS IN PLASTIC COMPOUNDING MARKET, BY REGION, 2018-2032 (KILO TONS)
TABLE 78 MIDDLE EAST AND AFRICA ELECTRICAL & ELECTRONICS IN PLASTIC COMPOUNDING MARKET, BY CATEGORY, 2018-2032 (USD THOUSAND)
TABLE 79 MIDDLE EAST AND AFRICA MEDICAL DEVICES IN PLASTIC COMPOUNDING MARKET, BY REGION, 2018-2032 (USD THOUSAND)
TABLE 80 MIDDLE EAST AND AFRICA MEDICAL DEVICES IN PLASTIC COMPOUNDING MARKET, BY REGION, 2018-2032 (KILO TONS)
TABLE 81 MIDDLE EAST AND AFRICA MEDICAL DEVICES IN PLASTIC COMPOUNDING MARKET, BY CATEGORY, 2018-2032 (USD THOUSAND)
TABLE 82 MIDDLE EAST AND AFRICA FURNITURE IN PLASTIC COMPOUNDING MARKET, BY REGION, 2018-2032 (USD THOUSAND)
TABLE 83 MIDDLE EAST AND AFRICA FURNITURE IN PLASTIC COMPOUNDING MARKET, BY REGION, 2018-2032 (KILO TONS)
TABLE 84 MIDDLE EAST AND AFRICA FURNITURE IN PLASTIC COMPOUNDING MARKET, BY CATEGORY, 2018-2032 (USD THOUSAND)
TABLE 85 MIDDLE EAST AND AFRICA ENERGY AND POWER IN PLASTIC COMPOUNDING MARKET, BY REGION, 2018-2032 (USD THOUSAND)
TABLE 86 MIDDLE EAST AND AFRICA ENERGY AND POWER IN PLASTIC COMPOUNDING MARKET, BY REGION, 2018-2032 (KILO TONS)
TABLE 87 MIDDLE EAST AND AFRICA ENERGY AND POWER IN PLASTIC COMPOUNDING MARKET, BY CATEGORY, 2018-2032 (USD THOUSAND)
TABLE 88 MIDDLE EAST AND AFRICA AEROSPACE AND DEFENSE IN PLASTIC COMPOUNDING MARKET, BY REGION, 2018-2032 (USD THOUSAND)
TABLE 89 MIDDLE EAST AND AFRICA AEROSPACE AND DEFENSE IN PLASTIC COMPOUNDING MARKET, BY REGION, 2018-2032 (KILO TONS)
TABLE 90 MIDDLE EAST AND AFRICA AEROSPACE AND DEFENSE IN PLASTIC COMPOUNDING MARKET, BY CATEGORY, 2018-2032 (USD THOUSAND)
TABLE 91 MIDDLE EAST AND AFRICA OTHERS IN PLASTIC COMPOUNDING MARKET, BY REGION, 2018-2032 (USD THOUSAND)
TABLE 92 MIDDLE EAST AND AFRICA OTHERS IN PLASTIC COMPOUNDING MARKET, BY REGION, 2018-2032 (KILO TONS)
TABLE 93 MIDDLE EAST AND AFRICA PLASTIC COMPOUNDING MARKET, BY COUNTRY, 2018-2032 (USD THOUSAND)
TABLE 94 MIDDLE EAST AND AFRICA PLASTIC COMPOUNDING MARKET, BY COUNTRY, 2018-2032 (KILO TONS)
TABLE 95 MIDDLE EAST AND AFRICA PLASTIC COMPOUNDING MARKET, BY POLYMER TYPE, 2018-2032 (USD THOUSAND)
TABLE 96 MIDDLE EAST AND AFRICA PLASTIC COMPOUNDING MARKET, BY POLYMER TYPE, 2018-2032 (KILO TONS)
TABLE 97 MIDDLE EAST AND AFRICA THERMOPLASTICS IN PLASTIC COMPOUNDING MARKET, BY TYPE, 2018-2032 (USD THOUSAND)
TABLE 98 MIDDLE EAST AND AFRICA POLYETHYLENE (PE) IN PLASTIC COMPOUNDING MARKET, BY TYPE, 2018-2032 (USD THOUSAND)
TABLE 99 MIDDLE EAST AND AFRICA ENGINEERING PLASTICS IN PLASTIC COMPOUNDING MARKET, BY TYPE, 2018-2032 (USD THOUSAND)
TABLE 100 MIDDLE EAST AND AFRICA THERMOSETTING PLASTICS IN PLASTIC COMPOUNDING MARKET, BY TYPE, 2018-2032 (USD THOUSAND)
TABLE 101 MIDDLE EAST AND AFRICA BIOPLASTICS IN PLASTIC COMPOUNDING MARKET, BY TYPE, 2018-2032 (USD THOUSAND)
TABLE 102 MIDDLE EAST AND AFRICA PLASTIC COMPOUNDING MARKET, BY FILLER TYPE, 2018-2032 (USD THOUSAND)
TABLE 103 MIDDLE EAST AND AFRICA MINERAL FILLERS IN PLASTIC COMPOUNDING MARKET, BY TYPE, 2018-2032 (USD THOUSAND)
TABLE 104 MIDDLE EAST AND AFRICA REINFORCEMENTS IN PLASTIC COMPOUNDING MARKET, BY TYPE, 2018-2032 (USD THOUSAND)
TABLE 105 MIDDLE EAST AND AFRICA ADDITIVES IN PLASTIC COMPOUNDING MARKET, BY TYPE, 2018-2032 (USD THOUSAND)
TABLE 106 MIDDLE EAST AND AFRICA PLASTIC COMPOUNDING MARKET, BY MANUFACTURING PROCESS, 2018-2032 (USD THOUSAND)
TABLE 107 MIDDLE EAST AND AFRICA PLASTIC COMPOUNDING MARKET, BY MANUFACTURING PROCESS, 2018-2032 (KILO TONS)
TABLE 108 MIDDLE EAST AND AFRICA EXTRUSION IN PLASTIC COMPOUNDING MARKET, BY TYPE, 2018-2032 (USD THOUSAND)
TABLE 109 MIDDLE EAST AND AFRICA EXTRUSION IN PLASTIC COMPOUNDING MARKET, BY PELLETIZING SYSTEM, 2018-2032 (USD THOUSAND)
TABLE 110 MIDDLE EAST AND AFRICA INJECTION MOLDING BASED COMPOUNDING IN PLASTIC COMPOUNDING MARKET, BY PELLETIZING SYSTEM, 2018-2032 (USD THOUSAND)
TABLE 111 MIDDLE EAST AND AFRICA COMPACTION/PRESSING IN PLASTIC COMPOUNDING MARKET, BY PELLETIZING SYSTEM, 2018-2032 (USD THOUSAND)
TABLE 112 MIDDLE EAST AND AFRICA KNEADER/BANBURY MIXING IN PLASTIC COMPOUNDING MARKET, BY PELLETIZING SYSTEM, 2018-2032 (USD THOUSAND)
TABLE 113 MIDDLE EAST AND AFRICA PLASTIC COMPOUNDING MARKET, BY PROPERTIES, 2018-2032 (USD THOUSAND)
TABLE 114 MIDDLE EAST AND AFRICA PLASTIC COMPOUNDING MARKET, BY APPLICATION, 2018-2032 (USD THOUSAND)
TABLE 115 MIDDLE EAST AND AFRICA PLASTIC COMPOUNDING MARKET, BY APPLICATION, 2018-2032 (KILO TONS)
TABLE 116 MIDDLE EAST AND AFRICA AUTOMOTIVE IN PLASTIC COMPOUNDING MARKET, BY CATEGORY, 2018-2032 (USD THOUSAND)
TABLE 117 MIDDLE EAST AND AFRICA INTERIOR COMPONENTS IN PLASTIC COMPOUNDING MARKET, BY TYPE, 2018-2032 (USD THOUSAND)
TABLE 118 MIDDLE EAST AND AFRICA EXTERIOR BODY PARTS IN PLASTIC COMPOUNDING MARKET, BY TYPE, 2018-2032 (USD THOUSAND)
TABLE 119 MIDDLE EAST AND AFRICA UNDER-THE-HOOD APPLICATIONS IN PLASTIC COMPOUNDING MARKET, BY TYPE, 2018-2032 (USD THOUSAND)
TABLE 120 MIDDLE EAST AND AFRICA PACKAGING IN PLASTIC COMPOUNDING MARKET, BY CATEGORY, 2018-2032 (USD THOUSAND)
TABLE 121 MIDDLE EAST AND AFRICA FOOD & BEVERAGE PACKAGING IN PLASTIC COMPOUNDING MARKET, BY TYPE, 2018-2032 (USD THOUSAND)
TABLE 122 MIDDLE EAST AND AFRICA INDUSTRIAL PACKAGING IN PLASTIC COMPOUNDING MARKET, BY TYPE, 2018-2032 (USD THOUSAND)
TABLE 123 MIDDLE EAST AND AFRICA CONSUMER GOODS PACKAGING IN PLASTIC COMPOUNDING MARKET, BY TYPE, 2018-2032 (USD THOUSAND)
TABLE 124 MIDDLE EAST AND AFRICA BUILDING & CONSTRUCTION IN PLASTIC COMPOUNDING MARKET, BY CATEGORY, 2018-2032 (USD THOUSAND)
TABLE 125 MIDDLE EAST AND AFRICA ELECTRICAL & ELECTRONICS IN PLASTIC COMPOUNDING MARKET, BY CATEGORY, 2018-2032 (USD THOUSAND)
TABLE 126 MIDDLE EAST AND AFRICA MEDICAL DEVICES IN PLASTIC COMPOUNDING MARKET, BY CATEGORY, 2018-2032 (USD THOUSAND)
TABLE 127 MIDDLE EAST AND AFRICA FURNITURE IN PLASTIC COMPOUNDING MARKET, BY CATEGORY, 2018-2032 (USD THOUSAND)
TABLE 128 MIDDLE EAST AND AFRICA ENERGY AND POWER IN PLASTIC COMPOUNDING MARKET, BY CATEGORY, 2018-2032 (USD THOUSAND)
TABLE 129 MIDDLE EAST AND AFRICA AEROSPACE AND DEFENSE IN PLASTIC COMPOUNDING MARKET, BY CATEGORY, 2018-2032 (USD THOUSAND)
TABLE 130 SAUDI ARABIA PLASTIC COMPOUNDING MARKET, BY POLYMER TYPE, 2018-2032 (USD THOUSAND)
TABLE 131 SAUDI ARABIA PLASTIC COMPOUNDING MARKET, BY POLYMER TYPE, 2018-2032 (KILO TONS)
TABLE 132 SAUDI ARABIA THERMOPLASTICS IN PLASTIC COMPOUNDING MARKET, BY TYPE, 2018-2032 (USD THOUSAND)
TABLE 133 SAUDI ARABIA POLYETHYLENE (PE) IN PLASTIC COMPOUNDING MARKET, BY TYPE, 2018-2032 (USD THOUSAND)
TABLE 134 SAUDI ARABIA ENGINEERING PLASTICS IN PLASTIC COMPOUNDING MARKET, BY TYPE, 2018-2032 (USD THOUSAND)
TABLE 135 SAUDI ARABIA THERMOSETTING PLASTICS IN PLASTIC COMPOUNDING MARKET, BY TYPE, 2018-2032 (USD THOUSAND)
TABLE 136 SAUDI ARABIA BIOPLASTICS IN PLASTIC COMPOUNDING MARKET, BY TYPE, 2018-2032 (USD THOUSAND)
TABLE 137 SAUDI ARABIA PLASTIC COMPOUNDING MARKET, BY FILLER TYPE, 2018-2032 (USD THOUSAND)
TABLE 138 SAUDI ARABIA MINERAL FILLERS IN PLASTIC COMPOUNDING MARKET, BY TYPE, 2018-2032 (USD THOUSAND)
TABLE 139 SAUDI ARABIA REINFORCEMENTS IN PLASTIC COMPOUNDING MARKET, BY TYPE, 2018-2032 (USD THOUSAND)
TABLE 140 SAUDI ARABIA ADDITIVES IN PLASTIC COMPOUNDING MARKET, BY TYPE, 2018-2032 (USD THOUSAND)
TABLE 141 SAUDI ARABIA PLASTIC COMPOUNDING MARKET, BY MANUFACTURING PROCESS, 2018-2032 (USD THOUSAND)
TABLE 142 SAUDI ARABIA PLASTIC COMPOUNDING MARKET, BY MANUFACTURING PROCESS, 2018-2032 (KILO TONS)
TABLE 143 SAUDI ARABIA EXTRUSION IN PLASTIC COMPOUNDING MARKET, BY TYPE, 2018-2032 (USD THOUSAND)
TABLE 144 SAUDI ARABIA EXTRUSION IN PLASTIC COMPOUNDING MARKET, BY PELLETIZING SYSTEM, 2018-2032 (USD THOUSAND)
TABLE 145 SAUDI ARABIA INJECTION MOLDING BASED COMPOUNDING IN PLASTIC COMPOUNDING MARKET, BY PELLETIZING SYSTEM, 2018-2032 (USD THOUSAND)
TABLE 146 SAUDI ARABIA COMPACTION/PRESSING IN PLASTIC COMPOUNDING MARKET, BY PELLETIZING SYSTEM, 2018-2032 (USD THOUSAND)
TABLE 147 SAUDI ARABIA KNEADER/BANBURY MIXING IN PLASTIC COMPOUNDING MARKET, BY PELLETIZING SYSTEM, 2018-2032 (USD THOUSAND)
TABLE 148 SAUDI ARABIA PLASTIC COMPOUNDING MARKET, BY PROPERTIES, 2018-2032 (USD THOUSAND)
TABLE 149 SAUDI ARABIA PLASTIC COMPOUNDING MARKET, BY APPLICATION, 2018-2032 (USD THOUSAND)
TABLE 150 SAUDI ARABIA PLASTIC COMPOUNDING MARKET, BY APPLICATION, 2018-2032 (KILO TONS)
TABLE 151 SAUDI ARABIA AUTOMOTIVE IN PLASTIC COMPOUNDING MARKET, BY CATEGORY, 2018-2032 (USD THOUSAND)
TABLE 152 SAUDI ARABIA INTERIOR COMPONENTS IN PLASTIC COMPOUNDING MARKET, BY TYPE, 2018-2032 (USD THOUSAND)
TABLE 153 SAUDI ARABIA EXTERIOR BODY PARTS IN PLASTIC COMPOUNDING MARKET, BY TYPE, 2018-2032 (USD THOUSAND)
TABLE 154 SAUDI ARABIA UNDER-THE-HOOD APPLICATIONS IN PLASTIC COMPOUNDING MARKET, BY TYPE, 2018-2032 (USD THOUSAND)
TABLE 155 SAUDI ARABIA PACKAGING IN PLASTIC COMPOUNDING MARKET, BY CATEGORY, 2018-2032 (USD THOUSAND)
TABLE 156 SAUDI ARABIA FOOD & BEVERAGE PACKAGING IN PLASTIC COMPOUNDING MARKET, BY TYPE, 2018-2032 (USD THOUSAND)
TABLE 157 SAUDI ARABIA INDUSTRIAL PACKAGING IN PLASTIC COMPOUNDING MARKET, BY TYPE, 2018-2032 (USD THOUSAND)
TABLE 158 SAUDI ARABIA CONSUMER GOODS PACKAGING IN PLASTIC COMPOUNDING MARKET, BY TYPE, 2018-2032 (USD THOUSAND)
TABLE 159 SAUDI ARABIA BUILDING & CONSTRUCTION IN PLASTIC COMPOUNDING MARKET, BY CATEGORY, 2018-2032 (USD THOUSAND)
TABLE 160 SAUDI ARABIA ELECTRICAL & ELECTRONICS IN PLASTIC COMPOUNDING MARKET, BY CATEGORY, 2018-2032 (USD THOUSAND)
TABLE 161 SAUDI ARABIA MEDICAL DEVICES IN PLASTIC COMPOUNDING MARKET, BY CATEGORY, 2018-2032 (USD THOUSAND)
TABLE 162 SAUDI ARABIA FURNITURE IN PLASTIC COMPOUNDING MARKET, BY CATEGORY, 2018-2032 (USD THOUSAND)
TABLE 163 SAUDI ARABIA ENERGY AND POWER IN PLASTIC COMPOUNDING MARKET, BY CATEGORY, 2018-2032 (USD THOUSAND)
TABLE 164 SAUDI ARABIA AEROSPACE AND DEFENSE IN PLASTIC COMPOUNDING MARKET, BY CATEGORY, 2018-2032 (USD THOUSAND)
TABLE 165 EGYPT PLASTIC COMPOUNDING MARKET, BY POLYMER TYPE, 2018-2032 (USD THOUSAND)
TABLE 166 EGYPT PLASTIC COMPOUNDING MARKET, BY POLYMER TYPE, 2018-2032 (KILO TONS)
TABLE 167 EGYPT THERMOPLASTICS IN PLASTIC COMPOUNDING MARKET, BY TYPE, 2018-2032 (USD THOUSAND)
TABLE 168 EGYPT POLYETHYLENE (PE) IN PLASTIC COMPOUNDING MARKET, BY TYPE, 2018-2032 (USD THOUSAND)
TABLE 169 EGYPT ENGINEERING PLASTICS IN PLASTIC COMPOUNDING MARKET, BY TYPE, 2018-2032 (USD THOUSAND)
TABLE 170 EGYPT THERMOSETTING PLASTICS IN PLASTIC COMPOUNDING MARKET, BY TYPE, 2018-2032 (USD THOUSAND)
TABLE 171 EGYPT BIOPLASTICS IN PLASTIC COMPOUNDING MARKET, BY TYPE, 2018-2032 (USD THOUSAND)
TABLE 172 EGYPT PLASTIC COMPOUNDING MARKET, BY FILLER TYPE, 2018-2032 (USD THOUSAND)
TABLE 173 EGYPT MINERAL FILLERS IN PLASTIC COMPOUNDING MARKET, BY TYPE, 2018-2032 (USD THOUSAND)
TABLE 174 EGYPT REINFORCEMENTS IN PLASTIC COMPOUNDING MARKET, BY TYPE, 2018-2032 (USD THOUSAND)
TABLE 175 EGYPT ADDITIVES IN PLASTIC COMPOUNDING MARKET, BY TYPE, 2018-2032 (USD THOUSAND)
TABLE 176 EGYPT PLASTIC COMPOUNDING MARKET, BY MANUFACTURING PROCESS, 2018-2032 (USD THOUSAND)
TABLE 177 EGYPT PLASTIC COMPOUNDING MARKET, BY MANUFACTURING PROCESS, 2018-2032 (KILO TONS)
TABLE 178 EGYPT EXTRUSION IN PLASTIC COMPOUNDING MARKET, BY TYPE, 2018-2032 (USD THOUSAND)
TABLE 179 EGYPT EXTRUSION IN PLASTIC COMPOUNDING MARKET, BY PELLETIZING SYSTEM, 2018-2032 (USD THOUSAND)
TABLE 180 EGYPT INJECTION MOLDING BASED COMPOUNDING IN PLASTIC COMPOUNDING MARKET, BY PELLETIZING SYSTEM, 2018-2032 (USD THOUSAND)
TABLE 181 EGYPT COMPACTION/PRESSING IN PLASTIC COMPOUNDING MARKET, BY PELLETIZING SYSTEM, 2018-2032 (USD THOUSAND)
TABLE 182 EGYPT KNEADER/BANBURY MIXING IN PLASTIC COMPOUNDING MARKET, BY PELLETIZING SYSTEM, 2018-2032 (USD THOUSAND)
TABLE 183 EGYPT PLASTIC COMPOUNDING MARKET, BY PROPERTIES, 2018-2032 (USD THOUSAND)
TABLE 184 EGYPT PLASTIC COMPOUNDING MARKET, BY APPLICATION, 2018-2032 (USD THOUSAND)
TABLE 185 EGYPT PLASTIC COMPOUNDING MARKET, BY APPLICATION, 2018-2032 (KILO TONS)
TABLE 186 EGYPT AUTOMOTIVE IN PLASTIC COMPOUNDING MARKET, BY CATEGORY, 2018-2032 (USD THOUSAND)
TABLE 187 EGYPT INTERIOR COMPONENTS IN PLASTIC COMPOUNDING MARKET, BY TYPE, 2018-2032 (USD THOUSAND)
TABLE 188 EGYPT EXTERIOR BODY PARTS IN PLASTIC COMPOUNDING MARKET, BY TYPE, 2018-2032 (USD THOUSAND)
TABLE 189 EGYPT UNDER-THE-HOOD APPLICATIONS IN PLASTIC COMPOUNDING MARKET, BY TYPE, 2018-2032 (USD THOUSAND)
TABLE 190 EGYPT PACKAGING IN PLASTIC COMPOUNDING MARKET, BY CATEGORY, 2018-2032 (USD THOUSAND)
TABLE 191 EGYPT FOOD & BEVERAGE PACKAGING IN PLASTIC COMPOUNDING MARKET, BY TYPE, 2018-2032 (USD THOUSAND)
TABLE 192 EGYPT INDUSTRIAL PACKAGING IN PLASTIC COMPOUNDING MARKET, BY TYPE, 2018-2032 (USD THOUSAND)
TABLE 193 EGYPT CONSUMER GOODS PACKAGING IN PLASTIC COMPOUNDING MARKET, BY TYPE, 2018-2032 (USD THOUSAND)
TABLE 194 EGYPT BUILDING & CONSTRUCTION IN PLASTIC COMPOUNDING MARKET, BY CATEGORY, 2018-2032 (USD THOUSAND)
TABLE 195 EGYPT ELECTRICAL & ELECTRONICS IN PLASTIC COMPOUNDING MARKET, BY CATEGORY, 2018-2032 (USD THOUSAND)
TABLE 196 EGYPT MEDICAL DEVICES IN PLASTIC COMPOUNDING MARKET, BY CATEGORY, 2018-2032 (USD THOUSAND)
TABLE 197 EGYPT FURNITURE IN PLASTIC COMPOUNDING MARKET, BY CATEGORY, 2018-2032 (USD THOUSAND)
TABLE 198 EGYPT ENERGY AND POWER IN PLASTIC COMPOUNDING MARKET, BY CATEGORY, 2018-2032 (USD THOUSAND)
TABLE 199 EGYPT AEROSPACE AND DEFENSE IN PLASTIC COMPOUNDING MARKET, BY CATEGORY, 2018-2032 (USD THOUSAND)
TABLE 200 U.A.E. PLASTIC COMPOUNDING MARKET, BY POLYMER TYPE, 2018-2032 (USD THOUSAND)
TABLE 201 U.A.E. PLASTIC COMPOUNDING MARKET, BY POLYMER TYPE, 2018-2032 (KILO TONS)
TABLE 202 U.A.E. THERMOPLASTICS IN PLASTIC COMPOUNDING MARKET, BY TYPE, 2018-2032 (USD THOUSAND)
TABLE 203 U.A.E. POLYETHYLENE (PE) IN PLASTIC COMPOUNDING MARKET, BY TYPE, 2018-2032 (USD THOUSAND)
TABLE 204 U.A.E. ENGINEERING PLASTICS IN PLASTIC COMPOUNDING MARKET, BY TYPE, 2018-2032 (USD THOUSAND)
TABLE 205 U.A.E. THERMOSETTING PLASTICS IN PLASTIC COMPOUNDING MARKET, BY TYPE, 2018-2032 (USD THOUSAND)
TABLE 206 U.A.E. BIOPLASTICS IN PLASTIC COMPOUNDING MARKET, BY TYPE, 2018-2032 (USD THOUSAND)
TABLE 207 U.A.E. PLASTIC COMPOUNDING MARKET, BY FILLER TYPE, 2018-2032 (USD THOUSAND)
TABLE 208 U.A.E. MINERAL FILLERS IN PLASTIC COMPOUNDING MARKET, BY TYPE, 2018-2032 (USD THOUSAND)
TABLE 209 U.A.E. REINFORCEMENTS IN PLASTIC COMPOUNDING MARKET, BY TYPE, 2018-2032 (USD THOUSAND)
TABLE 210 U.A.E. ADDITIVES IN PLASTIC COMPOUNDING MARKET, BY TYPE, 2018-2032 (USD THOUSAND)
TABLE 211 U.A.E. PLASTIC COMPOUNDING MARKET, BY MANUFACTURING PROCESS, 2018-2032 (USD THOUSAND)
TABLE 212 U.A.E. PLASTIC COMPOUNDING MARKET, BY MANUFACTURING PROCESS, 2018-2032 (KILO TONS)
TABLE 213 U.A.E. EXTRUSION IN PLASTIC COMPOUNDING MARKET, BY TYPE, 2018-2032 (USD THOUSAND)
TABLE 214 U.A.E. EXTRUSION IN PLASTIC COMPOUNDING MARKET, BY PELLETIZING SYSTEM, 2018-2032 (USD THOUSAND)
TABLE 215 U.A.E. INJECTION MOLDING BASED COMPOUNDING IN PLASTIC COMPOUNDING MARKET, BY PELLETIZING SYSTEM, 2018-2032 (USD THOUSAND)
TABLE 216 U.A.E. COMPACTION/PRESSING IN PLASTIC COMPOUNDING MARKET, BY PELLETIZING SYSTEM, 2018-2032 (USD THOUSAND)
TABLE 217 U.A.E. KNEADER/BANBURY MIXING IN PLASTIC COMPOUNDING MARKET, BY PELLETIZING SYSTEM, 2018-2032 (USD THOUSAND)
TABLE 218 U.A.E. PLASTIC COMPOUNDING MARKET, BY PROPERTIES, 2018-2032 (USD THOUSAND)
TABLE 219 U.A.E. PLASTIC COMPOUNDING MARKET, BY APPLICATION, 2018-2032 (USD THOUSAND)
TABLE 220 U.A.E. PLASTIC COMPOUNDING MARKET, BY APPLICATION, 2018-2032 (KILO TONS)
TABLE 221 U.A.E. AUTOMOTIVE IN PLASTIC COMPOUNDING MARKET, BY CATEGORY, 2018-2032 (USD THOUSAND)
TABLE 222 U.A.E. INTERIOR COMPONENTS IN PLASTIC COMPOUNDING MARKET, BY TYPE, 2018-2032 (USD THOUSAND)
TABLE 223 U.A.E. EXTERIOR BODY PARTS IN PLASTIC COMPOUNDING MARKET, BY TYPE, 2018-2032 (USD THOUSAND)
TABLE 224 U.A.E. UNDER-THE-HOOD APPLICATIONS IN PLASTIC COMPOUNDING MARKET, BY TYPE, 2018-2032 (USD THOUSAND)
TABLE 225 U.A.E. PACKAGING IN PLASTIC COMPOUNDING MARKET, BY CATEGORY, 2018-2032 (USD THOUSAND)
TABLE 226 U.A.E. FOOD & BEVERAGE PACKAGING IN PLASTIC COMPOUNDING MARKET, BY TYPE, 2018-2032 (USD THOUSAND)
TABLE 227 U.A.E. INDUSTRIAL PACKAGING IN PLASTIC COMPOUNDING MARKET, BY TYPE, 2018-2032 (USD THOUSAND)
TABLE 228 U.A.E. CONSUMER GOODS PACKAGING IN PLASTIC COMPOUNDING MARKET, BY TYPE, 2018-2032 (USD THOUSAND)
TABLE 229 U.A.E. BUILDING & CONSTRUCTION IN PLASTIC COMPOUNDING MARKET, BY CATEGORY, 2018-2032 (USD THOUSAND)
TABLE 230 U.A.E. ELECTRICAL & ELECTRONICS IN PLASTIC COMPOUNDING MARKET, BY CATEGORY, 2018-2032 (USD THOUSAND)
TABLE 231 U.A.E. MEDICAL DEVICES IN PLASTIC COMPOUNDING MARKET, BY CATEGORY, 2018-2032 (USD THOUSAND)
TABLE 232 U.A.E. FURNITURE IN PLASTIC COMPOUNDING MARKET, BY CATEGORY, 2018-2032 (USD THOUSAND)
TABLE 233 U.A.E. ENERGY AND POWER IN PLASTIC COMPOUNDING MARKET, BY CATEGORY, 2018-2032 (USD THOUSAND)
TABLE 234 U.A.E. AEROSPACE AND DEFENSE IN PLASTIC COMPOUNDING MARKET, BY CATEGORY, 2018-2032 (USD THOUSAND)
TABLE 235 SOUTH AFRICA PLASTIC COMPOUNDING MARKET, BY POLYMER TYPE, 2018-2032 (USD THOUSAND)
TABLE 236 SOUTH AFRICA PLASTIC COMPOUNDING MARKET, BY POLYMER TYPE, 2018-2032 (KILO TONS)
TABLE 237 SOUTH AFRICA THERMOPLASTICS IN PLASTIC COMPOUNDING MARKET, BY TYPE, 2018-2032 (USD THOUSAND)
TABLE 238 SOUTH AFRICA POLYETHYLENE (PE) IN PLASTIC COMPOUNDING MARKET, BY TYPE, 2018-2032 (USD THOUSAND)
TABLE 239 SOUTH AFRICA ENGINEERING PLASTICS IN PLASTIC COMPOUNDING MARKET, BY TYPE, 2018-2032 (USD THOUSAND)
TABLE 240 SOUTH AFRICA THERMOSETTING PLASTICS IN PLASTIC COMPOUNDING MARKET, BY TYPE, 2018-2032 (USD THOUSAND)
TABLE 241 SOUTH AFRICA BIOPLASTICS IN PLASTIC COMPOUNDING MARKET, BY TYPE, 2018-2032 (USD THOUSAND)
TABLE 242 SOUTH AFRICA PLASTIC COMPOUNDING MARKET, BY FILLER TYPE, 2018-2032 (USD THOUSAND)
TABLE 243 SOUTH AFRICA MINERAL FILLERS IN PLASTIC COMPOUNDING MARKET, BY TYPE, 2018-2032 (USD THOUSAND)
TABLE 244 SOUTH AFRICA REINFORCEMENTS IN PLASTIC COMPOUNDING MARKET, BY TYPE, 2018-2032 (USD THOUSAND)
TABLE 245 SOUTH AFRICA ADDITIVES IN PLASTIC COMPOUNDING MARKET, BY TYPE, 2018-2032 (USD THOUSAND)
TABLE 246 SOUTH AFRICA PLASTIC COMPOUNDING MARKET, BY MANUFACTURING PROCESS, 2018-2032 (USD THOUSAND)
TABLE 247 SOUTH AFRICA PLASTIC COMPOUNDING MARKET, BY MANUFACTURING PROCESS, 2018-2032 (KILO TONS)
TABLE 248 SOUTH AFRICA EXTRUSION IN PLASTIC COMPOUNDING MARKET, BY TYPE, 2018-2032 (USD THOUSAND)
TABLE 249 SOUTH AFRICA EXTRUSION IN PLASTIC COMPOUNDING MARKET, BY PELLETIZING SYSTEM, 2018-2032 (USD THOUSAND)
TABLE 250 SOUTH AFRICA INJECTION MOLDING BASED COMPOUNDING IN PLASTIC COMPOUNDING MARKET, BY PELLETIZING SYSTEM, 2018-2032 (USD THOUSAND)
TABLE 251 SOUTH AFRICA COMPACTION/PRESSING IN PLASTIC COMPOUNDING MARKET, BY PELLETIZING SYSTEM, 2018-2032 (USD THOUSAND)
TABLE 252 SOUTH AFRICA KNEADER/BANBURY MIXING IN PLASTIC COMPOUNDING MARKET, BY PELLETIZING SYSTEM, 2018-2032 (USD THOUSAND)
TABLE 253 SOUTH AFRICA PLASTIC COMPOUNDING MARKET, BY PROPERTIES, 2018-2032 (USD THOUSAND)
TABLE 254 SOUTH AFRICA PLASTIC COMPOUNDING MARKET, BY APPLICATION, 2018-2032 (USD THOUSAND)
TABLE 255 SOUTH AFRICA PLASTIC COMPOUNDING MARKET, BY APPLICATION, 2018-2032 (KILO TONS)
TABLE 256 SOUTH AFRICA AUTOMOTIVE IN PLASTIC COMPOUNDING MARKET, BY CATEGORY, 2018-2032 (USD THOUSAND)
TABLE 257 SOUTH AFRICA INTERIOR COMPONENTS IN PLASTIC COMPOUNDING MARKET, BY TYPE, 2018-2032 (USD THOUSAND)
TABLE 258 SOUTH AFRICA EXTERIOR BODY PARTS IN PLASTIC COMPOUNDING MARKET, BY TYPE, 2018-2032 (USD THOUSAND)
TABLE 259 SOUTH AFRICA UNDER-THE-HOOD APPLICATIONS IN PLASTIC COMPOUNDING MARKET, BY TYPE, 2018-2032 (USD THOUSAND)
TABLE 260 SOUTH AFRICA PACKAGING IN PLASTIC COMPOUNDING MARKET, BY CATEGORY, 2018-2032 (USD THOUSAND)
TABLE 261 SOUTH AFRICA FOOD & BEVERAGE PACKAGING IN PLASTIC COMPOUNDING MARKET, BY TYPE, 2018-2032 (USD THOUSAND)
TABLE 262 SOUTH AFRICA INDUSTRIAL PACKAGING IN PLASTIC COMPOUNDING MARKET, BY TYPE, 2018-2032 (USD THOUSAND)
TABLE 263 SOUTH AFRICA CONSUMER GOODS PACKAGING IN PLASTIC COMPOUNDING MARKET, BY TYPE, 2018-2032 (USD THOUSAND)
TABLE 264 SOUTH AFRICA BUILDING & CONSTRUCTION IN PLASTIC COMPOUNDING MARKET, BY CATEGORY, 2018-2032 (USD THOUSAND)
TABLE 265 SOUTH AFRICA ELECTRICAL & ELECTRONICS IN PLASTIC COMPOUNDING MARKET, BY CATEGORY, 2018-2032 (USD THOUSAND)
TABLE 266 SOUTH AFRICA MEDICAL DEVICES IN PLASTIC COMPOUNDING MARKET, BY CATEGORY, 2018-2032 (USD THOUSAND)
TABLE 267 SOUTH AFRICA FURNITURE IN PLASTIC COMPOUNDING MARKET, BY CATEGORY, 2018-2032 (USD THOUSAND)
TABLE 268 SOUTH AFRICA ENERGY AND POWER IN PLASTIC COMPOUNDING MARKET, BY CATEGORY, 2018-2032 (USD THOUSAND)
TABLE 269 SOUTH AFRICA AEROSPACE AND DEFENSE IN PLASTIC COMPOUNDING MARKET, BY CATEGORY, 2018-2032 (USD THOUSAND)
TABLE 270 ISRAEL PLASTIC COMPOUNDING MARKET, BY POLYMER TYPE, 2018-2032 (USD THOUSAND)
TABLE 271 ISRAEL PLASTIC COMPOUNDING MARKET, BY POLYMER TYPE, 2018-2032 (KILO TONS)
TABLE 272 ISRAEL THERMOPLASTICS IN PLASTIC COMPOUNDING MARKET, BY TYPE, 2018-2032 (USD THOUSAND)
TABLE 273 ISRAEL POLYETHYLENE (PE) IN PLASTIC COMPOUNDING MARKET, BY TYPE, 2018-2032 (USD THOUSAND)
TABLE 274 ISRAEL ENGINEERING PLASTICS IN PLASTIC COMPOUNDING MARKET, BY TYPE, 2018-2032 (USD THOUSAND)
TABLE 275 ISRAEL THERMOSETTING PLASTICS IN PLASTIC COMPOUNDING MARKET, BY TYPE, 2018-2032 (USD THOUSAND)
TABLE 276 ISRAEL BIOPLASTICS IN PLASTIC COMPOUNDING MARKET, BY TYPE, 2018-2032 (USD THOUSAND)
TABLE 277 ISRAEL PLASTIC COMPOUNDING MARKET, BY FILLER TYPE, 2018-2032 (USD THOUSAND)
TABLE 278 ISRAEL MINERAL FILLERS IN PLASTIC COMPOUNDING MARKET, BY TYPE, 2018-2032 (USD THOUSAND)
TABLE 279 ISRAEL REINFORCEMENTS IN PLASTIC COMPOUNDING MARKET, BY TYPE, 2018-2032 (USD THOUSAND)
TABLE 280 ISRAEL ADDITIVES IN PLASTIC COMPOUNDING MARKET, BY TYPE, 2018-2032 (USD THOUSAND)
TABLE 281 ISRAEL PLASTIC COMPOUNDING MARKET, BY MANUFACTURING PROCESS, 2018-2032 (USD THOUSAND)
TABLE 282 ISRAEL PLASTIC COMPOUNDING MARKET, BY MANUFACTURING PROCESS, 2018-2032 (KILO TONS)
TABLE 283 ISRAEL EXTRUSION IN PLASTIC COMPOUNDING MARKET, BY TYPE, 2018-2032 (USD THOUSAND)
TABLE 284 ISRAEL EXTRUSION IN PLASTIC COMPOUNDING MARKET, BY PELLETIZING SYSTEM, 2018-2032 (USD THOUSAND)
TABLE 285 ISRAEL INJECTION MOLDING BASED COMPOUNDING IN PLASTIC COMPOUNDING MARKET, BY PELLETIZING SYSTEM, 2018-2032 (USD THOUSAND)
TABLE 286 ISRAEL COMPACTION/PRESSING IN PLASTIC COMPOUNDING MARKET, BY PELLETIZING SYSTEM, 2018-2032 (USD THOUSAND)
TABLE 287 ISRAEL KNEADER/BANBURY MIXING IN PLASTIC COMPOUNDING MARKET, BY PELLETIZING SYSTEM, 2018-2032 (USD THOUSAND)
TABLE 288 ISRAEL PLASTIC COMPOUNDING MARKET, BY PROPERTIES, 2018-2032 (USD THOUSAND)
TABLE 289 ISRAEL PLASTIC COMPOUNDING MARKET, BY APPLICATION, 2018-2032 (USD THOUSAND)
TABLE 290 ISRAEL PLASTIC COMPOUNDING MARKET, BY APPLICATION, 2018-2032 (KILO TONS)
TABLE 291 ISRAEL AUTOMOTIVE IN PLASTIC COMPOUNDING MARKET, BY CATEGORY, 2018-2032 (USD THOUSAND)
TABLE 292 ISRAEL INTERIOR COMPONENTS IN PLASTIC COMPOUNDING MARKET, BY TYPE, 2018-2032 (USD THOUSAND)
TABLE 293 ISRAEL EXTERIOR BODY PARTS IN PLASTIC COMPOUNDING MARKET, BY TYPE, 2018-2032 (USD THOUSAND)
TABLE 294 ISRAEL UNDER-THE-HOOD APPLICATIONS IN PLASTIC COMPOUNDING MARKET, BY TYPE, 2018-2032 (USD THOUSAND)
TABLE 295 ISRAEL PACKAGING IN PLASTIC COMPOUNDING MARKET, BY CATEGORY, 2018-2032 (USD THOUSAND)
TABLE 296 ISRAEL FOOD & BEVERAGE PACKAGING IN PLASTIC COMPOUNDING MARKET, BY TYPE, 2018-2032 (USD THOUSAND)
TABLE 297 ISRAEL INDUSTRIAL PACKAGING IN PLASTIC COMPOUNDING MARKET, BY TYPE, 2018-2032 (USD THOUSAND)
TABLE 298 ISRAEL CONSUMER GOODS PACKAGING IN PLASTIC COMPOUNDING MARKET, BY TYPE, 2018-2032 (USD THOUSAND)
TABLE 299 ISRAEL BUILDING & CONSTRUCTION IN PLASTIC COMPOUNDING MARKET, BY CATEGORY, 2018-2032 (USD THOUSAND)
TABLE 300 ISRAEL ELECTRICAL & ELECTRONICS IN PLASTIC COMPOUNDING MARKET, BY CATEGORY, 2018-2032 (USD THOUSAND)
TABLE 301 ISRAEL MEDICAL DEVICES IN PLASTIC COMPOUNDING MARKET, BY CATEGORY, 2018-2032 (USD THOUSAND)
TABLE 302 ISRAEL FURNITURE IN PLASTIC COMPOUNDING MARKET, BY CATEGORY, 2018-2032 (USD THOUSAND)
TABLE 303 ISRAEL ENERGY AND POWER IN PLASTIC COMPOUNDING MARKET, BY CATEGORY, 2018-2032 (USD THOUSAND)
TABLE 304 ISRAEL AEROSPACE AND DEFENSE IN PLASTIC COMPOUNDING MARKET, BY CATEGORY, 2018-2032 (USD THOUSAND)
TABLE 305 KUWAIT PLASTIC COMPOUNDING MARKET, BY POLYMER TYPE, 2018-2032 (USD THOUSAND)
TABLE 306 KUWAIT PLASTIC COMPOUNDING MARKET, BY POLYMER TYPE, 2018-2032 (KILO TONS)
TABLE 307 KUWAIT THERMOPLASTICS IN PLASTIC COMPOUNDING MARKET, BY TYPE, 2018-2032 (USD THOUSAND)
TABLE 308 KUWAIT POLYETHYLENE (PE) IN PLASTIC COMPOUNDING MARKET, BY TYPE, 2018-2032 (USD THOUSAND)
TABLE 309 KUWAIT ENGINEERING PLASTICS IN PLASTIC COMPOUNDING MARKET, BY TYPE, 2018-2032 (USD THOUSAND)
TABLE 310 KUWAIT THERMOSETTING PLASTICS IN PLASTIC COMPOUNDING MARKET, BY TYPE, 2018-2032 (USD THOUSAND)
TABLE 311 KUWAIT BIOPLASTICS IN PLASTIC COMPOUNDING MARKET, BY TYPE, 2018-2032 (USD THOUSAND)
TABLE 312 KUWAIT PLASTIC COMPOUNDING MARKET, BY FILLER TYPE, 2018-2032 (USD THOUSAND)
TABLE 313 KUWAIT MINERAL FILLERS IN PLASTIC COMPOUNDING MARKET, BY TYPE, 2018-2032 (USD THOUSAND)
TABLE 314 KUWAIT REINFORCEMENTS IN PLASTIC COMPOUNDING MARKET, BY TYPE, 2018-2032 (USD THOUSAND)
TABLE 315 KUWAIT ADDITIVES IN PLASTIC COMPOUNDING MARKET, BY TYPE, 2018-2032 (USD THOUSAND)
TABLE 316 KUWAIT PLASTIC COMPOUNDING MARKET, BY MANUFACTURING PROCESS, 2018-2032 (USD THOUSAND)
TABLE 317 KUWAIT PLASTIC COMPOUNDING MARKET, BY MANUFACTURING PROCESS, 2018-2032 (KILO TONS)
TABLE 318 KUWAIT EXTRUSION IN PLASTIC COMPOUNDING MARKET, BY TYPE, 2018-2032 (USD THOUSAND)
TABLE 319 KUWAIT EXTRUSION IN PLASTIC COMPOUNDING MARKET, BY PELLETIZING SYSTEM, 2018-2032 (USD THOUSAND)
TABLE 320 KUWAIT INJECTION MOLDING BASED COMPOUNDING IN PLASTIC COMPOUNDING MARKET, BY PELLETIZING SYSTEM, 2018-2032 (USD THOUSAND)
TABLE 321 KUWAIT COMPACTION/PRESSING IN PLASTIC COMPOUNDING MARKET, BY PELLETIZING SYSTEM, 2018-2032 (USD THOUSAND)
TABLE 322 KUWAIT KNEADER/BANBURY MIXING IN PLASTIC COMPOUNDING MARKET, BY PELLETIZING SYSTEM, 2018-2032 (USD THOUSAND)
TABLE 323 KUWAIT PLASTIC COMPOUNDING MARKET, BY PROPERTIES, 2018-2032 (USD THOUSAND)
TABLE 324 KUWAIT PLASTIC COMPOUNDING MARKET, BY APPLICATION, 2018-2032 (USD THOUSAND)
TABLE 325 KUWAIT PLASTIC COMPOUNDING MARKET, BY APPLICATION, 2018-2032 (KILO TONS)
TABLE 326 KUWAIT AUTOMOTIVE IN PLASTIC COMPOUNDING MARKET, BY CATEGORY, 2018-2032 (USD THOUSAND)
TABLE 327 KUWAIT INTERIOR COMPONENTS IN PLASTIC COMPOUNDING MARKET, BY TYPE, 2018-2032 (USD THOUSAND)
TABLE 328 KUWAIT EXTERIOR BODY PARTS IN PLASTIC COMPOUNDING MARKET, BY TYPE, 2018-2032 (USD THOUSAND)
TABLE 329 KUWAIT UNDER-THE-HOOD APPLICATIONS IN PLASTIC COMPOUNDING MARKET, BY TYPE, 2018-2032 (USD THOUSAND)
TABLE 330 KUWAIT PACKAGING IN PLASTIC COMPOUNDING MARKET, BY CATEGORY, 2018-2032 (USD THOUSAND)
TABLE 331 KUWAIT FOOD & BEVERAGE PACKAGING IN PLASTIC COMPOUNDING MARKET, BY TYPE, 2018-2032 (USD THOUSAND)
TABLE 332 KUWAIT INDUSTRIAL PACKAGING IN PLASTIC COMPOUNDING MARKET, BY TYPE, 2018-2032 (USD THOUSAND)
TABLE 333 KUWAIT CONSUMER GOODS PACKAGING IN PLASTIC COMPOUNDING MARKET, BY TYPE, 2018-2032 (USD THOUSAND)
TABLE 334 KUWAIT BUILDING & CONSTRUCTION IN PLASTIC COMPOUNDING MARKET, BY CATEGORY, 2018-2032 (USD THOUSAND)
TABLE 335 KUWAIT ELECTRICAL & ELECTRONICS IN PLASTIC COMPOUNDING MARKET, BY CATEGORY, 2018-2032 (USD THOUSAND)
TABLE 336 KUWAIT MEDICAL DEVICES IN PLASTIC COMPOUNDING MARKET, BY CATEGORY, 2018-2032 (USD THOUSAND)
TABLE 337 KUWAIT FURNITURE IN PLASTIC COMPOUNDING MARKET, BY CATEGORY, 2018-2032 (USD THOUSAND)
TABLE 338 KUWAIT ENERGY AND POWER IN PLASTIC COMPOUNDING MARKET, BY CATEGORY, 2018-2032 (USD THOUSAND)
TABLE 339 KUWAIT AEROSPACE AND DEFENSE IN PLASTIC COMPOUNDING MARKET, BY CATEGORY, 2018-2032 (USD THOUSAND)
TABLE 340 OMAN PLASTIC COMPOUNDING MARKET, BY POLYMER TYPE, 2018-2032 (USD THOUSAND)
TABLE 341 OMAN PLASTIC COMPOUNDING MARKET, BY POLYMER TYPE, 2018-2032 (KILO TONS)
TABLE 342 OMAN THERMOPLASTICS IN PLASTIC COMPOUNDING MARKET, BY TYPE, 2018-2032 (USD THOUSAND)
TABLE 343 OMAN POLYETHYLENE (PE) IN PLASTIC COMPOUNDING MARKET, BY TYPE, 2018-2032 (USD THOUSAND)
TABLE 344 OMAN ENGINEERING PLASTICS IN PLASTIC COMPOUNDING MARKET, BY TYPE, 2018-2032 (USD THOUSAND)
TABLE 345 OMAN THERMOSETTING PLASTICS IN PLASTIC COMPOUNDING MARKET, BY TYPE, 2018-2032 (USD THOUSAND)
TABLE 346 OMAN BIOPLASTICS IN PLASTIC COMPOUNDING MARKET, BY TYPE, 2018-2032 (USD THOUSAND)
TABLE 347 OMAN PLASTIC COMPOUNDING MARKET, BY FILLER TYPE, 2018-2032 (USD THOUSAND)
TABLE 348 OMAN MINERAL FILLERS IN PLASTIC COMPOUNDING MARKET, BY TYPE, 2018-2032 (USD THOUSAND)
TABLE 349 OMAN REINFORCEMENTS IN PLASTIC COMPOUNDING MARKET, BY TYPE, 2018-2032 (USD THOUSAND)
TABLE 350 OMAN ADDITIVES IN PLASTIC COMPOUNDING MARKET, BY TYPE, 2018-2032 (USD THOUSAND)
TABLE 351 OMAN PLASTIC COMPOUNDING MARKET, BY MANUFACTURING PROCESS, 2018-2032 (USD THOUSAND)
TABLE 352 OMAN PLASTIC COMPOUNDING MARKET, BY MANUFACTURING PROCESS, 2018-2032 (KILO TONS)
TABLE 353 OMAN EXTRUSION IN PLASTIC COMPOUNDING MARKET, BY TYPE, 2018-2032 (USD THOUSAND)
TABLE 354 OMAN EXTRUSION IN PLASTIC COMPOUNDING MARKET, BY PELLETIZING SYSTEM, 2018-2032 (USD THOUSAND)
TABLE 355 OMAN INJECTION MOLDING BASED COMPOUNDING IN PLASTIC COMPOUNDING MARKET, BY PELLETIZING SYSTEM, 2018-2032 (USD THOUSAND)
TABLE 356 OMAN COMPACTION/PRESSING IN PLASTIC COMPOUNDING MARKET, BY PELLETIZING SYSTEM, 2018-2032 (USD THOUSAND)
TABLE 357 OMAN KNEADER/BANBURY MIXING IN PLASTIC COMPOUNDING MARKET, BY PELLETIZING SYSTEM, 2018-2032 (USD THOUSAND)
TABLE 358 OMAN PLASTIC COMPOUNDING MARKET, BY PROPERTIES, 2018-2032 (USD THOUSAND)
TABLE 359 OMAN PLASTIC COMPOUNDING MARKET, BY APPLICATION, 2018-2032 (USD THOUSAND)
TABLE 360 OMAN PLASTIC COMPOUNDING MARKET, BY APPLICATION, 2018-2032 (KILO TONS)
TABLE 361 OMAN AUTOMOTIVE IN PLASTIC COMPOUNDING MARKET, BY CATEGORY, 2018-2032 (USD THOUSAND)
TABLE 362 OMAN INTERIOR COMPONENTS IN PLASTIC COMPOUNDING MARKET, BY TYPE, 2018-2032 (USD THOUSAND)
TABLE 363 OMAN EXTERIOR BODY PARTS IN PLASTIC COMPOUNDING MARKET, BY TYPE, 2018-2032 (USD THOUSAND)
TABLE 364 OMAN UNDER-THE-HOOD APPLICATIONS IN PLASTIC COMPOUNDING MARKET, BY TYPE, 2018-2032 (USD THOUSAND)
TABLE 365 OMAN PACKAGING IN PLASTIC COMPOUNDING MARKET, BY CATEGORY, 2018-2032 (USD THOUSAND)
TABLE 366 OMAN FOOD & BEVERAGE PACKAGING IN PLASTIC COMPOUNDING MARKET, BY TYPE, 2018-2032 (USD THOUSAND)
TABLE 367 OMAN INDUSTRIAL PACKAGING IN PLASTIC COMPOUNDING MARKET, BY TYPE, 2018-2032 (USD THOUSAND)
TABLE 368 OMAN CONSUMER GOODS PACKAGING IN PLASTIC COMPOUNDING MARKET, BY TYPE, 2018-2032 (USD THOUSAND)
TABLE 369 OMAN BUILDING & CONSTRUCTION IN PLASTIC COMPOUNDING MARKET, BY CATEGORY, 2018-2032 (USD THOUSAND)
TABLE 370 OMAN ELECTRICAL & ELECTRONICS IN PLASTIC COMPOUNDING MARKET, BY CATEGORY, 2018-2032 (USD THOUSAND)
TABLE 371 OMAN MEDICAL DEVICES IN PLASTIC COMPOUNDING MARKET, BY CATEGORY, 2018-2032 (USD THOUSAND)
TABLE 372 OMAN FURNITURE IN PLASTIC COMPOUNDING MARKET, BY CATEGORY, 2018-2032 (USD THOUSAND)
TABLE 373 OMAN ENERGY AND POWER IN PLASTIC COMPOUNDING MARKET, BY CATEGORY, 2018-2032 (USD THOUSAND)
TABLE 374 OMAN AEROSPACE AND DEFENSE IN PLASTIC COMPOUNDING MARKET, BY CATEGORY, 2018-2032 (USD THOUSAND)
TABLE 375 QATAR PLASTIC COMPOUNDING MARKET, BY POLYMER TYPE, 2018-2032 (USD THOUSAND)
TABLE 376 QATAR PLASTIC COMPOUNDING MARKET, BY POLYMER TYPE, 2018-2032 (KILO TONS)
TABLE 377 ATAR THERMOPLASTICS IN PLASTIC COMPOUNDING MARKET, BY TYPE, 2018-2032 (USD THOUSAND)
TABLE 378 QATAR POLYETHYLENE (PE) IN PLASTIC COMPOUNDING MARKET, BY TYPE, 2018-2032 (USD THOUSAND)
TABLE 379 QATAR ENGINEERING PLASTICS IN PLASTIC COMPOUNDING MARKET, BY TYPE, 2018-2032 (USD THOUSAND)
TABLE 380 QATAR THERMOSETTING PLASTICS IN PLASTIC COMPOUNDING MARKET, BY TYPE, 2018-2032 (USD THOUSAND)
TABLE 381 QATAR BIOPLASTICS IN PLASTIC COMPOUNDING MARKET, BY TYPE, 2018-2032 (USD THOUSAND)
TABLE 382 QATAR PLASTIC COMPOUNDING MARKET, BY FILLER TYPE, 2018-2032 (USD THOUSAND)
TABLE 383 QATAR MINERAL FILLERS IN PLASTIC COMPOUNDING MARKET, BY TYPE, 2018-2032 (USD THOUSAND)
TABLE 384 QATAR REINFORCEMENTS IN PLASTIC COMPOUNDING MARKET, BY TYPE, 2018-2032 (USD THOUSAND)
TABLE 385 QATAR ADDITIVES IN PLASTIC COMPOUNDING MARKET, BY TYPE, 2018-2032 (USD THOUSAND)
TABLE 386 QATAR PLASTIC COMPOUNDING MARKET, BY MANUFACTURING PROCESS, 2018-2032 (USD THOUSAND)
TABLE 387 QATAR PLASTIC COMPOUNDING MARKET, BY MANUFACTURING PROCESS, 2018-2032 (KILO TONS)
TABLE 388 QATAR EXTRUSION IN PLASTIC COMPOUNDING MARKET, BY TYPE, 2018-2032 (USD THOUSAND)
TABLE 389 QATAR EXTRUSION IN PLASTIC COMPOUNDING MARKET, BY PELLETIZING SYSTEM, 2018-2032 (USD THOUSAND)
TABLE 390 QATAR INJECTION MOLDING BASED COMPOUNDING IN PLASTIC COMPOUNDING MARKET, BY PELLETIZING SYSTEM, 2018-2032 (USD THOUSAND)
TABLE 391 QATAR COMPACTION/PRESSING IN PLASTIC COMPOUNDING MARKET, BY PELLETIZING SYSTEM, 2018-2032 (USD THOUSAND)
TABLE 392 QATAR KNEADER/BANBURY MIXING IN PLASTIC COMPOUNDING MARKET, BY PELLETIZING SYSTEM, 2018-2032 (USD THOUSAND)
TABLE 393 QATAR PLASTIC COMPOUNDING MARKET, BY PROPERTIES, 2018-2032 (USD THOUSAND)
TABLE 394 QATAR PLASTIC COMPOUNDING MARKET, BY APPLICATION, 2018-2032 (USD THOUSAND)
TABLE 395 QATAR PLASTIC COMPOUNDING MARKET, BY APPLICATION, 2018-2032 (KILO TONS)
TABLE 396 QATAR AUTOMOTIVE IN PLASTIC COMPOUNDING MARKET, BY CATEGORY, 2018-2032 (USD THOUSAND)
TABLE 397 QATAR INTERIOR COMPONENTS IN PLASTIC COMPOUNDING MARKET, BY TYPE, 2018-2032 (USD THOUSAND)
TABLE 398 QATAR EXTERIOR BODY PARTS IN PLASTIC COMPOUNDING MARKET, BY TYPE, 2018-2032 (USD THOUSAND)
TABLE 399 QATAR UNDER-THE-HOOD APPLICATIONS IN PLASTIC COMPOUNDING MARKET, BY TYPE, 2018-2032 (USD THOUSAND)
TABLE 400 QATAR PACKAGING IN PLASTIC COMPOUNDING MARKET, BY CATEGORY, 2018-2032 (USD THOUSAND)
TABLE 401 QATAR FOOD & BEVERAGE PACKAGING IN PLASTIC COMPOUNDING MARKET, BY TYPE, 2018-2032 (USD THOUSAND)
TABLE 402 QATAR INDUSTRIAL PACKAGING IN PLASTIC COMPOUNDING MARKET, BY TYPE, 2018-2032 (USD THOUSAND)
TABLE 403 QATAR CONSUMER GOODS PACKAGING IN PLASTIC COMPOUNDING MARKET, BY TYPE, 2018-2032 (USD THOUSAND)
TABLE 404 QATAR BUILDING & CONSTRUCTION IN PLASTIC COMPOUNDING MARKET, BY CATEGORY, 2018-2032 (USD THOUSAND)
TABLE 405 QATAR ELECTRICAL & ELECTRONICS IN PLASTIC COMPOUNDING MARKET, BY CATEGORY, 2018-2032 (USD THOUSAND)
TABLE 406 QATAR MEDICAL DEVICES IN PLASTIC COMPOUNDING MARKET, BY CATEGORY, 2018-2032 (USD THOUSAND)
TABLE 407 QATAR FURNITURE IN PLASTIC COMPOUNDING MARKET, BY CATEGORY, 2018-2032 (USD THOUSAND)
TABLE 408 QATAR ENERGY AND POWER IN PLASTIC COMPOUNDING MARKET, BY CATEGORY, 2018-2032 (USD THOUSAND)
TABLE 409 QATAR AEROSPACE AND DEFENSE IN PLASTIC COMPOUNDING MARKET, BY CATEGORY, 2018-2032 (USD THOUSAND)
TABLE 410 BAHRAIN PLASTIC COMPOUNDING MARKET, BY POLYMER TYPE, 2018-2032 (USD THOUSAND)
TABLE 411 BAHRAIN PLASTIC COMPOUNDING MARKET, BY POLYMER TYPE, 2018-2032 (KILO TONS)
TABLE 412 BAHRAIN THERMOPLASTICS IN PLASTIC COMPOUNDING MARKET, BY TYPE, 2018-2032 (USD THOUSAND)
TABLE 413 BAHRAIN POLYETHYLENE (PE) IN PLASTIC COMPOUNDING MARKET, BY TYPE, 2018-2032 (USD THOUSAND)
TABLE 414 BAHRAIN ENGINEERING PLASTICS IN PLASTIC COMPOUNDING MARKET, BY TYPE, 2018-2032 (USD THOUSAND)
TABLE 415 BAHRAIN THERMOSETTING PLASTICS IN PLASTIC COMPOUNDING MARKET, BY TYPE, 2018-2032 (USD THOUSAND)
TABLE 416 BAHRAIN BIOPLASTICS IN PLASTIC COMPOUNDING MARKET, BY TYPE, 2018-2032 (USD THOUSAND)
TABLE 417 BAHRAIN PLASTIC COMPOUNDING MARKET, BY FILLER TYPE, 2018-2032 (USD THOUSAND)
TABLE 418 BAHRAIN MINERAL FILLERS IN PLASTIC COMPOUNDING MARKET, BY TYPE, 2018-2032 (USD THOUSAND)
TABLE 419 BAHRAIN REINFORCEMENTS IN PLASTIC COMPOUNDING MARKET, BY TYPE, 2018-2032 (USD THOUSAND)
TABLE 420 BAHRAIN ADDITIVES IN PLASTIC COMPOUNDING MARKET, BY TYPE, 2018-2032 (USD THOUSAND)
TABLE 421 BAHRAIN PLASTIC COMPOUNDING MARKET, BY MANUFACTURING PROCESS, 2018-2032 (USD THOUSAND)
TABLE 422 BAHRAIN PLASTIC COMPOUNDING MARKET, BY MANUFACTURING PROCESS, 2018-2032 (KILO TONS)
TABLE 423 BAHRAIN EXTRUSION IN PLASTIC COMPOUNDING MARKET, BY TYPE, 2018-2032 (USD THOUSAND)
TABLE 424 BAHRAIN EXTRUSION IN PLASTIC COMPOUNDING MARKET, BY PELLETIZING SYSTEM, 2018-2032 (USD THOUSAND)
TABLE 425 BAHRAIN INJECTION MOLDING BASED COMPOUNDING IN PLASTIC COMPOUNDING MARKET, BY PELLETIZING SYSTEM, 2018-2032 (USD THOUSAND)
TABLE 426 BAHRAIN COMPACTION/PRESSING IN PLASTIC COMPOUNDING MARKET, BY PELLETIZING SYSTEM, 2018-2032 (USD THOUSAND)
TABLE 427 BAHRAIN KNEADER/BANBURY MIXING IN PLASTIC COMPOUNDING MARKET, BY PELLETIZING SYSTEM, 2018-2032 (USD THOUSAND)
TABLE 428 BAHRAIN PLASTIC COMPOUNDING MARKET, BY PROPERTIES, 2018-2032 (USD THOUSAND)
TABLE 429 BAHRAIN PLASTIC COMPOUNDING MARKET, BY APPLICATION, 2018-2032 (USD THOUSAND)
TABLE 430 BAHRAIN PLASTIC COMPOUNDING MARKET, BY APPLICATION, 2018-2032 (KILO TONS)
TABLE 431 BAHRAIN AUTOMOTIVE IN PLASTIC COMPOUNDING MARKET, BY CATEGORY, 2018-2032 (USD THOUSAND)
TABLE 432 BAHRAIN INTERIOR COMPONENTS IN PLASTIC COMPOUNDING MARKET, BY TYPE, 2018-2032 (USD THOUSAND)
TABLE 433 BAHRAIN EXTERIOR BODY PARTS IN PLASTIC COMPOUNDING MARKET, BY TYPE, 2018-2032 (USD THOUSAND)
TABLE 434 BAHRAIN UNDER-THE-HOOD APPLICATIONS IN PLASTIC COMPOUNDING MARKET, BY TYPE, 2018-2032 (USD THOUSAND)
TABLE 435 BAHRAIN PACKAGING IN PLASTIC COMPOUNDING MARKET, BY CATEGORY, 2018-2032 (USD THOUSAND)
TABLE 436 BAHRAIN FOOD & BEVERAGE PACKAGING IN PLASTIC COMPOUNDING MARKET, BY TYPE, 2018-2032 (USD THOUSAND)
TABLE 437 BAHRAIN INDUSTRIAL PACKAGING IN PLASTIC COMPOUNDING MARKET, BY TYPE, 2018-2032 (USD THOUSAND)
TABLE 438 BAHRAIN CONSUMER GOODS PACKAGING IN PLASTIC COMPOUNDING MARKET, BY TYPE, 2018-2032 (USD THOUSAND)
TABLE 439 BAHRAIN BUILDING & CONSTRUCTION IN PLASTIC COMPOUNDING MARKET, BY CATEGORY, 2018-2032 (USD THOUSAND)
TABLE 440 BAHRAIN ELECTRICAL & ELECTRONICS IN PLASTIC COMPOUNDING MARKET, BY CATEGORY, 2018-2032 (USD THOUSAND)
TABLE 441 BAHRAIN MEDICAL DEVICES IN PLASTIC COMPOUNDING MARKET, BY CATEGORY, 2018-2032 (USD THOUSAND)
TABLE 442 BAHRAIN FURNITURE IN PLASTIC COMPOUNDING MARKET, BY CATEGORY, 2018-2032 (USD THOUSAND)
TABLE 443 BAHRAIN ENERGY AND POWER IN PLASTIC COMPOUNDING MARKET, BY CATEGORY, 2018-2032 (USD THOUSAND)
TABLE 444 BAHRAIN AEROSPACE AND DEFENSE IN PLASTIC COMPOUNDING MARKET, BY CATEGORY, 2018-2032 (USD THOUSAND)
TABLE 445 REST OF MIDDLE EAST AND AFRICA PLASTIC COMPOUNDING MARKET, BY POLYMER TYPE, 2018-2032 (USD THOUSAND)
TABLE 446 REST OF MIDDLE EAST AND AFRICA PLASTIC COMPOUNDING MARKET, BY POLYMER TYPE, 2018-2032 (KILO TONS)
Lista de figuras
FIGURE 1 MIDDLE EAST AND AFRICA PLASTIC COMPOUNDING MARKET
FIGURE 2 MIDDLE EAST AND AFRICA PLASTIC COMPOUNDING MARKET: DATA TRIANGULATION
FIGURE 3 MIDDLE EAST AND AFRICA PLASTIC COMPOUNDING MARKET: DROC ANALYSIS
FIGURE 4 MIDDLE EAST AND AFRICA PLASTIC COMPOUNDING MARKET: MIDDLE EAST AND AFRICA VS REGIONAL MARKET ANALYSIS
FIGURE 5 MIDDLE EAST AND AFRICA PLASTIC COMPOUNDING MARKET: COMPANY RESEARCH ANALYSIS
FIGURE 6 MIDDLE EAST AND AFRICA PLASTIC COMPOUNDING MARKET: MULTIVARIATE MODELLING
FIGURE 7 MIDDLE EAST AND AFRICA PLASTIC COMPOUNDING MARKET: INTERVIEW DEMOGRAPHICS
FIGURE 8 MIDDLE EAST AND AFRICA PLASTIC COMPOUNDING MARKET: DBMR MARKET POSITION GRID
FIGURE 9 MIDDLE EAST AND AFRICA PLASTIC COMPOUNDING MARKET: MARKET APPLICATION COVERAGE GRID
FIGURE 10 EXECUTIVE SUMMARY
FIGURE 11 MIDDLE EAST AND AFRICA PLASTIC COMPOUNDING MARKET: SEGMENTATION
FIGURE 12 FIVE SEGMENTS COMPRISE THE MIDDLE EAST AND AFRICA PLASTIC COMPOUNDING MARKET, BY POLYMER TYPE
FIGURE 13 STRATEGIC DECISIONS
FIGURE 14 SHIFT TOWARDS RECYCLABLE AND BIODEGRADABLE PLASTIC COMPOUNDS DUE TO ENVIRONMENTAL REGULATION IS EXPECTED TO DRIVE THE MIDDLE EAST AND AFRICA PLASTIC COMPUNDING MARKET DURING THE FORECAST PERIOD OF 2025 TO 2032
FIGURE 15 THERMOPLASTICS SEGMENT IS EXPECTED TO ACCOUNT FOR THE LARGEST SHARE OF THE MIDDLE EAST AND AFRICA PLASTIC COMPUNDING MARKET IN 2025 AND 2032
FIGURE 16 PORTER’S FIVE FORCES ANALYSIS
FIGURE 17 MIDDLE EAST AND AFRICA PLASTIC COMPOUNDING MARKET: VALUE CHAIN ANALYSIS
FIGURE 18 IMPORT EXPORT SCENARIO (USD THOUSAND)
FIGURE 19 PRODUCTION CAPACITY FOR TOP MANUFACTURERS
FIGURE 20 IPC CODE V/S NUMBER OF PATENTS
FIGURE 21 NUMBER OF PATENTS PER YEAR
FIGURE 22 NUMBER OF PATENTS PER REGION/COUNTRY
FIGURE 23 TOP PATENT APPLICANTS
FIGURE 24 MIDDLE EAST AND AFRICA PLASTIC COMPOUNDING MARKET, 2024-2032, AVERAGE SELLING PRICE (USD/KG)
FIGURE 25 DRIVERS, RESTRAINTS, OPPORTUNITIES AND CHALLENGES OF THE MIDDLE EAST AND AFRICA PLASTIC COMPOUNDING MARKET
FIGURE 26 MIDDLE EAST AND AFRICA PLASTIC COMPOUNDING MARKET: BY POLYMER TYPE, 2024
FIGURE 27 MIDDLE EAST AND AFRICA PLASTIC COMPOUNDING MARKET, BY FILTER TYPE, 2024
FIGURE 28 MIDDLE EAST AND AFRICA PLASTIC COMPOUNDING MARKET, BY MANUFACTURING PROCESS, 2024
FIGURE 29 MIDDLE EAST AND AFRICA PLASTIC COMPOUNDING MARKET, BY PROPERTIES, 2024
FIGURE 30 MIDDLE EAST AND AFRICA PLASTIC COMPOUNDING MARKET, BY APPLICATION, 2024
FIGURE 32 MIDDLE EAST AND AFRICA PLASTIC COMPOUNDING MARKET: COMPANY SHARE 2024 (%)
Metodología de investigación
La recopilación de datos y el análisis del año base se realizan utilizando módulos de recopilación de datos con muestras de gran tamaño. La etapa incluye la obtención de información de mercado o datos relacionados a través de varias fuentes y estrategias. Incluye el examen y la planificación de todos los datos adquiridos del pasado con antelación. Asimismo, abarca el examen de las inconsistencias de información observadas en diferentes fuentes de información. Los datos de mercado se analizan y estiman utilizando modelos estadísticos y coherentes de mercado. Además, el análisis de la participación de mercado y el análisis de tendencias clave son los principales factores de éxito en el informe de mercado. Para obtener más información, solicite una llamada de un analista o envíe su consulta.
La metodología de investigación clave utilizada por el equipo de investigación de DBMR es la triangulación de datos, que implica la extracción de datos, el análisis del impacto de las variables de datos en el mercado y la validación primaria (experto en la industria). Los modelos de datos incluyen cuadrícula de posicionamiento de proveedores, análisis de línea de tiempo de mercado, descripción general y guía del mercado, cuadrícula de posicionamiento de la empresa, análisis de patentes, análisis de precios, análisis de participación de mercado de la empresa, estándares de medición, análisis global versus regional y de participación de proveedores. Para obtener más información sobre la metodología de investigación, envíe una consulta para hablar con nuestros expertos de la industria.
Personalización disponible
Data Bridge Market Research es líder en investigación formativa avanzada. Nos enorgullecemos de brindar servicios a nuestros clientes existentes y nuevos con datos y análisis que coinciden y se adaptan a sus objetivos. El informe se puede personalizar para incluir análisis de tendencias de precios de marcas objetivo, comprensión del mercado de países adicionales (solicite la lista de países), datos de resultados de ensayos clínicos, revisión de literatura, análisis de mercado renovado y base de productos. El análisis de mercado de competidores objetivo se puede analizar desde análisis basados en tecnología hasta estrategias de cartera de mercado. Podemos agregar tantos competidores sobre los que necesite datos en el formato y estilo de datos que esté buscando. Nuestro equipo de analistas también puede proporcionarle datos en archivos de Excel sin procesar, tablas dinámicas (libro de datos) o puede ayudarlo a crear presentaciones a partir de los conjuntos de datos disponibles en el informe.

