
Mercado de bolsas de papel de Oriente Medio y África, por producto (bolsas de papel planas, sacos de papel multicapa , boca abierta, válvula pegada, bolsa de papel con cerradura, bolsas de estilo autoapertura (SOS), bolsa vertical y otras), uso (de un solo uso y reutilizables), capacidad (menos de 1 kg, 1 kg-5 kg, 5 kg-10 kg, más de 10 kg), tamaño (tamaño pequeño, tamaño mediano, tamaño grande y tamaño extragrande, otros), sellado y manipulación (sellado térmico, asa de mano, cierre hermético, asa retorcida, asa plana y otros), forma (rectángulo, cuadrado, circular y otros), canal de distribución (tiendas de conveniencia, supermercados/hipermercados, tiendas especializadas, comercio electrónico y otros), usuario final (alimentos y bebidas, alimentos para animales, productos cosméticos, agricultura, construcción, productos farmacéuticos, productos químicos y otros) Tendencias de la industria y pronóstico para 2029.
Análisis y tamaño del mercado
Las bolsas de papel se fabrican a partir de pulpa de madera que se descompone fácilmente, no libera gases tóxicos en el suelo y no tiene impacto en los niveles de los animales y las aguas subterráneas, manteniendo la estabilidad de la naturaleza. Las bolsas de papel tienen una gran demanda debido a algunas propiedades considerables de las bolsas de papel, ya que son reutilizables, reciclables, biodegradables y, lo más importante, ayudan a reducir los desechos plásticos. La fabricación de bolsas de papel es rentable y el proceso es fácil en comparación con otras soluciones de embalaje. Las bolsas de papel tienen más demanda en el comercio minorista que las bolsas de la compra, ya que las bolsas de papel de múltiples capas con el asa retorcida en el lado superior brindan resistencia para transportar bienes de consumo.
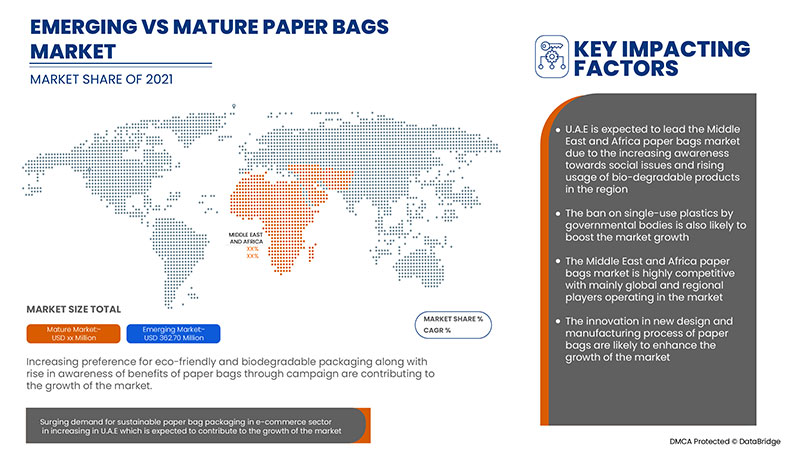
La creciente preferencia por envases ecológicos, biodegradables y sostenibles y el aumento de las iniciativas adoptadas por los organismos gubernamentales para prohibir el plástico de un solo uso y promover otras alternativas, como las bolsas de papel, impulsarán el crecimiento del mercado. Sin embargo, la baja disponibilidad de materias primas (pulpa de madera) puede obstaculizar el crecimiento del mercado.
La creciente conciencia de los problemas sociales y el creciente uso de productos biodegradables pueden crear inmensas oportunidades para el crecimiento del mercado, pero mantener la calidad estándar de las bolsas de papel puede crear un gran desafío para el fabricante de bolsas de papel en el futuro cercano.
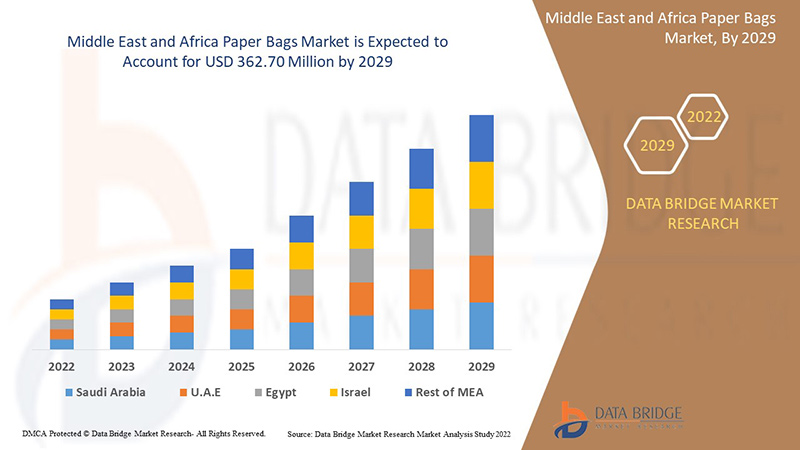
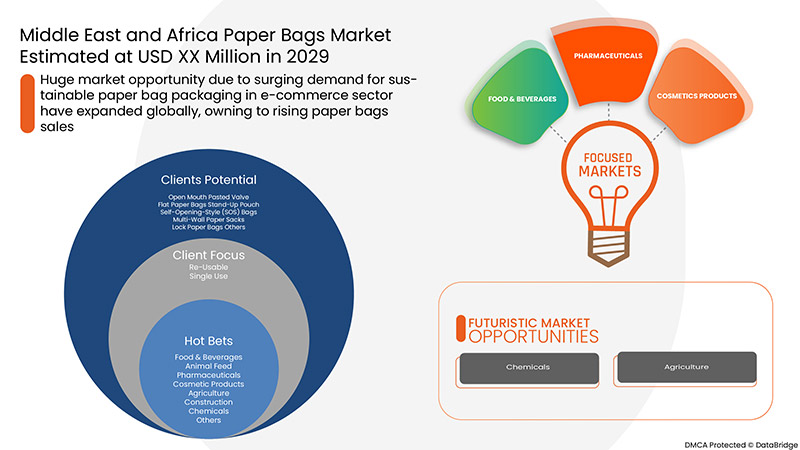
Data Bridge Market Research analiza que se espera que el mercado de bolsas de papel de Oriente Medio y África alcance un valor de 362,70 millones de dólares para el año 2029, con una tasa compuesta anual del 3,7 % durante el período de pronóstico. "Alimentos y bebidas" representa el segmento de usuario final más destacado en el mercado respectivo debido al aumento de la demanda de bolsas de papel para entornos de atención domiciliaria. El informe de mercado elaborado por el equipo de Data Bridge Market Research incluye un análisis profundo de expertos, análisis de importación/exportación, análisis de precios, análisis de consumo de producción y escenario de la cadena climática.
|
Métrica del informe |
Detalles |
|
Período de pronóstico |
2022 a 2029 |
|
Año base |
2021 |
|
Años históricos |
2020 (Personalizable para 2019 - 2014) |
|
Unidades cuantitativas |
Ingresos en millones de USD, precios en USD, volumen en millones de unidades |
|
Segmentos cubiertos |
Por producto (bolsas de papel planas, bolsas de papel multicapa, de boca abierta, con válvula pegada, bolsas de papel con cerradura, bolsas de estilo autoapertura (SOS), bolsas verticales y otras), uso (de un solo uso y reutilizables), capacidad (menos de 1 kg, 1 kg-5 kg, 5 kg-10 kg, más de 10 kg), tamaño (tamaño pequeño, tamaño mediano, tamaño grande y tamaño extra grande, otros), sellado y manipulación (sellado térmico, asa de mano, cierre hermético, asa torcida, asa plana y otras), forma (rectángulo, cuadrado, circular y otras), canal de distribución (tiendas de conveniencia, supermercados/hipermercados, tiendas especializadas, comercio electrónico y otros), usuario final (alimentos y bebidas, alimentos para animales, productos cosméticos, agricultura, construcción, productos farmacéuticos, productos químicos y otros) |
|
Países cubiertos |
Sudáfrica, Egipto, Arabia Saudita, Emiratos Árabes Unidos, Israel, Irán, Etiopía, Kuwait y el resto de Oriente Medio y África. |
|
Actores del mercado cubiertos |
Mondi, International Paper, Shuaiba Industrial Company (KPSC), Papyrus Paper Products LTD, middleeastdisposable, Lanpack, Gulf East Paper And Plastic Industries LLC, Hotpack Packaging Industries LLC, CLASSYPAC MIDDLE EAST, Packteck, RETQA PAPER BAGS, Kiki Bags, Golden Pack for Packaging Industries, Green Age Partners y Huhtamaki, entre otros. |
Definición de mercado
Las bolsas de papel están hechas de pulpa de madera de árboles, renovable, reciclable y biodegradable. El papel kraft y el papel kraft de iniciación son los papeles más comunes utilizados en la fabricación de bolsas de papel. Las bolsas de papel se utilizan comúnmente como bolsas de compras, embalajes y sacos. Las bolsas de papel también vienen en las paredes múltiples, que brindan resistencia para almacenar y transportar alimentos y bebidas, productos de alimentación animal y otros productos. Las bolsas de papel de carga también tienen asas retorcidas o planas para manipular mercancías. Las bolsas de papel son muy utilizadas en el sector minorista para transportar artículos de compras.
Marco regulatorio
De acuerdo con la legislación sobre envases para la regulación de los materiales en contacto con alimentos en los Estados miembros de Oriente Medio y África.
La reglamentación de los materiales en contacto con alimentos en los Estados miembros del Consejo de Cooperación de los Estados Árabes del Golfo (también conocido como el Consejo de Cooperación del Golfo y en adelante denominado CCG) se caracteriza por normas basadas en el consenso establecidas por la Organización de Normalización del CCG (GSO). Las normas de la GSO establecen las condiciones y los requisitos de composición específicos para diversos materiales en contacto con alimentos. En gran medida, los requisitos de estas normas reflejan las reglamentaciones de la Unión Europea (UE) sobre materiales en contacto con alimentos. Siguiendo una tendencia mundial, varios estados miembros del CCG han impuesto recientemente nuevas restricciones a las bolsas de plástico y otros artículos de plástico de un solo uso, lo que afecta a los materiales plásticos en contacto con alimentos.
La dinámica del mercado de bolsas de papel en Oriente Medio y África incluye:
Impulsores/Oportunidades
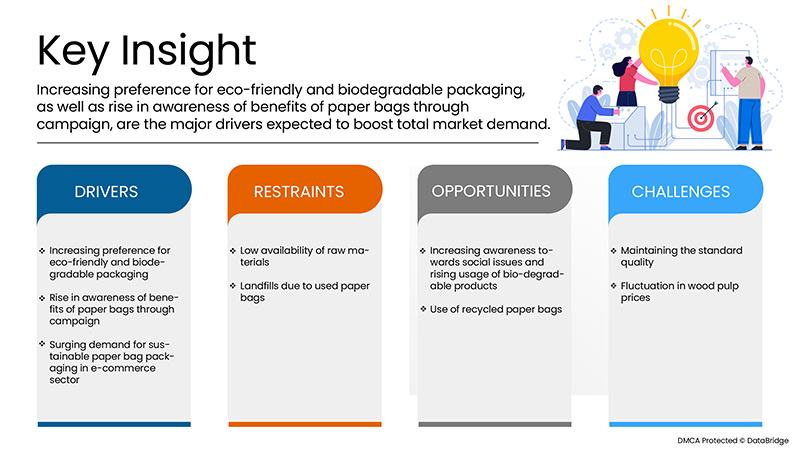
- Creciente preferencia por envases ecológicos y biodegradables
Los productos ecológicos no son perjudiciales para el medio ambiente, están hechos de ingredientes totalmente naturales y son fácilmente reciclables, compostables o biodegradables . Un número cada vez mayor de consumidores conscientes del medio ambiente optan por productos sostenibles como las bolsas de papel que son ecológicas y fácilmente degradables. Se espera que la demanda de bolsas de papel ligeras y fácilmente transportables aumente en las industrias de cosméticos, alimentos y bebidas, farmacéutica, construcción y otras. La conciencia sobre el impacto nocivo del plástico en el medio ambiente insta a los clientes a optar por opciones ecológicas y biodegradables como las bolsas de papel. Las bolsas de papel se utilizan ampliamente en el embalaje de varios productos como alimentos y bebidas, textiles, cemento, productos electrónicos, efectos personales y otros. Por lo tanto, la alta demanda de bolsas de papel en la industria del embalaje impulsará el crecimiento del mercado. La creciente conciencia del uso de opciones de embalaje sostenibles anima a los clientes de Oriente Medio y los países africanos a utilizar bolsas de papel.
- Aumentar la conciencia sobre los beneficios de las bolsas de papel a través de la campaña
Cada vez más personas con conciencia ambiental en Oriente Medio y los países africanos optan por opciones de embalaje sostenibles y difunden la concienciación. El plástico supone una grave amenaza para la salud humana y el medio ambiente. Por lo tanto, la adopción de productos de papel en diversas industrias, como la alimentación y las bebidas, la construcción, los productos farmacéuticos, los cosméticos y otros en Oriente Medio y los países africanos está aumentando. La creciente demanda de productos de embalaje sostenibles, reciclables, reutilizables, compostables y biodegradables, como las bolsas de papel, junto con la creciente concienciación a través de varias campañas de promoción de las bolsas de papel y de difusión de la concienciación sobre los efectos nocivos de los plásticos, puede impulsar el crecimiento del mercado.
- Creciente demanda de envases de bolsas de papel sostenibles en el sector del comercio electrónico
Varias empresas optan por el embalaje en bolsas de papel para entregar sus productos, ya que son sostenibles y ligeras, lo que facilita su transporte. La demanda de embalajes en bolsas de papel está aumentando en el sector del comercio electrónico, ya que cada vez más compradores compran en línea y los minoristas existentes siguen creciendo en tamaño. El número de paquetes que compran también aumenta. El comercio minorista en línea ha abierto las puertas a las empresas domésticas, los artesanos y los emprendedores para tener la capacidad de vender sus productos a nivel mundial desde su hogar, estudio o pequeño espacio de trabajo.
- Aumento de la concienciación sobre los problemas sociales y aumento del uso de productos biodegradables
Se utilizan varios tipos de envases en diferentes aplicaciones, lo que genera residuos muy perjudiciales para el medio ambiente. Los envases de plástico se utilizan para alimentos y bebidas, cosméticos y bienes de consumo que producen productos no biodegradables, ya que la descomposición de los residuos de envases de plástico libera gases tóxicos en el suelo, lo que es peligroso para los animales y las aguas subterráneas. Por ello, se han tomado medidas para prohibir los envases de bolsas de plástico, ya que son perjudiciales para el medio ambiente.
Restricciones/Desafíos
- Baja disponibilidad de materia prima
La disponibilidad de la calidad y la cantidad adecuadas es una preocupación para la producción de bolsas de papel en todas las regiones. Las bolsas de papel se fabrican a partir del papel que se utiliza en varias aplicaciones y tienen una mayor demanda debido al bajo costo del producto. La materia prima utilizada en la producción de bolsas de papel es pulpa de madera extraída de los árboles y pasa por varios procesos. El papel se fabrica en diferentes calidades y se utiliza además para hacer bolsas de compras de diferentes tamaños.
- Vertederos por bolsas de papel usadas
Las bolsas de papel se utilizan en diversas aplicaciones, como alimentos, cosméticos y atención médica, entre otras. Por lo tanto, la demanda de bolsas de papel ha aumentado en la región de Medio Oriente y África. Las bolsas de papel son de dos tipos: de un solo uso y reutilizables. A medida que aumenta la demanda de un solo uso, los desechos de papel terminan en vertederos, lo que genera un mayor vertido de desechos de papel. Esto afecta negativamente al medio ambiente, ya que el papel tarda en descomponerse. El reciclaje de bolsas de papel también incluye el costo que los fabricantes no quieren gastar, lo que resulta en el aumento de la cantidad de vertederos de bolsas de papel usadas.
El COVID-19 tuvo un impacto mínimo en el mercado de bolsas de papel
El COVID-19 afectó a varias industrias manufactureras y de prestación de servicios en el año 2020-2021, ya que provocó el cierre de lugares de trabajo, la interrupción de las cadenas de suministro y restricciones al transporte. El desequilibrio entre la demanda y la oferta y su impacto en los precios se considera de corto plazo y se espera que se recupere a medida que esta pandemia llegue a su fin. Debido al brote de COVID-19 en todo el mundo, la demanda de bolsas de papel ha aumentado debido al aumento de la demanda de productos de embalaje. Además, las empresas de bolsas de papel introdujeron productos de bolsas de papel nuevos y avanzados. Por lo tanto, aunque las otras industrias sufrieron mucho durante el brote de COVID-19, la industria de las bolsas de papel creció considerablemente.
Acontecimientos recientes
- En marzo de 2021, Mondi se asoció con Tesco para crear bolsas de papel reciclado para los minoristas. La visión de esta asociación es comprar los desechos de cartón corrugado del almacén del minorista para crear bolsas de compras de papel reciclado.
- En junio de 2021, Hotpack Packaging Industries LLC abrió Eco Store, un destino minorista en línea para productos de envasado de alimentos ecológicos en los Emiratos Árabes Unidos.
Mercado de bolsas de papel en Oriente Medio y África
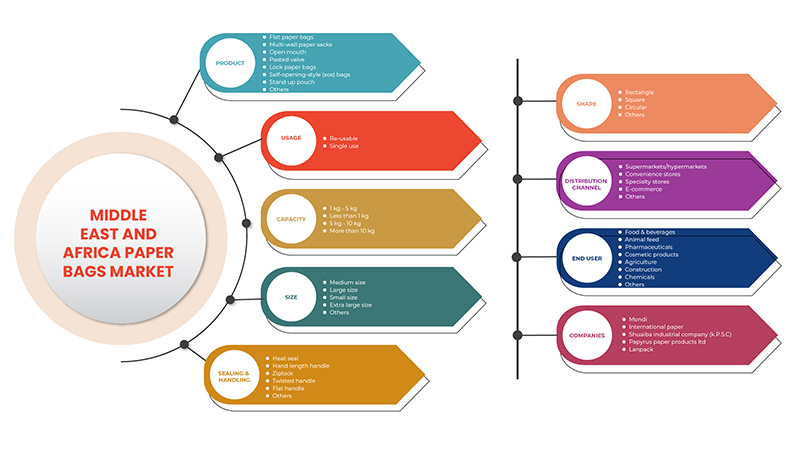
El mercado de bolsas de papel de Oriente Medio y África está segmentado en función del producto, el uso, la capacidad, el tamaño, el sellado y la manipulación, la forma, el canal de distribución y el usuario final. El crecimiento entre estos segmentos le ayudará a analizar los segmentos de crecimiento escaso en las industrias y brindará a los usuarios una valiosa descripción general del mercado y conocimientos del mercado para ayudarlos a tomar decisiones estratégicas para identificar las principales aplicaciones del mercado.
Producto
- Bolsas de papel planas
- Bolsas de papel multicapa
- Boca abierta
- Válvula pegada
- Bolsas de papel con cerradura
- Bolsas de apertura automática (SOS)
- Bolsa Stand Up
- Otros
Según el producto, el mercado de bolsas de papel de Medio Oriente y África está segmentado en bolsas de papel planas, sacos de papel de múltiples paredes, de boca abierta, con válvula pegada, bolsas de papel con cerradura, bolsas de estilo autoapertura (SOS), bolsas verticales y otras.
Uso
- De un solo uso
- Reutilizable
Según el uso, el mercado de bolsas de papel de Oriente Medio y África está segmentado en bolsas de un solo uso y reutilizables.
Capacidad
- Menos de 1 kg
- 1 kg - 5 kg
- 5 kg - 10 kg
- Más de 10 kg
Según la capacidad, el mercado de bolsas de papel de Medio Oriente y África está segmentado en menos de 1 kg, 1 kg-5 kg, 5 kg-10 kg y más de 10 kg.
Tamaño
- Tamaño pequeño
- Tamaño mediano
- Tamaño grande
- Tamaño extra grande
- Otros
Según el tamaño, el mercado de bolsas de papel de Oriente Medio y África está segmentado en tamaño pequeño, tamaño mediano, tamaño grande y tamaño extra grande.
Sellado y manipulación
- Sellado térmico
- Mango de longitud de mano
- Bolsa con cierre hermético
- Mango torcido
- Mango plano
- Otros
Basado en el sellado y manejo, el mercado de bolsas de papel de Medio Oriente y África está segmentado en sellado térmico, asa de longitud de mano, ziplock, asa retorcida, asa plana y otros.
Forma
- Rectángulo
- Cuadrado
- Circular
- Otros
Según la forma, el mercado de bolsas de papel de Oriente Medio y África está segmentado en rectangulares, cuadradas, circulares y otras.
Canal de distribución
- Tiendas de conveniencia
- Supermercados/Hipermercados
- Tiendas especializadas
- Comercio electrónico
- Otros
Según el canal de distribución, el mercado de bolsas de papel de Medio Oriente y África está segmentado en tiendas de conveniencia, supermercados/hipermercados, tiendas especializadas, comercio electrónico y otros.
Usuario final
- Alimentos y bebidas
- Alimento para animales
- Productos cosméticos
- Agricultura
- Construcción
- Productos farmacéuticos
- Productos químicos
- Otros
Según el usuario final, el mercado de bolsas de papel de Medio Oriente y África está segmentado en alimentos y bebidas, alimentos para animales, productos cosméticos, agricultura, construcción, productos farmacéuticos , productos químicos y otros.
Análisis y perspectivas del mercado de bolsas de papel en Oriente Medio y África
Se analiza el mercado de bolsas de papel de Oriente Medio y África, y se proporcionan información y tendencias sobre el tamaño del mercado por país, producto, uso, capacidad, tamaño, sellado y manipulación, forma, canal de distribución y usuario final como se menciona anteriormente.
Algunos de los países cubiertos en el informe del mercado de bolsas de papel de Medio Oriente y África son Sudáfrica, Egipto, Arabia Saudita, Emiratos Árabes Unidos, Israel, Irán, Etiopía, Kuwait y el resto de Medio Oriente y África.
Se espera que los Emiratos Árabes Unidos dominen el mercado de bolsas de papel en Oriente Medio y África debido a la creciente preferencia por los envases ecológicos, biodegradables y sostenibles. A los Emiratos Árabes Unidos les sigue Arabia Saudita y se espera que experimenten un crecimiento significativo durante el período de pronóstico de 2022 a 2029 debido al aumento de las iniciativas adoptadas por los organismos gubernamentales para prohibir el plástico de un solo uso. A Arabia Saudita le sigue Sudáfrica y se espera que crezca significativamente debido a la creciente conciencia de los problemas sociales y al aumento del uso de productos biodegradables.
La sección de países del informe también proporciona factores de impacto de mercado individuales y cambios en la regulación del mercado que afectan las tendencias actuales y futuras del mercado. Los puntos de datos como el análisis de la cadena de valor ascendente y descendente, las tendencias técnicas, el análisis de las cinco fuerzas de Porter y los estudios de casos son algunos de los indicadores utilizados para pronosticar el escenario del mercado para países individuales. Además, la presencia y disponibilidad de las marcas de Oriente Medio y África y los desafíos que enfrentan debido a la gran o escasa competencia de las marcas locales y nacionales, el impacto de los aranceles internos y las rutas comerciales se consideran al proporcionar un análisis de pronóstico de los datos del país.
Análisis del panorama competitivo y de la cuota de mercado de las bolsas de papel en Oriente Medio y África
Panorama competitivo del mercado de bolsas de papel en Oriente Medio y África: proporcione detalles por competidor. Los detalles incluidos son una descripción general de la empresa, las finanzas de la empresa, los ingresos generados, el potencial de mercado, la inversión en investigación y desarrollo, las nuevas iniciativas de mercado, la presencia en Oriente Medio y África, los sitios e instalaciones de producción, las capacidades de producción, las fortalezas y debilidades de la empresa, el lanzamiento de productos, la amplitud y la variedad de productos, el dominio de las aplicaciones. Los puntos de datos anteriores proporcionados solo están relacionados con el enfoque de las empresas en relación con el mercado de bolsas de papel en Oriente Medio y África.
Algunos de los principales actores del mercado involucrados en el mercado de bolsas de papel en Medio Oriente y África son Mondi, International Paper, Shuaiba Industrial Company (KPSC), Papyrus Paper Products LTD, middleeastdisposable, Lanpack, Gulf East Paper And Plastic Industries LLC, Hotpack Packaging Industries LLC, CLASSYPAC MIDDLE EAST, Packteck, RETQA PAPER BAGS, Kiki Bags, Golden Pack for Packaging Industries, Green Age Partners y Huhtamaki, entre otros.
SKU-
Obtenga acceso en línea al informe sobre la primera nube de inteligencia de mercado del mundo

- Panel de análisis de datos interactivo
- Panel de análisis de empresas para oportunidades con alto potencial de crecimiento
- Acceso de analista de investigación para personalización y consultas
- Análisis de la competencia con panel interactivo
- Últimas noticias, actualizaciones y análisis de tendencias
- Aproveche el poder del análisis de referencia para un seguimiento integral de la competencia
Tabla de contenido
1 INTRODUCTION
1.1 OBJECTIVES OF THE STUDY
1.2 MARKET DEFINITION
1.3 OVERVIEW OF MIDDLE EAST AND AFRICA PAPER BAGS MARKET
1.4 LIMITATIONS
1.5 MARKETS COVERED
2 MARKET SEGMENTATION
2.1 MARKETS COVERED
2.2 GEOGRAPHICAL SCOPE
2.3 YEARS CONSIDERED FOR THE STUDY
2.4 CURRENCY AND PRICING
2.5 DBMR TRIPOD DATA VALIDATION MODEL
2.6 PRODUCT LIFE LINE CURVE
2.7 MULTIVARIATE MODELLING
2.8 PRIMARY INTERVIEWS WITH KEY OPINION LEADERS
2.9 DBMR MARKET POSITION GRID
2.1 MARKET PRODUCT TYPE COVERAGE GRID
2.11 DBMR MARKET CHALLENGE MATRIX
2.12 VENDOR SHARE ANALYSIS
2.13 IMPORT-EXPORT DATA
2.14 SECONDARY SOURCES
2.15 ASSUMPTIONS
3 EXECUTIVE SUMMARY
4 PREMIUM INSIGHTS
4.1 IMPORT-EXPORT SCENARIO
4.2 LIST OF KEY BUYERS
4.3 PORTER'S FIVE FORCES ANALYSIS
4.3.1 BARGAINING POWER OF CUSTOMERS
4.3.2 BARGAINING POWER OF SUPPLIERS
4.3.3 THREAT OF NEW ENTRANTS
4.3.4 THREAT OF SUBSTITUTES
4.3.5 RIVALRY AMONG EXISTING COMPETITORS
4.4 PRICE TREND ANALYSIS
4.5 PRODUCTION & CONSUMPTION ANALYSIS (PAPER)
4.6 RAW MATERIAL PRODUCTION COVERAGE
4.7 REGULATION COVERAGE
4.8 SUPPLY CHAIN ANALYSIS
4.8.1 OVERVIEW
4.8.2 LOGISTIC COST SCENARIO
4.8.3 IMPORTANCE OF LOGISTICS SERVICE PROVIDERS
4.9 TECHNOLOGICAL ADVANCEMENTS BY MANUFACTURERS IN THE MIDDLE EAST AND AFRICA PAPER BAGS MARKET
4.1 VENDOR SELECTION CRITERIA
4.10.1 THE VENDOR SELECTION CRITERIA ARE AS FOLLOWS-
4.11 PESTEL ANALYSIS
5 MARKET OVERVIEW
5.1 DRIVERS
5.1.1 INCREASING PREFERENCE FOR ECO-FRIENDLY AND BIODEGRADABLE PACKAGING
5.1.2 RISE IN AWARENESS OF BENEFITS OF PAPER BAGS THROUGH CAMPAIGN
5.1.3 SURGING DEMAND FOR SUSTAINABLE PAPER BAG PACKAGING IN THE E-COMMERCE SECTOR
5.1.4 BAN ON SINGLE-USE PLASTICS BY GOVERNMENTAL BODIES
5.2 RESTRAINTS
5.2.1 LOW AVAILABILITY OF RAW MATERIAL
5.2.2 LANDFILLS DUE TO USED PAPER BAGS
5.3 OPPORTUNITIES
5.3.1 INCREASING AWARENESS OF SOCIAL ISSUES AND RISING USAGE OF BIO-DEGRADABLE PRODUCTS
5.3.2 USE OF RECYCLED PAPER BAGS
5.3.3 INNOVATIONS IN NEW DESIGN AND MANUFACTURING PROCESS
5.4 CHALLENGES
5.4.1 MAINTAINING THE STANDARD QUALITY
5.4.2 FLUCTUATION IN WOOD PULP PRICES
6 MIDDLE EAST AND AFRICA PAPER BAGS MARKET, BY PRODUCT
6.1 OVERVIEW
6.2 OPEN MOUTH
6.2.1 OPEN MOUTH, BY MATERIAL
6.2.1.1 BROWN KRAFT
6.2.1.1.1 BIODEGRADABLE
6.2.1.1.2 RENEWABLE
6.2.1.1.3 NATURAL
6.2.1.2 WHITE KRAFT
6.2.1.2.1 BIODEGRADABLE
6.2.1.2.2 RENEWABLE
6.2.1.2.3 NATURAL
6.2.1.3 OTHERS
6.3 PASTED VALVE
6.3.1 PASTED VALVE, BY MATERIAL
6.3.1.1 BROWN KRAFT
6.3.1.1.1 BIODEGRADABLE
6.3.1.1.2 RENEWABLE
6.3.1.1.3 NATURAL
6.3.1.2 WHITE KRAFT
6.3.1.2.1 BIODEGRADABLE
6.3.1.2.2 RENEWABLE
6.3.1.2.3 NATURAL
6.3.1.3 OTHERS
6.4 FLAT PAPER BAG
6.4.1 FLAT PAPER BAGS, BY MATERIAL
6.4.1.1 BROWN KRAFT
6.4.1.1.1 BIODEGRADABLE
6.4.1.1.2 RENEWABLE
6.4.1.1.3 NATURAL
6.4.1.2 WHITE KRAFT
6.4.1.2.1 BIODEGRADABLE
6.4.1.2.2 RENEWABLE
6.4.1.2.3 NATURAL
6.4.1.3 OTHERS
6.5 STAND-UP POUCH
6.5.1 STAND-UP POUCH, BY TYPE
6.5.1.1 THREE SIDE SEALED
6.5.1.2 K - SEAL BOTTOM TYPE
6.5.1.3 SIDE GUSSET TYPE
6.5.1.4 ROUND BOTTOM GUSSET TYPE
6.5.1.5 FOUR SIDE SEALED
6.5.1.6 PLOW BOTTOM TYPE
6.5.1.7 OTHERS
6.5.2 STAND-UP POUCH, BY MATERIAL
6.5.2.1 BROWN KRAFT
6.5.2.1.1 BIODEGRADABLE
6.5.2.1.2 RENEWABLE
6.5.2.1.3 NATURAL
6.5.2.2 WHITE KRAFT
6.5.2.2.1 BIODEGRADABLE
6.5.2.2.2 RENEWABLE
6.5.2.2.3 NATURAL
6.5.2.3 OTHERS
6.6 SELF-OPENING-STYLE (SOS) BAGS
6.6.1 SELF-OPENING-STYLE (SOS) BAGS, BY TYPE
6.6.1.1 1-PLY
6.6.1.2 2-PLY
6.6.1.3 3-PLY
6.6.1.4 OTHERS
6.6.2 SELF-OPENING-STYLE (SOS) BAGS, BY MATERIAL
6.6.2.1 BROWN KRAFT
6.6.2.1.1 BIODEGRADABLE
6.6.2.1.2 RENEWABLE
6.6.2.1.3 NATURAL
6.6.2.2 WHITE KRAFT
6.6.2.2.1 BIODEGRADABLE
6.6.2.2.2 RENEWABLE
6.6.2.2.3 NATURAL
6.6.2.3 OTHERS
6.7 MULTI-WALL PAPER SACKS
6.7.1 MULTI-WALL PAPER SACKS, BY MATERIAL
6.7.1.1 BROWN KRAFT
6.7.1.1.1 BIODEGRADABLE
6.7.1.1.2 RENEWABLE
6.7.1.1.3 NATURAL
6.7.1.2 WHITE KRAFT
6.7.1.2.1 BIODEGRADABLE
6.7.1.2.2 RENEWABLE
6.7.1.2.3 NATURAL
6.7.1.3 OTHERS
6.8 LOCK PAPER BAG
6.8.1 LOCK PAPER BAG, BY MATERIAL
6.8.1.1 BROWN KRAFT
6.8.1.1.1 BIODEGRADABLE
6.8.1.1.2 RENEWABLE
6.8.1.1.3 NATURAL
6.8.1.2 WHITE KRAFT
6.8.1.2.1 BIODEGRADABLE
6.8.1.2.2 RENEWABLE
6.8.1.2.3 NATURAL
6.8.1.3 OTHERS
6.9 OTHERS
6.9.1 OTHERS, BY MATERIAL
6.9.1.1 BROWN KRAFT
6.9.1.1.1 BIODEGRADABLE
6.9.1.1.2 RENEWABLE
6.9.1.1.3 NATURAL
6.9.1.2 WHITE KRAFT
6.9.1.2.1 BIODEGRADABLE
6.9.1.2.2 RENEWABLE
6.9.1.2.3 NATURAL
6.9.1.3 OTHERS
7 MIDDLE EAST AND AFRICA PAPER BAGS MARKET, BY USAGE
7.1 OVERVIEW
7.2 RE-USABLE
7.3 SINGLE USE
8 MIDDLE EAST AND AFRICA PAPER BAGS MARKET, BY CAPACITY
8.1 OVERVIEW
8.2 1 KG - 5 KG
8.3 LESS THAN 1 KG
8.4 5 KG - 10 KG
8.5 MORE THAN 10 KG
9 MIDDLE EAST AND AFRICA PAPER BAGS MARKET, BY SIZE
9.1 OVERVIEW
9.2 MEDIUM SIZE
9.3 LARGE SIZE
9.4 SMALL SIZE
9.5 EXTRA LARGE SIZE
9.6 OTHERS
10 MIDDLE EAST AND AFRICA PAPER BAGS MARKET, BY SEALING AND HANDLING
10.1 OVERVIEW
10.2 HEAT SEAL
10.3 HAND LENGTH HANDLE
10.4 ZIPLOCK
10.5 TWISTED HANDLE
10.6 FLAT HANDLE
10.7 OTHERS
11 MIDDLE EAST AND AFRICA PAPER BAGS MARKET, BY SHAPE
11.1 OVERVIEW
11.2 RECTANGLE
11.3 SQUARE
11.4 CIRCULAR
11.5 OTHERS
12 MIDDLE EAST AND AFRICA PAPER BAGS MARKET, BY DISTRIBUTION CHANNEL
12.1 OVERVIEW
12.2 SUPERMARKETS/HYPERMARKETS
12.3 CONVENIENCE STORES
12.4 SPECIALTY STORES
12.5 E-COMMERCE
12.6 OTHERS
13 MIDDLE EAST AND AFRICA PAPER BAGS MARKET, BY END-USER
13.1 OVERVIEW
13.2 FOOD AND BEVERAGES
13.2.1 FOOD & BEVERAGES, BY END-USER
13.2.1.1 FRUITS
13.2.1.2 VEGETABLES
13.2.1.3 BAKERY PRODUCTS
13.2.1.3.1 CAKES
13.2.1.3.2 PASTRIES
13.2.1.3.3 BISCUITS
13.2.1.3.4 BREADS
13.2.1.3.5 OTHERS
13.2.1.4 COOKED FOOD
13.2.1.4.1 SANDWICHES
13.2.1.4.2 BURGER
13.2.1.4.3 PIZZA
13.2.1.4.4 OTHERS
13.2.1.5 MEAT, SEAFOOD AND POULTRY
13.2.1.6 DAIRY PRODUCTS
13.2.1.7 FLOUR
13.2.2 FOOD & BEVERAGES, BY PRODUCT
13.2.2.1 OPEN MOUTH
13.2.2.2 PASTED VALVE
13.2.2.3 FLAT PAPER BAG
13.2.2.4 STAND-UP POUCH
13.2.2.5 SELF-OPENING-STYLE (SOS) BAGS
13.2.2.6 MULTI-WALL PAPER SACKS
13.2.2.7 LOCK PAPER BAG
13.2.2.8 OTHERS
13.3 ANIMAL FEED
13.3.1 ANIMAL FEED, BY END-USER
13.3.1.1 PET FOOD
13.3.1.2 AQUAFEED
13.3.1.3 OTHERS
13.3.2 ANIMAL FEED, BY PRODUCT
13.3.2.1 OPEN MOUTH
13.3.2.2 PASTED VALVE
13.3.2.3 FLAT PAPER BAG
13.3.2.4 STAND-UP POUCH
13.3.2.5 SELF-OPENING-STYLE (SOS) BAGS
13.3.2.6 MULTI-WALL PAPER SACKS
13.3.2.7 LOCK PAPER BAG
13.3.2.8 OTHERS
13.4 PHARMACEUTICALS
13.4.1 PHARMACEUTICALS, BY PRODUCT
13.4.1.1 OPEN MOUTH
13.4.1.2 PASTED VALVE
13.4.1.3 FLAT PAPER BAG
13.4.1.4 STAND-UP POUCH
13.4.1.5 SELF-OPENING-STYLE (SOS) BAGS
13.4.1.6 MULTI-WALL PAPER SACKS
13.4.1.7 LOCK PAPER BAG
13.4.1.8 OTHERS
13.5 COSMETIC PRODUCTS
13.5.1 COSMETIC PRODUCTS, BY END-USER
13.5.1.1 SKIN AND SUN CARE PRODUCTS
13.5.1.2 HAIR CARE PRODUCTS
13.5.1.3 MAKEUP AND COLOR COSMETICS
13.5.1.4 OTHERS
13.5.2 COSMETIC PRODUCTS, BY PRODUCT
13.5.2.1 OPEN MOUTH
13.5.2.2 PASTED VALVE
13.5.2.3 FLAT PAPER BAG
13.5.2.4 STAND-UP POUCH
13.5.2.5 SELF-OPENING-STYLE (SOS) BAGS
13.5.2.6 MULTI-WALL PAPER SACKS
13.5.2.7 LOCK PAPER BAG
13.5.2.8 OTHERS
13.6 AGRICULTURE
13.6.1 AGRICULTURE, BY PRODUCT
13.6.1.1 OPEN MOUTH
13.6.1.2 PASTED VALVE
13.6.1.3 FLAT PAPER BAG
13.6.1.4 STAND-UP POUCH
13.6.1.5 SELF-OPENING-STYLE (SOS) BAGS
13.6.1.6 MULTI-WALL PAPER SACKS
13.6.1.7 LOCK PAPER BAG
13.6.1.8 OTHERS
13.7 CONSTRUCTION
13.7.1 CONSTRUCTION, BY PRODUCT
13.7.1.1 OPEN MOUTH
13.7.1.2 PASTED VALVE
13.7.1.3 FLAT PAPER BAG
13.7.1.4 STAND-UP POUCH
13.7.1.5 SELF-OPENING-STYLE (SOS) BAGS
13.7.1.6 MULTI-WALL PAPER SACKS
13.7.1.7 LOCK PAPER BAG
13.7.1.8 OTHERS
13.8 CHEMICALS
13.8.1 CHEMICALS, BY PRODUCT
13.8.1.1 OPEN MOUTH
13.8.1.2 PASTED VALVE
13.8.1.3 FLAT PAPER BAG
13.8.1.4 STAND-UP POUCH
13.8.1.5 SELF-OPENING-STYLE (SOS) BAGS
13.8.1.6 MULTI-WALL PAPER SACKS
13.8.1.7 LOCK PAPER BAG
13.8.1.8 OTHERS
13.9 OTHERS
13.9.1 OTHERS, BY PRODUCT
13.9.1.1 OPEN MOUTH
13.9.1.2 PASTED VALVE
13.9.1.3 FLAT PAPER BAG
13.9.1.4 STAND-UP POUCH
13.9.1.5 SELF-OPENING-STYLE (SOS) BAGS
13.9.1.6 MULTI-WALL PAPER SACKS
13.9.1.7 LOCK PAPER BAG
13.9.1.8 OTHERS
14 MIDDLE EAST & AFRICA PAPER BAGS MARKET, BY COUNTRY
14.1 U.A.E.
14.2 SAUDI ARABIA
14.3 SOUTH AFRICA
14.4 ISRAEL
14.5 KUWAIT
14.6 EGYPT
14.7 IRAN
14.8 ETHIOPIA
14.9 REST OF MIDDLE EAST & AFRICA
15 MIDDLE EAST AND AFRICA PAPER BAGS MARKET, COMPANY LANDSCAPE
15.1 COMPANY SHARE ANALYSIS: MIDDLE EAST AND AFRICA
15.1.1 MERGER & ACQUISITIONS
15.1.2 EXPANSIONS
16 SWOT ANALYSIS
17 COMPANY PROFILE
17.1 MONDI
17.1.1 COMPANY SNAPSHOT
17.1.2 REVENUE ANALYSIS
17.1.3 PRODUCT PORTFOLIO
17.1.4 RECENT UPDATE
17.2 INTERNATIONAL PAPER
17.2.1 COMPANY SNAPSHOT
17.2.2 REVENUE ANALYSIS
17.2.3 PRODUCT PORTFOLIO
17.2.4 RECENT UPDATES
17.3 SHUAIBA INDUSTRIAL COMPANY (K.P.S.C)
17.3.1 COMPANY SNAPSHOT
17.3.2 REVENUE ANALYSIS
17.3.3 PRODUCT PORTFOLIO
17.3.4 RECENT UPDATE
17.4 PAPYRUS PAPER PRODUCTS LTD
17.4.1 COMPANY SNAPSHOT
17.4.2 PRODUCT PORTFOLIO
17.4.3 RECENT UPDATE
17.5 MIDDLEEASTDISPOSABLE
17.5.1 COMPANY SNAPSHOT
17.5.2 PRODUCT PORTFOLIO
17.5.3 RECENT UPDATE
17.6 LANPACK
17.6.1 COMPANY SNAPSHOT
17.6.2 PRODUCT PORTFOLIO
17.6.3 RECENT UPDATE
17.7 CLASSYPAC MIDDLE EAST
17.7.1 COMPANY SNAPSHOT
17.7.2 PRODUCT PORTFOLIO
17.7.3 RECENT UPDATE
17.8 GOLDEN PACK FOR PACKAGING INDUSTRIES
17.8.1 COMPANY SNAPSHOT
17.8.2 PRODUCT PORTFOLIO
17.8.3 RECENT UPDATE
17.9 GREEN AGE PARTNERS
17.9.1 COMPANY SNAPSHOT
17.9.2 PRODUCT PORTFOLIO
17.9.3 RECENT UPDATE
17.1 GULF EAST PAPER AND PLASTIC INDUSTRIES LLC
17.10.1 COMPANY SNAPSHOT
17.10.2 PRODUCT PORTFOLIO
17.10.3 RECENT UPDATE
17.11 HOTPACK PACKAGING INDUSTRIES LLC
17.11.1 COMPANY SNAPSHOT
17.11.2 PRODUCT PORTFOLIO
17.11.3 RECENT UPDATES
17.12 HUHTAMAKI
17.12.1 COMPANY SNAPSHOT
17.12.2 REVENUE ANALYSIS
17.12.3 PRODUCT PORTFOLIO
17.12.4 RECENT UPDATES
17.13 KIKI BAGS
17.13.1 COMPANY SNAPSHOT
17.13.2 PRODUCT PORTFOLIO
17.13.3 RECENT UPDATE
17.14 PACKTECK
17.14.1 COMPANY SNAPSHOT
17.14.2 PRODUCT PORTFOLIO
17.14.3 RECENT UPDATE
17.15 RETQA PAPER BAGS
17.15.1 COMPANY SNAPSHOT
17.15.2 PRODUCT PORTFOLIO
17.15.3 RECENT UPDATE
18 QUESTIONNAIRE
19 RELATED REPORTS
Lista de Tablas
TABLE 1 IMPORT DATA OF SACKS AND BAGS, OF PAPER, PAPERBOARD, CELLULOSE WADDING OR WEBS OF CELLULOSE FIBRES, HAVING A BASE OF A WIDTH OF >= 40 CM); HS CODE: 481930 (USD THOUSAND)
TABLE 2 EXPORT DATA OF SACKS AND BAGS, OF PAPER, PAPERBOARD, CELLULOSE WADDING OR WEBS OF CELLULOSE FIBRES, HAVING A BASE OF A WIDTH OF >= 40 CM); HS CODE: 481930 (USD THOUSAND)
TABLE 3 EXPORT DATA OF PAPER AND PAPERBOARD; ARTICLES OF PAPER PULP, OF PAPER OR OF PAPERBOARD (USD THOUSAND)-
TABLE 4 IMPORT DATA FROM INDONESIA TO UAE (2020)-
TABLE 5 IMPORT OF PAPER BAGS FROM INDIA (2016)-
TABLE 6 IMPORT OF PAPER BAGS FROM INDIA (2016)-
TABLE 7 IMPORT DATA OF PAPER BAGS IN KUWAIT FROM INDIA (2016)-
TABLE 8 LIST OF KEY BUYERS
TABLE 9 BROWN PAPER (SUP) POUCH WITH ZIPPER:
TABLE 10 WHITE PAPER (SUP) POUCH WITH ZIPPER:
TABLE 11 SUP POUCH WITH ZIPPER (BROWN PAPER) BAGS WITH OVAL WINDOW:
TABLE 12 BROWN PAPER & WHITE PAPER SUP POUCH WITH ZIPPER:
TABLE 13 ONE SIDE BROWN PAPER & ONE SIDE CLEAR SUP POUCH WITH ZIPPER:
TABLE 14 BROWN PAPER SIDE GUSSET BAGS:
TABLE 15 FLAT BOTTOM POUCH NO ZIPPER (BROWN PAPER):
TABLE 16 PAPER & PAPERBOARD PRODUCTION AND CONSUMPTION IN KUWAIT (2019) (IN MILLION METRIC TONS)-
TABLE 17 PAPER & PAPERBOARD PRODUCTION AND CONSUMPTION IN SAUDI ARABIA (2019) (IN MILLION METRIC TONS)-
TABLE 18 PAPER & PAPERBOARD PRODUCTION AND CONSUMPTION IN UAE (2019) (IN MILLION METRIC TONS)-
TABLE 19 PAPER & PAPERBOARD PRODUCTION AND CONSUMPTION IN EGYPT (2019) (IN MILLION METRIC TONS)-
TABLE 20 PAPER & PAPERBOARD PRODUCTION AND CONSUMPTION IN QATAR (2019) (IN MILLION METRIC TONS)-
TABLE 21 PAPER & PAPERBOARD PRODUCTION AND CONSUMPTION IN BAHRAIN (2019) (IN MILLION METRIC TONS)-
TABLE 22 WOOD PULP PRODUCTION & CONSUMPTION IN KUWAIT (2019) (IN MILLION METRIC TONS)-
TABLE 23 WOOD PULP PRODUCTION & CONSUMPTION IN SAUDI ARABIA (2019) (IN MILLION METRIC TONS)-
TABLE 24 WOOD PULP PRODUCTION & CONSUMPTION IN UAE (2019) (IN MILLION METRIC TONS)-
TABLE 25 WOOD PULP PRODUCTION & CONSUMPTION IN EGYPT (2019) (IN MILLION METRIC TONS)-
TABLE 26 WOOD PULP PRODUCTION & CONSUMPTION IN BAHRAIN (2019) (IN MILLION METRIC TONS)-
TABLE 27 MIDDLE EAST AND AFRICA PAPER BAGS MARKET, BY PRODUCT, 2020-2029 (USD MILLION)
TABLE 28 MIDDLE EAST AND AFRICA PAPER BAGS MARKET, BY PRODUCT, 2020-2029 (MILLION UNITS)
TABLE 29 MIDDLE EAST AND AFRICA OPEN MOUTH IN PAPER BAGS MARKET, BY MATERIAL, 2020-2029 (USD MILLION)
TABLE 30 MIDDLE EAST AND AFRICA BROWN KRAFT IN PAPER BAGS MARKET, BY MATERIAL, 2020-2029 (USD MILLION)
TABLE 31 MIDDLE EAST AND AFRICA WHITE KRAFT IN PAPER BAGS MARKET, BY MATERIAL, 2020-2029 (USD MILLION)
TABLE 32 MIDDLE EAST AND AFRICA OPEN MOUTH IN PAPER BAGS MARKET, BY MATERIAL, 2020-2029 (USD MILLION)
TABLE 33 MIDDLE EAST AND AFRICA BROWN KRAFT IN PAPER BAGS MARKET, BY MATERIAL, 2020-2029 (USD MILLION)
TABLE 34 MIDDLE EAST AND AFRICA WHITE KRAFT IN PAPER BAGS MARKET, BY MATERIAL, 2020-2029 (USD MILLION)
TABLE 35 MIDDLE EAST AND AFRICA FLAT PAPER BAG IN PAPER BAGS MARKET, BY MATERIAL, 2020-2029 (USD MILLION)
TABLE 36 MIDDLE EAST AND AFRICA BROWN KRAFT IN PAPER BAGS MARKET, BY MATERIAL, 2020-2029 (USD MILLION)
TABLE 37 MIDDLE EAST AND AFRICA WHITE KRAFT IN PAPER BAGS MARKET, BY MATERIAL, 2020-2029 (USD MILLION)
TABLE 38 MIDDLE EAST AND AFRICA STAND-UP POUCH IN PAPER BAGS MARKET, BY TYPE, 2020-2029 (USD MILLION)
TABLE 39 MIDDLE EAST AND AFRICA STAND-UP POUCH IN PAPER BAGS MARKET, BY MATERIAL, 2020-2029 (USD MILLION)
TABLE 40 MIDDLE EAST AND AFRICA BROWN KRAFT IN PAPER BAGS MARKET, BY MATERIAL, 2020-2029 (USD MILLION)
TABLE 41 MIDDLE EAST AND AFRICA WHITE KRAFT IN PAPER BAGS MARKET, BY MATERIAL, 2020-2029 (USD MILLION)
TABLE 42 MIDDLE EAST AND AFRICA SELF-OPENING-STYLE (SOS) BAGS IN PAPER BAGS MARKET, BY TYPE, 2020-2029 (USD MILLION)
TABLE 43 MIDDLE EAST AND AFRICA SELF-OPENING-STYLE (SOS) BAGS IN PAPER BAGS MARKET, BY MATERIAL, 2020-2029 (USD MILLION)
TABLE 44 MIDDLE EAST AND AFRICA BROWN KRAFT IN PAPER BAGS MARKET, BY MATERIAL, 2020-2029 (USD MILLION)
TABLE 45 MIDDLE EAST AND AFRICA WHITE KRAFT IN PAPER BAGS MARKET, BY MATERIAL, 2020-2029 (USD MILLION)
TABLE 46 MIDDLE EAST AND AFRICA MULTI-WALL PAPER SACKS IN PAPER BAGS MARKET, BY MATERIAL, 2020-2029 (USD MILLION)
TABLE 47 MIDDLE EAST AND AFRICA BROWN KRAFT IN PAPER BAGS MARKET, BY MATERIAL, 2020-2029 (USD MILLION)
TABLE 48 MIDDLE EAST AND AFRICA WHITE KRAFT IN PAPER BAGS MARKET, BY MATERIAL, 2020-2029 (USD MILLION)
TABLE 49 MIDDLE EAST AND AFRICA LOCK PAPER BAG IN PAPER BAGS MARKET, BY MATERIAL, 2020-2029 (USD MILLION)
TABLE 50 MIDDLE EAST AND AFRICA BROWN KRAFT IN PAPER BAGS MARKET, BY MATERIAL, 2020-2029 (USD MILLION)
TABLE 51 MIDDLE EAST AND AFRICA WHITE KRAFT IN PAPER BAGS MARKET, BY MATERIAL, 2020-2029 (USD MILLION)
TABLE 52 MIDDLE EAST AND AFRICA OTHERS IN PAPER BAGS MARKET, BY MATERIAL, 2020-2029 (USD MILLION)
TABLE 53 MIDDLE EAST AND AFRICA BROWN KRAFT IN PAPER BAGS MARKET, BY MATERIAL, 2020-2029 (USD MILLION)
TABLE 54 MIDDLE EAST AND AFRICA WHITE KRAFT IN PAPER BAGS MARKET, BY MATERIAL, 2020-2029 (USD MILLION)
TABLE 55 MIDDLE EAST AND AFRICA PAPER BAGS MARKET, BY USAGE, 2020-2029 (USD MILLION)
TABLE 56 MIDDLE EAST AND AFRICA PAPER BAGS MARKET, BY USAGE, 2020-2029 (MILLION UNITS)
TABLE 57 MIDDLE EAST AND AFRICA PAPER BAGS MARKET, BY CAPACITY, 2020-2029 (USD MILLION)
TABLE 58 MIDDLE EAST AND AFRICA PAPER BAGS MARKET, BY CAPACITY, 2020-2029 (MILLION UNITS)
TABLE 59 MIDDLE EAST AND AFRICA PAPER BAGS MARKET, BY SIZE, 2020-2029 (USD MILLION)
TABLE 60 MIDDLE EAST AND AFRICA PAPER BAGS MARKET, BY SIZE, 2020-2029 (MILLION UNITS)
TABLE 61 MIDDLE EAST AND AFRICA PAPER BAGS MARKET, BY SEALING AND HANDLING, 2020-2029 (USD MILLION)
TABLE 62 MIDDLE EAST AND AFRICA PAPER BAGS MARKET, BY SEALING AND HANDLING, 2020-2029 (MILLION UNITS)
TABLE 63 MIDDLE EAST AND AFRICA PAPER BAGS MARKET, BY SHAPE, 2020-2029 (USD MILLION)
TABLE 64 MIDDLE EAST AND AFRICA PAPER BAGS MARKET, BY SHAPE, 2020-2029 (MILLION UNITS)
TABLE 65 MIDDLE EAST AND AFRICA PAPER BAGS MARKET, BY DISTRIBUTION CHANNEL, 2020-2029 (USD MILLION)
TABLE 66 MIDDLE EAST AND AFRICA PAPER BAGS MARKET, BY DISTRIBUTION CHANNEL, 2020-2029 (MILLION UNITS)
TABLE 67 MIDDLE EAST AND AFRICA PAPER BAGS MARKET, BY END-USER, 2020-2029 (USD MILLION)
TABLE 68 MIDDLE EAST AND AFRICA PAPER BAGS MARKET, BY END-USER, 2020-2029 (MILLION UNITS)
TABLE 69 MIDDLE EAST AND AFRICA FOOD & BEVERAGE IN PAPER BAGS MARKET, BY END-USER, 2020-2029 (USD MILLION)
TABLE 70 MIDDLE EAST AND AFRICA BAKERY PRODUCTS IN PAPER BAGS MARKET, BY END-USER, 2020-2029 (USD MILLION)
TABLE 71 MIDDLE EAST AND AFRICA COOKED FOOD IN PAPER BAGS MARKET, BY END-USER, 2020-2029 (USD MILLION)
TABLE 72 MIDDLE EAST AND AFRICA FOOD & BEVERAGE IN PAPER BAGS MARKET, BY PRODUCT, 2020-2029 (USD MILLION)
TABLE 73 MIDDLE EAST AND AFRICA ANIMAL FEED IN PAPER BAGS MARKET, BY END-USER, 2020-2029 (USD MILLION)
TABLE 74 MIDDLE EAST AND AFRICA ANIMAL FEED IN PAPER BAGS MARKET, BY PRODUCT, 2020-2029 (USD MILLION)
TABLE 75 MIDDLE EAST AND AFRICA PHARMACEUTICALS IN PAPER BAGS MARKET, BY PRODUCT, 2020-2029 (USD MILLION)
TABLE 76 MIDDLE EAST AND AFRICA COSMETIC PRODUCTS IN PAPER BAGS MARKET, BY END-USER, 2020-2029 (USD MILLION)
TABLE 77 MIDDLE EAST AND AFRICA COSMETIC PRODUCTS IN PAPER BAGS MARKET, BY PRODUCT, 2020-2029 (USD MILLION)
TABLE 78 MIDDLE EAST AND AFRICA AGRICULTURE IN PAPER BAGS MARKET, BY PRODUCT, 2020-2029 (USD MILLION)
TABLE 79 MIDDLE EAST AND AFRICA CONSTRUCTION IN PAPER BAGS MARKET, BY PRODUCT, 2020-2029 (USD MILLION)
TABLE 80 MIDDLE EAST AND AFRICA CHEMICALS IN PAPER BAGS MARKET, BY PRODUCT, 2020-2029 (USD MILLION)
TABLE 81 MIDDLE EAST AND AFRICA OTHERS IN PAPER BAGS MARKET, BY PRODUCT, 2020-2029 (USD MILLION)
TABLE 82 MIDDLE EAST & AFRICA PAPER BAGS MARKET, BY COUNTRY, 2020-2029 (USD MILLION)
TABLE 83 MIDDLE EAST & AFRICA PAPER BAGS MARKET, BY COUNTRY, 2020-2029 (MILLION UNITS)
TABLE 84 U.A.E. PAPER BAGS MARKET, BY PRODUCT, 2020-2029 (USD MILLION)
TABLE 85 U.A.E. PAPER BAGS MARKET, BY PRODUCT, 2020-2029 (MILLION UNITS)
TABLE 86 U.A.E. OPEN MOUTH IN PAPER BAGS MARKET, BY MATERIAL, 2020-2029 (USD MILLION)
TABLE 87 U.A.E. BROWN KRAFT IN PAPER BAGS MARKET, BY MATERIAL, 2020-2029 (USD MILLION)
TABLE 88 U.A.E. WHITE KRAFT IN PAPER BAGS MARKET, BY MATERIAL, 2020-2029 (USD MILLION)
TABLE 89 U.A.E. PASTED VALVE IN PAPER BAGS MARKET, BY MATERIAL, 2020-2029 (USD MILLION)
TABLE 90 U.A.E. BROWN KRAFT IN PAPER BAGS MARKET, BY MATERIAL, 2020-2029 (USD MILLION)
TABLE 91 U.A.E. WHITE KRAFT IN PAPER BAGS MARKET, BY MATERIAL, 2020-2029 (USD MILLION)
TABLE 92 U.A.E. FLAT PAPER BAG IN PAPER BAGS MARKET, BY MATERIAL, 2020-2029 (USD MILLION)
TABLE 93 U.A.E. BROWN KRAFT IN PAPER BAGS MARKET, BY MATERIAL, 2020-2029 (USD MILLION)
TABLE 94 U.A.E. WHITE KRAFT IN PAPER BAGS MARKET, BY MATERIAL, 2020-2029 (USD MILLION)
TABLE 95 U.A.E. STAND-UP POUCH IN PAPER BAGS MARKET, BY TYPE, 2020-2029 (USD MILLION)
TABLE 96 U.A.E. STAND-UP POUCH IN PAPER BAGS MARKET, BY MATERIAL, 2020-2029 (USD MILLION)
TABLE 97 U.A.E. BROWN KRAFT IN PAPER BAGS MARKET, BY MATERIAL, 2020-2029 (USD MILLION)
TABLE 98 U.A.E. WHITE KRAFT IN PAPER BAGS MARKET, BY MATERIAL, 2020-2029 (USD MILLION)
TABLE 99 U.A.E. SELF-OPENING-STYLE (SOS) BAGS IN PAPER BAGS MARKET, BY TYPE, 2020-2029 (USD MILLION)
TABLE 100 U.A.E. SELF-OPENING-STYLE (SOS) BAGS IN PAPER BAGS MARKET, BY MATERIAL, 2020-2029 (USD MILLION)
TABLE 101 U.A.E. BROWN KRAFT IN PAPER BAGS MARKET, BY MATERIAL, 2020-2029 (USD MILLION)
TABLE 102 U.A.E. WHITE KRAFT IN PAPER BAGS MARKET, BY MATERIAL, 2020-2029 (USD MILLION)
TABLE 103 U.A.E. MULTI-WALL PAPER SACKS IN PAPER BAGS MARKET, BY MATERIAL, 2020-2029 (USD MILLION)
TABLE 104 U.A.E. BROWN KRAFT IN PAPER BAGS MARKET, BY MATERIAL, 2020-2029 (USD MILLION)
TABLE 105 U.A.E. WHITE KRAFT IN PAPER BAGS MARKET, BY MATERIAL, 2020-2029 (USD MILLION)
TABLE 106 U.A.E. LOCK PAPER BAGS IN PAPER BAGS MARKET, BY MATERIAL, 2020-2029 (USD MILLION)
TABLE 107 U.A.E. BROWN KRAFT IN PAPER BAGS MARKET, BY MATERIAL, 2020-2029 (USD MILLION)
TABLE 108 U.A.E. WHITE KRAFT IN PAPER BAGS MARKET, BY MATERIAL, 2020-2029 (USD MILLION)
TABLE 109 U.A.E. OTHERS IN PAPER BAGS MARKET, BY MATERIAL, 2020-2029 (USD MILLION)
TABLE 110 U.A.E. BROWN KRAFT IN PAPER BAGS MARKET, BY MATERIAL, 2020-2029 (USD MILLION)
TABLE 111 U.A.E. WHITE KRAFT IN PAPER BAGS MARKET, BY MATERIAL, 2020-2029 (USD MILLION)
TABLE 112 U.A.E. PAPER BAGS MARKET, BY USAGE, 2020-2029 (USD MILLION)
TABLE 113 U.A.E. PAPER BAGS MARKET, BY USAGE, 2020-2029 (MILLION UNITS)
TABLE 114 U.A.E. PAPER BAGS MARKET, BY CAPACITY, 2020-2029 (USD MILLION)
TABLE 115 U.A.E. PAPER BAGS MARKET, BY CAPACITY, 2020-2029 (MILLION UNITS)
TABLE 116 U.A.E. PAPER BAGS MARKET, BY SIZE, 2020-2029 (USD MILLION)
TABLE 117 U.A.E. PAPER BAGS MARKET, BY SIZE, 2020-2029 (MILLION UNITS)
TABLE 118 U.A.E. PAPER BAGS MARKET, BY SEALING AND HANDLING, 2020-2029 (USD MILLION)
TABLE 119 U.A.E. PAPER BAGS MARKET, BY SEALING AND HANDLING, 2020-2029 (MILLION UNITS)
TABLE 120 U.A.E. PAPER BAGS MARKET, BY SHAPE, 2020-2029 (USD MILLION)
TABLE 121 U.A.E. PAPER BAGS MARKET, BY SHAPE, 2020-2029 (MILLION UNITS)
TABLE 122 U.A.E. PAPER BAGS MARKET, BY DISTRIBUTION CHANNEL, 2020-2029 (USD MILLION)
TABLE 123 U.A.E. PAPER BAGS MARKET, BY DISTRIBUTION CHANNEL, 2020-2029 (MILLION UNITS)
TABLE 124 U.A.E. PAPER BAGS MARKET, BY END-USER, 2020-2029 (USD MILLION)
TABLE 125 U.A.E. PAPER BAGS MARKET, BY END-USER, 2020-2029 (MILLION UNITS)
TABLE 126 U.A.E. FOOD & BEVERAGE IN PAPER BAGS MARKET, BY END-USER, 2020-2029 (USD MILLION)
TABLE 127 U.A.E. BAKERY PRODUCTS IN PAPER BAGS MARKET, BY END-USER, 2020-2029 (USD MILLION)
TABLE 128 U.A.E. COOKED FOOD IN PAPER BAGS MARKET, BY END-USER, 2020-2029 (USD MILLION)
TABLE 129 U.A.E. FOOD & BEVERAGE IN PAPER BAGS MARKET, BY PRODUCT, 2020-2029 (USD MILLION)
TABLE 130 U.A.E. ANIMAL FEED IN PAPER BAGS MARKET, BY END-USER, 2020-2029 (USD MILLION)
TABLE 131 U.A.E. ANIMAL FEED IN PAPER BAGS MARKET, BY PRODUCT, 2020-2029 (USD MILLION)
TABLE 132 U.A.E. PHARMACEUTICALS IN PAPER BAGS MARKET, BY PRODUCT, 2020-2029 (USD MILLION)
TABLE 133 U.A.E. COSMETIC PRODUCTS IN PAPER BAGS MARKET, BY END-USER, 2020-2029 (USD MILLION)
TABLE 134 U.A.E. COSMETIC PRODUCTS IN PAPER BAGS MARKET, BY PRODUCT, 2020-2029 (USD MILLION)
TABLE 135 U.A.E. AGRICULTURE IN PAPER BAGS MARKET, BY PRODUCT, 2020-2029 (USD MILLION)
TABLE 136 U.A.E. CONSTRUCTION IN PAPER BAGS MARKET, BY PRODUCT, 2020-2029 (USD MILLION)
TABLE 137 U.A.E. CHEMICALS IN PAPER BAGS MARKET, BY PRODUCT, 2020-2029 (USD MILLION)
TABLE 138 U.A.E. OTHERS IN PAPER BAGS MARKET, BY PRODUCT, 2020-2029 (USD MILLION)
TABLE 139 SAUDI ARABIA PAPER BAGS MARKET, BY PRODUCT, 2020-2029 (USD MILLION)
TABLE 140 SAUDI ARABIA PAPER BAGS MARKET, BY PRODUCT, 2020-2029 (MILLION UNITS)
TABLE 141 SAUDI ARABIA OPEN MOUTH IN PAPER BAGS MARKET, BY MATERIAL, 2020-2029 (USD MILLION)
TABLE 142 SAUDI ARABIA BROWN KRAFT IN PAPER BAGS MARKET, BY MATERIAL, 2020-2029 (USD MILLION)
TABLE 143 SAUDI ARABIA WHITE KRAFT IN PAPER BAGS MARKET, BY MATERIAL, 2020-2029 (USD MILLION)
TABLE 144 SAUDI ARABIA PASTED VALVE IN PAPER BAGS MARKET, BY MATERIAL, 2020-2029 (USD MILLION)
TABLE 145 SAUDI ARABIA BROWN KRAFT IN PAPER BAGS MARKET, BY MATERIAL, 2020-2029 (USD MILLION)
TABLE 146 SAUDI ARABIA WHITE KRAFT IN PAPER BAGS MARKET, BY MATERIAL, 2020-2029 (USD MILLION)
TABLE 147 SAUDI ARABIA FLAT PAPER BAG IN PAPER BAGS MARKET, BY MATERIAL, 2020-2029 (USD MILLION)
TABLE 148 SAUDI ARABIA BROWN KRAFT IN PAPER BAGS MARKET, BY MATERIAL, 2020-2029 (USD MILLION)
TABLE 149 SAUDI ARABIA WHITE KRAFT IN PAPER BAGS MARKET, BY MATERIAL, 2020-2029 (USD MILLION)
TABLE 150 SAUDI ARABIA STAND-UP POUCH IN PAPER BAGS MARKET, BY TYPE, 2020-2029 (USD MILLION)
TABLE 151 SAUDI ARABIA STAND-UP POUCH IN PAPER BAGS MARKET, BY MATERIAL, 2020-2029 (USD MILLION)
TABLE 152 SAUDI ARABIA BROWN KRAFT IN PAPER BAGS MARKET, BY MATERIAL, 2020-2029 (USD MILLION)
TABLE 153 SAUDI ARABIA WHITE KRAFT IN PAPER BAGS MARKET, BY MATERIAL, 2020-2029 (USD MILLION)
TABLE 154 SAUDI ARABIA SELF-OPENING-STYLE (SOS) BAGS IN PAPER BAGS MARKET, BY TYPE, 2020-2029 (USD MILLION)
TABLE 155 SAUDI ARABIA SELF-OPENING-STYLE (SOS) BAGS IN PAPER BAGS MARKET, BY MATERIAL, 2020-2029 (USD MILLION)
TABLE 156 SAUDI ARABIA BROWN KRAFT IN PAPER BAGS MARKET, BY MATERIAL, 2020-2029 (USD MILLION)
TABLE 157 SAUDI ARABIA WHITE KRAFT IN PAPER BAGS MARKET, BY MATERIAL, 2020-2029 (USD MILLION)
TABLE 158 SAUDI ARABIA MULTI-WALL PAPER SACKS IN PAPER BAGS MARKET, BY MATERIAL, 2020-2029 (USD MILLION)
TABLE 159 SAUDI ARABIA BROWN KRAFT IN PAPER BAGS MARKET, BY MATERIAL, 2020-2029 (USD MILLION)
TABLE 160 SAUDI ARABIA WHITE KRAFT IN PAPER BAGS MARKET, BY MATERIAL, 2020-2029 (USD MILLION)
TABLE 161 SAUDI ARABIA LOCK PAPER BAGS IN PAPER BAGS MARKET, BY MATERIAL, 2020-2029 (USD MILLION)
TABLE 162 SAUDI ARABIA BROWN KRAFT IN PAPER BAGS MARKET, BY MATERIAL, 2020-2029 (USD MILLION)
TABLE 163 SAUDI ARABIA WHITE KRAFT IN PAPER BAGS MARKET, BY MATERIAL, 2020-2029 (USD MILLION)
TABLE 164 SAUDI ARABIA OTHERS IN PAPER BAGS MARKET, BY MATERIAL, 2020-2029 (USD MILLION)
TABLE 165 SAUDI ARABIA BROWN KRAFT IN PAPER BAGS MARKET, BY MATERIAL, 2020-2029 (USD MILLION)
TABLE 166 SAUDI ARABIA WHITE KRAFT IN PAPER BAGS MARKET, BY MATERIAL, 2020-2029 (USD MILLION)
TABLE 167 SAUDI ARABIA PAPER BAGS MARKET, BY USAGE, 2020-2029 (USD MILLION)
TABLE 168 SAUDI ARABIA PAPER BAGS MARKET, BY USAGE, 2020-2029 (MILLION UNITS)
TABLE 169 SAUDI ARABIA PAPER BAGS MARKET, BY CAPACITY, 2020-2029 (USD MILLION)
TABLE 170 SAUDI ARABIA PAPER BAGS MARKET, BY CAPACITY, 2020-2029 (MILLION UNITS)
TABLE 171 SAUDI ARABIA PAPER BAGS MARKET, BY SIZE, 2020-2029 (USD MILLION)
TABLE 172 SAUDI ARABIA PAPER BAGS MARKET, BY SIZE, 2020-2029 (MILLION UNITS)
TABLE 173 SAUDI ARABIA PAPER BAGS MARKET, BY SEALING AND HANDLING, 2020-2029 (USD MILLION)
TABLE 174 SAUDI ARABIA PAPER BAGS MARKET, BY SEALING AND HANDLING, 2020-2029 (MILLION UNITS)
TABLE 175 SAUDI ARABIA PAPER BAGS MARKET, BY SHAPE, 2020-2029 (USD MILLION)
TABLE 176 SAUDI ARABIA PAPER BAGS MARKET, BY SHAPE, 2020-2029 (MILLION UNITS)
TABLE 177 SAUDI ARABIA PAPER BAGS MARKET, BY DISTRIBUTION CHANNEL, 2020-2029 (USD MILLION)
TABLE 178 SAUDI ARABIA PAPER BAGS MARKET, BY DISTRIBUTION CHANNEL, 2020-2029 (MILLION UNITS)
TABLE 179 SAUDI ARABIA PAPER BAGS MARKET, BY END-USER, 2020-2029 (USD MILLION)
TABLE 180 SAUDI ARABIA PAPER BAGS MARKET, BY END-USER, 2020-2029 (MILLION UNITS)
TABLE 181 SAUDI ARABIA FOOD & BEVERAGE IN PAPER BAGS MARKET, BY END-USER, 2020-2029 (USD MILLION)
TABLE 182 SAUDI ARABIA BAKERY PRODUCTS IN PAPER BAGS MARKET, BY END-USER, 2020-2029 (USD MILLION)
TABLE 183 SAUDI ARABIA COOKED FOOD IN PAPER BAGS MARKET, BY END-USER, 2020-2029 (USD MILLION)
TABLE 184 SAUDI ARABIA FOOD & BEVERAGE IN PAPER BAGS MARKET, BY PRODUCT, 2020-2029 (USD MILLION)
TABLE 185 SAUDI ARABIA ANIMAL FEED IN PAPER BAGS MARKET, BY END-USER, 2020-2029 (USD MILLION)
TABLE 186 SAUDI ARABIA ANIMAL FEED IN PAPER BAGS MARKET, BY PRODUCT, 2020-2029 (USD MILLION)
TABLE 187 SAUDI ARABIA PHARMACEUTICALS IN PAPER BAGS MARKET, BY PRODUCT, 2020-2029 (USD MILLION)
TABLE 188 SAUDI ARABIA COSMETIC PRODUCTS IN PAPER BAGS MARKET, BY END-USER, 2020-2029 (USD MILLION)
TABLE 189 SAUDI ARABIA COSMETIC PRODUCTS IN PAPER BAGS MARKET, BY PRODUCT, 2020-2029 (USD MILLION)
TABLE 190 SAUDI ARABIA AGRICULTURE IN PAPER BAGS MARKET, BY PRODUCT, 2020-2029 (USD MILLION)
TABLE 191 SAUDI ARABIA CONSTRUCTION IN PAPER BAGS MARKET, BY PRODUCT, 2020-2029 (USD MILLION)
TABLE 192 SAUDI ARABIA CHEMICALS IN PAPER BAGS MARKET, BY PRODUCT, 2020-2029 (USD MILLION)
TABLE 193 SAUDI ARABIA OTHERS IN PAPER BAGS MARKET, BY PRODUCT, 2020-2029 (USD MILLION)
TABLE 194 SOUTH AFRICA PAPER BAGS MARKET, BY PRODUCT, 2020-2029 (USD MILLION)
TABLE 195 SOUTH AFRICA PAPER BAGS MARKET, BY PRODUCT, 2020-2029 (MILLION UNITS)
TABLE 196 SOUTH AFRICA OPEN MOUTH IN PAPER BAGS MARKET, BY MATERIAL, 2020-2029 (USD MILLION)
TABLE 197 SOUTH AFRICA BROWN KRAFT IN PAPER BAGS MARKET, BY MATERIAL, 2020-2029 (USD MILLION)
TABLE 198 SOUTH AFRICA WHITE KRAFT IN PAPER BAGS MARKET, BY MATERIAL, 2020-2029 (USD MILLION)
TABLE 199 SOUTH AFRICA PASTED VALVE IN PAPER BAGS MARKET, BY MATERIAL, 2020-2029 (USD MILLION)
TABLE 200 SOUTH AFRICA BROWN KRAFT IN PAPER BAGS MARKET, BY MATERIAL, 2020-2029 (USD MILLION)
TABLE 201 SOUTH AFRICA WHITE KRAFT IN PAPER BAGS MARKET, BY MATERIAL, 2020-2029 (USD MILLION)
TABLE 202 SOUTH AFRICA FLAT PAPER BAG IN PAPER BAGS MARKET, BY MATERIAL, 2020-2029 (USD MILLION)
TABLE 203 SOUTH AFRICA BROWN KRAFT IN PAPER BAGS MARKET, BY MATERIAL, 2020-2029 (USD MILLION)
TABLE 204 SOUTH AFRICA WHITE KRAFT IN PAPER BAGS MARKET, BY MATERIAL, 2020-2029 (USD MILLION)
TABLE 205 SOUTH AFRICA STAND-UP POUCH IN PAPER BAGS MARKET, BY TYPE, 2020-2029 (USD MILLION)
TABLE 206 SOUTH AFRICA STAND-UP POUCH IN PAPER BAGS MARKET, BY MATERIAL, 2020-2029 (USD MILLION)
TABLE 207 SOUTH AFRICA BROWN KRAFT IN PAPER BAGS MARKET, BY MATERIAL, 2020-2029 (USD MILLION)
TABLE 208 SOUTH AFRICA WHITE KRAFT IN PAPER BAGS MARKET, BY MATERIAL, 2020-2029 (USD MILLION)
TABLE 209 SOUTH AFRICA SELF-OPENING-STYLE (SOS) BAGS IN PAPER BAGS MARKET, BY TYPE, 2020-2029 (USD MILLION)
TABLE 210 SOUTH AFRICA SELF-OPENING-STYLE (SOS) BAGS IN PAPER BAGS MARKET, BY MATERIAL, 2020-2029 (USD MILLION)
TABLE 211 SOUTH AFRICA BROWN KRAFT IN PAPER BAGS MARKET, BY MATERIAL, 2020-2029 (USD MILLION)
TABLE 212 SOUTH AFRICA WHITE KRAFT IN PAPER BAGS MARKET, BY MATERIAL, 2020-2029 (USD MILLION)
TABLE 213 SOUTH AFRICA MULTI-WALL PAPER SACKS IN PAPER BAGS MARKET, BY MATERIAL, 2020-2029 (USD MILLION)
TABLE 214 SOUTH AFRICA BROWN KRAFT IN PAPER BAGS MARKET, BY MATERIAL, 2020-2029 (USD MILLION)
TABLE 215 SOUTH AFRICA WHITE KRAFT IN PAPER BAGS MARKET, BY MATERIAL, 2020-2029 (USD MILLION)
TABLE 216 SOUTH AFRICA LOCK PAPER BAGS IN PAPER BAGS MARKET, BY MATERIAL, 2020-2029 (USD MILLION)
TABLE 217 SOUTH AFRICA BROWN KRAFT IN PAPER BAGS MARKET, BY MATERIAL, 2020-2029 (USD MILLION)
TABLE 218 SOUTH AFRICA WHITE KRAFT IN PAPER BAGS MARKET, BY MATERIAL, 2020-2029 (USD MILLION)
TABLE 219 SOUTH AFRICA OTHERS IN PAPER BAGS MARKET, BY MATERIAL, 2020-2029 (USD MILLION)
TABLE 220 SOUTH AFRICA BROWN KRAFT IN PAPER BAGS MARKET, BY MATERIAL, 2020-2029 (USD MILLION)
TABLE 221 SOUTH AFRICA WHITE KRAFT IN PAPER BAGS MARKET, BY MATERIAL, 2020-2029 (USD MILLION)
TABLE 222 SOUTH AFRICA PAPER BAGS MARKET, BY USAGE, 2020-2029 (USD MILLION)
TABLE 223 SOUTH AFRICA PAPER BAGS MARKET, BY USAGE, 2020-2029 (MILLION UNITS)
TABLE 224 SOUTH AFRICA PAPER BAGS MARKET, BY CAPACITY, 2020-2029 (USD MILLION)
TABLE 225 SOUTH AFRICA PAPER BAGS MARKET, BY CAPACITY, 2020-2029 (MILLION UNITS)
TABLE 226 SOUTH AFRICA PAPER BAGS MARKET, BY SIZE, 2020-2029 (USD MILLION)
TABLE 227 SOUTH AFRICA PAPER BAGS MARKET, BY SIZE, 2020-2029 (MILLION UNITS)
TABLE 228 SOUTH AFRICA PAPER BAGS MARKET, BY SEALING AND HANDLING, 2020-2029 (USD MILLION)
TABLE 229 SOUTH AFRICA PAPER BAGS MARKET, BY SEALING AND HANDLING, 2020-2029 (MILLION UNITS)
TABLE 230 SOUTH AFRICA PAPER BAGS MARKET, BY SHAPE, 2020-2029 (USD MILLION)
TABLE 231 SOUTH AFRICA PAPER BAGS MARKET, BY SHAPE, 2020-2029 (MILLION UNITS)
TABLE 232 SOUTH AFRICA PAPER BAGS MARKET, BY DISTRIBUTION CHANNEL, 2020-2029 (USD MILLION)
TABLE 233 SOUTH AFRICA PAPER BAGS MARKET, BY DISTRIBUTION CHANNEL, 2020-2029 (MILLION UNITS)
TABLE 234 SOUTH AFRICA PAPER BAGS MARKET, BY END-USER, 2020-2029 (USD MILLION)
TABLE 235 SOUTH AFRICA PAPER BAGS MARKET, BY END-USER, 2020-2029 (MILLION UNITS)
TABLE 236 SOUTH AFRICA FOOD & BEVERAGE IN PAPER BAGS MARKET, BY END-USER, 2020-2029 (USD MILLION)
TABLE 237 SOUTH AFRICA BAKERY PRODUCTS IN PAPER BAGS MARKET, BY END-USER, 2020-2029 (USD MILLION)
TABLE 238 SOUTH AFRICA COOKED FOOD IN PAPER BAGS MARKET, BY END-USER, 2020-2029 (USD MILLION)
TABLE 239 SOUTH AFRICA FOOD & BEVERAGE IN PAPER BAGS MARKET, BY PRODUCT, 2020-2029 (USD MILLION)
TABLE 240 SOUTH AFRICA ANIMAL FEED IN PAPER BAGS MARKET, BY END-USER, 2020-2029 (USD MILLION)
TABLE 241 SOUTH AFRICA ANIMAL FEED IN PAPER BAGS MARKET, BY PRODUCT, 2020-2029 (USD MILLION)
TABLE 242 SOUTH AFRICA PHARMACEUTICALS IN PAPER BAGS MARKET, BY PRODUCT, 2020-2029 (USD MILLION)
TABLE 243 SOUTH AFRICA COSMETIC PRODUCTS IN PAPER BAGS MARKET, BY END-USER, 2020-2029 (USD MILLION)
TABLE 244 SOUTH AFRICA COSMETIC PRODUCTS IN PAPER BAGS MARKET, BY PRODUCT, 2020-2029 (USD MILLION)
TABLE 245 SOUTH AFRICA AGRICULTURE IN PAPER BAGS MARKET, BY PRODUCT, 2020-2029 (USD MILLION)
TABLE 246 SOUTH AFRICA CONSTRUCTION IN PAPER BAGS MARKET, BY PRODUCT, 2020-2029 (USD MILLION)
TABLE 247 SOUTH AFRICA CHEMICALS IN PAPER BAGS MARKET, BY PRODUCT, 2020-2029 (USD MILLION)
TABLE 248 SOUTH AFRICA OTHERS IN PAPER BAGS MARKET, BY PRODUCT, 2020-2029 (USD MILLION)
TABLE 249 ISRAEL PAPER BAGS MARKET, BY PRODUCT, 2020-2029 (USD MILLION)
TABLE 250 ISRAEL PAPER BAGS MARKET, BY PRODUCT, 2020-2029 (MILLION UNITS)
TABLE 251 ISRAEL OPEN MOUTH IN PAPER BAGS MARKET, BY MATERIAL, 2020-2029 (USD MILLION)
TABLE 252 ISRAEL BROWN KRAFT IN PAPER BAGS MARKET, BY MATERIAL, 2020-2029 (USD MILLION)
TABLE 253 ISRAEL WHITE KRAFT IN PAPER BAGS MARKET, BY MATERIAL, 2020-2029 (USD MILLION)
TABLE 254 ISRAEL PASTED VALVE IN PAPER BAGS MARKET, BY MATERIAL, 2020-2029 (USD MILLION)
TABLE 255 ISRAEL BROWN KRAFT IN PAPER BAGS MARKET, BY MATERIAL, 2020-2029 (USD MILLION)
TABLE 256 ISRAEL WHITE KRAFT IN PAPER BAGS MARKET, BY MATERIAL, 2020-2029 (USD MILLION)
TABLE 257 ISRAEL FLAT PAPER BAG IN PAPER BAGS MARKET, BY MATERIAL, 2020-2029 (USD MILLION)
TABLE 258 ISRAEL BROWN KRAFT IN PAPER BAGS MARKET, BY MATERIAL, 2020-2029 (USD MILLION)
TABLE 259 ISRAEL WHITE KRAFT IN PAPER BAGS MARKET, BY MATERIAL, 2020-2029 (USD MILLION)
TABLE 260 ISRAEL STAND-UP POUCH IN PAPER BAGS MARKET, BY TYPE, 2020-2029 (USD MILLION)
TABLE 261 ISRAEL STAND-UP POUCH IN PAPER BAGS MARKET, BY MATERIAL, 2020-2029 (USD MILLION)
TABLE 262 ISRAEL BROWN KRAFT IN PAPER BAGS MARKET, BY MATERIAL, 2020-2029 (USD MILLION)
TABLE 263 ISRAEL WHITE KRAFT IN PAPER BAGS MARKET, BY MATERIAL, 2020-2029 (USD MILLION)
TABLE 264 ISRAEL SELF-OPENING-STYLE (SOS) BAGS IN PAPER BAGS MARKET, BY TYPE, 2020-2029 (USD MILLION)
TABLE 265 ISRAEL SELF-OPENING-STYLE (SOS) BAGS IN PAPER BAGS MARKET, BY MATERIAL, 2020-2029 (USD MILLION)
TABLE 266 ISRAEL BROWN KRAFT IN PAPER BAGS MARKET, BY MATERIAL, 2020-2029 (USD MILLION)
TABLE 267 ISRAEL WHITE KRAFT IN PAPER BAGS MARKET, BY MATERIAL, 2020-2029 (USD MILLION)
TABLE 268 ISRAEL MULTI-WALL PAPER SACKS IN PAPER BAGS MARKET, BY MATERIAL, 2020-2029 (USD MILLION)
TABLE 269 ISRAEL BROWN KRAFT IN PAPER BAGS MARKET, BY MATERIAL, 2020-2029 (USD MILLION)
TABLE 270 ISRAEL WHITE KRAFT IN PAPER BAGS MARKET, BY MATERIAL, 2020-2029 (USD MILLION)
TABLE 271 ISRAEL LOCK PAPER BAGS IN PAPER BAGS MARKET, BY MATERIAL, 2020-2029 (USD MILLION)
TABLE 272 ISRAEL BROWN KRAFT IN PAPER BAGS MARKET, BY MATERIAL, 2020-2029 (USD MILLION)
TABLE 273 ISRAEL WHITE KRAFT IN PAPER BAGS MARKET, BY MATERIAL, 2020-2029 (USD MILLION)
TABLE 274 ISRAEL OTHERS IN PAPER BAGS MARKET, BY MATERIAL, 2020-2029 (USD MILLION)
TABLE 275 ISRAEL BROWN KRAFT IN PAPER BAGS MARKET, BY MATERIAL, 2020-2029 (USD MILLION)
TABLE 276 ISRAEL WHITE KRAFT IN PAPER BAGS MARKET, BY MATERIAL, 2020-2029 (USD MILLION)
TABLE 277 ISRAEL PAPER BAGS MARKET, BY USAGE, 2020-2029 (USD MILLION)
TABLE 278 ISRAEL PAPER BAGS MARKET, BY USAGE, 2020-2029 (MILLION UNITS)
TABLE 279 ISRAEL PAPER BAGS MARKET, BY CAPACITY, 2020-2029 (USD MILLION)
TABLE 280 ISRAEL PAPER BAGS MARKET, BY CAPACITY, 2020-2029 (MILLION UNITS)
TABLE 281 ISRAEL PAPER BAGS MARKET, BY SIZE, 2020-2029 (USD MILLION)
TABLE 282 ISRAEL PAPER BAGS MARKET, BY SIZE, 2020-2029 (MILLION UNITS)
TABLE 283 ISRAEL PAPER BAGS MARKET, BY SEALING AND HANDLING, 2020-2029 (USD MILLION)
TABLE 284 ISRAEL PAPER BAGS MARKET, BY SEALING AND HANDLING, 2020-2029 (MILLION UNITS)
TABLE 285 ISRAEL PAPER BAGS MARKET, BY SHAPE, 2020-2029 (USD MILLION)
TABLE 286 ISRAEL PAPER BAGS MARKET, BY SHAPE, 2020-2029 (MILLION UNITS)
TABLE 287 ISRAEL PAPER BAGS MARKET, BY DISTRIBUTION CHANNEL, 2020-2029 (USD MILLION)
TABLE 288 ISRAEL PAPER BAGS MARKET, BY DISTRIBUTION CHANNEL, 2020-2029 (MILLION UNITS)
TABLE 289 ISRAEL PAPER BAGS MARKET, BY END-USER, 2020-2029 (USD MILLION)
TABLE 290 ISRAEL PAPER BAGS MARKET, BY END-USER, 2020-2029 (MILLION UNITS)
TABLE 291 ISRAEL FOOD & BEVERAGE IN PAPER BAGS MARKET, BY END-USER, 2020-2029 (USD MILLION)
TABLE 292 ISRAEL BAKERY PRODUCTS IN PAPER BAGS MARKET, BY END-USER, 2020-2029 (USD MILLION)
TABLE 293 ISRAEL COOKED FOOD IN PAPER BAGS MARKET, BY END-USER, 2020-2029 (USD MILLION)
TABLE 294 ISRAEL FOOD & BEVERAGE IN PAPER BAGS MARKET, BY PRODUCT, 2020-2029 (USD MILLION)
TABLE 295 ISRAEL ANIMAL FEED IN PAPER BAGS MARKET, BY END-USER, 2020-2029 (USD MILLION)
TABLE 296 ISRAEL ANIMAL FEED IN PAPER BAGS MARKET, BY PRODUCT, 2020-2029 (USD MILLION)
TABLE 297 ISRAEL PHARMACEUTICALS IN PAPER BAGS MARKET, BY PRODUCT, 2020-2029 (USD MILLION)
TABLE 298 ISRAEL COSMETIC PRODUCTS IN PAPER BAGS MARKET, BY END-USER, 2020-2029 (USD MILLION)
TABLE 299 ISRAEL COSMETIC PRODUCTS IN PAPER BAGS MARKET, BY PRODUCT, 2020-2029 (USD MILLION)
TABLE 300 ISRAEL AGRICULTURE IN PAPER BAGS MARKET, BY PRODUCT, 2020-2029 (USD MILLION)
TABLE 301 ISRAEL CONSTRUCTION IN PAPER BAGS MARKET, BY PRODUCT, 2020-2029 (USD MILLION)
TABLE 302 ISRAEL CHEMICALS IN PAPER BAGS MARKET, BY PRODUCT, 2020-2029 (USD MILLION)
TABLE 303 ISRAEL OTHERS IN PAPER BAGS MARKET, BY PRODUCT, 2020-2029 (USD MILLION)
TABLE 304 KUWAIT PAPER BAGS MARKET, BY PRODUCT, 2020-2029 (USD MILLION)
TABLE 305 KUWAIT PAPER BAGS MARKET, BY PRODUCT, 2020-2029 (MILLION UNITS)
TABLE 306 KUWAIT OPEN MOUTH IN PAPER BAGS MARKET, BY MATERIAL, 2020-2029 (USD MILLION)
TABLE 307 KUWAIT BROWN KRAFT IN PAPER BAGS MARKET, BY MATERIAL, 2020-2029 (USD MILLION)
TABLE 308 KUWAIT WHITE KRAFT IN PAPER BAGS MARKET, BY MATERIAL, 2020-2029 (USD MILLION)
TABLE 309 KUWAIT PASTED VALVE IN PAPER BAGS MARKET, BY MATERIAL, 2020-2029 (USD MILLION)
TABLE 310 KUWAIT BROWN KRAFT IN PAPER BAGS MARKET, BY MATERIAL, 2020-2029 (USD MILLION)
TABLE 311 KUWAIT WHITE KRAFT IN PAPER BAGS MARKET, BY MATERIAL, 2020-2029 (USD MILLION)
TABLE 312 KUWAIT FLAT PAPER BAG IN PAPER BAGS MARKET, BY MATERIAL, 2020-2029 (USD MILLION)
TABLE 313 KUWAIT BROWN KRAFT IN PAPER BAGS MARKET, BY MATERIAL, 2020-2029 (USD MILLION)
TABLE 314 KUWAIT WHITE KRAFT IN PAPER BAGS MARKET, BY MATERIAL, 2020-2029 (USD MILLION)
TABLE 315 KUWAIT STAND-UP POUCH IN PAPER BAGS MARKET, BY TYPE, 2020-2029 (USD MILLION)
TABLE 316 KUWAIT STAND-UP POUCH IN PAPER BAGS MARKET, BY MATERIAL, 2020-2029 (USD MILLION)
TABLE 317 KUWAIT BROWN KRAFT IN PAPER BAGS MARKET, BY MATERIAL, 2020-2029 (USD MILLION)
TABLE 318 KUWAIT WHITE KRAFT IN PAPER BAGS MARKET, BY MATERIAL, 2020-2029 (USD MILLION)
TABLE 319 KUWAIT SELF-OPENING-STYLE (SOS) BAGS IN PAPER BAGS MARKET, BY TYPE, 2020-2029 (USD MILLION)
TABLE 320 KUWAIT SELF-OPENING-STYLE (SOS) BAGS IN PAPER BAGS MARKET, BY MATERIAL, 2020-2029 (USD MILLION)
TABLE 321 KUWAIT BROWN KRAFT IN PAPER BAGS MARKET, BY MATERIAL, 2020-2029 (USD MILLION)
TABLE 322 KUWAIT WHITE KRAFT IN PAPER BAGS MARKET, BY MATERIAL, 2020-2029 (USD MILLION)
TABLE 323 KUWAIT MULTI-WALL PAPER SACKS IN PAPER BAGS MARKET, BY MATERIAL, 2020-2029 (USD MILLION)
TABLE 324 KUWAIT BROWN KRAFT IN PAPER BAGS MARKET, BY MATERIAL, 2020-2029 (USD MILLION)
TABLE 325 KUWAIT WHITE KRAFT IN PAPER BAGS MARKET, BY MATERIAL, 2020-2029 (USD MILLION)
TABLE 326 KUWAIT LOCK PAPER BAGS IN PAPER BAGS MARKET, BY MATERIAL, 2020-2029 (USD MILLION)
TABLE 327 KUWAIT BROWN KRAFT IN PAPER BAGS MARKET, BY MATERIAL, 2020-2029 (USD MILLION)
TABLE 328 KUWAIT WHITE KRAFT IN PAPER BAGS MARKET, BY MATERIAL, 2020-2029 (USD MILLION)
TABLE 329 KUWAIT OTHERS IN PAPER BAGS MARKET, BY MATERIAL, 2020-2029 (USD MILLION)
TABLE 330 KUWAIT BROWN KRAFT IN PAPER BAGS MARKET, BY MATERIAL, 2020-2029 (USD MILLION)
TABLE 331 KUWAIT WHITE KRAFT IN PAPER BAGS MARKET, BY MATERIAL, 2020-2029 (USD MILLION)
TABLE 332 KUWAIT PAPER BAGS MARKET, BY USAGE, 2020-2029 (USD MILLION)
TABLE 333 KUWAIT PAPER BAGS MARKET, BY USAGE, 2020-2029 (MILLION UNITS)
TABLE 334 KUWAIT PAPER BAGS MARKET, BY CAPACITY, 2020-2029 (USD MILLION)
TABLE 335 KUWAIT PAPER BAGS MARKET, BY CAPACITY, 2020-2029 (MILLION UNITS)
TABLE 336 KUWAIT PAPER BAGS MARKET, BY SIZE, 2020-2029 (USD MILLION)
TABLE 337 KUWAIT PAPER BAGS MARKET, BY SIZE, 2020-2029 (MILLION UNITS)
TABLE 338 KUWAIT PAPER BAGS MARKET, BY SEALING AND HANDLING, 2020-2029 (USD MILLION)
TABLE 339 KUWAIT PAPER BAGS MARKET, BY SEALING AND HANDLING, 2020-2029 (MILLION UNITS)
TABLE 340 KUWAIT PAPER BAGS MARKET, BY SHAPE, 2020-2029 (USD MILLION)
TABLE 341 KUWAIT PAPER BAGS MARKET, BY SHAPE, 2020-2029 (MILLION UNITS)
TABLE 342 KUWAIT PAPER BAGS MARKET, BY DISTRIBUTION CHANNEL, 2020-2029 (USD MILLION)
TABLE 343 KUWAIT PAPER BAGS MARKET, BY DISTRIBUTION CHANNEL, 2020-2029 (MILLION UNITS)
TABLE 344 KUWAIT PAPER BAGS MARKET, BY END-USER, 2020-2029 (USD MILLION)
TABLE 345 KUWAIT PAPER BAGS MARKET, BY END-USER, 2020-2029 (MILLION UNITS)
TABLE 346 KUWAIT FOOD & BEVERAGE IN PAPER BAGS MARKET, BY END-USER, 2020-2029 (USD MILLION)
TABLE 347 KUWAIT BAKERY PRODUCTS IN PAPER BAGS MARKET, BY END-USER, 2020-2029 (USD MILLION)
TABLE 348 KUWAIT COOKED FOOD IN PAPER BAGS MARKET, BY END-USER, 2020-2029 (USD MILLION)
TABLE 349 KUWAIT FOOD & BEVERAGE IN PAPER BAGS MARKET, BY PRODUCT, 2020-2029 (USD MILLION)
TABLE 350 KUWAIT ANIMAL FEED IN PAPER BAGS MARKET, BY END-USER, 2020-2029 (USD MILLION)
TABLE 351 KUWAIT ANIMAL FEED IN PAPER BAGS MARKET, BY PRODUCT, 2020-2029 (USD MILLION)
TABLE 352 KUWAIT PHARMACEUTICALS IN PAPER BAGS MARKET, BY PRODUCT, 2020-2029 (USD MILLION)
TABLE 353 KUWAIT COSMETIC PRODUCTS IN PAPER BAGS MARKET, BY END-USER, 2020-2029 (USD MILLION)
TABLE 354 KUWAIT COSMETIC PRODUCTS IN PAPER BAGS MARKET, BY PRODUCT, 2020-2029 (USD MILLION)
TABLE 355 KUWAIT AGRICULTURE IN PAPER BAGS MARKET, BY PRODUCT, 2020-2029 (USD MILLION)
TABLE 356 KUWAIT CONSTRUCTION IN PAPER BAGS MARKET, BY PRODUCT, 2020-2029 (USD MILLION)
TABLE 357 KUWAIT CHEMICALS IN PAPER BAGS MARKET, BY PRODUCT, 2020-2029 (USD MILLION)
TABLE 358 KUWAIT OTHERS IN PAPER BAGS MARKET, BY PRODUCT, 2020-2029 (USD MILLION)
TABLE 359 EGYPT PAPER BAGS MARKET, BY PRODUCT, 2020-2029 (USD MILLION)
TABLE 360 EGYPT PAPER BAGS MARKET, BY PRODUCT, 2020-2029 (MILLION UNITS)
TABLE 361 EGYPT OPEN MOUTH IN PAPER BAGS MARKET, BY MATERIAL, 2020-2029 (USD MILLION)
TABLE 362 EGYPT BROWN KRAFT IN PAPER BAGS MARKET, BY MATERIAL, 2020-2029 (USD MILLION)
TABLE 363 EGYPT WHITE KRAFT IN PAPER BAGS MARKET, BY MATERIAL, 2020-2029 (USD MILLION)
TABLE 364 EGYPT PASTED VALVE IN PAPER BAGS MARKET, BY MATERIAL, 2020-2029 (USD MILLION)
TABLE 365 EGYPT BROWN KRAFT IN PAPER BAGS MARKET, BY MATERIAL, 2020-2029 (USD MILLION)
TABLE 366 EGYPT WHITE KRAFT IN PAPER BAGS MARKET, BY MATERIAL, 2020-2029 (USD MILLION)
TABLE 367 EGYPT FLAT PAPER BAG IN PAPER BAGS MARKET, BY MATERIAL, 2020-2029 (USD MILLION)
TABLE 368 EGYPT BROWN KRAFT IN PAPER BAGS MARKET, BY MATERIAL, 2020-2029 (USD MILLION)
TABLE 369 EGYPT WHITE KRAFT IN PAPER BAGS MARKET, BY MATERIAL, 2020-2029 (USD MILLION)
TABLE 370 EGYPT STAND-UP POUCH IN PAPER BAGS MARKET, BY TYPE, 2020-2029 (USD MILLION)
TABLE 371 EGYPT STAND-UP POUCH IN PAPER BAGS MARKET, BY MATERIAL, 2020-2029 (USD MILLION)
TABLE 372 EGYPT BROWN KRAFT IN PAPER BAGS MARKET, BY MATERIAL, 2020-2029 (USD MILLION)
TABLE 373 EGYPT WHITE KRAFT IN PAPER BAGS MARKET, BY MATERIAL, 2020-2029 (USD MILLION)
TABLE 374 EGYPT SELF-OPENING-STYLE (SOS) BAGS IN PAPER BAGS MARKET, BY TYPE, 2020-2029 (USD MILLION)
TABLE 375 EGYPT SELF-OPENING-STYLE (SOS) BAGS IN PAPER BAGS MARKET, BY MATERIAL, 2020-2029 (USD MILLION)
TABLE 376 EGYPT BROWN KRAFT IN PAPER BAGS MARKET, BY MATERIAL, 2020-2029 (USD MILLION)
TABLE 377 EGYPT WHITE KRAFT IN PAPER BAGS MARKET, BY MATERIAL, 2020-2029 (USD MILLION)
TABLE 378 EGYPT MULTI-WALL PAPER SACKS IN PAPER BAGS MARKET, BY MATERIAL, 2020-2029 (USD MILLION)
TABLE 379 EGYPT BROWN KRAFT IN PAPER BAGS MARKET, BY MATERIAL, 2020-2029 (USD MILLION)
TABLE 380 EGYPT WHITE KRAFT IN PAPER BAGS MARKET, BY MATERIAL, 2020-2029 (USD MILLION)
TABLE 381 EGYPT LOCK PAPER BAGS IN PAPER BAGS MARKET, BY MATERIAL, 2020-2029 (USD MILLION)
TABLE 382 EGYPT BROWN KRAFT IN PAPER BAGS MARKET, BY MATERIAL, 2020-2029 (USD MILLION)
TABLE 383 EGYPT WHITE KRAFT IN PAPER BAGS MARKET, BY MATERIAL, 2020-2029 (USD MILLION)
TABLE 384 EGYPT OTHERS IN PAPER BAGS MARKET, BY MATERIAL, 2020-2029 (USD MILLION)
TABLE 385 EGYPT BROWN KRAFT IN PAPER BAGS MARKET, BY MATERIAL, 2020-2029 (USD MILLION)
TABLE 386 EGYPT WHITE KRAFT IN PAPER BAGS MARKET, BY MATERIAL, 2020-2029 (USD MILLION)
TABLE 387 EGYPT PAPER BAGS MARKET, BY USAGE, 2020-2029 (USD MILLION)
TABLE 388 EGYPT PAPER BAGS MARKET, BY USAGE, 2020-2029 (MILLION UNITS)
TABLE 389 EGYPT PAPER BAGS MARKET, BY CAPACITY, 2020-2029 (USD MILLION)
TABLE 390 EGYPT PAPER BAGS MARKET, BY CAPACITY, 2020-2029 (MILLION UNITS)
TABLE 391 EGYPT PAPER BAGS MARKET, BY SIZE, 2020-2029 (USD MILLION)
TABLE 392 EGYPT PAPER BAGS MARKET, BY SIZE, 2020-2029 (MILLION UNITS)
TABLE 393 EGYPT PAPER BAGS MARKET, BY SEALING AND HANDLING, 2020-2029 (USD MILLION)
TABLE 394 EGYPT PAPER BAGS MARKET, BY SEALING AND HANDLING, 2020-2029 (MILLION UNITS)
TABLE 395 EGYPT PAPER BAGS MARKET, BY SHAPE, 2020-2029 (USD MILLION)
TABLE 396 EGYPT PAPER BAGS MARKET, BY SHAPE, 2020-2029 (MILLION UNITS)
TABLE 397 EGYPT PAPER BAGS MARKET, BY DISTRIBUTION CHANNEL, 2020-2029 (USD MILLION)
TABLE 398 EGYPT PAPER BAGS MARKET, BY DISTRIBUTION CHANNEL, 2020-2029 (MILLION UNITS)
TABLE 399 EGYPT PAPER BAGS MARKET, BY END-USER, 2020-2029 (USD MILLION)
TABLE 400 EGYPT PAPER BAGS MARKET, BY END-USER, 2020-2029 (MILLION UNITS)
TABLE 401 EGYPT FOOD & BEVERAGE IN PAPER BAGS MARKET, BY END-USER, 2020-2029 (USD MILLION)
TABLE 402 EGYPT BAKERY PRODUCTS IN PAPER BAGS MARKET, BY END-USER, 2020-2029 (USD MILLION)
TABLE 403 EGYPT COOKED FOOD IN PAPER BAGS MARKET, BY END-USER, 2020-2029 (USD MILLION)
TABLE 404 EGYPT FOOD & BEVERAGE IN PAPER BAGS MARKET, BY PRODUCT, 2020-2029 (USD MILLION)
TABLE 405 EGYPT ANIMAL FEED IN PAPER BAGS MARKET, BY END-USER, 2020-2029 (USD MILLION)
TABLE 406 EGYPT ANIMAL FEED IN PAPER BAGS MARKET, BY PRODUCT, 2020-2029 (USD MILLION)
TABLE 407 EGYPT PHARMACEUTICALS IN PAPER BAGS MARKET, BY PRODUCT, 2020-2029 (USD MILLION)
TABLE 408 EGYPT COSMETIC PRODUCTS IN PAPER BAGS MARKET, BY END-USER, 2020-2029 (USD MILLION)
TABLE 409 EGYPT COSMETIC PRODUCTS IN PAPER BAGS MARKET, BY PRODUCT, 2020-2029 (USD MILLION)
TABLE 410 EGYPT AGRICULTURE IN PAPER BAGS MARKET, BY PRODUCT, 2020-2029 (USD MILLION)
TABLE 411 EGYPT CONSTRUCTION IN PAPER BAGS MARKET, BY PRODUCT, 2020-2029 (USD MILLION)
TABLE 412 EGYPT CHEMICALS IN PAPER BAGS MARKET, BY PRODUCT, 2020-2029 (USD MILLION)
TABLE 413 EGYPT OTHERS IN PAPER BAGS MARKET, BY PRODUCT, 2020-2029 (USD MILLION)
TABLE 414 IRAN PAPER BAGS MARKET, BY PRODUCT, 2020-2029 (USD MILLION)
TABLE 415 IRAN PAPER BAGS MARKET, BY PRODUCT, 2020-2029 (MILLION UNITS)
TABLE 416 IRAN OPEN MOUTH IN PAPER BAGS MARKET, BY MATERIAL, 2020-2029 (USD MILLION)
TABLE 417 IRAN BROWN KRAFT IN PAPER BAGS MARKET, BY MATERIAL, 2020-2029 (USD MILLION)
TABLE 418 IRAN WHITE KRAFT IN PAPER BAGS MARKET, BY MATERIAL, 2020-2029 (USD MILLION)
TABLE 419 IRAN PASTED VALVE IN PAPER BAGS MARKET, BY MATERIAL, 2020-2029 (USD MILLION)
TABLE 420 IRAN BROWN KRAFT IN PAPER BAGS MARKET, BY MATERIAL, 2020-2029 (USD MILLION)
TABLE 421 IRAN WHITE KRAFT IN PAPER BAGS MARKET, BY MATERIAL, 2020-2029 (USD MILLION)
TABLE 422 IRAN FLAT PAPER BAG IN PAPER BAGS MARKET, BY MATERIAL, 2020-2029 (USD MILLION)
TABLE 423 IRAN BROWN KRAFT IN PAPER BAGS MARKET, BY MATERIAL, 2020-2029 (USD MILLION)
TABLE 424 IRAN WHITE KRAFT IN PAPER BAGS MARKET, BY MATERIAL, 2020-2029 (USD MILLION)
TABLE 425 IRAN STAND-UP POUCH IN PAPER BAGS MARKET, BY TYPE, 2020-2029 (USD MILLION)
TABLE 426 IRAN STAND-UP POUCH IN PAPER BAGS MARKET, BY MATERIAL, 2020-2029 (USD MILLION)
TABLE 427 IRAN BROWN KRAFT IN PAPER BAGS MARKET, BY MATERIAL, 2020-2029 (USD MILLION)
TABLE 428 IRAN WHITE KRAFT IN PAPER BAGS MARKET, BY MATERIAL, 2020-2029 (USD MILLION)
TABLE 429 IRAN SELF-OPENING-STYLE (SOS) BAGS IN PAPER BAGS MARKET, BY TYPE, 2020-2029 (USD MILLION)
TABLE 430 IRAN SELF-OPENING-STYLE (SOS) BAGS IN PAPER BAGS MARKET, BY MATERIAL, 2020-2029 (USD MILLION)
TABLE 431 IRAN BROWN KRAFT IN PAPER BAGS MARKET, BY MATERIAL, 2020-2029 (USD MILLION)
TABLE 432 IRAN WHITE KRAFT IN PAPER BAGS MARKET, BY MATERIAL, 2020-2029 (USD MILLION)
TABLE 433 IRAN MULTI-WALL PAPER SACKS IN PAPER BAGS MARKET, BY MATERIAL, 2020-2029 (USD MILLION)
TABLE 434 IRAN BROWN KRAFT IN PAPER BAGS MARKET, BY MATERIAL, 2020-2029 (USD MILLION)
TABLE 435 IRAN WHITE KRAFT IN PAPER BAGS MARKET, BY MATERIAL, 2020-2029 (USD MILLION)
TABLE 436 IRAN LOCK PAPER BAGS IN PAPER BAGS MARKET, BY MATERIAL, 2020-2029 (USD MILLION)
TABLE 437 IRAN BROWN KRAFT IN PAPER BAGS MARKET, BY MATERIAL, 2020-2029 (USD MILLION)
TABLE 438 IRAN WHITE KRAFT IN PAPER BAGS MARKET, BY MATERIAL, 2020-2029 (USD MILLION)
TABLE 439 IRAN OTHERS IN PAPER BAGS MARKET, BY MATERIAL, 2020-2029 (USD MILLION)
TABLE 440 IRAN BROWN KRAFT IN PAPER BAGS MARKET, BY MATERIAL, 2020-2029 (USD MILLION)
TABLE 441 IRAN WHITE KRAFT IN PAPER BAGS MARKET, BY MATERIAL, 2020-2029 (USD MILLION)
TABLE 442 IRAN PAPER BAGS MARKET, BY USAGE, 2020-2029 (USD MILLION)
TABLE 443 IRAN PAPER BAGS MARKET, BY USAGE, 2020-2029 (MILLION UNITS)
TABLE 444 IRAN PAPER BAGS MARKET, BY CAPACITY, 2020-2029 (USD MILLION)
TABLE 445 IRAN PAPER BAGS MARKET, BY CAPACITY, 2020-2029 (MILLION UNITS)
TABLE 446 IRAN PAPER BAGS MARKET, BY SIZE, 2020-2029 (USD MILLION)
TABLE 447 IRAN PAPER BAGS MARKET, BY SIZE, 2020-2029 (MILLION UNITS)
TABLE 448 IRAN PAPER BAGS MARKET, BY SEALING AND HANDLING, 2020-2029 (USD MILLION)
TABLE 449 IRAN PAPER BAGS MARKET, BY SEALING AND HANDLING, 2020-2029 (MILLION UNITS)
TABLE 450 IRAN PAPER BAGS MARKET, BY SHAPE, 2020-2029 (USD MILLION)
TABLE 451 IRAN PAPER BAGS MARKET, BY SHAPE, 2020-2029 (MILLION UNITS)
TABLE 452 IRAN PAPER BAGS MARKET, BY DISTRIBUTION CHANNEL, 2020-2029 (USD MILLION)
TABLE 453 IRAN PAPER BAGS MARKET, BY DISTRIBUTION CHANNEL, 2020-2029 (MILLION UNITS)
TABLE 454 IRAN PAPER BAGS MARKET, BY END-USER, 2020-2029 (USD MILLION)
TABLE 455 IRAN PAPER BAGS MARKET, BY END-USER, 2020-2029 (MILLION UNITS)
TABLE 456 IRAN FOOD & BEVERAGE IN PAPER BAGS MARKET, BY END-USER, 2020-2029 (USD MILLION)
TABLE 457 IRAN BAKERY PRODUCTS IN PAPER BAGS MARKET, BY END-USER, 2020-2029 (USD MILLION)
TABLE 458 IRAN COOKED FOOD IN PAPER BAGS MARKET, BY END-USER, 2020-2029 (USD MILLION)
TABLE 459 IRAN FOOD & BEVERAGE IN PAPER BAGS MARKET, BY PRODUCT, 2020-2029 (USD MILLION)
TABLE 460 IRAN ANIMAL FEED IN PAPER BAGS MARKET, BY END-USER, 2020-2029 (USD MILLION)
TABLE 461 IRAN ANIMAL FEED IN PAPER BAGS MARKET, BY PRODUCT, 2020-2029 (USD MILLION)
TABLE 462 IRAN PHARMACEUTICALS IN PAPER BAGS MARKET, BY PRODUCT, 2020-2029 (USD MILLION)
TABLE 463 IRAN COSMETIC PRODUCTS IN PAPER BAGS MARKET, BY END-USER, 2020-2029 (USD MILLION)
TABLE 464 IRAN COSMETIC PRODUCTS IN PAPER BAGS MARKET, BY PRODUCT, 2020-2029 (USD MILLION)
TABLE 465 IRAN AGRICULTURE IN PAPER BAGS MARKET, BY PRODUCT, 2020-2029 (USD MILLION)
TABLE 466 IRAN CONSTRUCTION IN PAPER BAGS MARKET, BY PRODUCT, 2020-2029 (USD MILLION)
TABLE 467 IRAN CHEMICALS IN PAPER BAGS MARKET, BY PRODUCT, 2020-2029 (USD MILLION)
TABLE 468 IRAN OTHERS IN PAPER BAGS MARKET, BY PRODUCT, 2020-2029 (USD MILLION)
TABLE 469 ETHIOPIA PAPER BAGS MARKET, BY PRODUCT, 2020-2029 (USD MILLION)
TABLE 470 ETHIOPIA PAPER BAGS MARKET, BY PRODUCT, 2020-2029 (MILLION UNITS)
TABLE 471 ETHIOPIA OPEN MOUTH IN PAPER BAGS MARKET, BY MATERIAL, 2020-2029 (USD MILLION)
TABLE 472 ETHIOPIA BROWN KRAFT IN PAPER BAGS MARKET, BY MATERIAL, 2020-2029 (USD MILLION)
TABLE 473 ETHIOPIA WHITE KRAFT IN PAPER BAGS MARKET, BY MATERIAL, 2020-2029 (USD MILLION)
TABLE 474 ETHIOPIA PASTED VALVE IN PAPER BAGS MARKET, BY MATERIAL, 2020-2029 (USD MILLION)
TABLE 475 ETHIOPIA BROWN KRAFT IN PAPER BAGS MARKET, BY MATERIAL, 2020-2029 (USD MILLION)
TABLE 476 ETHIOPIA WHITE KRAFT IN PAPER BAGS MARKET, BY MATERIAL, 2020-2029 (USD MILLION)
TABLE 477 ETHIOPIA FLAT PAPER BAG IN PAPER BAGS MARKET, BY MATERIAL, 2020-2029 (USD MILLION)
TABLE 478 ETHIOPIA BROWN KRAFT IN PAPER BAGS MARKET, BY MATERIAL, 2020-2029 (USD MILLION)
TABLE 479 ETHIOPIA WHITE KRAFT IN PAPER BAGS MARKET, BY MATERIAL, 2020-2029 (USD MILLION)
TABLE 480 ETHIOPIA STAND-UP POUCH IN PAPER BAGS MARKET, BY TYPE, 2020-2029 (USD MILLION)
TABLE 481 ETHIOPIA STAND-UP POUCH IN PAPER BAGS MARKET, BY MATERIAL, 2020-2029 (USD MILLION)
TABLE 482 ETHIOPIA BROWN KRAFT IN PAPER BAGS MARKET, BY MATERIAL, 2020-2029 (USD MILLION)
TABLE 483 ETHIOPIA WHITE KRAFT IN PAPER BAGS MARKET, BY MATERIAL, 2020-2029 (USD MILLION)
TABLE 484 ETHIOPIA SELF-OPENING-STYLE (SOS) BAGS IN PAPER BAGS MARKET, BY TYPE, 2020-2029 (USD MILLION)
TABLE 485 ETHIOPIA SELF-OPENING-STYLE (SOS) BAGS IN PAPER BAGS MARKET, BY MATERIAL, 2020-2029 (USD MILLION)
TABLE 486 ETHIOPIA BROWN KRAFT IN PAPER BAGS MARKET, BY MATERIAL, 2020-2029 (USD MILLION)
TABLE 487 ETHIOPIA WHITE KRAFT IN PAPER BAGS MARKET, BY MATERIAL, 2020-2029 (USD MILLION)
TABLE 488 ETHIOPIA MULTI-WALL PAPER SACKS IN PAPER BAGS MARKET, BY MATERIAL, 2020-2029 (USD MILLION)
TABLE 489 ETHIOPIA BROWN KRAFT IN PAPER BAGS MARKET, BY MATERIAL, 2020-2029 (USD MILLION)
TABLE 490 ETHIOPIA WHITE KRAFT IN PAPER BAGS MARKET, BY MATERIAL, 2020-2029 (USD MILLION)
TABLE 491 ETHIOPIA LOCK PAPER BAGS IN PAPER BAGS MARKET, BY MATERIAL, 2020-2029 (USD MILLION)
TABLE 492 ETHIOPIA BROWN KRAFT IN PAPER BAGS MARKET, BY MATERIAL, 2020-2029 (USD MILLION)
TABLE 493 ETHIOPIA WHITE KRAFT IN PAPER BAGS MARKET, BY MATERIAL, 2020-2029 (USD MILLION)
TABLE 494 ETHIOPIA OTHERS IN PAPER BAGS MARKET, BY MATERIAL, 2020-2029 (USD MILLION)
TABLE 495 ETHIOPIA BROWN KRAFT IN PAPER BAGS MARKET, BY MATERIAL, 2020-2029 (USD MILLION)
TABLE 496 ETHIOPIA WHITE KRAFT IN PAPER BAGS MARKET, BY MATERIAL, 2020-2029 (USD MILLION)
TABLE 497 ETHIOPIA PAPER BAGS MARKET, BY USAGE, 2020-2029 (USD MILLION)
TABLE 498 ETHIOPIA PAPER BAGS MARKET, BY USAGE, 2020-2029 (MILLION UNITS)
TABLE 499 ETHIOPIA PAPER BAGS MARKET, BY CAPACITY, 2020-2029 (USD MILLION)
TABLE 500 ETHIOPIA PAPER BAGS MARKET, BY CAPACITY, 2020-2029 (MILLION UNITS)
TABLE 501 ETHIOPIA PAPER BAGS MARKET, BY SIZE, 2020-2029 (USD MILLION)
TABLE 502 ETHIOPIA PAPER BAGS MARKET, BY SIZE, 2020-2029 (MILLION UNITS)
TABLE 503 ETHIOPIA PAPER BAGS MARKET, BY SEALING AND HANDLING, 2020-2029 (USD MILLION)
TABLE 504 ETHIOPIA PAPER BAGS MARKET, BY SEALING AND HANDLING, 2020-2029 (MILLION UNITS)
TABLE 505 ETHIOPIA PAPER BAGS MARKET, BY SHAPE, 2020-2029 (USD MILLION)
TABLE 506 ETHIOPIA PAPER BAGS MARKET, BY SHAPE, 2020-2029 (MILLION UNITS)
TABLE 507 ETHIOPIA PAPER BAGS MARKET, BY DISTRIBUTION CHANNEL, 2020-2029 (USD MILLION)
TABLE 508 ETHIOPIA PAPER BAGS MARKET, BY DISTRIBUTION CHANNEL, 2020-2029 (MILLION UNITS)
TABLE 509 ETHIOPIA PAPER BAGS MARKET, BY END-USER, 2020-2029 (USD MILLION)
TABLE 510 ETHIOPIA PAPER BAGS MARKET, BY END-USER, 2020-2029 (MILLION UNITS)
TABLE 511 ETHIOPIA FOOD & BEVERAGE IN PAPER BAGS MARKET, BY END-USER, 2020-2029 (USD MILLION)
TABLE 512 ETHIOPIA BAKERY PRODUCTS IN PAPER BAGS MARKET, BY END-USER, 2020-2029 (USD MILLION)
TABLE 513 ETHIOPIA COOKED FOOD IN PAPER BAGS MARKET, BY END-USER, 2020-2029 (USD MILLION)
TABLE 514 ETHIOPIA FOOD & BEVERAGE IN PAPER BAGS MARKET, BY PRODUCT, 2020-2029 (USD MILLION)
TABLE 515 ETHIOPIA ANIMAL FEED IN PAPER BAGS MARKET, BY END-USER, 2020-2029 (USD MILLION)
TABLE 516 ETHIOPIA ANIMAL FEED IN PAPER BAGS MARKET, BY PRODUCT, 2020-2029 (USD MILLION)
TABLE 517 ETHIOPIA PHARMACEUTICALS IN PAPER BAGS MARKET, BY PRODUCT, 2020-2029 (USD MILLION)
TABLE 518 ETHIOPIA COSMETIC PRODUCTS IN PAPER BAGS MARKET, BY END-USER, 2020-2029 (USD MILLION)
TABLE 519 ETHIOPIA COSMETIC PRODUCTS IN PAPER BAGS MARKET, BY PRODUCT, 2020-2029 (USD MILLION)
TABLE 520 ETHIOPIA AGRICULTURE IN PAPER BAGS MARKET, BY PRODUCT, 2020-2029 (USD MILLION)
TABLE 521 ETHIOPIA CONSTRUCTION IN PAPER BAGS MARKET, BY PRODUCT, 2020-2029 (USD MILLION)
TABLE 522 ETHIOPIA CHEMICALS IN PAPER BAGS MARKET, BY PRODUCT, 2020-2029 (USD MILLION)
TABLE 523 ETHIOPIA OTHERS IN PAPER BAGS MARKET, BY PRODUCT, 2020-2029 (USD MILLION)
TABLE 524 REST OF MIDDLE EAST & AFRICA PAPER BAGS MARKET, BY PRODUCT, 2020-2029 (USD MILLION)
TABLE 525 REST OF MIDDLE EAST & AFRICA PAPER BAGS MARKET, BY PRODUCT, 2020-2029 (MILLION UNITS)
Lista de figuras
FIGURE 1 MIDDLE EAST AND AFRICA PAPER BAGS MARKET: SEGMENTATION
FIGURE 2 MIDDLE EAST AND AFRICA PAPER BAGS MARKET: DATA TRIANGULATION
FIGURE 3 MIDDLE EAST AND AFRICA PAPER BAGS MARKET: DROC ANALYSIS
FIGURE 4 MIDDLE EAST AND AFRICA PAPER BAGS MARKET: REGIONAL VS COUNTRY MARKET ANALYSIS
FIGURE 5 MIDDLE EAST AND AFRICA PAPER BAGS MARKET: COMPANY RESEARCH ANALYSIS
FIGURE 6 MIDDLE EAST AND AFRICA PAPER BAGS MARKET: THE PRODUCT LIFE LINE CURVE
FIGURE 7 MIDDLE EAST AND AFRICA PAPER BAGS MARKET: INTERVIEW DEMOGRAPHICS
FIGURE 8 MIDDLE EAST AND AFRICA PAPER BAGS MARKET: DBMR MARKET POSITION GRID
FIGURE 9 MIDDLE EAST AND AFRICA PAPER BAGS MARKET: MARKET PRODUCT TYPE COVERAGE GRID
FIGURE 10 MIDDLE EAST AND AFRICA PAPER BAGS MARKET: THE MARKET CHALLENGE MATRIX
FIGURE 11 MIDDLE EAST AND AFRICA PAPER BAGS MARKET: VENDOR SHARE ANALYSIS
FIGURE 12 MIDDLE EAST AND AFRICA PAPER BAGS MARKET: SEGMENTATION
FIGURE 13 SURGING DEMAND FOR SUSTAINABLE PAPER BAG PACKAGING IN E-COMMERCE SECTOR IS EXPECTED TO DRIVE THE MIDDLE EAST AND AFRICA PAPER BAGS MARKET IN THE FORECAST PERIOD
FIGURE 14 OPEN MOUTH SEGMENT IS EXPECTED TO ACCOUNT FOR THE LARGEST SHARE OF THE MIDDLE EAST AND AFRICA PAPER BAGS MARKET IN 2022 AND 2029
FIGURE 15 VENDOR SELECTION CRITERIA:
FIGURE 16 PESTEL ANALYSIS
FIGURE 17 DRIVERS, RESTRAINTS, OPPORTUNITIES, AND CHALLENGES OF THE MIDDLE EAST AND AFRICA PAPER BAGS MARKET
FIGURE 18 MIDDLE EAST AND AFRICA PAPER BAGS MARKET: BY PRODUCT, 2021
FIGURE 19 MIDDLE EAST AND AFRICA PAPER BAGS MARKET: BY USAGE, 2021
FIGURE 20 MIDDLE EAST AND AFRICA PAPER BAGS MARKET: BY CAPACITY, 2021
FIGURE 21 MIDDLE EAST AND AFRICA PAPER BAGS MARKET: BY SIZE, 2021
FIGURE 22 MIDDLE EAST AND AFRICA PAPER BAGS MARKET: BY SEALING AND HANDLING, 2021
FIGURE 23 MIDDLE EAST AND AFRICA PAPER BAGS MARKET: BY SHAPE, 2021
FIGURE 24 MIDDLE EAST AND AFRICA PAPER BAGS MARKET: BY DISTRIBUTION CHANNEL, 2021
FIGURE 25 MIDDLE EAST AND AFRICA PAPER BAGS MARKET: BY END-USER, 2021
FIGURE 26 MIDDLE EAST & AFRICA PAPER BAGS MARKET: SNAPSHOT (2021)
FIGURE 27 MIDDLE EAST & AFRICA PAPER BAGS MARKET: BY COUNTRY (2021)
FIGURE 28 MIDDLE EAST & AFRICA PAPER BAGS MARKET: BY COUNTRY (2022 & 2029)
FIGURE 29 MIDDLE EAST & AFRICA PAPER BAGS MARKET: BY COUNTRY (2021 & 2029)
FIGURE 30 MIDDLE EAST & AFRICA PAPER BAGS MARKET: BY PRODUCT (2022-2029)
FIGURE 31 MIDDLE EAST AND AFRICA PAPER BAGS MARKET: COMPANY SHARE 2021 (%)
Metodología de investigación
La recopilación de datos y el análisis del año base se realizan utilizando módulos de recopilación de datos con muestras de gran tamaño. La etapa incluye la obtención de información de mercado o datos relacionados a través de varias fuentes y estrategias. Incluye el examen y la planificación de todos los datos adquiridos del pasado con antelación. Asimismo, abarca el examen de las inconsistencias de información observadas en diferentes fuentes de información. Los datos de mercado se analizan y estiman utilizando modelos estadísticos y coherentes de mercado. Además, el análisis de la participación de mercado y el análisis de tendencias clave son los principales factores de éxito en el informe de mercado. Para obtener más información, solicite una llamada de un analista o envíe su consulta.
La metodología de investigación clave utilizada por el equipo de investigación de DBMR es la triangulación de datos, que implica la extracción de datos, el análisis del impacto de las variables de datos en el mercado y la validación primaria (experto en la industria). Los modelos de datos incluyen cuadrícula de posicionamiento de proveedores, análisis de línea de tiempo de mercado, descripción general y guía del mercado, cuadrícula de posicionamiento de la empresa, análisis de patentes, análisis de precios, análisis de participación de mercado de la empresa, estándares de medición, análisis global versus regional y de participación de proveedores. Para obtener más información sobre la metodología de investigación, envíe una consulta para hablar con nuestros expertos de la industria.
Personalización disponible
Data Bridge Market Research es líder en investigación formativa avanzada. Nos enorgullecemos de brindar servicios a nuestros clientes existentes y nuevos con datos y análisis que coinciden y se adaptan a sus objetivos. El informe se puede personalizar para incluir análisis de tendencias de precios de marcas objetivo, comprensión del mercado de países adicionales (solicite la lista de países), datos de resultados de ensayos clínicos, revisión de literatura, análisis de mercado renovado y base de productos. El análisis de mercado de competidores objetivo se puede analizar desde análisis basados en tecnología hasta estrategias de cartera de mercado. Podemos agregar tantos competidores sobre los que necesite datos en el formato y estilo de datos que esté buscando. Nuestro equipo de analistas también puede proporcionarle datos en archivos de Excel sin procesar, tablas dinámicas (libro de datos) o puede ayudarlo a crear presentaciones a partir de los conjuntos de datos disponibles en el informe.

