
Mercado de pantallas industriales de montaje en panel en Oriente Medio y África, por tecnología (LED, pantalla de cristal líquido (LCD) y OLED), tamaño del panel (14"-21", hasta 14", 22"-40" y 41" y más), resolución (HD, 4K y otros), disponibilidad táctil (táctil y no táctil), aplicación (HMI, monitores industriales de marco abierto, monitoreo remoto e imágenes), usuario final (fabricación, medicina, petróleo y gas, procesamiento de alimentos, transporte, energía y electricidad, y otros), país (Sudáfrica, Arabia Saudita, Emiratos Árabes Unidos, Egipto, Israel, resto de África y resto de Oriente Medio y África) Tendencias de la industria y pronóstico hasta 2028
 Análisis y perspectivas del mercado: mercado de pantallas industriales de montaje en panel en Oriente Medio y África
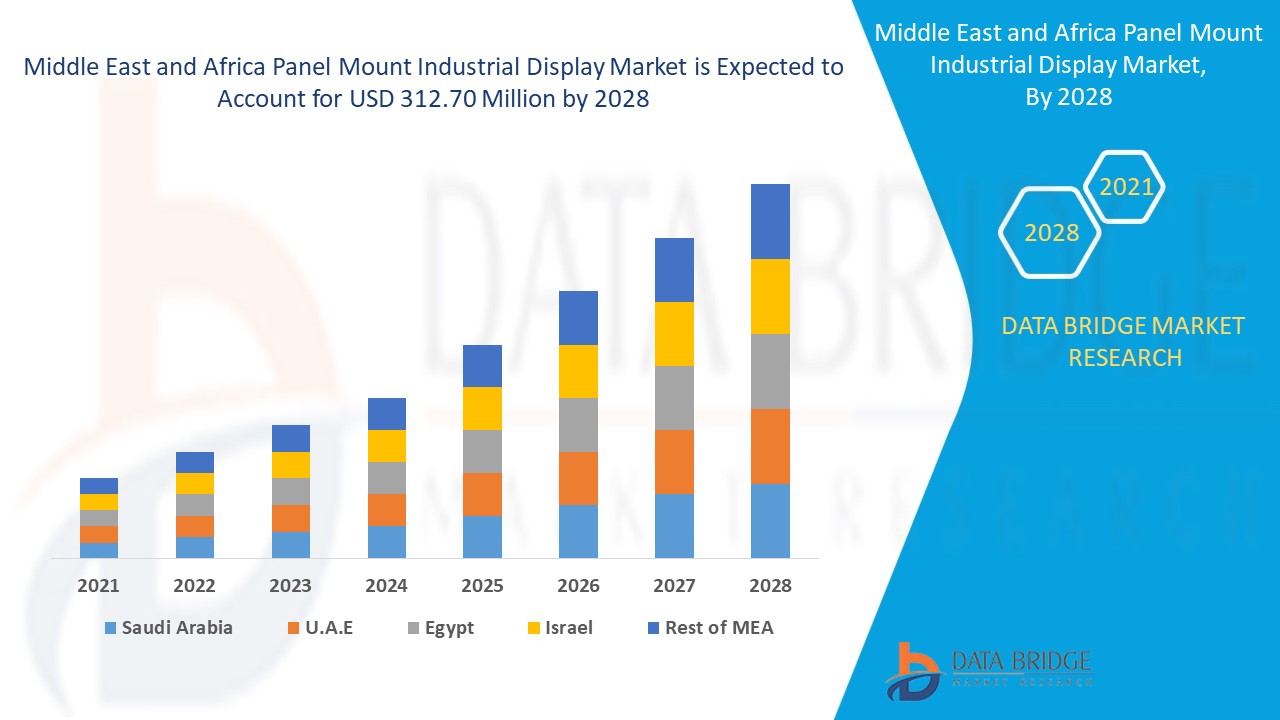
Se espera que el mercado de pantallas industriales de montaje en panel de Oriente Medio y África gane crecimiento de mercado en el período de pronóstico de 2021 a 2028. Data Bridge Market Research analiza que el mercado está creciendo a una CAGR del 8,00% en el período de pronóstico de 2021 a 2028 y se espera que alcance los USD 312,70 millones para 2028.
La pantalla de montaje en panel es un equipo de visualización industrial que puede encajar en una abertura o un orificio y puede montarse en un panel. El tipo de montaje en panel también se puede instalar con un soporte VESA, un soporte trasero o un soporte frontal. El sistema de visualización industrial se utiliza para mostrar la salida digital e incluye diferentes tipos de pantallas TFT, monitores y equipos similares. Las pantallas industriales se utilizan en casi todos los sectores industriales, como el transporte, la fabricación, la medicina y otros. El vidrio templado protector actúa como un escudo para la pantalla industrial para protegerla del polvo y los líquidos. Además, las pantallas pueden utilizar diferentes tecnologías de pantalla táctil y no táctil según el requisito de la aplicación.
Los principales factores que impulsan el crecimiento del mercado de pantallas industriales para montaje en panel son la creciente adopción de Internet de las cosas (IoT) y la creciente demanda de dispositivos de interfaz hombre-máquina (HMI) con múltiples funciones. El creciente número de asociaciones y colaboraciones para aumentar el alcance geográfico de las empresas está impulsando el crecimiento del mercado. El alto costo inicial relacionado con la implementación de pantallas industriales es la principal restricción para el mercado de pantallas industriales para montaje en panel. La complejidad en la implementación de pantallas para todas las condiciones climáticas está actuando como un gran desafío para el crecimiento del mercado.
La región está en pleno desarrollo y varias industrias están adoptando tecnologías más avanzadas. Estas industrias requieren el uso de unidades de visualización para la visualización de datos y registros, lo que aumenta la demanda de pantallas industriales montadas en paneles.
Este informe de mercado de pantallas industriales para montaje en panel proporciona detalles de la participación de mercado, nuevos desarrollos y análisis de la cartera de productos, el impacto de los actores del mercado nacional y localizado, analiza las oportunidades en términos de bolsillos de ingresos emergentes, cambios en las regulaciones del mercado, aprobaciones de productos, decisiones estratégicas, lanzamientos de productos, expansiones geográficas e innovaciones tecnológicas en el mercado. Para comprender el análisis y el escenario del mercado, comuníquese con nosotros para obtener un resumen de analistas; nuestro equipo lo ayudará a crear una solución de impacto en los ingresos para lograr su objetivo deseado.
 Alcance y tamaño del mercado de pantallas industriales de montaje en panel en Oriente Medio y África
El mercado de pantallas industriales de montaje en panel de Oriente Medio y África está segmentado en seis segmentos notables que se basan en la tecnología, el tamaño del panel, la resolución, la disponibilidad táctil, la aplicación y el usuario final. El crecimiento entre segmentos le ayuda a analizar nichos de crecimiento y estrategias para abordar el mercado y determinar sus áreas de aplicación principales y la diferencia en sus mercados objetivo.
- En función de la tecnología, el mercado de pantallas industriales de montaje en panel de Oriente Medio y África se ha segmentado en LED, pantalla de cristal líquido (LCD) y OLED. En 2021, el segmento de LCD domina porque no causa retrasos ni demoras de movimiento y ofrece una vida útil más larga y un menor impacto ambiental.
- En función del tamaño del panel, el mercado de pantallas industriales de montaje en panel de Oriente Medio y África se ha segmentado en hasta 14”, 14”-21”, 22”-40”, 41” y más. En 2021, el segmento de 14”-21” domina porque ofrece una gran idoneidad para que los monitores industriales se utilicen en PC industriales.
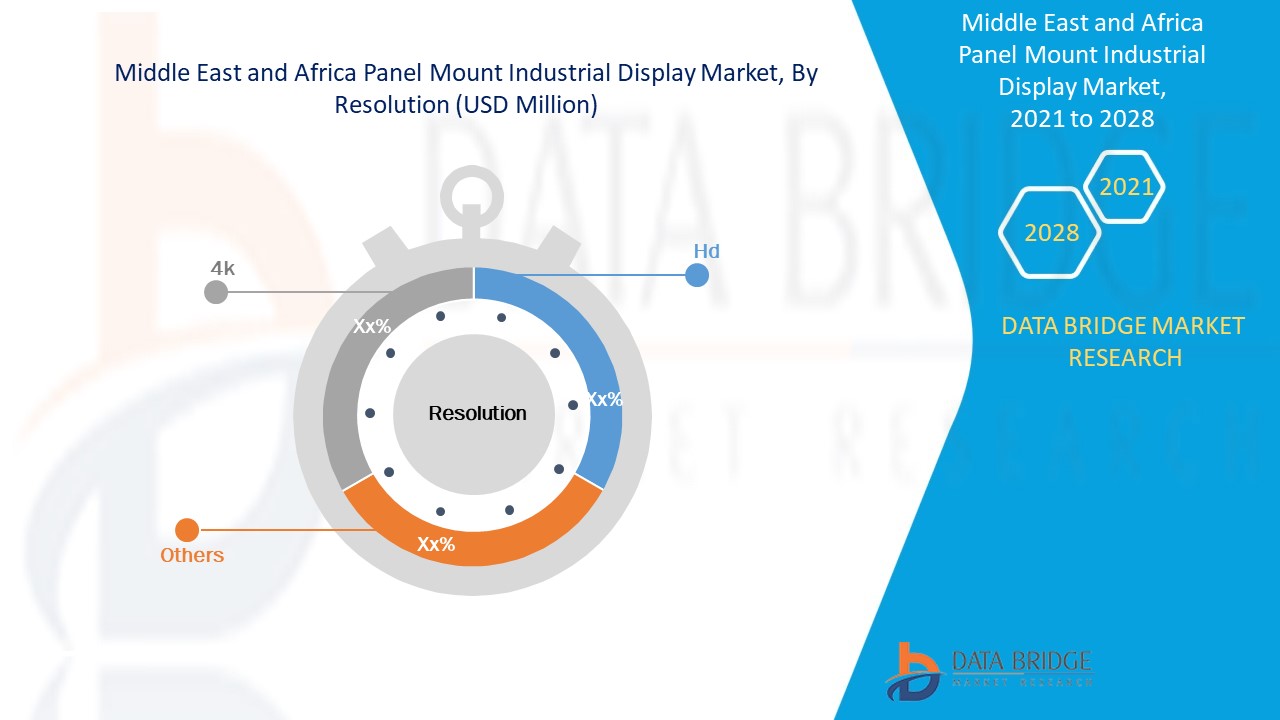
- En función de la resolución, el mercado de pantallas industriales de montaje en panel de Oriente Medio y África se ha segmentado en 4K, HD y otros. En 2021, el segmento HD domina porque está muy adoptado en los usos industriales y tiene un bajo costo.
- En función de la disponibilidad táctil, el mercado de pantallas industriales de montaje en panel de Oriente Medio y África se ha segmentado en táctiles y no táctiles. En 2021, el segmento táctil domina porque las pantallas táctiles son muy fáciles de usar y aumentan la velocidad de la interfaz de usuario.
- En función de la aplicación, el mercado de pantallas industriales de montaje en panel de Oriente Medio y África se ha segmentado en monitores industriales de marco abierto, pantallas interactivas, HMI, cajeros automáticos, imágenes y monitoreo remoto. En 2021, el segmento HMI domina porque permite monitorear y controlar la maquinaria de la fábrica de forma remota mediante pantallas industriales.
- En función del usuario final, el mercado de pantallas industriales de montaje en panel de Oriente Medio y África se ha segmentado en fabricación, procesamiento de alimentos, medicina, transporte, petróleo y gas, energía y electricidad, entre otros. En 2021, el segmento de fabricación domina porque los fabricantes están adoptando procesos de automatización para reducir el tiempo de inactividad y convertirlo en fábricas digitales.
Análisis a nivel de país del mercado de pantallas industriales de montaje en panel de Oriente Medio y África
Se analiza el mercado de pantallas industriales de montaje en panel de Medio Oriente y África y se proporciona información sobre el tamaño del mercado por país, tecnología, tamaño del panel, resolución, disponibilidad táctil, aplicación y usuario final.
Los países cubiertos en el informe del mercado de pantallas industriales de montaje en panel de Medio Oriente y África son Sudáfrica, Arabia Saudita, Emiratos Árabes Unidos, Egipto, Israel y el resto de Medio Oriente y África.
Los Emiratos Árabes Unidos dominan en Medio Oriente y África debido a que la región presenta un alto crecimiento de tecnologías avanzadas con un crecimiento creciente en la transformación digital de las industrias.
La sección de países del informe también proporciona factores de impacto de mercado individuales y cambios en la regulación en el mercado a nivel nacional que afectan las tendencias actuales y futuras del mercado. Los puntos de datos como nuevas ventas, ventas de reemplazo, demografía del país, leyes regulatorias y aranceles de importación y exportación son algunos de los principales indicadores utilizados para pronosticar el escenario del mercado para países individuales. Además, la presencia y disponibilidad de marcas globales y sus desafíos enfrentados debido a la competencia grande o escasa de las marcas locales y nacionales, el impacto de los canales de venta se consideran al proporcionar un análisis de pronóstico de los datos del país.
Demanda creciente de pantallas industriales con montaje en panel
El mercado de pantallas industriales de montaje en panel de Oriente Medio y África también le proporciona un análisis detallado del mercado para cada país, el crecimiento de la base instalada de diferentes tipos de productos para el mercado de pantallas industriales de montaje en panel de Oriente Medio y África, el impacto de la tecnología mediante curvas de línea de vida y cambios en los escenarios regulatorios y su impacto en el mercado de pantallas industriales de montaje en panel de Oriente Medio y África. Los datos están disponibles para el período histórico de 2019.
Panorama competitivo y análisis de la cuota de mercado de pantallas industriales de montaje en panel en Oriente Medio y África
El panorama competitivo del mercado de pantallas industriales para montaje en panel de Oriente Medio y África proporciona detalles por competidor. Los detalles incluidos son una descripción general de la empresa, las finanzas de la empresa, los ingresos generados, el potencial de mercado, la inversión en investigación y desarrollo, las nuevas iniciativas de mercado, la presencia global, los sitios e instalaciones de producción, las fortalezas y debilidades de la empresa, el lanzamiento de productos, las líneas de ensayos clínicos, el análisis de la marca, las aprobaciones de productos, las patentes, la amplitud y la extensión del producto, el dominio de la aplicación, la curva de la línea de vida de la tecnología. Los puntos de datos anteriores proporcionados solo están relacionados con el enfoque de las empresas relacionado con el mercado de pantallas industriales para montaje en panel de Oriente Medio y África.
Los principales actores cubiertos en el informe son Advantech Co., Ltd., American Industrial Systems, Inc. (una subsidiaria de Ennoconn), Pepperl+Fuchs SE, Hope Industrial Systems, Inc., TRU-Vu Monitors, Inc., AUO Display Plus Corp. (una subsidiaria de AU Optronics Corp.), Winmate Inc., INDUCOMP Corporation, Powerview Display Corp., Rockwell Automation, Inc., Nemacom Ltd., Schneider Electric, Siemens, EIZO Corporation, Axiomtek Co., Ltd., Quanzhou Neway Industrial Limited, Omni Vision Inc., WINSONIC ELECTRONICS CO., LTD., New Vision Display (Shenzhen) Co, Ltd. (una subsidiaria de Tianjin Jingwei Huikai Optoelectronic Co., Ltd), Datasound Laboratories Ltd entre otros actores nacionales. Los analistas de DBMR comprenden las fortalezas competitivas y brindan un análisis competitivo para cada competidor por separado.
Por ejemplo,
- En marzo de 2021, EIZO Corporation anunció el lanzamiento del FDF2182WT, un monitor de panel táctil PCAP. El nuevo producto ofrece un monitor multitáctil de 21,5 pulgadas con resolución Full HD (1920 x 1080) y es muy adecuado para entornos industriales, médicos y de acceso público. El nuevo producto ayudó a aumentar la cartera de productos de la empresa.
- En noviembre de 2020, Pepperl+Fuchs SE recibió la Certificación Obligatoria de China (CCC) para sus cientos de dispositivos de la División de Protección contra Explosiones de Pepperl+Fuchs. La certificación le permitió a la empresa seguir importando a China y comercializar bajo las nuevas regulaciones impuestas por China.
Las asociaciones, las empresas conjuntas y otras estrategias mejoran la participación de mercado de la empresa con una mayor cobertura y presencia. También brindan a las organizaciones la ventaja de mejorar su oferta de pantallas industriales para montaje en panel.
SKU-
Obtenga acceso en línea al informe sobre la primera nube de inteligencia de mercado del mundo

- Panel de análisis de datos interactivo
- Panel de análisis de empresas para oportunidades con alto potencial de crecimiento
- Acceso de analista de investigación para personalización y consultas
- Análisis de la competencia con panel interactivo
- Últimas noticias, actualizaciones y análisis de tendencias
- Aproveche el poder del análisis de referencia para un seguimiento integral de la competencia
Tabla de contenido
1 INTRODUCTION
1.1 OBJECTIVES OF THE STUDY
1.2 MARKET DEFINITION
1.3 OVERVIEW OF MIDDLE EAST AND AFRICA PANEL MOUNT INDUSTRIAL DISPLAY MARKET
1.4 CURRENCY AND PRICING
1.5 LIMITATIONS
1.6 MARKETS COVERED
2 MARKET SEGMENTATION
2.1 MARKETS COVERED
2.2 GEOGRAPHICAL SCOPE
2.3 YEARS CONSIDERED FOR THE STUDY
2.4 DBMR TRIPOD DATA VALIDATION MODEL
2.5 PRIMARY INTERVIEWS WITH KEY OPINION LEADERS
2.6 DBMR MARKET POSITION GRID
2.7 VENDOR SHARE ANALYSIS
2.8 MULTIVARIATE MODELING
2.9 TECHNOLOGY TIMELINE CURVE
2.1 MARKET APPLICATION COVERAGE GRID
2.11 SECONDARY SOURCES
2.12 ASSUMPTIONS
3 EXECUTIVE SUMMARY
4 PREMIUM INSIGHTS
4.1 REGULATORY STANDARDS
5 MARKET OVERVIEW
5.1 DRIVERS
5.1.1 INCREASING ADOPTION OF INTERNET OF THINGS (IOT)
5.1.2 RISING DEMAND FOR MULTI-FEATURED HUMAN MACHINE INTERFACE (HMI) DEVICES
5.1.3 HIGH BENEFITS OFFERED BY INDUSTRIAL TOUCHSCREEN MONITORS
5.1.4 RISING ADOPTION OF LCD, LED AND OLED DISPLAYS
5.1.5 GOVERNMENT INITIATIVES FOR DISPLAY UNITS
5.2 RESTRAINT
5.2.1 HIGH INITIAL COST RELATED WITH IMPLEMENTATION OF INDUSTRIAL DISPLAYS
5.3 OPPORTUNITIES
5.3.1 INCREASE IN IMPLEMENTATION OF INDUSTRY 4.0
5.3.2 INCREASING GROWTH IN BIG DATA ANALYTICS
5.3.3 GROWING USE OF INDUSTRIAL DISPLAYS IN VARIOUS INDUSTRIAL VERTICALS
5.3.4 INCREASING GROWTH IN INVESTMENTS AND EXPANSIONS MADE BY MARKET PLAYERS
5.3.5 EMERGENCE OF NEW PRODUCT DEVELOPMENTS
5.4 CHALLENGES
5.4.2 COMPLEXITY IN DEPLOYMENT OF DISPLAYS FOR ALL WEATHER CONDITIONS
5.4.3 ECONOMIC CRISIS DUE TO THE PANDEMIC
6 IMPACT OF COVID-19 ON THE MIDDLE EAST AND AFRICA PANEL MOUNT INDUSTRIAL DISPLAY MARKET
6.1 ANALYSIS ON IMPACT OF COVID-19 ON THE MARKET
6.2 AFTERMATH OF COVID-19 AND GOVERNMENT INITIATIVE TO BOOST THE MARKET
6.3 STRATEGIC DECISIONS FOR MANUFACTURERS AFTER COVID-19 TO GAIN COMPETITIVE MARKET SHARE
6.4 IMPACT ON DEMAND
6.5 IMPACT ON SUPPLY CHAIN
6.6 IMPACT ON PRICE
6.7 CONCLUSION
7 MIDDLE EAST AND AFRICA PANEL MOUNT INDUSTRIAL DISPLAY MARKET, BY TECHNOLOGY
7.1 OVERVIEW
7.2 LIQUID CRYSTAL DISPLAY (LCD)
7.3 LED
7.3.1 FULL ARRAY
7.3.2 EDGE LIT
7.3.3 DIRECT LIT
7.4 OLED
7.4.1 AMOLED DISPLAY
7.4.2 PMOLED DISPLAY
8 MIDDLE EAST AND AFRICA PANEL MOUNT INDUSTRIAL DISPLAY MARKET, BY PANEL SIZE
8.1 OVERVIEW
8.2" -21"
8.3 UP TO 14"
8.4"-40"
8.5" AND ABOVE
9 MIDDLE EAST AND AFRICA PANEL MOUNT INDUSTRIAL DISPLAY MARKET, BY RESOLUTION
9.1 OVERVIEW
9.2 HD
9.3 4K
9.4 OTHERS
10 MIDDLE EAST AND AFRICA PANEL MOUNT INDUSTRIAL DISPLAY MARKET, BY TOUCH AVAILABILITY
10.1 OVERVIEW
10.2 TOUCH
10.2.1 BY TYPE
10.2.1.1 5 WIRE RESISTIVE
10.2.1.2 4 WIRE RESISTIVE
10.2.2 BY SCREEN TYPE
10.2.2.1 GLASS FILM GLASS (GFG)
10.2.2.2 PCAP (CAPACITIVE)
10.3 NON TOUCH
11 MIDDLE EAST AND AFRICA PANEL MOUNT INDUSTRIAL DISPLAY MARKET, BY APPLICATION
11.1 OVERVIEW
11.2 HMI
11.3 INDUSTRIAL OPEN FRAME MONITORS
11.4 REMOTE MONITORING
11.5 IMAGING
12 MIDDLE EAST AND AFRICA PANEL MOUNT INDUSTRIAL DISPLAY MARKET, BY END USER
12.1 OVERVIEW
12.2 MANUFACTURING
12.2.1 LIQUID CRYSTAL DISPLAY (LCD)
12.2.2 LED
12.2.3 OLED
12.3 MEDICAL
12.3.1 LIQUID CRYSTAL DISPLAY (LCD)
12.3.2 LED
12.3.3 OLED
12.4 OIL AND GAS
12.4.1 LIQUID CRYSTAL DISPLAY (LCD)
12.4.2 LED
12.4.3 OLED
12.5 FOOD PROCESSING
12.5.1 LIQUID CRYSTAL DISPLAY (LCD)
12.5.2 LED
12.5.3 OLED
12.6 TRANSPORTATION
12.6.1 LIQUID CRYSTAL DISPLAY (LCD)
12.6.2 LED
12.6.3 OLED
12.7 ENERGY AND POWER
12.7.1 LIQUID CRYSTAL DISPLAY (LCD)
12.7.2 LED
12.7.3 OLED
12.8 OTHERS
13 MIDDLE EAST AND AFRICA PANEL MOUNT INDUSTRIAL DISPLAY MARKET, BY REGION
13.1 MIDDLE EAST AND AFRICA
13.1.1 U.A.E.
13.1.2 SAUDI ARABIA
13.1.3 ISRAEL
13.1.4 EGYPT
13.1.5 SOUTH AFRICA
13.1.6 REST OF MIDDLE EAST AND AFRICA
14 MIDDLE EAST AND AFRICA PANEL MOUNT INDUSTRIAL DISPLAY MARKET: COMPANY LANDSCAPE
14.1 COMPANY SHARE ANALYSIS: MIDDLE EAST AND AFRICA
15 SWOT ANALYSIS
16 COMPANY PROFILE
16.1 SIEMENS
16.1.1 COMPANY SNAPSHOT
16.1.2 REVENUE ANALYSIS
16.1.3 COMPANY SHARE ANALYSIS
16.1.4 PRODUCT PORTFOLIO
16.1.5 RECENT DEVELOPMENT
16.2 SCHNEIDER ELECTRIC
16.2.1 COMPANY SNAPSHOT
16.2.2 REVENUE ANALYSIS
16.2.3 COMPANY SHARE ANALYSIS
16.2.4 PRODUCT PORTFOLIO
16.2.5 RECENT DEVELOPMENTS
16.3 ROCKWELL AUTOMATION, INC.
16.3.1 COMPANY SNAPSHOT
16.3.2 REVENUE ANALYSIS
16.3.3 COMPANY SHARE ANALYSIS
16.3.4 PRODUCT PORTFOLIO
16.3.5 RECENT DEVELOPMENTS
16.4 OMNI VISION INC.
16.4.1 COMPANY SNAPSHOT
16.4.2 COMPANY SHARE ANALYSIS
16.4.3 PRODUCT PORTFOLIO
16.4.4 RECENT DEVELOPMENT
16.5 ADVANTECH CO., LTD.
16.5.1 COMPANY SNAPSHOT
16.5.2 REVENUE ANALYSIS
16.5.3 COMPANY SHARE ANALYSIS
16.5.4 PRODUCT PORTFOLIO
16.5.5 RECENT DEVELOPMENTS
16.6 AUO DISPLAY PLUS CORP. (A SUBSIDIARY OF AU OPTRONICS CORP.)
16.6.1 COMPANY SNAPSHOT
16.6.2 REVENUE ANALYSIS
16.6.3 PRODUCT PORTFOLIO
16.6.4 RECENT DEVELOPMENTS
16.7 NEW VISION DISPLAY (SHENZHEN) CO, LTD. (A SUBSIDIARY OF TIANJIN JINGWEI HUIKAI OPTOELECTRONIC CO., LTD.)
16.7.1 COMPANY SNAPSHOT
16.7.2 REVENUE ANALYSIS
16.7.3 PRODUCT PORTFOLIO
16.7.4 RECENT DEVELOPMENT
16.8 PEPPERL+FUCHS SE
16.8.1 COMPANY SNAPSHOT
16.8.2 PRODUCT PORTFOLIO
16.8.3 RECENT DEVELOPMENT
16.9 EIZO CORPORATION
16.9.1 COMPANY SNAPSHOT
16.9.2 REVENUE ANALYSIS
16.9.3 PRODUCT PORTFOLIO
16.9.4 RECENT DEVELOPMENT
16.1 AMERICAN INDUSTRIAL SYSTEMS, INC. (A SUBSIDIARY OF ENNOCONN)
16.10.1 COMPANY SNAPSHOT
16.10.2 REVENUE ANALYSIS
16.10.3 PRODUCT PORTFOLIO
16.10.4 RECENT DEVELOPMENTS
16.11 AXIOMTEK CO., LTD.
16.11.1 COMPANY SNAPSHOT
16.11.2 REVENUE ANALYSIS
16.11.3 PRODUCT PORTFOLIO
16.11.4 RECENT DEVELOPMENTS
16.12 DATASOUND LABORATORIES LTD.
16.12.1 COMPANY SNAPSHOT
16.12.2 PRODUCT PORTFOLIO
16.12.3 RECENT DEVELOPMENT
16.13 HOPE INDUSTRIAL SYSTEMS, INC.
16.13.1 COMPANY SNAPSHOT
16.13.2 PRODUCT PORTFOLIO
16.13.3 RECENT DEVELOPMENTS
16.14 INDUCOMP CORPORATION
16.14.1 COMPANY SNAPSHOT
16.14.2 PRODUCT PORTFOLIO
16.14.3 RECENT DEVELOPMENT
16.15 NEMACOM LTD.
16.15.1 COMPANY SNAPSHOT
16.15.2 PRODUCT PORTFOLIO
16.15.3 RECENT DEVELOPMENT
16.16 POWERVIEW DISPLAY CORP.
16.16.1 COMPANY SNAPSHOT
16.16.2 PRODUCT PORTFOLIO
16.16.3 RECENT DEVELOPMENT
16.17 QUANZHOU NEWAY INDUSTRIAL LIMITED
16.17.1 COMPANY SNAPSHOT
16.17.2 PRODUCT PORTFOLIO
16.17.3 RECENT DEVELOPMENT
16.18 TRU-VU MONITORS, INC.
16.18.1 COMPANY SNAPSHOT
16.18.2 PRODUCT PORTFOLIO
16.18.3 RECENT DEVELOPMENTS
16.19 WINMATE INC.
16.19.1 COMPANY SNAPSHOT
16.19.2 REVENUE ANALYSIS
16.19.3 PRODUCT PORTFOLIO
16.19.4 RECENT DEVELOPMENTS
16.2 WINSONIC ELECTRONICS CO., LTD.
16.20.1 COMPANY SNAPSHOT
16.20.2 PRODUCT PORTFOLIO
16.20.3 RECENT DEVELOPMENT
17 QUESTIONNAIRE
18 RELATED REPORTS
Lista de Tablas
TABLE 1 MIDDLE EAST AND AFRICA PANEL MOUNT INDUSTRIAL DISPLAY MARKET, BY TECHNOLOGY, 2019-2028 (USD MILLION)
TABLE 2 MIDDLE EAST AND AFRICA LIQUID CRYSTAL DISPLAY (LCD) IN PANEL MOUNT INDUSTRIAL DISPLAY MARKET, BY REGION, 2021-2028 (USD MILLION)
TABLE 3 MIDDLE EAST AND AFRICA LED IN PANEL MOUNT INDUSTRIAL DISPLAY MARKET, BY REGION, 2019-2028 (USD MILLION)
TABLE 4 MIDDLE EAST AND AFRICA LED IN PANEL MOUNT INDUSTRIAL DISPLAY MARKET, BY LED TYPE, 2019-2028 (USD MILLION)
TABLE 5 MIDDLE EAST AND AFRICA OLED IN PANEL MOUNT INDUSTRIAL DISPLAY MARKET, BY REGION, 2019-2028 (USD MILLION)
TABLE 6 MIDDLE EAST AND AFRICA OLED IN PANEL MOUNT INDUSTRIAL DISPLAY MARKET, BY OLED TYPE, 2019-2028 (USD MILLION)
TABLE 7 MIDDLE EAST AND AFRICA PANEL MOUNT INDUSTRIAL DISPLAY MARKET, BY PANEL SIZE, 2019-2028 (USD MILLION)
TABLE 8 MIDDLE EAST AND AFRICA 14" -21" IN PANEL MOUNT INDUSTRIAL DISPLAY MARKET, BY REGION, 2019-2028 (USD MILLION)
TABLE 9 MIDDLE EAST AND AFRICA UP TO 14" IN PANEL MOUNT INDUSTRIAL DISPLAY MARKET, BY REGION, 2019-2028 (USD MILLION)
TABLE 10 MIDDLE EAST AND AFRICA 22"-40" IN PANEL MOUNT INDUSTRIAL DISPLAY MARKET, BY REGION, 2019-2028 (USD MILLION)
TABLE 11 MIDDLE EAST AND AFRICA 41" AND ABOVE IN PANEL MOUNT INDUSTRIAL DISPLAY MARKET, BY REGION, 2019-2028 (USD MILLION)
TABLE 12 MIDDLE EAST AND AFRICA PANEL MOUNT INDUSTRIAL DISPLAY MARKET, BY RESOLUTION, 2019-2028 (USD MILLION)
TABLE 13 MIDDLE EAST AND AFRICA HD IN PANEL MOUNT INDUSTRIAL DISPLAY MARKET, BY REGION, 2019-2028 (USD MILLION)
TABLE 14 MIDDLE EAST AND AFRICA 4K IN PANEL MOUNT INDUSTRIAL DISPLAY MARKET, BY REGION, 2019-2028 (USD MILLION)
TABLE 15 MIDDLE EAST AND AFRICA OTHERS IN PANEL MOUNT INDUSTRIAL DISPLAY MARKET, BY REGION, 2019-2028 (USD MILLION)
TABLE 16 MIDDLE EAST AND AFRICA PANEL MOUNT INDUSTRIAL DISPLAY MARKET, BY TOUCH AVAILABILITY, 2019-2028 (USD MILLION)
TABLE 17 MIDDLE EAST AND AFRICA TOUCH IN PANEL MOUNT INDUSTRIAL DISPLAY MARKET, BY REGION, 2019-2028 (USD MILLION)
TABLE 18 MIDDLE EAST AND AFRICA TOUCH IN PANEL MOUNT INDUSTRIAL DISPLAY MARKET, BY TOUCH TYPE, 2019-2028 (USD MILLION)
TABLE 19 MIDDLE EAST AND AFRICA TOUCH IN PANEL MOUNT INDUSTRIAL DISPLAY MARKET, BY SCREEN TYPE, 2019-2028 (USD MILLION)
TABLE 20 MIDDLE EAST AND AFRICA NON TOUCH IN PANEL MOUNT INDUSTRIAL DISPLAY MARKET, BY REGION, 2019-2028 (USD MILLION)
TABLE 21 MIDDLE EAST AND AFRICA PANEL MOUNT INDUSTRIAL DISPLAY MARKET, BY APPLICATION, 2019-2028 (USD MILLION)
TABLE 22 MIDDLE EAST AND AFRICA HMI IN PANEL MOUNT INDUSTRIAL DISPLAY MARKET, BY REGION, 2019-2028 (USD MILLION)
TABLE 23 MIDDLE EAST AND AFRICA INDUSTRIAL OPEN FRAME MONITORS IN PANEL MOUNT INDUSTRIAL DISPLAY MARKET, BY REGION, 2019-2028 (USD MILLION)
TABLE 24 MIDDLE EAST AND AFRICA REMOTE MONITORING IN PANEL MOUNT INDUSTRIAL DISPLAY MARKET, BY REGION, 2019-2028 (USD MILLION)
TABLE 25 MIDDLE EAST AND AFRICA IMAGING IN PANEL MOUNT INDUSTRIAL DISPLAY MARKET, BY REGION, 2019-2028 (USD MILLION)
TABLE 26 MIDDLE EAST AND AFRICA PANEL MOUNT INDUSTRIAL DISPLAY MARKET, BY END USER, 2019-2028 (USD MILLION)
TABLE 27 MIDDLE EAST AND AFRICA MANUFACTURING IN PANEL MOUNT INDUSTRIAL DISPLAY MARKET, BY REGION, 2019-2028 (USD MILLION)
TABLE 28 MIDDLE EAST AND AFRICA MANUFACTURING IN PANEL MOUNT INDUSTRIAL DISPLAY MARKET, BY TECHNOLOGY, 2019-2028 (USD MILLION)
TABLE 29 MIDDLE EAST AND AFRICA MEDICAL IN PANEL MOUNT INDUSTRIAL DISPLAY MARKET, BY REGION, 2019-2028 (USD MILLION)
TABLE 30 MIDDLE EAST AND AFRICA MEDICAL IN PANEL MOUNT INDUSTRIAL DISPLAY MARKET, BY TECHNOLOGY, 2019-2028 (USD MILLION)
TABLE 31 MIDDLE EAST AND AFRICA OIL AND GAS IN PANEL MOUNT INDUSTRIAL DISPLAY MARKET, BY REGION, 2019-2028 (USD MILLION)
TABLE 32 MIDDLE EAST AND AFRICA OIL AND GAS IN PANEL MOUNT INDUSTRIAL DISPLAY MARKET, BY TECHNOLOGY, 2019-2028 (USD MILLION)
TABLE 33 MIDDLE EAST AND AFRICA FOOD PROCESSING IN PANEL MOUNT INDUSTRIAL DISPLAY MARKET, BY REGION, 2019-2028 (USD MILLION)
TABLE 34 MIDDLE EAST AND AFRICA FOOD PROCESSING IN PANEL MOUNT INDUSTRIAL DISPLAY MARKET, BY TECHNOLOGY, 2019-2028 (USD MILLION)
TABLE 35 MIDDLE EAST AND AFRICA TRANSPORTATION IN PANEL MOUNT INDUSTRIAL DISPLAY MARKET, BY REGION, 2019-2028 (USD MILLION)
TABLE 36 MIDDLE EAST AND AFRICA TRANSPORTATION IN PANEL MOUNT INDUSTRIAL DISPLAY MARKET, BY TECHNOLOGY, 2019-2028 (USD MILLION)
TABLE 37 MIDDLE EAST AND AFRICA ENERGY AND POWER IN PANEL MOUNT INDUSTRIAL DISPLAY MARKET, BY REGION, 2019-2028 (USD MILLION)
TABLE 38 MIDDLE EAST AND AFRICA ENERGY AND POWER IN PANEL MOUNT INDUSTRIAL DISPLAY MARKET, BY TECHNOLOGY, 2019-2028 (USD MILLION)
TABLE 39 MIDDLE EAST AND AFRICA OTHERS IN PANEL MOUNT INDUSTRIAL DISPLAY MARKET, BY REGION, 2019-2028 (USD MILLION)
TABLE 40 MIDDLE EAST AND AFRICA PANEL MOUNT INDUSTRIAL DISPLAY MARKET, BY COUNTRY, 2019-2028 (USD MILLION)
TABLE 41 MIDDLE EAST AND AFRICA PANEL MOUNT INDUSTRIAL DISPLAY MARKET, BY TECHNOLOGY, 2019-2028 (USD MILLION)
TABLE 42 MIDDLE EAST AND AFRICA LED IN PANEL MOUNT INDUSTRIAL DISPLAY MARKET, BY LED TYPE, 2019-2028 (USD MILLION)
TABLE 43 MIDDLE EAST AND AFRICA OLED IN PANEL MOUNT INDUSTRIAL DISPLAY MARKET, BY OLED TYPE, 2019-2028 (USD MILLION)
TABLE 44 MIDDLE EAST AND AFRICA PANEL MOUNT INDUSTRIAL DISPLAY MARKET, BY PANEL SIZE, 2019-2028 (USD MILLION)
TABLE 45 MIDDLE EAST AND AFRICA PANEL MOUNT INDUSTRIAL DISPLAY MARKET, BY RESOLUTION, 2019-2028 (USD MILLION)
TABLE 46 MIDDLE EAST AND AFRICA PANEL MOUNT INDUSTRIAL DISPLAY MARKET, BY TOUCH AVAILABILITY, 2019-2028 (USD MILLION)
TABLE 47 MIDDLE EAST AND AFRICA TOUCH IN PANEL MOUNT INDUSTRIAL DISPLAY MARKET, BY TOUCH TYPE, 2019-2028 (USD MILLION)
TABLE 48 MIDDLE EAST AND AFRICA TOUCH IN PANEL MOUNT INDUSTRIAL DISPLAY MARKET, BY SCREEN TYPE, 2019-2028 (USD MILLION)
TABLE 49 MIDDLE EAST AND AFRICA PANEL MOUNT INDUSTRIAL DISPLAY MARKET, BY APPLICATION, 2019-2028 (USD MILLION)
TABLE 50 MIDDLE EAST AND AFRICA PANEL MOUNT INDUSTRIAL DISPLAY MARKET, BY END USER, 2019-2028 (USD MILLION)
TABLE 51 MIDDLE EAST AND AFRICA MANUFACTURING IN PANEL MOUNT INDUSTRIAL DISPLAY MARKET, BY TECHNOLOGY, 2019-2028 (USD MILLION)
TABLE 52 MIDDLE EAST AND AFRICA MEDICAL IN PANEL MOUNT INDUSTRIAL DISPLAY MARKET, BY TECHNOLOGY, 2019-2028 (USD MILLION)
TABLE 53 MIDDLE EAST AND AFRICA OIL AND GAS IN PANEL MOUNT INDUSTRIAL DISPLAY MARKET, BY TECHNOLOGY, 2019-2028 (USD MILLION)
TABLE 54 MIDDLE EAST AND AFRICA FOOD PROCESSING IN PANEL MOUNT INDUSTRIAL DISPLAY MARKET, BY TECHNOLOGY, 2019-2028 (USD MILLION)
TABLE 55 MIDDLE EAST AND AFRICA TRANSPORTATION IN PANEL MOUNT INDUSTRIAL DISPLAY MARKET, BY TECHNOLOGY, 2019-2028 (USD MILLION)
TABLE 56 MIDDLE EAST AND AFRICA ENERGY AND POWER IN PANEL MOUNT INDUSTRIAL DISPLAY MARKET, BY TECHNOLOGY, 2019-2028 (USD MILLION)
TABLE 57 U.A.E. PANEL MOUNT INDUSTRIAL DISPLAY MARKET, BY TECHNOLOGY, 2019-2028 (USD MILLION)
TABLE 58 U.A.E. LED IN PANEL MOUNT INDUSTRIAL DISPLAY MARKET, BY LED TYPE, 2019-2028 (USD MILLION)
TABLE 59 U.A.E. OLED IN PANEL MOUNT INDUSTRIAL DISPLAY MARKET, BY OLED TYPE, 2019-2028 (USD MILLION)
TABLE 60 U.A.E. PANEL MOUNT INDUSTRIAL DISPLAY MARKET, BY PANEL SIZE, 2019-2028 (USD MILLION)
TABLE 61 U.A.E. PANEL MOUNT INDUSTRIAL DISPLAY MARKET, BY RESOLUTION, 2019-2028 (USD MILLION)
TABLE 62 U.A.E. PANEL MOUNT INDUSTRIAL DISPLAY MARKET, BY TOUCH AVAILABILITY, 2019-2028 (USD MILLION)
TABLE 63 U.A.E. TOUCH IN PANEL MOUNT INDUSTRIAL DISPLAY MARKET, BY TOUCH TYPE, 2019-2028 (USD MILLION)
TABLE 64 U.A.E. TOUCH IN PANEL MOUNT INDUSTRIAL DISPLAY MARKET, BY SCREEN TYPE, 2019-2028 (USD MILLION)
TABLE 65 U.A.E. PANEL MOUNT INDUSTRIAL DISPLAY MARKET, BY APPLICATION, 2019-2028 (USD MILLION)
TABLE 66 U.A.E. PANEL MOUNT INDUSTRIAL DISPLAY MARKET, BY END USER, 2019-2028 (USD MILLION)
TABLE 67 U.A.E. MANUFACTURING IN PANEL MOUNT INDUSTRIAL DISPLAY MARKET, BY TECHNOLOGY, 2019-2028 (USD MILLION)
TABLE 68 U.A.E. MEDICAL IN PANEL MOUNT INDUSTRIAL DISPLAY MARKET, BY TECHNOLOGY, 2019-2028 (USD MILLION)
TABLE 69 U.A.E. OIL AND GAS IN PANEL MOUNT INDUSTRIAL DISPLAY MARKET, BY TECHNOLOGY, 2019-2028 (USD MILLION)
TABLE 70 U.A.E. FOOD PROCESSING IN PANEL MOUNT INDUSTRIAL DISPLAY MARKET, BY TECHNOLOGY, 2019-2028 (USD MILLION)
TABLE 71 U.A.E. TRANSPORTATION IN PANEL MOUNT INDUSTRIAL DISPLAY MARKET, BY TECHNOLOGY, 2019-2028 (USD MILLION)
TABLE 72 U.A.E. ENERGY AND POWER IN PANEL MOUNT INDUSTRIAL DISPLAY MARKET, BY TECHNOLOGY, 2019-2028 (USD MILLION)
TABLE 73 SAUDI ARABIA PANEL MOUNT INDUSTRIAL DISPLAY MARKET, BY TECHNOLOGY, 2019-2028 (USD MILLION)
TABLE 74 SAUDI ARABIA LED IN PANEL MOUNT INDUSTRIAL DISPLAY MARKET, BY LED TYPE, 2019-2028 (USD MILLION)
TABLE 75 SAUDI ARABIA OLED IN PANEL MOUNT INDUSTRIAL DISPLAY MARKET, BY OLED TYPE, 2019-2028 (USD MILLION)
TABLE 76 SAUDI ARABIA PANEL MOUNT INDUSTRIAL DISPLAY MARKET, BY PANEL SIZE, 2019-2028 (USD MILLION)
TABLE 77 SAUDI ARABIA PANEL MOUNT INDUSTRIAL DISPLAY MARKET, BY RESOLUTION, 2019-2028 (USD MILLION)
TABLE 78 SAUDI ARABIA PANEL MOUNT INDUSTRIAL DISPLAY MARKET, BY TOUCH AVAILABILITY, 2019-2028 (USD MILLION)
TABLE 79 SAUDI ARABIA TOUCH IN PANEL MOUNT INDUSTRIAL DISPLAY MARKET, BY TOUCH TYPE, 2019-2028 (USD MILLION)
TABLE 80 SAUDI ARABIA TOUCH IN PANEL MOUNT INDUSTRIAL DISPLAY MARKET, BY SCREEN TYPE, 2019-2028 (USD MILLION)
TABLE 81 SAUDI ARABIA PANEL MOUNT INDUSTRIAL DISPLAY MARKET, BY APPLICATION, 2019-2028 (USD MILLION)
TABLE 82 SAUDI ARABIA PANEL MOUNT INDUSTRIAL DISPLAY MARKET, BY END USER, 2019-2028 (USD MILLION)
TABLE 83 SAUDI ARABIA MANUFACTURING IN PANEL MOUNT INDUSTRIAL DISPLAY MARKET, BY TECHNOLOGY, 2019-2028 (USD MILLION)
TABLE 84 SAUDI ARABIA MEDICAL IN PANEL MOUNT INDUSTRIAL DISPLAY MARKET, BY TECHNOLOGY, 2019-2028 (USD MILLION)
TABLE 85 SAUDI ARABIA OIL AND GAS IN PANEL MOUNT INDUSTRIAL DISPLAY MARKET, BY TECHNOLOGY, 2019-2028 (USD MILLION)
TABLE 86 SAUDI ARABIA FOOD PROCESSING IN PANEL MOUNT INDUSTRIAL DISPLAY MARKET, BY TECHNOLOGY, 2019-2028 (USD MILLION)
TABLE 87 SAUDI ARABIA TRANSPORTATION IN PANEL MOUNT INDUSTRIAL DISPLAY MARKET, BY TECHNOLOGY, 2019-2028 (USD MILLION)
TABLE 88 SAUDI ARABIA ENERGY AND POWER IN PANEL MOUNT INDUSTRIAL DISPLAY MARKET, BY TECHNOLOGY, 2019-2028 (USD MILLION)
TABLE 89 ISRAEL PANEL MOUNT INDUSTRIAL DISPLAY MARKET, BY TECHNOLOGY, 2019-2028 (USD MILLION)
TABLE 90 ISRAEL LED IN PANEL MOUNT INDUSTRIAL DISPLAY MARKET, BY LED TYPE, 2019-2028 (USD MILLION)
TABLE 91 ISRAEL OLED IN PANEL MOUNT INDUSTRIAL DISPLAY MARKET, BY OLED TYPE, 2019-2028 (USD MILLION)
TABLE 92 ISRAEL PANEL MOUNT INDUSTRIAL DISPLAY MARKET, BY PANEL SIZE, 2019-2028 (USD MILLION)
TABLE 93 ISRAEL PANEL MOUNT INDUSTRIAL DISPLAY MARKET, BY RESOLUTION, 2019-2028 (USD MILLION)
TABLE 94 ISRAEL PANEL MOUNT INDUSTRIAL DISPLAY MARKET, BY TOUCH AVAILABILITY, 2019-2028 (USD MILLION)
TABLE 95 ISRAEL TOUCH IN PANEL MOUNT INDUSTRIAL DISPLAY MARKET, BY TOUCH TYPE, 2019-2028 (USD MILLION)
TABLE 96 ISRAEL TOUCH IN PANEL MOUNT INDUSTRIAL DISPLAY MARKET, BY SCREEN TYPE, 2019-2028 (USD MILLION)
TABLE 97 ISRAEL PANEL MOUNT INDUSTRIAL DISPLAY MARKET, BY APPLICATION, 2019-2028 (USD MILLION)
TABLE 98 ISRAEL PANEL MOUNT INDUSTRIAL DISPLAY MARKET, BY END USER, 2019-2028 (USD MILLION)
TABLE 99 ISRAEL MANUFACTURING IN PANEL MOUNT INDUSTRIAL DISPLAY MARKET, BY TECHNOLOGY, 2019-2028 (USD MILLION)
TABLE 100 ISRAEL MEDICAL IN PANEL MOUNT INDUSTRIAL DISPLAY MARKET, BY TECHNOLOGY, 2019-2028 (USD MILLION)
TABLE 101 ISRAEL OIL AND GAS IN PANEL MOUNT INDUSTRIAL DISPLAY MARKET, BY TECHNOLOGY, 2019-2028 (USD MILLION)
TABLE 102 ISRAEL FOOD PROCESSING IN PANEL MOUNT INDUSTRIAL DISPLAY MARKET, BY TECHNOLOGY, 2019-2028 (USD MILLION)
TABLE 103 ISRAEL TRANSPORTATION IN PANEL MOUNT INDUSTRIAL DISPLAY MARKET, BY TECHNOLOGY, 2019-2028 (USD MILLION)
TABLE 104 ISRAEL ENERGY AND POWER IN PANEL MOUNT INDUSTRIAL DISPLAY MARKET, BY TECHNOLOGY, 2019-2028 (USD MILLION)
TABLE 105 EGYPT PANEL MOUNT INDUSTRIAL DISPLAY MARKET, BY TECHNOLOGY, 2019-2028 (USD MILLION)
TABLE 106 EGYPT LED IN PANEL MOUNT INDUSTRIAL DISPLAY MARKET, BY LED TYPE, 2019-2028 (USD MILLION)
TABLE 107 EGYPT OLED IN PANEL MOUNT INDUSTRIAL DISPLAY MARKET, BY OLED TYPE, 2019-2028 (USD MILLION)
TABLE 108 EGYPT PANEL MOUNT INDUSTRIAL DISPLAY MARKET, BY PANEL SIZE, 2019-2028 (USD MILLION)
TABLE 109 EGYPT PANEL MOUNT INDUSTRIAL DISPLAY MARKET, BY RESOLUTION, 2019-2028 (USD MILLION)
TABLE 110 EGYPT PANEL MOUNT INDUSTRIAL DISPLAY MARKET, BY TOUCH AVAILABILITY, 2019-2028 (USD MILLION)
TABLE 111 EGYPT TOUCH IN PANEL MOUNT INDUSTRIAL DISPLAY MARKET, BY TOUCH TYPE, 2019-2028 (USD MILLION)
TABLE 112 EGYPT TOUCH IN PANEL MOUNT INDUSTRIAL DISPLAY MARKET, BY SCREEN TYPE, 2019-2028 (USD MILLION)
TABLE 113 EGYPT PANEL MOUNT INDUSTRIAL DISPLAY MARKET, BY APPLICATION, 2019-2028 (USD MILLION)
TABLE 114 EGYPT PANEL MOUNT INDUSTRIAL DISPLAY MARKET, BY END USER, 2019-2028 (USD MILLION)
TABLE 115 EGYPT MANUFACTURING IN PANEL MOUNT INDUSTRIAL DISPLAY MARKET, BY TECHNOLOGY, 2019-2028 (USD MILLION)
TABLE 116 EGYPT MEDICAL IN PANEL MOUNT INDUSTRIAL DISPLAY MARKET, BY TECHNOLOGY, 2019-2028 (USD MILLION)
TABLE 117 EGYPT OIL AND GAS IN PANEL MOUNT INDUSTRIAL DISPLAY MARKET, BY TECHNOLOGY, 2019-2028 (USD MILLION)
TABLE 118 EGYPT FOOD PROCESSING IN PANEL MOUNT INDUSTRIAL DISPLAY MARKET, BY TECHNOLOGY, 2019-2028 (USD MILLION)
TABLE 119 EGYPT TRANSPORTATION IN PANEL MOUNT INDUSTRIAL DISPLAY MARKET, BY TECHNOLOGY, 2019-2028 (USD MILLION)
TABLE 120 EGYPT ENERGY AND POWER IN PANEL MOUNT INDUSTRIAL DISPLAY MARKET, BY TECHNOLOGY, 2019-2028 (USD MILLION)
TABLE 121 SOUTH AFRICA PANEL MOUNT INDUSTRIAL DISPLAY MARKET, BY TECHNOLOGY, 2019-2028 (USD MILLION)
TABLE 122 SOUTH AFRICA LED IN PANEL MOUNT INDUSTRIAL DISPLAY MARKET, BY LED TYPE, 2019-2028 (USD MILLION)
TABLE 123 SOUTH AFRICA OLED IN PANEL MOUNT INDUSTRIAL DISPLAY MARKET, BY OLED TYPE, 2019-2028 (USD MILLION)
TABLE 124 SOUTH AFRICA PANEL MOUNT INDUSTRIAL DISPLAY MARKET, BY PANEL SIZE, 2019-2028 (USD MILLION)
TABLE 125 SOUTH AFRICA PANEL MOUNT INDUSTRIAL DISPLAY MARKET, BY RESOLUTION, 2019-2028 (USD MILLION)
TABLE 126 SOUTH AFRICA PANEL MOUNT INDUSTRIAL DISPLAY MARKET, BY TOUCH AVAILABILITY, 2019-2028 (USD MILLION)
TABLE 127 SOUTH AFRICA TOUCH IN PANEL MOUNT INDUSTRIAL DISPLAY MARKET, BY TOUCH TYPE, 2019-2028 (USD MILLION)
TABLE 128 SOUTH AFRICA TOUCH IN PANEL MOUNT INDUSTRIAL DISPLAY MARKET, BY SCREEN TYPE, 2019-2028 (USD MILLION)
TABLE 129 SOUTH AFRICA PANEL MOUNT INDUSTRIAL DISPLAY MARKET, BY APPLICATION, 2019-2028 (USD MILLION)
TABLE 130 SOUTH AFRICA PANEL MOUNT INDUSTRIAL DISPLAY MARKET, BY END USER, 2019-2028 (USD MILLION)
TABLE 131 SOUTH AFRICA MANUFACTURING IN PANEL MOUNT INDUSTRIAL DISPLAY MARKET, BY TECHNOLOGY, 2019-2028 (USD MILLION)
TABLE 132 SOUTH AFRICA MEDICAL IN PANEL MOUNT INDUSTRIAL DISPLAY MARKET, BY TECHNOLOGY, 2019-2028 (USD MILLION)
TABLE 133 SOUTH AFRICA OIL AND GAS IN PANEL MOUNT INDUSTRIAL DISPLAY MARKET, BY TECHNOLOGY, 2019-2028 (USD MILLION)
TABLE 134 SOUTH AFRICA FOOD PROCESSING IN PANEL MOUNT INDUSTRIAL DISPLAY MARKET, BY TECHNOLOGY, 2019-2028 (USD MILLION)
TABLE 135 SOUTH AFRICA TRANSPORTATION IN PANEL MOUNT INDUSTRIAL DISPLAY MARKET, BY TECHNOLOGY, 2019-2028 (USD MILLION)
TABLE 136 SOUTH AFRICA ENERGY AND POWER IN PANEL MOUNT INDUSTRIAL DISPLAY MARKET, BY TECHNOLOGY, 2019-2028 (USD MILLION)
TABLE 137 REST OF MIDDLE EAST AND AFRICA PANEL MOUNT INDUSTRIAL DISPLAY MARKET, BY TECHNOLOGY, 2019-2028 (USD MILLION)
Lista de figuras
FIGURE 1 MIDDLE EAST AND AFRICA PANEL MOUNT INDUSTRIAL DISPLAY MARKET: SEGMENTATION
FIGURE 2 MIDDLE EAST AND AFRICA PANEL MOUNT INDUSTRIAL DISPLAY MARKET: DATA TRIANGULATION
FIGURE 3 MIDDLE EAST AND AFRICA PANEL MOUNT INDUSTRIAL DISPLAY MARKET: DROC ANALYSIS
FIGURE 4 MIDDLE EAST AND AFRICA PANEL MOUNT INDUSTRIAL DISPLAY MARKET: MIDDLE EAST AND AFRICA VS REGIONAL MARKET ANALYSIS
FIGURE 5 MIDDLE EAST AND AFRICA PANEL MOUNT INDUSTRIAL DISPLAY MARKET: COMPANY RESEARCH ANALYSIS
FIGURE 6 MIDDLE EAST AND AFRICA PANEL MOUNT INDUSTRIAL DISPLAY MARKET: INTERVIEW DEMOGRAPHICS
FIGURE 7 MIDDLE EAST AND AFRICA PANEL MOUNT INDUSTRIAL DISPLAY MARKET: DBMR MARKET POSITION GRID
FIGURE 8 MIDDLE EAST AND AFRICA PANEL MOUNT INDUSTRIAL DISPLAY MARKET: VENDOR SHARE ANALYSIS
FIGURE 9 MIDDLE EAST AND AFRICA PANEL MOUNT INDUSTRIAL DISPLAY MARKET: MARKET APPLICATION COVERAGE GRID
FIGURE 10 MIDDLE EAST AND AFRICA PANEL MOUNT INDUSTRIAL DISPLAY MARKET: SEGMENTATION
FIGURE 11 RISING DEMAND FOR MULTI-FEATURED HUMAN MACHINE INTERFACE (HMI) DEVICES IS EXPECTED TO DRIVE MIDDLE EAST AND AFRICA PANEL MOUNT INDUSTRIAL DISPLAY MARKET IN THE FORECAST PERIOD OF 2021 TO 2028
FIGURE 12 LIQUID CRYSTAL DISPLAY (LCD) SEGMENT IS EXPECTED TO ACCOUNT FOR THE LARGEST SHARE OF MIDDLE EAST AND AFRICA PANEL MOUNT INDUSTRIAL DISPLAY MARKET IN 2021 & 2028
FIGURE 13 DRIVERS, RESTRAINT, OPPORTUNITIES AND CHALLENGES OF MIDDLE EAST AND AFRICA PANEL MOUNT INDUSTRIAL DISPLAY MARKET
FIGURE 14 MIDDLE EAST AND AFRICA PANEL MOUNT INDUSTRIAL DISPLAY MARKET: BY TECHNOLOGY, 2020
FIGURE 15 MIDDLE EAST AND AFRICA PANEL MOUNT INDUSTRIAL DISPLAY MARKET: BY PANEL SIZE, 2020
FIGURE 16 MIDDLE EAST AND AFRICA PANEL MOUNT INDUSTRIAL DISPLAY MARKET: BY RESOLUTION, 2020
FIGURE 17 MIDDLE EAST AND AFRICA PANEL MOUNT INDUSTRIAL DISPLAY MARKET: BY TOUCH AVAILABILITY, 2020
FIGURE 18 MIDDLE EAST AND AFRICA PANEL MOUNT INDUSTRIAL DISPLAY MARKET: BY APPLICATION, 2020
FIGURE 19 MIDDLE EAST AND AFRICA PANEL MOUNT INDUSTRIAL DISPLAY MARKET: BY END USER, 2020
FIGURE 20 MIDDLE EAST AND AFRICA PANEL MOUNT INDUSTRIAL DISPLAY MARKET: SNAPSHOT (2020)
FIGURE 21 MIDDLE EAST AND AFRICA PANEL MOUNT INDUSTRIAL DISPLAY MARKET: BY COUNTRY (2020)
FIGURE 22 MIDDLE EAST AND AFRICA PANEL MOUNT INDUSTRIAL DISPLAY MARKET: BY COUNTRY (2021 & 2028)
FIGURE 23 MIDDLE EAST AND AFRICA PANEL MOUNT INDUSTRIAL DISPLAY MARKET: BY COUNTRY (2020 & 2028)
FIGURE 24 MIDDLE EAST AND AFRICA PANEL MOUNT INDUSTRIAL DISPLAY MARKET: BY TECHNOLOGY (2021-2028)
FIGURE 25 MIDDLE EAST AND AFRICA PANEL MOUNT INDUSTRIAL DISPLAY MARKET: COMPANY SHARE 2020 (%)
Metodología de investigación
La recopilación de datos y el análisis del año base se realizan utilizando módulos de recopilación de datos con muestras de gran tamaño. La etapa incluye la obtención de información de mercado o datos relacionados a través de varias fuentes y estrategias. Incluye el examen y la planificación de todos los datos adquiridos del pasado con antelación. Asimismo, abarca el examen de las inconsistencias de información observadas en diferentes fuentes de información. Los datos de mercado se analizan y estiman utilizando modelos estadísticos y coherentes de mercado. Además, el análisis de la participación de mercado y el análisis de tendencias clave son los principales factores de éxito en el informe de mercado. Para obtener más información, solicite una llamada de un analista o envíe su consulta.
La metodología de investigación clave utilizada por el equipo de investigación de DBMR es la triangulación de datos, que implica la extracción de datos, el análisis del impacto de las variables de datos en el mercado y la validación primaria (experto en la industria). Los modelos de datos incluyen cuadrícula de posicionamiento de proveedores, análisis de línea de tiempo de mercado, descripción general y guía del mercado, cuadrícula de posicionamiento de la empresa, análisis de patentes, análisis de precios, análisis de participación de mercado de la empresa, estándares de medición, análisis global versus regional y de participación de proveedores. Para obtener más información sobre la metodología de investigación, envíe una consulta para hablar con nuestros expertos de la industria.
Personalización disponible
Data Bridge Market Research es líder en investigación formativa avanzada. Nos enorgullecemos de brindar servicios a nuestros clientes existentes y nuevos con datos y análisis que coinciden y se adaptan a sus objetivos. El informe se puede personalizar para incluir análisis de tendencias de precios de marcas objetivo, comprensión del mercado de países adicionales (solicite la lista de países), datos de resultados de ensayos clínicos, revisión de literatura, análisis de mercado renovado y base de productos. El análisis de mercado de competidores objetivo se puede analizar desde análisis basados en tecnología hasta estrategias de cartera de mercado. Podemos agregar tantos competidores sobre los que necesite datos en el formato y estilo de datos que esté buscando. Nuestro equipo de analistas también puede proporcionarle datos en archivos de Excel sin procesar, tablas dinámicas (libro de datos) o puede ayudarlo a crear presentaciones a partir de los conjuntos de datos disponibles en el informe.

