Middle East And Africa Lyophilized Injectable Drugs Market
Tamaño del mercado en miles de millones de dólares
Tasa de crecimiento anual compuesta (CAGR) :
% 
 USD
176.55 Million
USD
245.37 Million
2024
2032
USD
176.55 Million
USD
245.37 Million
2024
2032
| 2025 –2032 | |
| USD 176.55 Million | |
| USD 245.37 Million | |
| % | |
|
Segmentación del mercado de fármacos inyectables liofilizados en Oriente Medio y África por envase (viales, jeringas de doble cámara, cartuchos de doble cámara y otros), clase de fármaco (antiinfecciosos, antineoplásicos, diuréticos, inhibidores de la bomba de protones, anestésicos, anticoagulantes, AINE, corticosteroides y otros), forma (polvo y líquido), indicación (oncología, enfermedades autoinmunes, trastornos hormonales, enfermedades respiratorias, trastornos gastrointestinales, trastornos dermatológicos, enfermedades oftálmicas y otras), vía de administración (intravenosa/infusión, intramuscular y otras), usuario final (hospitales, clínicas, atención domiciliaria y otros), canal de distribución (licitación directa, venta minorista y otros): tendencias del sector y previsiones hasta 2032.
Tamaño del mercado de fármacos inyectables liofilizados en Oriente Medio y África
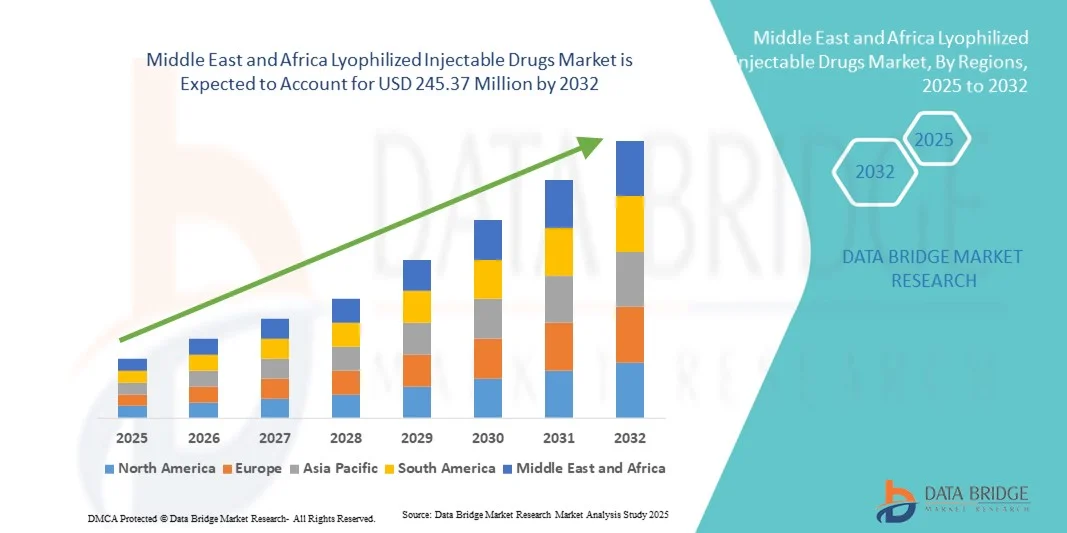
- El mercado de medicamentos inyectables liofilizados en Oriente Medio y África se valoró en 176,55 millones de dólares en 2024 y se prevé que alcance los 245,37 millones de dólares en 2032 , con una tasa de crecimiento anual compuesta (TCAC) del 4,2 % durante el período de previsión.
- El crecimiento del mercado se debe principalmente a la creciente prevalencia de enfermedades crónicas e infecciosas, la mayor demanda de formulaciones con una larga vida útil y la expansión de las capacidades de fabricación biofarmacéutica en toda la región.
- Además, las crecientes inversiones en infraestructura sanitaria, junto con una mayor concienciación sobre las formulaciones inyectables estériles y estables, están fomentando la adopción de fármacos liofilizados tanto en hospitales como en consultas externas. Estos factores, en conjunto, están impulsando la expansión del mercado en Oriente Medio y África.
Análisis del mercado de fármacos inyectables liofilizados en Oriente Medio y África
- Los fármacos inyectables liofilizados, que utilizan la liofilización para mejorar su estabilidad y vida útil, están experimentando una creciente adopción en Oriente Medio y África, a medida que los sistemas sanitarios dan prioridad a las formulaciones fiables, termoestables y estériles tanto para productos biológicos como para terapias con moléculas pequeñas.
- El crecimiento del mercado está impulsado por la creciente prevalencia de enfermedades crónicas e infecciosas , la expansión de la fabricación de productos biológicos y el mayor enfoque en soluciones avanzadas de gestión de la cadena de frío para garantizar la eficacia del producto en diversas condiciones climáticas.
- Arabia Saudita dominó el mercado de medicamentos inyectables liofilizados en Oriente Medio y África con la mayor cuota de ingresos, un 32,8 % en 2024, gracias a las sólidas reformas gubernamentales en materia de salud, las robustas iniciativas de fabricación farmacéutica en el marco de la Visión 2030 y la expansión de la infraestructura hospitalaria.
- Se prevé que Sudáfrica sea el mercado de mayor crecimiento durante el período de pronóstico, impulsado por el aumento de las inversiones en instalaciones sanitarias, la creciente colaboración público-privada y un aumento repentino de la demanda de productos biológicos inyectables y antibióticos.
- El segmento de viales dominó el mercado con la mayor cuota de mercado, un 46,5%, en 2024, debido a su superior estabilidad del producto, su amplia compatibilidad con medicamentos y la continua preferencia en hospitales y entornos clínicos por las formulaciones reconstituibles.
Alcance del informe y segmentación del mercado de fármacos inyectables liofilizados en Oriente Medio y África
|
Atributos |
Información clave del mercado de fármacos inyectables liofilizados en Oriente Medio y África |
|
Segmentos cubiertos |
|
|
Países cubiertos |
Oriente Medio y África
|
|
Principales actores del mercado |
|
|
Oportunidades de mercado |
|
|
Conjuntos de datos de valor añadido |
Además de información sobre escenarios de mercado como el valor de mercado, la tasa de crecimiento, la segmentación, la cobertura geográfica y los principales actores, los informes de mercado elaborados por Data Bridge Market Research también incluyen análisis exhaustivos de expertos, epidemiología de pacientes, análisis de proyectos en desarrollo, análisis de precios y marco regulatorio. |
Tendencias del mercado de fármacos inyectables liofilizados en Oriente Medio y África
Aumento de la demanda de formulaciones con temperatura estable y larga vida útil
- Una tendencia significativa y en auge en el mercado de medicamentos inyectables liofilizados de Oriente Medio y África es la creciente demanda de formulaciones termoestables y de larga vida útil que respondan a los desafíos climáticos de la región y a la limitada infraestructura de la cadena de frío. Esta tendencia está transformando las estrategias de fabricación y distribución farmacéutica.
- Por ejemplo, Saudi Pharmaceutical Industries and Medical Appliances Corporation (SPIMACO) ha ampliado su capacidad de liofilización para mejorar la estabilidad de los fármacos y satisfacer la creciente demanda regional de productos biológicos y vacunas sensibles a la temperatura. De igual modo, Julphar (Gulf Pharmaceutical Industries) ha estado mejorando sus líneas de producción de inyectables para reforzar la durabilidad y la seguridad de sus productos.
- El creciente interés en las formulaciones liofilizadas permite mejorar la manipulación, el transporte y el almacenamiento en las redes de hospitales y clínicas, especialmente en zonas rurales con acceso irregular a la refrigeración. Esto garantiza que los medicamentos inyectables que salvan vidas mantengan su eficacia a lo largo de toda la cadena de suministro.
- Además, la liofilización impulsa el creciente sector biofarmacéutico de la región al permitir a las empresas producir productos biológicos y vacunas de alto valor con mayor estabilidad, facilitando una distribución más amplia en mercados con una logística compleja.
- Esta tendencia hacia una fabricación centrada en la estabilidad está impulsando a las compañías farmacéuticas internacionales y locales a invertir en nuevas tecnologías de liofilización e instalaciones de producción. Por ejemplo, la egipcia Eva Pharma ha introducido unidades de liofilización avanzadas para mejorar su cartera de inyectables.
- Se espera que el creciente énfasis en la estabilidad de las formulaciones y la innovación en la fabricación fortalezca la resiliencia farmacéutica de la región y reduzca la dependencia de las importaciones, impulsando así el crecimiento del mercado a largo plazo.
Dinámica del mercado de fármacos inyectables liofilizados en Oriente Medio y África
Conductor
Expansión de la producción biofarmacéutica y las inversiones en atención médica
- El creciente establecimiento de instalaciones biofarmacéuticas y el aumento de las inversiones en infraestructura sanitaria en Oriente Medio y África son los principales impulsores del crecimiento del mercado de medicamentos liofilizados inyectables.
- Por ejemplo, en marzo de 2024, el Fondo de Inversión Pública de Arabia Saudita anunció nuevas alianzas con empresas farmacéuticas globales para localizar la producción de productos biológicos e inyectables estériles, fomentando la capacidad nacional para formulaciones liofilizadas.
- A medida que los gobiernos priorizan la expansión y la autosuficiencia de la atención médica, la demanda de soluciones inyectables avanzadas con mayor estabilidad sigue creciendo, lo que respalda tanto el suministro hospitalario como la preparación para la atención de emergencias.
- Además, las iniciativas en curso para fortalecer las cadenas de frío farmacéuticas y mejorar el acceso a los productos biológicos están impulsando la adopción de medicamentos liofilizados, que ofrecen ventajas prácticas en regiones con condiciones de almacenamiento limitadas.
- El mayor énfasis en I+D, junto con los incentivos para la fabricación local y la investigación clínica, está posicionando a los países de Oriente Medio y África como centros emergentes para la producción de inyectables estériles.
- Se espera que la creciente colaboración entre los organismos de salud pública y las empresas farmacéuticas privadas acelere la innovación e impulse el crecimiento sostenible del mercado de medicamentos inyectables liofilizados en toda la región.
- Las reformas regulatorias de apoyo, incluidas las aprobaciones aceleradas de medicamentos y las políticas de sustitución de importaciones en Arabia Saudita y Egipto, están impulsando aún más la producción local de medicamentos inyectables liofilizados y su accesibilidad al mercado.
Restricción/Desafío
Altos costos de producción e infraestructura tecnológica limitada
- El elevado coste de los equipos de liofilización, combinado con la limitada experiencia regional y la escasa infraestructura tecnológica, supone un importante desafío para la expansión del mercado en Oriente Medio y África.
- Por ejemplo, los fabricantes más pequeños de los países africanos a menudo se enfrentan a dificultades para establecer instalaciones de producción estériles que cumplan con la normativa, debido a la gran inversión de capital que requiere la tecnología de liofilización y sus requisitos de mantenimiento.
- El acceso limitado a equipos avanzados de liofilización y a personal técnico cualificado restringe la adopción a gran escala y ralentiza la transferencia de tecnología de los líderes farmacéuticos mundiales.
- Además, la carga de costes asociada a la validación, el control de calidad y el cumplimiento normativo aumenta los gastos generales de producción, lo que disuade a algunas empresas locales de entrar en el mercado.
- Abordar estos desafíos mediante alianzas internacionales, capacitación de la fuerza laboral e incentivos gubernamentales para el avance tecnológico será fundamental para mejorar las capacidades nacionales de liofilización y fomentar el desarrollo del mercado a largo plazo.
- La limitada disponibilidad de financiación y apoyo de capital riesgo para la innovación farmacéutica en varias economías africanas sigue restringiendo el aumento de la capacidad de fabricación de medicamentos liofilizados.
- Las demoras en las aprobaciones regulatorias y la inconsistencia en los estándares de control de calidad entre los diferentes países de la región dificultan la distribución fluida de los productos y desalientan la inversión extranjera directa en plantas de liofilización.
Alcance del mercado de fármacos inyectables liofilizados en Oriente Medio y África
El mercado está segmentado en función del envase, la clase de fármaco, la forma farmacéutica, la indicación, la vía de administración, el usuario final y el canal de distribución.
- Por embalaje
Según el tipo de envase, el mercado se segmenta en viales, jeringas de doble cámara, cartuchos de doble cámara y otros. El segmento de viales dominó el mercado con la mayor cuota de ingresos (46,5 %) en 2024, impulsado por su amplio uso en el almacenamiento de fármacos liofilizados debido a su protección superior contra la contaminación y la exposición ambiental. Los viales son económicos, fáciles de manejar y aptos para múltiples reconstituciones, lo que los hace ideales para las farmacias hospitalarias. Su durabilidad y compatibilidad con diversas clases terapéuticas, incluidas vacunas, antibióticos y productos biológicos, refuerzan su posición dominante. Además, los fabricantes farmacéuticos de Arabia Saudita y Egipto prefieren los viales por sus sencillos mecanismos de sellado y su compatibilidad con las líneas de llenado automatizadas. El crecimiento de este segmento se ve impulsado aún más por el aumento de la producción de formulaciones inyectables de alto volumen para el tratamiento de enfermedades crónicas.
Se prevé que el segmento de jeringas de doble cámara experimente el mayor crecimiento durante el período de pronóstico, impulsado por la creciente adopción de formulaciones listas para usar tanto en hospitales como en el ámbito de la atención domiciliaria. Las jeringas de doble cámara permiten la reconstitución del fármaco inmediatamente antes de su administración, lo que reduce el riesgo de contaminación y el tiempo de preparación. Por ejemplo, las empresas farmacéuticas en los Emiratos Árabes Unidos están introduciendo sistemas de doble cámara para mejorar la seguridad y la comodidad del paciente. Su facilidad de manejo y su diseño de un solo uso las hacen idóneas para aplicaciones de productos biológicos y atención de urgencias. La creciente aceptación de los inyectables autoadministrables por parte de los profesionales clínicos también está impulsando la rápida expansión de este segmento.
- Por clase de fármaco
Según su clase farmacológica, el mercado se segmenta en antiinfecciosos, antineoplásicos, diuréticos, inhibidores de la bomba de protones, anestésicos, anticoagulantes, AINE, corticosteroides y otros. El segmento de antiinfecciosos dominó el mercado en 2024 debido a la alta prevalencia de infecciones bacterianas y virales en Oriente Medio y África. Los antiinfecciosos liofilizados ofrecen una larga vida útil y una mayor estabilidad a temperaturas extremas, lo que permite superar las limitaciones de la cadena de frío en varios países africanos. Los hospitales de Arabia Saudita, Egipto y Kenia dependen en gran medida de estos fármacos para la atención crítica y de urgencias. El creciente interés por reducir la resistencia antimicrobiana ha impulsado el uso de antibióticos inyectables en formulaciones controladas. Además, los programas gubernamentales de adquisición de antiinfecciosos inyectables esenciales han fortalecido aún más el crecimiento de este segmento.
Se prevé que el segmento de fármacos antineoplásicos experimente el crecimiento más rápido durante el período de pronóstico, impulsado por la creciente carga del cáncer y la expansión de la infraestructura de tratamiento oncológico. Los fármacos antineoplásicos liofilizados son los preferidos por su mayor estabilidad y dosificación precisa. Por ejemplo, los centros oncológicos egipcios y sudafricanos están invirtiendo en formulaciones liofilizadas para mantener la potencia de los fármacos citotóxicos. Los avances en terapias biológicas y tratamientos dirigidos también dependen en gran medida de los formatos de administración liofilizados. Este segmento se beneficia de una mayor concienciación de los pacientes y un mejor acceso a la atención oncológica, respaldado por los programas nacionales de tratamiento del cáncer.
- Por formulario
Según su presentación, el mercado se divide en polvo y líquido. El segmento de polvo dominó el mercado en 2024, con la mayor cuota de ingresos gracias a su excepcional estabilidad y mayor vida útil. Los fármacos liofilizados en polvo son más fáciles de almacenar y transportar a diferentes temperaturas, una ventaja crucial en regiones con refrigeración limitada. Las empresas farmacéuticas de Arabia Saudita y Egipto utilizan ampliamente formulaciones en polvo para productos biológicos, vacunas y antibióticos. Su fácil reconstitución y el menor riesgo de degradación los hacen ideales para las farmacias hospitalarias. Además, su rentabilidad en la producción a gran escala contribuye a una demanda sostenida en el mercado.
Se prevé que el segmento de líquidos experimente el mayor crecimiento durante el período de pronóstico, impulsado por la creciente preferencia por las formulaciones inyectables listas para usar. Estos productos reducen el tiempo de preparación y son especialmente útiles en entornos de urgencias y cuidados intensivos. Por ejemplo, las empresas farmacéuticas con sede en los Emiratos Árabes Unidos están produciendo cada vez más inyectables líquidos liofilizados para anestésicos y anticoagulantes. Las mejoras en el llenado aséptico y la tecnología de jeringas precargadas están impulsando el crecimiento del mercado. Además, este segmento se beneficia de la creciente tendencia hacia medicamentos inyectables fáciles de usar y de autoadministración.
- Por indicación
Según la indicación, el mercado se segmenta en oncología, enfermedades autoinmunes, trastornos hormonales, enfermedades respiratorias, trastornos gastrointestinales, trastornos dermatológicos, enfermedades oftalmológicas y otras. El segmento de oncología dominó el mercado con la mayor cuota en 2024, impulsado por la creciente incidencia del cáncer y el mayor acceso a terapias avanzadas. Las formulaciones liofilizadas garantizan la estabilidad y la eficacia de los agentes quimioterapéuticos, que suelen ser sensibles a la temperatura. Los principales hospitales de Arabia Saudita, Egipto y Sudáfrica utilizan inyectables oncológicos liofilizados para obtener resultados terapéuticos consistentes. Estas formulaciones también permiten una gestión eficiente del inventario en las farmacias hospitalarias centralizadas. La continua expansión de los centros de tratamiento oncológico en toda la región sigue impulsando el crecimiento del segmento.
Se prevé que el segmento de enfermedades autoinmunes registre la tasa de crecimiento anual compuesto (TCAC) más rápida durante el período de pronóstico, debido al aumento en el diagnóstico de artritis reumatoide, psoriasis y lupus. Los productos biológicos liofilizados se están convirtiendo en esenciales para el manejo de estas afecciones crónicas debido a su mayor estabilidad y menor riesgo de degradación. Por ejemplo, los proveedores de atención médica en Egipto y los Emiratos Árabes Unidos están adoptando cada vez más anticuerpos monoclonales liofilizados para la terapia de enfermedades autoinmunes. Los avances tecnológicos en el desarrollo de fármacos biológicos y las estructuras de reembolso favorables impulsan aún más el crecimiento de este segmento.
- Por vía administrativa
Según la vía de administración, el mercado se segmenta en intravenosa/infusión, intramuscular y otras. El segmento de vía intravenosa/infusión dominó el mercado en 2024, debido a su uso generalizado en hospitales para la administración de antibióticos, quimioterapia y productos biológicos. La administración intravenosa garantiza una biodisponibilidad inmediata y un efecto terapéutico rápido, lo cual es fundamental en cuidados intensivos. Los hospitales de Arabia Saudita y los Emiratos Árabes Unidos utilizan ampliamente medicamentos intravenosos liofilizados por su estabilidad y esterilidad. Además, la creciente demanda de productos biológicos y tratamientos de emergencia sigue reforzando el dominio de este segmento. Las inversiones continuas en infraestructura hospitalaria y centros de infusión fortalecen aún más las perspectivas de crecimiento.
Se prevé que el segmento intramuscular experimente el crecimiento más rápido durante el período de pronóstico, impulsado por su conveniencia para la atención ambulatoria y domiciliaria. Las formulaciones intramusculares son más fáciles de administrar y requieren un mínimo de equipo, lo que las hace idóneas para entornos con recursos limitados. Por ejemplo, Kenia y Egipto están ampliando sus programas de vacunación utilizando medicamentos intramusculares liofilizados. La menor necesidad de supervisión profesional y la recuperación más rápida de los pacientes hacen que esta vía sea cada vez más popular. El creciente conocimiento sobre la autoadministración y los inyectables de acción prolongada también contribuye a su crecimiento.
- Por usuario final
Según el usuario final, el mercado se segmenta en hospitales, clínicas, atención domiciliaria y otros. El segmento hospitalario ostentó la mayor cuota de mercado en 2024, impulsado por el elevado volumen de uso de medicamentos inyectables en pacientes hospitalizados y en urgencias. Los hospitales constituyen el principal centro de atención para oncología, enfermedades infecciosas y afecciones críticas que requieren medicamentos liofilizados. Sus sistemas centralizados de adquisición y entornos de almacenamiento controlado favorecen las formulaciones liofilizadas. Por ejemplo, los hospitales de Arabia Saudita y Egipto han implementado soluciones avanzadas de cadena de frío para la gestión a gran escala de medicamentos inyectables. La disponibilidad de personal médico capacitado contribuye aún más al dominio de este segmento.
Se prevé que el segmento de atención médica domiciliaria experimente el mayor crecimiento anual compuesto, impulsado por la creciente tendencia hacia las terapias inyectables autoadministradas y la monitorización remota de pacientes. Los pacientes prefieren los inyectables liofilizados por su facilidad de reconstitución y portabilidad. Por ejemplo, en los Emiratos Árabes Unidos y Sudáfrica, los pacientes con trastornos hormonales y autoinmunitarios utilizan cada vez más kits de inyección para uso doméstico. El auge de la telemedicina y las plataformas de salud digital ha mejorado el acceso a la orientación para la administración en el hogar. El aumento de los costos de la atención médica también está impulsando a los pacientes a optar por tratamientos convenientes en casa.
- Por canal de distribución
Según el canal de distribución, el mercado se segmenta en licitación directa, venta minorista y otros. El segmento de licitación directa dominó el mercado en 2024, ya que los hospitales públicos y los sistemas de salud gubernamentales adquieren medicamentos liofilizados al por mayor mediante licitaciones centralizadas. Esto garantiza un suministro constante y el control de costos en toda la red sanitaria. El sistema unificado de adquisiciones de Arabia Saudita, a través de la Compañía Nacional Unificada de Adquisiciones (NUPCO), y los programas de compras al por mayor del Ministerio de Salud de Egipto respaldan este dominio. La licitación directa también garantiza el control de calidad y la transparencia de precios de los medicamentos esenciales. Este segmento se beneficia del sólido apoyo gubernamental para el acceso a la atención médica y la localización de la industria farmacéutica.
Se prevé que el segmento de ventas minoristas experimente el crecimiento más rápido durante el período de pronóstico, debido a la creciente presencia de farmacias especializadas y cadenas de distribución que ofrecen formulaciones inyectables. Por ejemplo, las cadenas de farmacias privadas en los Emiratos Árabes Unidos y Sudáfrica están aumentando su inventario de productos biológicos liofilizados e inyectables para enfermedades crónicas. El creciente conocimiento del consumidor y la comodidad de comprar a través de farmacias locales impulsan el dinamismo de este segmento. El crecimiento de las farmacias en línea y los distribuidores en línea autorizados también contribuye a la expansión del alcance minorista en los mercados urbanos y semiurbanos.
Análisis regional del mercado de fármacos inyectables liofilizados en Oriente Medio y África
- Arabia Saudita dominó el mercado de medicamentos inyectables liofilizados en Oriente Medio y África con la mayor cuota de ingresos, un 32,8 % en 2024, gracias a las sólidas reformas gubernamentales en materia de salud, las robustas iniciativas de fabricación farmacéutica en el marco de la Visión 2030 y la expansión de la infraestructura hospitalaria.
- Países como Arabia Saudita, los Emiratos Árabes Unidos y Sudáfrica lideran la adopción de esta tecnología, gracias a la expansión de sus capacidades de fabricación farmacéutica y a las inversiones gubernamentales en infraestructura sanitaria.
- Además, la creciente prevalencia de enfermedades crónicas como el cáncer, los trastornos autoinmunitarios y las afecciones respiratorias ha aumentado la demanda de fármacos liofilizados que garantizan una mayor vida útil y una eficacia constante.
Análisis del mercado de fármacos inyectables liofilizados en Arabia Saudita
En 2024, el mercado saudí de medicamentos inyectables liofilizados ostentó la mayor cuota de ingresos en Oriente Medio y África, impulsado por la sólida inversión gubernamental en la producción nacional de fármacos en el marco de la Visión 2030 y la creciente demanda de formulaciones parenterales avanzadas. El sector biofarmacéutico en expansión del país y su énfasis en la autosuficiencia en productos sanitarios son factores clave para este crecimiento. Además, las alianzas estratégicas con empresas farmacéuticas internacionales para establecer plantas de fabricación locales están fortaleciendo el suministro de medicamentos liofilizados. El desarrollo de la infraestructura hospitalaria y el creciente enfoque en los tratamientos oncológicos y de enfermedades infecciosas contribuyen aún más al crecimiento del mercado.
Perspectivas del mercado de fármacos inyectables liofilizados en los Emiratos Árabes Unidos
Se prevé que el mercado de medicamentos inyectables liofilizados de los EAU experimente un crecimiento sustancial durante el período de pronóstico, impulsado por la expansión de la infraestructura sanitaria, un marco regulatorio sólido y el enfoque del gobierno en la innovación en ciencias de la vida. La creciente preferencia por los inyectables liofilizados en entornos de atención especializada y la inversión del país en zonas francas farmacéuticas, como el Parque Científico de Dubái, están acelerando su adopción. Además, la creciente colaboración entre distribuidores locales y fabricantes farmacéuticos multinacionales está mejorando el acceso a inyectables estériles de alta calidad. El papel de los EAU como centro médico en la región del Golfo sigue atrayendo a importantes empresas que buscan consolidar su presencia en el mercado.
Perspectivas del mercado de medicamentos inyectables liofilizados en Sudáfrica
Se prevé que el mercado sudafricano de medicamentos inyectables liofilizados experimente un crecimiento anual compuesto significativo durante el período de pronóstico, impulsado por la creciente prevalencia de enfermedades crónicas e infecciosas y el aumento del gasto público en salud. La industria farmacéutica del país se centra en ampliar su capacidad de fabricación estéril, especialmente en oncología y medicamentos antiinfecciosos. Las iniciativas gubernamentales para mejorar la capacidad de producción local y reducir la dependencia de las importaciones están fomentando el desarrollo del mercado. Además, la creciente concienciación sobre las ventajas de las formulaciones liofilizadas para garantizar la estabilidad de los medicamentos y una mayor vida útil está impulsando su adopción tanto en el sector público como en el privado de la salud.
Perspectivas del mercado egipcio de fármacos inyectables liofilizados
Se prevé que el mercado egipcio de medicamentos inyectables liofilizados experimente un sólido crecimiento durante el período de pronóstico, debido al rápido crecimiento demográfico, el aumento del gasto en salud y el incremento de las inversiones en la fabricación nacional de medicamentos. Los esfuerzos del gobierno por localizar la producción farmacéutica y las alianzas con empresas internacionales para introducir tecnologías avanzadas de liofilización están impulsando la capacidad del mercado. La fuerte demanda de inyectables oncológicos y antiinfecciosos también está impulsando la expansión del segmento. Además, las políticas regulatorias favorables y las iniciativas que promueven el acceso a la atención médica en las zonas rurales están favoreciendo una mayor adopción de formulaciones liofilizadas.
Cuota de mercado de fármacos inyectables liofilizados en Oriente Medio y África
La industria de medicamentos inyectables liofilizados en Oriente Medio y África está liderada principalmente por empresas bien establecidas, entre las que se incluyen:
- Pfizer Inc. (EE. UU.)
- Sanofi (Francia)
- GSK plc. (Reino Unido)
- F. Hoffmann-La Roche Ltd (Suiza)
- Novartis AG (Suiza)
- Merck & Co., Inc., (EE. UU.)
- Johnson & Johnson Services, Inc. (EE. UU.)
- Baxter (EE. UU.)
- Fresenius Kabi AG (Alemania)
- B. Braun SE (Alemania)
- Industrias Farmacéuticas Teva Ltd. (Israel)
- Hikma Pharmaceuticals PLC (Jordania)
- Industrias farmacéuticas del Golfo (EAU)
- Aspen Pharmacare Holdings Limited (Sudáfrica)
- Cipla (India)
- Viatris Inc. (EE. UU.)
- Amgen Inc. (EE. UU.)
- Novo Nordisk A/S (Dinamarca)
- Biocon Limited (India)
¿Cuáles son los últimos avances en el mercado de medicamentos inyectables liofilizados en Oriente Medio y África?
- En febrero de 2025, el Centro Africano para el Control y la Prevención de Enfermedades (CDC de África) informó sobre avances concretos en su “2.º Foro de Fabricación de Vacunas y Otros Productos Sanitarios” (celebrado en El Cairo), donde se anunciaron nuevas alianzas e hitos operativos bajo el auspicio de la AVMA. Por ejemplo, la empresa egipcia EVA Pharma se asoció con empresas biotecnológicas europeas para establecer una plataforma integral de desarrollo y producción de productos biológicos/ARNm en África.
- En junio de 2024, Gavi, la Alianza para las Vacunas, en colaboración con los Centros Africanos para el Control y la Prevención de Enfermedades (CDC de África) y la Unión Africana, lanzó oficialmente el Acelerador Africano de Fabricación de Vacunas (AVMA), un mecanismo de financiación que se espera que destine entre 1.000 y 1.200 millones de dólares estadounidenses durante diez años al desarrollo de la fabricación de vacunas (y productos sanitarios) en África.
- En septiembre de 2021, Sinovac Biotech anunció que estaba en conversaciones para establecer una planta de fabricación en Sudáfrica (o asociarse con una) que cubriría la producción de vacunas para África, incluyendo el envasado, el etiquetado y, eventualmente, la producción completa.
- En agosto de 2021, Egipto anunció que su nueva planta VACSERA (denominada "ciudad de las vacunas" por los medios) comenzaría a operar alrededor de noviembre de 2021 y tendría como objetivo una capacidad anual de aproximadamente mil millones de dosis, posicionando a Egipto como un centro de suministro de vacunas para África.
- En junio de 2021, VACSERA (Egipto) y Sinovac Biotech firmaron un acuerdo para iniciar la producción local de la vacuna contra la COVID-19 de Sinovac en Egipto y la región africana en general, lo que representó un primer paso hacia la regionalización de la fabricación de vacunas inyectables. Según Reuters, Egipto planeaba comenzar la producción de viales a mediados de junio, tras recibir las materias primas para un primer lote de dosis.
SKU-
Obtenga acceso en línea al informe sobre la primera nube de inteligencia de mercado del mundo
- Panel de análisis de datos interactivo
- Panel de análisis de empresas para oportunidades con alto potencial de crecimiento
- Acceso de analista de investigación para personalización y consultas
- Análisis de la competencia con panel interactivo
- Últimas noticias, actualizaciones y análisis de tendencias
- Aproveche el poder del análisis de referencia para un seguimiento integral de la competencia
Metodología de investigación
La recopilación de datos y el análisis del año base se realizan utilizando módulos de recopilación de datos con muestras de gran tamaño. La etapa incluye la obtención de información de mercado o datos relacionados a través de varias fuentes y estrategias. Incluye el examen y la planificación de todos los datos adquiridos del pasado con antelación. Asimismo, abarca el examen de las inconsistencias de información observadas en diferentes fuentes de información. Los datos de mercado se analizan y estiman utilizando modelos estadísticos y coherentes de mercado. Además, el análisis de la participación de mercado y el análisis de tendencias clave son los principales factores de éxito en el informe de mercado. Para obtener más información, solicite una llamada de un analista o envíe su consulta.
La metodología de investigación clave utilizada por el equipo de investigación de DBMR es la triangulación de datos, que implica la extracción de datos, el análisis del impacto de las variables de datos en el mercado y la validación primaria (experto en la industria). Los modelos de datos incluyen cuadrícula de posicionamiento de proveedores, análisis de línea de tiempo de mercado, descripción general y guía del mercado, cuadrícula de posicionamiento de la empresa, análisis de patentes, análisis de precios, análisis de participación de mercado de la empresa, estándares de medición, análisis global versus regional y de participación de proveedores. Para obtener más información sobre la metodología de investigación, envíe una consulta para hablar con nuestros expertos de la industria.
Personalización disponible
Data Bridge Market Research es líder en investigación formativa avanzada. Nos enorgullecemos de brindar servicios a nuestros clientes existentes y nuevos con datos y análisis que coinciden y se adaptan a sus objetivos. El informe se puede personalizar para incluir análisis de tendencias de precios de marcas objetivo, comprensión del mercado de países adicionales (solicite la lista de países), datos de resultados de ensayos clínicos, revisión de literatura, análisis de mercado renovado y base de productos. El análisis de mercado de competidores objetivo se puede analizar desde análisis basados en tecnología hasta estrategias de cartera de mercado. Podemos agregar tantos competidores sobre los que necesite datos en el formato y estilo de datos que esté buscando. Nuestro equipo de analistas también puede proporcionarle datos en archivos de Excel sin procesar, tablas dinámicas (libro de datos) o puede ayudarlo a crear presentaciones a partir de los conjuntos de datos disponibles en el informe.