
Middle East And Africa Gummies And Jellies Market
Tamaño del mercado en miles de millones de dólares
Tasa de crecimiento anual compuesta (CAGR) :
% 
 USD
9.02 Billion
USD
16.95 Billion
2024
2032
USD
9.02 Billion
USD
16.95 Billion
2024
2032
| 2025 –2032 | |
| USD 9.02 Billion | |
| USD 16.95 Billion | |
| % | |
|
Segmentación del mercado de gomitas y jaleas en Oriente Medio y África, por tipo de producto (gomitas y jaleas), tipo (gomitas de suplemento, gomitas tradicionales, gomitas bajas en azúcar y gomitas sin azúcar), ingrediente de la gelatina (pectina de alto metoxilo [HMP] y pectina de bajo metoxilo [LMP]), consumidor objetivo (adultos y niños), categoría (OGM y no OMG), sabores (cereza, melocotón, matcha, coco, café, fresa, limón, manzana, naranja, miel y jengibre, mango, sandía, piña, granada, frambuesa, uvas, chocolate, lima, combinación y otros), ingrediente (gelatina, pectina, almidón, azúcar, jarabe de glucosa, ácido cítrico y otros), tipo de embalaje (botellas y frascos, bolsas verticales, sobres, paquetes, bandejas para tiendas y otros), canal de distribución (venta minorista en tiendas y venta minorista fuera de tiendas) Comercio minorista): tendencias de la industria y pronóstico hasta 2032
¿Cuál es el tamaño y la tasa de crecimiento del mercado de gomitas y jaleas en Oriente Medio y África?
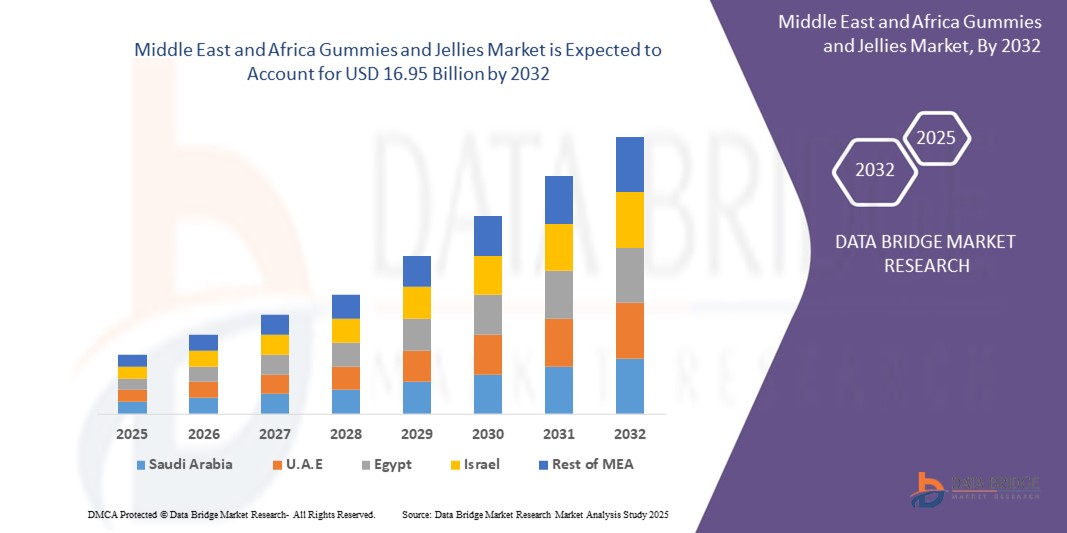
- El tamaño del mercado de gomitas y jaleas de Oriente Medio y África se valoró en 9.020 millones de dólares en 2024 y se espera que alcance los 16.950 millones de dólares en 2032 , con una CAGR del 8,20 % durante el período de pronóstico.
- Las gomitas y jaleas son productos de confitería suaves y masticables elaborados principalmente con azúcar, gelatina, extractos de frutas y agentes saborizantes, a menudo enriquecidos con vitaminas o ingredientes funcionales.
- En esta región, los cambios en los estilos de vida de los consumidores, el aumento de los ingresos disponibles y la mayor demanda de refrigerios dulces y convenientes han impulsado significativamente el consumo de gomitas y jaleas.
- Los fabricantes están introduciendo cada vez más variantes con certificación halal, sin azúcar y enriquecidas con vitaminas para satisfacer las diversas preferencias dietéticas y la población preocupada por la salud en Oriente Medio y África.
¿Cuáles son las principales conclusiones del mercado de gomitas y jaleas?
- Las gomitas y jaleas se utilizan cada vez más como portadores nutracéuticos, ofreciendo beneficios adicionales para la salud mediante la inclusión de vitaminas, minerales y extractos de hierbas.
- En Oriente Medio y África, existe una creciente demanda de productos de etiqueta limpia y sin gelatina elaborados con ingredientes naturales, en consonancia con consideraciones religiosas y culturales.
- El mercado también está presenciando un aumento en las gomitas enfocadas en los niños en formas y sabores divertidos, así como en productos dirigidos a adultos para el bienestar, la inmunidad y el apoyo al sueño.
- Se proyecta que los Emiratos Árabes Unidos dominarán el mercado de gomitas y jaleas de Medio Oriente y África con la mayor participación en los ingresos del 54,36 % en 2024, impulsado por el alto poder adquisitivo de los consumidores, una fuerte preferencia por los dulces de primera calidad y la disponibilidad de una amplia gama de productos gomosos importados y producidos localmente.
- Se espera que el mercado de gomitas y jaleas de Arabia Saudita crezca a la CAGR más rápida hasta 2032, respaldado por el creciente interés de los consumidores en refrigerios saludables, el aumento de los ingresos disponibles y la modernización de los canales minoristas.
- El segmento de gomitas tradicionales dominó el mercado con la mayor participación en ingresos, un 57,6 % en 2024, gracias a su gran atractivo como refrigerio indulgente para todos los grupos de edad. Las gomitas tradicionales están disponibles en una variedad de sabores y texturas, lo que las convierte en una opción predilecta para el refrigerio diario.
Alcance del informe y segmentación del mercado de gomitas y gelatinas
|
Atributos |
Información clave del mercado de gomitas y jaleas |
|
Segmentos cubiertos |
|
|
Países cubiertos |
Oriente Medio y África
|
|
Actores clave del mercado |
|
|
Oportunidades de mercado |
|
|
Conjuntos de información de datos de valor añadido |
Además de los conocimientos sobre escenarios de mercado, como valor de mercado, tasa de crecimiento, segmentación, cobertura geográfica y actores principales, los informes de mercado seleccionados por Data Bridge Market Research también incluyen análisis en profundidad de expertos, análisis de precios, análisis de participación de marca, encuesta de consumidores, análisis demográfico, análisis de la cadena de suministro, análisis de la cadena de valor, descripción general de materias primas/consumibles, criterios de selección de proveedores, análisis PESTLE, análisis de Porter y marco regulatorio. |
¿Cuál es la tendencia clave en el mercado de gomitas y jaleas?
Etiqueta limpia e innovación funcional en confitería
- Una tendencia significativa en el mercado de gomitas y jaleas de Oriente Medio y África es la creciente preferencia por productos dulces de etiqueta limpia, naturales y funcionales. Los consumidores exigen transparencia, con una tendencia hacia productos sin OMG, sin colorantes artificiales ni gelatina.
- Por ejemplo, en 2023, Jelly Belly y Nature's Truth introdujeron gomitas enriquecidas con vitaminas con agentes gelificantes de origen vegetal diseñadas para consumidores veganos y conscientes de la salud en la región.
- La confitería funcional está ganando impulso, con productos fortificados con vitaminas, probióticos y extractos de hierbas para apoyar la inmunidad, el sueño y la energía.
- Esta tendencia se ve respaldada además por una mayor concienciación sobre la salud y la diversificación dietética, lo que lleva a las empresas a reformular las recetas y explorar agentes gelificantes innovadores como la pectina y el agar.
- En última instancia, la tendencia hacia las gomitas naturales y funcionales está transformando el desarrollo de productos e impulsando inversiones en innovación de ingredientes y estrategias de marca transparentes en toda la región.
¿Cuáles son los impulsores clave del mercado de gomitas y jaleas?
- La creciente demanda de dulces enriquecidos nutricionalmente y con bajo contenido de azúcar es un motor clave del crecimiento, especialmente entre padres y millennials que buscan indulgencias sin culpa para ellos y sus hijos.
- Por ejemplo, en enero de 2024, Nestlé lanzó una línea de gelatinas de frutas con bajo contenido de azúcar enriquecidas con vitamina C en la región del Golfo, alineándose con las tendencias de bienestar.
- El aumento de la urbanización y los cambios en los hábitos de consumo de refrigerios están impulsando las ventas de gomitas y jaleas convenientes, portátiles y con porciones controladas.
- La expansión de las plataformas organizadas de comercio minorista y comercio electrónico está mejorando la accesibilidad a los productos, especialmente en mercados de rápido crecimiento como los Emiratos Árabes Unidos, Arabia Saudita y Sudáfrica.
- Además, la creciente conciencia sobre las alternativas basadas en plantas y con certificación halal está ampliando el interés de los consumidores en diversos grupos demográficos.
¿Qué factor está desafiando el crecimiento del mercado de gomitas y jaleas?
- Un desafío clave en el mercado es la percepción de salud asociada con los dulces azucarados, particularmente entre los consumidores diabéticos y conscientes del peso.
- Por ejemplo, las preocupaciones sobre el alto contenido de azúcar han motivado un escrutinio regulatorio, incluidos impuestos al azúcar en países como Sudáfrica, lo que afecta las ventas de productos tradicionales.
- La disponibilidad y el costo de los agentes gelificantes naturales como la pectina y el agar siguen siendo inconsistentes en algunas partes de la región, lo que limita los esfuerzos generalizados de reformulación.
- El aumento de los precios de las materias primas, junto con la dependencia de las importaciones de ingredientes especializados, está afectando los márgenes de ganancia y los precios de los productos.
- Abordar estos desafíos mediante sustitutos innovadores del azúcar, el abastecimiento de ingredientes locales y la educación del consumidor será crucial para garantizar un crecimiento sostenido del mercado en Medio Oriente y África.
¿Cómo está segmentado el mercado de gomitas y jaleas?
El mercado está segmentado según el tipo, el protocolo de comunicación, el mecanismo de desbloqueo y la aplicación.
• Por tipo de producto
Según el tipo de producto, el mercado de gomitas y jaleas se segmenta en gomitas de suplemento y gomitas tradicionales. El segmento de gomitas tradicionales dominó el mercado con la mayor participación en ingresos, un 57,6 %, en 2024, gracias a su gran atractivo como refrigerio indulgente para todos los grupos de edad. Las gomitas tradicionales están disponibles en una variedad de sabores y texturas, lo que las convierte en una opción predilecta para el refrigerio diario.
Se proyecta que el segmento de gomitas suplementarias experimentará la CAGR más rápida entre 2025 y 2032, respaldado por la creciente demanda de los consumidores de productos de confitería funcionales enriquecidos con vitaminas, minerales e ingredientes a base de hierbas.
• Por tipo
En cuanto al tipo, el segmento de gomitas bajas en azúcar representó la mayor cuota de mercado, con un 35,4%, en 2024, debido a que los consumidores son cada vez más conscientes de su consumo de azúcar. Estos productos equilibran el sabor con perfiles más saludables, lo que los hace adecuados tanto para adultos como para niños.
Se espera que el segmento de gomitas sin azúcar crezca a la CAGR más rápida, impulsado por el aumento de las poblaciones diabéticas y las tendencias dietéticas que promueven estilos de vida bajos en carbohidratos y cetogénicos.
• Por ingrediente de gelatina
Según el ingrediente de la gelatina, el mercado se segmenta en pectina de alto metoxilo (HMP) y pectina de bajo metoxilo (LMP). El segmento de pectina de alto metoxilo lideró el mercado con una participación en los ingresos del 61,2 % en 2024, gracias a su amplio uso en entornos ácidos y con alto contenido de azúcar, como en gelatinas y dulces de frutas.
Mientras tanto, el segmento de pectina de bajo metoxilo está ganando terreno por su aplicación en formulaciones con bajo contenido de azúcar y sin azúcar, y se proyecta que crecerá significativamente hasta 2032.
• Por consumidor objetivo
Según el público objetivo, el mercado se segmenta en adultos y niños. El segmento de adultos dominó con una participación en los ingresos del 54,8 % en 2024, impulsado por la creciente adopción de gomitas para mejorar la inmunidad, aliviar el estrés y el bienestar general.
Se espera que el segmento infantil crezca a un ritmo rápido, apoyado por la popularidad de los suplementos gomosos con sabor a frutas y enriquecidos con vitaminas que son fáciles de consumir para los niños.
• Por categoría
Según la categoría, el mercado se divide en productos transgénicos y no transgénicos. El segmento no transgénico tuvo la mayor participación de mercado, con un 59,5 %, en 2024, ya que la preferencia por las etiquetas limpias y la demanda de ingredientes naturales siguen influyendo en las decisiones de compra.
Se espera que la creciente conciencia regulatoria y la confianza de los consumidores en los productos naturales impulsen aún más este segmento durante el período de pronóstico.
• Por sabores
En cuanto a sabores, el mercado se segmenta en una amplia gama de sabores, incluyendo fresa, naranja, limón, cereza, uva, mango, granada, manzana, melocotón, miel y jengibre, chocolate, matcha, café, coco, sandía, piña, frambuesa, lima, combinados y otros. El segmento de sabor fresa lideró el mercado con una cuota de mercado dominante del 12,3 % en 2024, gracias a su amplia aceptación entre niños y adultos.
Sabores como Miel y Jengibre y Matcha están ganando popularidad por sus beneficios percibidos para la salud y se proyecta que registren un rápido crecimiento durante el período de pronóstico.
• Por ingrediente
Según sus ingredientes, el mercado se segmenta en gelatina, pectina, almidón, azúcar, jarabe de glucosa, ácido cítrico y otros. El segmento de gelatina tuvo la mayor participación de mercado, con un 41,8 %, en 2024, gracias a sus excelentes propiedades gelificantes y a su amplio uso en la producción tradicional de gomitas.
Sin embargo, se prevé que la pectina crezca al ritmo más rápido debido a la creciente demanda de alternativas vegetales y veganas.
• Por tipo de embalaje
Según el tipo de envase, el mercado se segmenta en botellas y frascos, bolsas stand-up, sobres, bandejas para tiendas y otros. El segmento de botellas y frascos dominó con la mayor participación, un 38,6 %, en 2024, gracias a su practicidad, capacidad de resellado y popularidad en las gomitas vitamínicas.
Las bolsas stand up están surgiendo como el segmento de más rápido crecimiento debido a su diseño liviano y flexible y su atractivo visual en los estantes minoristas.
• Por canal de distribución
Según el canal de distribución, el mercado se segmenta en comercio minorista en tiendas físicas y comercio minorista sin tiendas físicas. En 2024, el comercio minorista en tiendas físicas ocupó la cuota de mercado dominante, con un 66,9 %, siendo los supermercados, hipermercados y farmacias los principales puntos de venta.
Se proyecta que el segmento de venta minorista sin tiendas, que incluye el comercio electrónico y las plataformas de venta directa al consumidor, crezca rápidamente, impulsado por la conveniencia digital y el aumento de las compras de suplementos en línea.
¿Qué región posee la mayor participación en el mercado de gomitas y jaleas?
- Se proyecta que los Emiratos Árabes Unidos dominarán el mercado de gomitas y jaleas de Medio Oriente y África con la mayor participación en los ingresos del 54,36 % en 2024, impulsado por el alto poder adquisitivo de los consumidores, una fuerte preferencia por los dulces de primera calidad y la disponibilidad de una amplia gama de productos gomosos importados y producidos localmente.
- La avanzada infraestructura minorista del país, la población consciente de la salud y la demanda de opciones de etiqueta limpia y bajo contenido de azúcar han impulsado la popularidad de las gomitas tradicionales y suplementarias.
- Además, el floreciente sector del turismo y la hostelería sigue apoyando la demanda de artículos de compra impulsiva, como gomitas y gelatinas, en aeropuertos, hoteles y tiendas de conveniencia.
Análisis del mercado de gomitas y jaleas de Arabia Saudita
Se prevé que el mercado de gomitas y jaleas de Arabia Saudita crezca a la tasa de crecimiento anual compuesta (TCAC) más alta hasta 2032, impulsado por el creciente interés de los consumidores en refrigerios saludables, el aumento de los ingresos disponibles y la modernización de los canales minoristas. Como parte de Visión 2030, las iniciativas destinadas a promover dietas más saludables están impulsando la demanda de gomitas funcionales y bajas en azúcar. Los fabricantes locales de alimentos innovan cada vez más con ingredientes naturales y productos fortificados para atraer a la población joven y urbana del país.
Perspectiva del mercado de gomitas y jaleas de Sudáfrica
Se proyecta que el mercado sudafricano de gomitas y jaleas se expandirá a un ritmo notable, impulsado por una clase media en crecimiento, una mayor concienciación sobre el consumo de azúcar y la demanda de opciones veganas y de origen vegetal. El auge de las tiendas especializadas y las plataformas de comercio electrónico ha mejorado el acceso a diversas marcas globales de gomitas. Las innovaciones orientadas a la salud, como las gomitas con suplementos vitamínicos y minerales, están teniendo una gran acogida entre los consumidores, especialmente en centros urbanos como Johannesburgo y Ciudad del Cabo.
¿Cuáles son las principales empresas del mercado de gomitas y jaleas?
La industria de gomitas y jaleas está liderada principalmente por empresas bien establecidas, entre las que se incluyen:
- Shenzhen Rungu Food Co., Ltd. (China)
- Dori Alimentos SA (Brasil)
- Guandy (El Salvador)
- Hatops Food (China) Co., Ltd. (China)
- North West Sweets Ltd (Reino Unido)
- Nutris (México)
- TOROS (Turquía)
- Perfetti Van Melle (Países Bajos)
- Just Born, Inc. (EE. UU.)
- Pharmavite LLC (EE. UU.)
- JELLY BELLY CANDY COMPANY (EE. UU.)
- Franssons Konfektyrer AB (Suecia)
- Cloetta AB (Suecia)
- Candy People (Suecia)
- SIRIO PHARMA CO., LTD. (Porcelana)
¿Cuáles son los desarrollos recientes en el mercado de gomitas y jaleas de Medio Oriente y África?
- En septiembre de 2024, The Hershey Company lanzó su nueva línea de gomitas extragrandes, Shaq-A-Licious XL Gummies, que incluye Shaq-A-Licious Original y Shaq-A-Licious Sour en tres divertidas formas y sabores. Este lanzamiento destaca la estrategia de Hershey de introducir gomitas novedosas y con marcas de celebridades para atraer a un público más joven.
- En agosto de 2024, HARIBO presentó su primera gomita con temática de fútbol americano, la HARIBO Football Mix, que incluye seis formas únicas de gomitas y sabores frutales como fresa, frambuesa, piña, limón, manzana y naranja en una textura de doble capa. Esta mezcla de edición limitada está dirigida a los aficionados al deporte y a los picos de demanda estacionales.
- En octubre de 2023, Ferrara llegó a un acuerdo para adquirir Jelly Belly, con el objetivo de combinar su amplia gama de gominolas gourmet con la amplia cartera de caramelos de Ferrara. Esta adquisición refuerza la posición de Ferrara en el segmento de dulces premium y amplía su diversidad de productos.
- En mayo de 2022, Jelly Drops ingresó al mercado estadounidense con su innovador caramelo hidratante, elaborado con un 95 % de agua, electrolitos añadidos y sin azúcar. Este producto está ganando popularidad entre los consumidores mayores, especialmente aquellos con Alzheimer, ya que aborda los problemas de hidratación en un formato sabroso.
- En febrero de 2022, Amway Corp. India lanzó suplementos nutricionales en presentaciones de caramelos y tiras de gelatina bajo la marca Nutrilite, priorizando la comodidad y el sabor. Esta iniciativa refleja el esfuerzo de la compañía por atraer a los consumidores modernos que buscan productos saludables fáciles de consumir.
SKU-
Obtenga acceso en línea al informe sobre la primera nube de inteligencia de mercado del mundo

- Panel de análisis de datos interactivo
- Panel de análisis de empresas para oportunidades con alto potencial de crecimiento
- Acceso de analista de investigación para personalización y consultas
- Análisis de la competencia con panel interactivo
- Últimas noticias, actualizaciones y análisis de tendencias
- Aproveche el poder del análisis de referencia para un seguimiento integral de la competencia
Metodología de investigación
La recopilación de datos y el análisis del año base se realizan utilizando módulos de recopilación de datos con muestras de gran tamaño. La etapa incluye la obtención de información de mercado o datos relacionados a través de varias fuentes y estrategias. Incluye el examen y la planificación de todos los datos adquiridos del pasado con antelación. Asimismo, abarca el examen de las inconsistencias de información observadas en diferentes fuentes de información. Los datos de mercado se analizan y estiman utilizando modelos estadísticos y coherentes de mercado. Además, el análisis de la participación de mercado y el análisis de tendencias clave son los principales factores de éxito en el informe de mercado. Para obtener más información, solicite una llamada de un analista o envíe su consulta.
La metodología de investigación clave utilizada por el equipo de investigación de DBMR es la triangulación de datos, que implica la extracción de datos, el análisis del impacto de las variables de datos en el mercado y la validación primaria (experto en la industria). Los modelos de datos incluyen cuadrícula de posicionamiento de proveedores, análisis de línea de tiempo de mercado, descripción general y guía del mercado, cuadrícula de posicionamiento de la empresa, análisis de patentes, análisis de precios, análisis de participación de mercado de la empresa, estándares de medición, análisis global versus regional y de participación de proveedores. Para obtener más información sobre la metodología de investigación, envíe una consulta para hablar con nuestros expertos de la industria.
Personalización disponible
Data Bridge Market Research es líder en investigación formativa avanzada. Nos enorgullecemos de brindar servicios a nuestros clientes existentes y nuevos con datos y análisis que coinciden y se adaptan a sus objetivos. El informe se puede personalizar para incluir análisis de tendencias de precios de marcas objetivo, comprensión del mercado de países adicionales (solicite la lista de países), datos de resultados de ensayos clínicos, revisión de literatura, análisis de mercado renovado y base de productos. El análisis de mercado de competidores objetivo se puede analizar desde análisis basados en tecnología hasta estrategias de cartera de mercado. Podemos agregar tantos competidores sobre los que necesite datos en el formato y estilo de datos que esté buscando. Nuestro equipo de analistas también puede proporcionarle datos en archivos de Excel sin procesar, tablas dinámicas (libro de datos) o puede ayudarlo a crear presentaciones a partir de los conjuntos de datos disponibles en el informe.

