

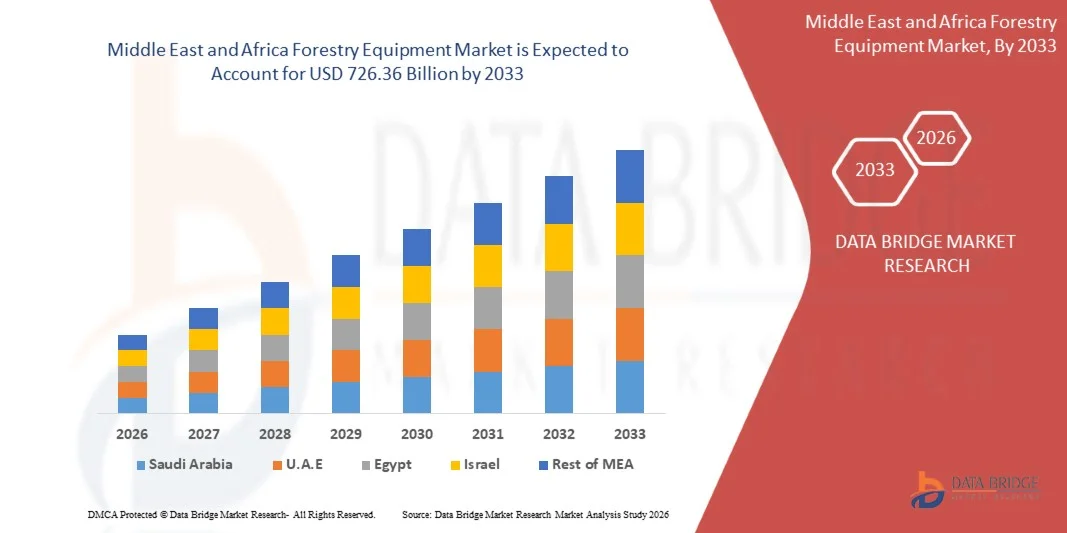
Middle East And Africa Forestry Equipment Market
Tamaño del mercado en miles de millones de dólares
Tasa de crecimiento anual compuesta (CAGR) :
% 
 USD
551.61 Million
USD
726.36 Million
2025
2033
USD
551.61 Million
USD
726.36 Million
2025
2033
| 2026 –2033 | |
| USD 551.61 Million | |
| USD 726.36 Million | |
| % | |
|
Segmentación del mercado de equipos forestales en Oriente Medio y África, por tipo (equipo de tala, equipo de extracción, equipo de procesamiento in situ, equipo de corte y carga, y otros equipos), producto (desramadoras, taladoras apiladoras, trituradoras de tocones, trituradoras, desbrozadoras, autocargadores, cargadoras de troncos, cosechadoras, skidders, camiones de transporte de madera, astilladoras para energía-madera y otros), fuente de energía (gasolina, batería, eléctrica con cable, inalámbrica y otros), material (metal, plástico, madera, plásticos reciclados, resina sintética y otros), tipo de bosque (natural, artificial, plantaciones de árboles), tipo de sistema (sistemas de árbol completo, sistemas de madera corta y sistemas de árbol largo), técnica (tala de árboles, desmoche y desramificación, descortezado, extracción, fabricación de troncos/corte transversal, escalado, clasificación y apilamiento, carga y otros), canal de distribución (distribuidores externos, B2B/ventas directas, comercio electrónico, sitios web de marca, especialidad Tiendas y otros) - Tendencias de la industria y pronóstico hasta 2033
¿Cuál es el tamaño y la tasa de crecimiento del mercado de equipos forestales en Oriente Medio y África?
- El tamaño del mercado de equipos forestales de Medio Oriente y África se valoró en USD 551,61 millones en 2025 y se espera que alcance los USD 726,36 millones para 2033 , con una CAGR del 3,50 % durante el período de pronóstico.
- La alta producción de madera en rollo requiere de equipos forestales para fines de corte, procesamiento, elevación y carga, aumentando así el crecimiento del mercado de equipos forestales.
- El alto costo de la cosecha se incrementa considerablemente debido al costo inicial de la compra de maquinaria. Estas máquinas son vehículos pesados y requieren un alto costo de mantenimiento. El aumento en el costo de la producción general limita el crecimiento del mercado de equipos forestales.
¿Cuáles son las principales conclusiones del mercado de equipos forestales?
- Los avances técnicos en equipos forestales han mejorado la productividad en las instalaciones forestales. Esto ha contribuido a aumentar la productividad y reducir los costos, lo que representa una importante oportunidad para el crecimiento del mercado de equipos forestales.
- El aumento de costos debido a fugas en el sistema hidráulico es un gran desafío para las empresas y, por lo tanto, actúa como un desafío importante para el crecimiento del mercado de equipos forestales.
- Sudáfrica dominó el mercado de equipos forestales de Medio Oriente y África con una participación de ingresos del 31,4 % en 2025, respaldada por las extensas plantaciones comerciales del país, la adopción de soluciones forestales mecanizadas y la modernización de las operaciones de cosecha de madera.
- Se proyecta que Marruecos registre la CAGR más rápida del 8,1% entre 2026 y 2033, impulsada por la adopción de la cosecha mecanizada, las crecientes iniciativas de silvicultura comercial y la demanda de madera y biomasa.
- El segmento de equipos de tala dominó el mercado con una participación en los ingresos del 42,7 % en 2025, impulsado por la creciente demanda de cosecha precisa y eficiente de árboles en bosques naturales y de plantaciones.
Alcance del informe y segmentación del mercado de equipos forestales
|
Atributos |
Información clave del mercado de equipos forestales |
|
Segmentos cubiertos |
|
|
Países cubiertos |
Oriente Medio y África
|
|
Actores clave del mercado |
|
|
Oportunidades de mercado |
|
|
Conjuntos de información de datos de valor añadido |
Además de los conocimientos sobre escenarios de mercado como valor de mercado, tasa de crecimiento, segmentación, cobertura geográfica y actores principales, los informes de mercado seleccionados por Data Bridge Market Research también incluyen análisis de expertos en profundidad, análisis de precios, análisis de participación de marca, encuesta de consumidores, análisis demográfico, análisis de la cadena de suministro, análisis de la cadena de valor, descripción general de materias primas/consumibles, criterios de selección de proveedores, análisis PESTLE, análisis de Porter y marco regulatorio. |
¿Cuál es la tendencia clave en el mercado de equipos forestales?
“ Creciente demanda de equipos forestales sostenibles y de alto rendimiento ”
- El mercado de equipos forestales está experimentando una tendencia clave hacia la creciente adopción de maquinaria ecológica, energéticamente eficiente y tecnológicamente avanzada. Esta tendencia se ve impulsada por la creciente conciencia global sobre las prácticas forestales sostenibles, la eficiencia operativa y el cumplimiento ambiental, especialmente en América del Norte, Oriente Medio y África.
- Por ejemplo, empresas como Komatsu Forest y Waratah están desarrollando cosechadoras y autocargadores energéticamente eficientes equipados con motores híbridos y telemática para reducir el consumo de combustible y las emisiones de carbono.
- La creciente demanda de maquinaria que mejora la productividad operativa, la precisión y la seguridad está acelerando su adopción
- Los fabricantes están integrando automatización avanzada, monitoreo habilitado por IoT y tecnologías de asistencia al operador en equipos forestales para mejorar el rendimiento.
- El aumento de la I+D en materiales ligeros, componentes duraderos y sistemas hidráulicos de precisión está fomentando la innovación de productos.
- A medida que los operadores forestales priorizan la sostenibilidad, la seguridad y la eficiencia, se espera que los equipos forestales modernos sigan siendo fundamentales para la modernización de la industria.
¿Cuáles son los impulsores clave del mercado de equipos forestales?
- El creciente énfasis mundial en la tala sostenible, la reducción de la deforestación y el cumplimiento de las regulaciones ambientales es un importante motor de crecimiento.
- Por ejemplo, en 2025, Komatsu Forest y CRANAB AB introdujeron cosechadoras y autocargadores inteligentes equipados con telemática avanzada para optimizar el uso de combustible y reducir las emisiones.
- La creciente demanda de maquinaria multifuncional de alta productividad está impulsando su adopción en América del Norte, Oriente Medio y África, y Oriente Medio y África.
- Los avances tecnológicos en automatización, cosecha asistida por GPS y brazos robóticos están permitiendo a los fabricantes producir equipos más precisos y eficientes.
- La mayor integración de la maquinaria con sistemas de monitoreo en tiempo real, mantenimiento predictivo y gestión de flotas respalda aún más la expansión del mercado.
- Con una inversión continua en I+D, diseño sostenible e innovaciones centradas en el operador, se espera que el mercado de equipos forestales mantenga un fuerte impulso de crecimiento en los próximos años.
¿Qué factor está obstaculizando el crecimiento del mercado de equipos forestales?
- La alta inversión de capital requerida para la maquinaria forestal avanzada limita su adopción, especialmente entre los operadores de pequeña escala.
- Por ejemplo, durante 2024-2025, las fluctuaciones en el costo de los sistemas hidráulicos, los componentes telemáticos y los motores híbridos afectaron los volúmenes de producción y adquisición.
- El cumplimiento normativo de las normas sobre emisiones, seguridad y sostenibilidad forestal aumenta la complejidad operativa y los costos
- La limitada concientización y capacitación sobre maquinaria forestal avanzada en los mercados emergentes dificulta su adopción, en particular en el caso de equipos tecnológicamente sofisticados.
- La competencia de la maquinaria usada o reacondicionada y las importaciones de bajo costo crean presión sobre los precios y afectan la penetración del mercado.
- Para superar estos desafíos, los fabricantes están invirtiendo en producción rentable, programas de capacitación de operadores, opciones de financiamiento y diseño sustentable para garantizar ofertas de equipos forestales de alta calidad y ambientalmente responsables.
¿Cómo está segmentado el mercado de equipos forestales?
El mercado está segmentado según el tipo, producto, fuente de energía, material, tipo de bosque, tipo de sistema, técnica y canal de distribución .
• Por tipo
Según el tipo, el mercado de equipos forestales se segmenta en equipos de tala, equipos de extracción, equipos de procesamiento in situ, equipos de corte y carga, y otros equipos. El segmento de equipos de tala dominó el mercado con una participación en los ingresos del 42.7 % en 2025, impulsado por la creciente demanda de tala precisa y eficiente de árboles en bosques naturales y de plantaciones. Estas máquinas, incluidas las taladoras apiladoras y las motosierras, mejoran la velocidad operativa, la seguridad y la productividad
Se proyecta que los equipos de extracción crecerán a su tasa de crecimiento anual compuesta (TCAC) más alta entre 2026 y 2033, impulsados por la creciente adopción de autocargadores, skidders y transportadores de cable que optimizan el transporte de madera y reducen la intensidad de la mano de obra. La innovación continua en automatización, sistemas hidráulicos y telemática impulsa aún más la expansión del mercado.
• Por producto
Según el producto, el mercado se segmenta en desramadoras, taladoras apiladoras, trituradoras de tocones, trituradoras, desrazadoras, autocargadores, cargadoras de troncos, cosechadoras, skidders, camiones de transporte de madera, astilladoras para energía-madera y otros. El segmento de cosechadoras dominó el mercado con una participación en los ingresos del 36.5% en 2025, debido a la alta adopción en operaciones madereras a gran escala en Oriente Medio, África y América del Norte
Se proyecta que las astilladoras para madera energética crecerán a la tasa de crecimiento anual compuesta (TCAC) más alta entre 2026 y 2033, impulsada por la creciente demanda de energía de biomasa y combustibles renovables. La mecanización avanzada y los modelos de alta capacidad permiten un procesamiento eficiente de la madera y reducen el impacto ambiental.
• Por fuente de energía
Según la fuente de energía, el mercado se segmenta en gasolina, batería, eléctricos con cable, inalámbricos y otros. El segmento de gasolina dominó con una participación de ingresos del 45,2 % en 2025, ya que los motores de combustión interna proporcionan confiabilidad, alto torque y largas horas de operación para operaciones forestales exigentes.
Se proyecta que la maquinaria alimentada por baterías y eléctrica crecerá a la CAGR más rápida entre 2026 y 2033, respaldada por innovaciones en sistemas híbridos y totalmente eléctricos que reducen las emisiones de carbono, la contaminación acústica y los costos de mantenimiento, especialmente en bosques ecosensibles.
• Por material
Según el material, el mercado se segmenta en metal, plástico, madera, plásticos reciclados, resina sintética y otros. El segmento de metal dominó con una participación en los ingresos del 52.1 % en 2025, debido a la durabilidad, alta resistencia y longevidad de los componentes de acero y aleación en la maquinaria forestal pesada
Se proyecta que los plásticos reciclados crecerán a la CAGR más rápida entre 2026 y 2033, impulsados por iniciativas de sostenibilidad y la integración de compuestos poliméricos livianos y de alto rendimiento en cabinas protectoras, cubiertas y componentes no estructurales.
• Por tipo de bosque
Según el tipo de bosque, el mercado se segmenta en bosques naturales, artificiales y plantaciones forestales. Los bosques naturales dominaron el mercado con una participación del 43,6 % en los ingresos en 2025, ya que representan la mayor extracción de madera a nivel mundial.
Se proyecta que las plantaciones de árboles crecerán a la CAGR más rápida durante 2026-2033, impulsadas por iniciativas gubernamentales para la forestación sustentable, el aumento de proyectos de reforestación y la creciente superficie de plantaciones comerciales para las industrias del papel, la pulpa y la madera.
• Por tipo de sistema
Según el tipo de sistema, el mercado se segmenta en sistemas de árboles completos, sistemas de troncos cortos y sistemas de troncos largos. El segmento de sistemas de troncos cortos dominó la industria con una participación del 40,8 % en los ingresos en 2025, gracias a su fácil manejo, la reducción de la rotura de troncos y la compatibilidad con equipos de extracción mecanizados.
Se proyecta que los sistemas de árboles completos crecerán a la CAGR más rápida entre 2026 y 2033, impulsados por su eficiencia en operaciones a gran escala e integración con unidades modernas de procesamiento de biomasa y astillado.
• Por técnica
Según la técnica, el mercado se segmenta en tala de árboles, desmoche y desramado, descortezado, extracción, fabricación de troncos/corte transversal, escalado, clasificación y apilado, carga y otros. La tala de árboles dominó con un 39.7 % de participación en los ingresos en 2025, debido al papel fundamental de la tala en la productividad general
Se proyecta que las técnicas de carga y clasificación crecerán a la CAGR más rápida durante 2026-2033, impulsadas por soluciones de automatización, robótica y telemática para un manejo y procesamiento de la madera más rápido, seguro y preciso.
• Por canal de distribución
Según el canal de distribución, el mercado se segmenta en distribuidores externos, ventas directas B2B, comercio electrónico, sitios web de marcas, tiendas especializadas y otros. Las ventas directas B2B dominaron con una participación de ingresos del 47,5 % en 2025, ya que los fabricantes suministran maquinaria directamente a grandes operadores forestales, garantizando la personalización, el soporte posventa y la capacitación.
Se proyecta que el comercio electrónico y las plataformas en línea crecerán a la CAGR más rápida entre 2026 y 2033, en particular para los operadores de pequeña escala y la adquisición de repuestos, respaldados por la digitalización, una entrega más rápida y servicios de soporte remoto.
¿Qué región posee la mayor participación en el mercado de equipos forestales?
- Sudáfrica dominó el mercado de equipos forestales de Medio Oriente y África con una participación de ingresos del 31,4 % en 2025, respaldada por las extensas plantaciones comerciales del país, la adopción de soluciones forestales mecanizadas y la modernización de las operaciones de cosecha de madera.
- Las iniciativas gubernamentales que promueven la gestión forestal sostenible, la inversión en maquinaria avanzada y la creciente demanda de madera, pulpa y productos de biomasa impulsan el liderazgo regional. Los actores clave están aprovechando las innovaciones en cosechadoras, autocargadores y equipos de extracción para mejorar la productividad y la eficiencia operativa.
- La creciente demanda industrial, la urbanización y el enfoque en prácticas forestales ecológicas y de alta precisión contribuyen a una mayor adopción
Perspectivas del mercado de equipos forestales de Kenia
Kenia contribuye constantemente al crecimiento regional, impulsado por la expansión de las plantaciones de árboles, la mecanización de las operaciones de cosecha y los programas de silvicultura sostenible respaldados por el gobierno. Los operadores están implementando skidders, autocargadores y cargadores modernos para optimizar la productividad. El fuerte enfoque en la eficiencia de las plantaciones, el cumplimiento ambiental y los programas de capacitación impulsan la expansión constante del mercado.
Análisis del mercado de equipos forestales de Marruecos
Se proyecta que Marruecos registrará la tasa de crecimiento anual compuesta (TCAC) más rápida, del 8,1 %, entre 2026 y 2033, impulsada por la adopción de la cosecha mecanizada, el crecimiento de las iniciativas forestales comerciales y la demanda de madera y biomasa. La inversión en cosechadoras robóticas y basadas en IA, equipos de precisión y prácticas sostenibles fortalece el crecimiento a largo plazo. La expansión de las plantaciones comerciales y las políticas gubernamentales de apoyo aceleran aún más la adopción del mercado.
¿Cuáles son las principales empresas del mercado de equipos forestales?
La industria de equipos forestales está liderada principalmente por empresas bien establecidas, entre las que se incluyen:
- Komatsu Forest (Japón)
- Waratah (Finlandia)
- CRANAB AB (Suecia)
- Rotobec (Canadá)
- Log Max AB (Suecia)
- Konrad Forsttechnik GmbH (Alemania)
- Penz crane GmbH (Austria)
- INDUSTRIAS GUERRA, SA (España)
- Palmse Mehaanikakoda (Estonia)
- Southstar Equipment (EE. UU.)
- JSC AMKODOR, sociedad gestora del holding (Bielorrusia)
- SP Maskiner (Suecia)
¿Cuáles son los desarrollos recientes en el mercado de equipos forestales de Oriente Medio y África?
- En mayo de 2025, Forico, una empresa forestal líder de Tasmania, implementó cámaras de detección de incendios forestales impulsadas por IA en sus plantaciones, lo que permitió la triangulación en tiempo real de las firmas de incendios para una alerta temprana y una respuesta rápida, mejorando la resiliencia ante incendios y estableciendo un punto de referencia para la gestión digital de riesgos en el sector forestal.
- En febrero de 2025, los investigadores introdujeron un sistema basado en aprendizaje de refuerzo para la manipulación autónoma de grúas en operaciones forestales, entrenando el modelo de IA en entornos simulados para identificar y agarrar troncos de madera con un 96 % de precisión, lo que representa un avance significativo en la automatización, la reducción de la mano de obra y la seguridad operativa en sitios forestales remotos.
- En junio de 2023, Volvo Construction Equipment (Volvo CE) anunció el lanzamiento de su nueva Unidad de Negocios Compacta, estableciendo una división dedicada a sus máquinas y soluciones de equipos compactos para impulsar el crecimiento y la rentabilidad, fortaleciendo su posición de mercado en el segmento de equipos compactos en expansión.
- En mayo de 2023, Caterpillar lanzó el MH3050, un nuevo manipulador de materiales diseñado para un rendimiento superior, confiabilidad y comodidad de cabina premium, que cuenta con un sistema electrohidráulico avanzado para optimizar la eficiencia energética y los tiempos de ciclo, expandiendo aún más las ofertas de manipuladores de materiales de Caterpillar para aplicaciones industriales y mejorando el potencial de ganancias.
SKU-
Obtenga acceso en línea al informe sobre la primera nube de inteligencia de mercado del mundo

- Panel de análisis de datos interactivo
- Panel de análisis de empresas para oportunidades con alto potencial de crecimiento
- Acceso de analista de investigación para personalización y consultas
- Análisis de la competencia con panel interactivo
- Últimas noticias, actualizaciones y análisis de tendencias
- Aproveche el poder del análisis de referencia para un seguimiento integral de la competencia
Metodología de investigación
La recopilación de datos y el análisis del año base se realizan utilizando módulos de recopilación de datos con muestras de gran tamaño. La etapa incluye la obtención de información de mercado o datos relacionados a través de varias fuentes y estrategias. Incluye el examen y la planificación de todos los datos adquiridos del pasado con antelación. Asimismo, abarca el examen de las inconsistencias de información observadas en diferentes fuentes de información. Los datos de mercado se analizan y estiman utilizando modelos estadísticos y coherentes de mercado. Además, el análisis de la participación de mercado y el análisis de tendencias clave son los principales factores de éxito en el informe de mercado. Para obtener más información, solicite una llamada de un analista o envíe su consulta.
La metodología de investigación clave utilizada por el equipo de investigación de DBMR es la triangulación de datos, que implica la extracción de datos, el análisis del impacto de las variables de datos en el mercado y la validación primaria (experto en la industria). Los modelos de datos incluyen cuadrícula de posicionamiento de proveedores, análisis de línea de tiempo de mercado, descripción general y guía del mercado, cuadrícula de posicionamiento de la empresa, análisis de patentes, análisis de precios, análisis de participación de mercado de la empresa, estándares de medición, análisis global versus regional y de participación de proveedores. Para obtener más información sobre la metodología de investigación, envíe una consulta para hablar con nuestros expertos de la industria.
Personalización disponible
Data Bridge Market Research es líder en investigación formativa avanzada. Nos enorgullecemos de brindar servicios a nuestros clientes existentes y nuevos con datos y análisis que coinciden y se adaptan a sus objetivos. El informe se puede personalizar para incluir análisis de tendencias de precios de marcas objetivo, comprensión del mercado de países adicionales (solicite la lista de países), datos de resultados de ensayos clínicos, revisión de literatura, análisis de mercado renovado y base de productos. El análisis de mercado de competidores objetivo se puede analizar desde análisis basados en tecnología hasta estrategias de cartera de mercado. Podemos agregar tantos competidores sobre los que necesite datos en el formato y estilo de datos que esté buscando. Nuestro equipo de analistas también puede proporcionarle datos en archivos de Excel sin procesar, tablas dinámicas (libro de datos) o puede ayudarlo a crear presentaciones a partir de los conjuntos de datos disponibles en el informe.

