

Mercado de agentes antiaglomerantes alimentarios de Oriente Medio y África, por tipo (compuestos de silicio, celulosa microcristalina , compuestos de calcio, compuestos de sodio, compuestos de magnesio y otros), fuente (agentes sintéticos/artificiales y agentes naturales), categoría de producto (sin OGM y OGM), forma (polvo y líquido), aplicación (confitería, productos de panadería, productos lácteos, alimentos preparados, nutrición dietética, nutrición deportiva, productos cárnicos procesados, bebidas, sopas y salsas, condimentos y condimentos, fórmula infantil y otros): tendencias de la industria y pronóstico hasta 2030.
Análisis y perspectivas del mercado de agentes antiaglomerantes alimentarios en Oriente Medio y África
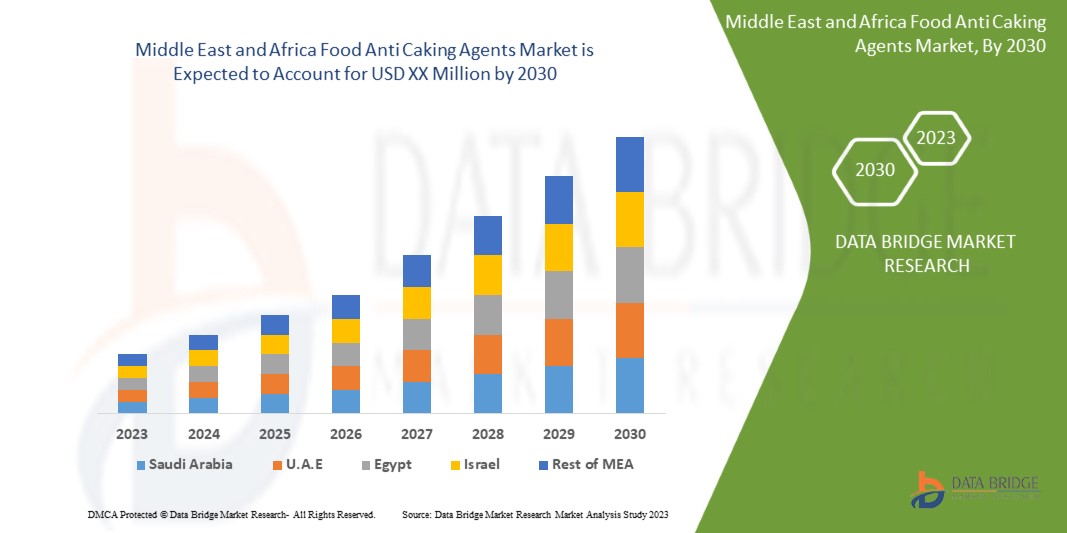
Los agentes antiaglomerantes son compuestos anhidros que se añaden a los alimentos secos en pequeñas cantidades para evitar que las partículas se aglomeren y mantener el producto seco y fluido. Se espera que la creciente demanda de alimentos preparados y listos para consumir, que conduce a una mayor demanda de agentes antiaglomerantes, impulse el mercado de agentes antiaglomerantes alimentarios en Oriente Medio y África. Además, también se espera que el aumento de la demanda de productos alimenticios de mejor calidad y una mayor vida útil impulse el crecimiento del mercado. Sin embargo, las estrictas normas y regulaciones sobre los agentes antiaglomerantes pueden obstaculizar el crecimiento del mercado. El aumento de las innovaciones nanotecnológicas en los agentes antiaglomerantes alimentarios puede servir como una oportunidad para el mercado de Oriente Medio y África. Los crecientes riesgos para la salud debido al uso excesivo de agentes antiaglomerantes pueden suponer un grave desafío para el crecimiento del mercado de agentes antiaglomerantes alimentarios en Oriente Medio y África.
Data Bridge Market Research analiza que el mercado de agentes antiaglomerantes alimentarios de Oriente Medio y África crecerá a una CAGR del 4,7 % durante el período de pronóstico de 2023 a 2030.
|
Métrica del informe |
Detalles |
|
Período de pronóstico |
2023 a 2030 |
|
Año base |
2022 |
|
Años históricos |
2021 (Personalizable para 2019 - 2015) |
|
Unidades cuantitativas |
Ingresos en millones de USD, precios en USD |
|
Segmentos cubiertos |
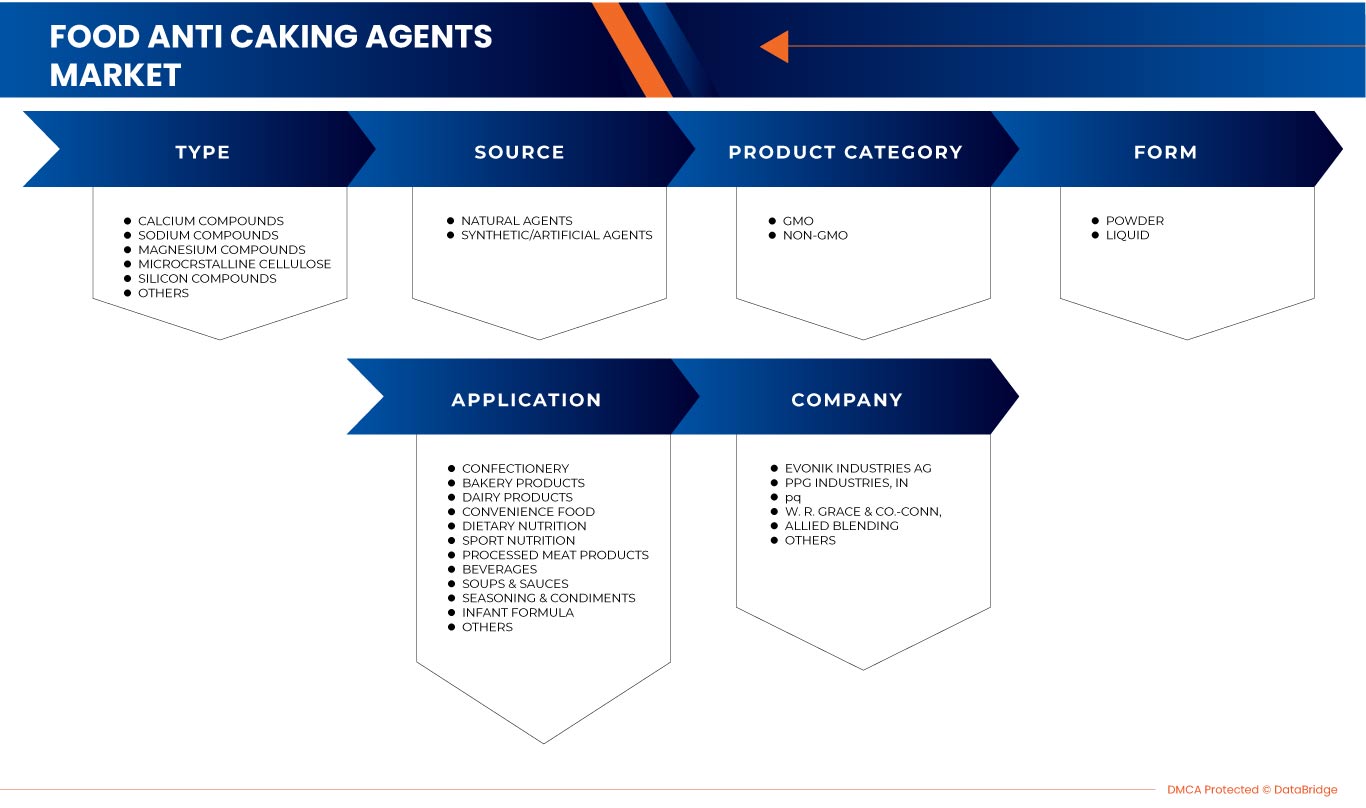
Tipo (compuestos de silicio, celulosa microcristalina, compuestos de calcio, compuestos de sodio, compuestos de magnesio y otros), origen (agentes sintéticos/artificiales y agentes naturales), categoría de producto (no modificados genéticamente y modificados genéticamente), forma (polvo y líquido), aplicación (confitería, productos de panadería, productos lácteos, alimentos preparados, nutrición dietética, nutrición deportiva , productos cárnicos procesados, bebidas, sopas y salsas, condimentos y aderezos, fórmulas infantiles y otros) |
|
Países cubiertos |
Emiratos Árabes Unidos, Qatar, Arabia Saudita, Egipto, Sudáfrica, Bahréin, Kuwait, Omán y el resto de Oriente Medio y África |
|
Actores del mercado cubiertos |
Evonik Industries AG, PPG Industries, In, PQ, WR Grace & Co.-Conn, Solvay, Huber Engineered Materials, REMEDY LABS, Sigachi Industries, Konoshima Chemical Co., Ltd, RanQ, Fabricante de celulosa: Ankit Pulps, Ltd, MUBY CHEMICALS, JELU-WERK J. Ehrler GmbH & Co. KG, Jinsha Precipitated Silica Manufacturing Co., Ltd, Astrra Chemicals, SBF Pharma, Foodchem International Corporation |
Definición de mercado
Los agentes antiaglomerantes son aditivos que se utilizan en materiales en polvo o granulados, como la sal de mesa o los dulces, para evitar la formación de grumos (apelmazamiento) y mejorar el envasado, el transporte, la fluidez y el consumo. Los mecanismos de apelmazamiento varían según el material. Los sólidos cristalinos se apelmazan con frecuencia debido a la formación de un puente líquido y la posterior fusión de microcristales. Las transiciones vítreas y los cambios de viscosidad pueden provocar que los materiales amorfos se apelmazen. Las transiciones de fase polimórficas también pueden provocar apelmazamiento. Algunos agentes antiaglomerantes absorben el exceso de humedad o recubren las partículas con un revestimiento repelente al agua. El silicato de calcio (CaSiO3), un agente antiaglomerante común, absorbe agua y aceite cuando se añade a productos como la sal de mesa.
Dinámica del mercado de agentes antiaglomerantes alimentarios en Oriente Medio y África
En esta sección se aborda la comprensión de los factores impulsores, las oportunidades, los desafíos y las limitaciones del mercado. Todo esto se analiza en detalle a continuación:
Conductores
-
Aumento de la demanda de alimentos preparados y listos para consumir
La creciente demanda de alimentos preparados, como alimentos envasados y listos para consumir, se debe al aumento de la población activa, las mejoras económicas y los horarios excesivamente ocupados y estresantes. Estos alimentos, que incluyen productos estables, productos refrigerados o congelados, mezclas secas que no requieren preparación y otros, están diseñados para facilitar su consumo. La industria de alimentos y bebidas está experimentando un aumento de la demanda debido a la creciente urbanización, el aumento del nivel de vida y los cambios en las preferencias alimentarias y el estilo de vida. Además, se espera que el mercado de agentes antiaglomerantes crezca significativamente a la par del aumento de la demanda de cocina tradicional, ya que estas comidas contienen una variedad de espesantes como harina de maíz, arrurruz, mandioca, agar-agar, gelatina y huevos.
Los agentes antiaglomerantes se pueden añadir a los productos alimenticios para mejorar la viscosidad, la textura, la densidad, la estabilidad y otras propiedades. Además, el ingrediente principal en la industria de la panadería es un agente antiaglomerante. Los ingredientes para productos horneados como las galletas (azúcar, harina, levadura en polvo, etc.) acabarían solidificándose como bloques de tiza si no se utilizaran productos químicos antiaglomerantes. Estas sustancias secas absorben gradualmente la humedad del aire con el tiempo. Debido al agua, las partículas pueden unirse.
-
Aumento de la demanda de productos alimenticios con mejor calidad y mayor vida útil
Los agentes antiaglomerantes alimentarios son conservantes que se encuentran en los alimentos en polvo o granulados y que impiden que estos fluyan perfectamente fuera del envase, lo que impide que el polvo o los gránulos se aglomeren o se peguen entre sí. Los productos de confitería pueden contener agentes antiaglomerantes para evitar la formación de grumos (apelmazamiento) y facilitar el envasado. Se espera que el aumento del consumo de ingredientes alimentarios como el polvo para hornear, la leche y la nata en polvo, las mezclas para tartas y el polvo para sopas instantáneas tenga un impacto positivo en el desarrollo de agentes antiaglomerantes alimentarios debido a su función fundamental de mantener la fluidez, la textura y otras características organolépticas, así como una larga vida útil.
El agua, el alcohol y el etanol son disolventes orgánicos en los que son solubles los compuestos antiaglomerantes. Estos actúan absorbiendo el exceso de humedad o recubriendo las partículas con un revestimiento hidrófugo que prolonga la vida útil del producto.
Oportunidad
-
Aumento de las innovaciones nanotecnológicas en antiaglomerantes alimentarios
La nanotecnología alimentaria se considera una frontera tecnológica para la industria alimentaria en el siglo XXI. La nanotecnología se utiliza ampliamente en el procesamiento de alimentos, la trazabilidad de los envases y la conservación. Además, los avances en nanodetección e ingredientes nanoestructurados son muy prometedores en la industria alimentaria. Los avances tecnológicos recientes han transformado el uso de nanopartículas (NP) en la industria alimentaria. Se reconoce que estas NP tienen propiedades distintivas, como agentes antiaglomerantes, antibacterianos, bioterapéuticos y prolongación de la vida útil, que se espera que impulsen el crecimiento del mercado.
La nanotecnología en el procesamiento de alimentos puede contribuir a generar sabores, texturas y sensaciones en la boca nuevos o mejorados mediante el procesamiento a escala nanométrica de los alimentos o una mejor absorción, biodisponibilidad y captación de nutrientes mediante formulaciones a escala nanométrica. Varios aditivos alimentarios están compuestos de nanopartículas o contienen una fracción de tamaño nanométrico. La sílice amorfa sintética (SAS) se utiliza en muchos alimentos en polvo como agente antiaglomerante y de flujo libre y para el recubrimiento de superficies de materiales de envasado. Está formada por agregados de partículas primarias de tamaño nanométrico.
Restricción/Desafío
- Normas y reglamentos estrictos sobre los agentes antiaglomerantes
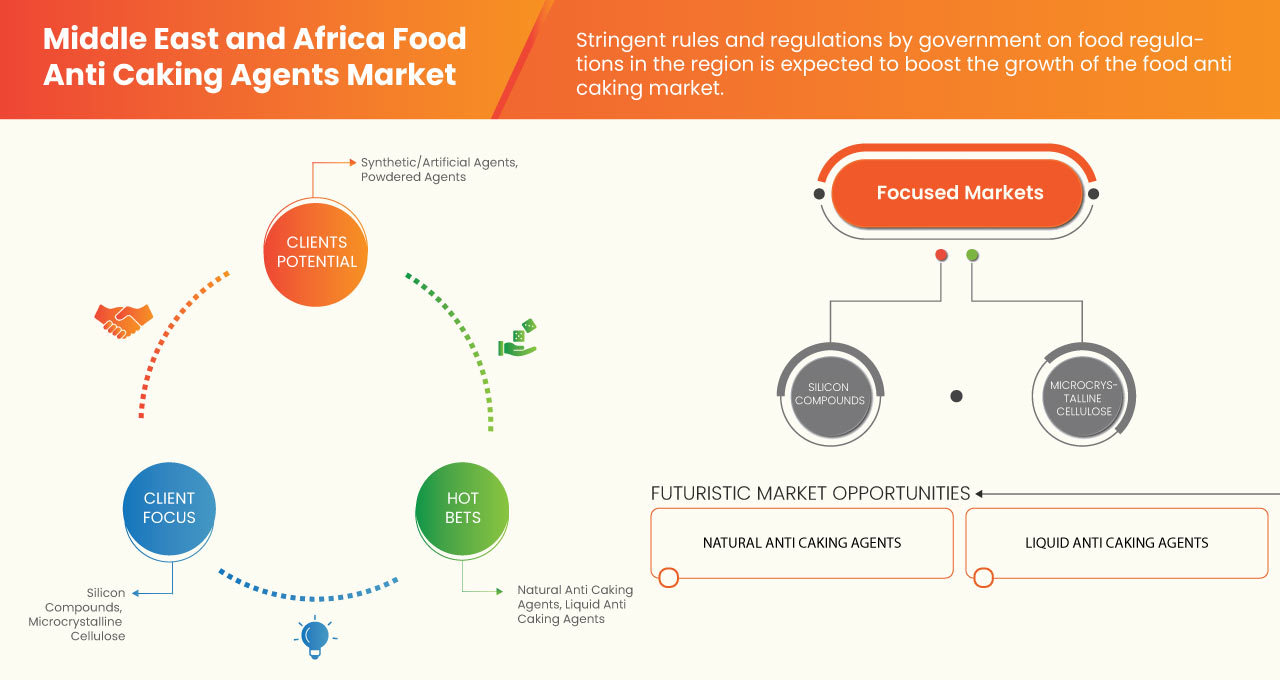
Los gobiernos de todo el mundo establecen normas y reglamentos estrictos para el uso y consumo de agentes antiaglomerantes en la industria alimentaria. Los reglamentos garantizan que los alimentos no tengan efectos nocivos o tóxicos. El gobierno ha establecido reglamentos específicos para el tipo y la cantidad de agentes antiaglomerantes alimentarios. El Reglamento sobre seguridad y normas alimentarias (normas de productos alimentarios y aditivos alimentarios) de 2011 establece que no se pueden utilizar agentes antiaglomerantes a menos que lo permitan específicamente los reglamentos.
Impacto posterior al COVID-19 en el mercado de agentes antiaglomerantes alimentarios en Oriente Medio y África
La COVID-19 ha afectado significativamente al mercado. Debido al confinamiento, se detuvo la fabricación y producción de muchas empresas pequeñas y grandes, se interrumpió la logística y la cadena de suministro y la demanda de agentes antiaglomerantes también disminuyó, lo que influyó en el mercado. Debido al cambio en muchos mandatos y regulaciones, los fabricantes están diseñando y lanzando nuevos productos, lo que puede ayudar a impulsar el crecimiento del mercado.
Desarrollo reciente
- En julio de 2022, WR Grace & Co. anunció la ampliación de su planta de fabricación y desarrollo por contrato en el sur de Michigan. La ampliación incluye un tren de reactores multiuso de 4000 galones y una centrífuga HASTELLOY, que mejorará la capacidad comercial de la planta que cumple con las normas c-GMP.
Alcance del mercado de agentes antiaglomerantes en Oriente Medio y África
El mercado de agentes antiaglomerantes alimentarios de Oriente Medio y África está segmentado en segmentos notables según el tipo, la fuente, la categoría del producto, la forma y la aplicación. El crecimiento entre estos segmentos le ayudará a analizar los principales segmentos de crecimiento en las industrias y brindará a los usuarios una valiosa descripción general del mercado y conocimientos del mercado para tomar decisiones estratégicas para identificar las principales aplicaciones del mercado.
Tipo
- Compuestos de silicio
- Celulosa microcristalina
- Compuestos de calcio
- Compuestos de sodio
- Compuestos de magnesio
- Otros
Según el tipo, el mercado de agentes antiaglomerantes alimentarios de Oriente Medio y África está segmentado en compuestos de silicio, celulosa microcristalina, compuestos de calcio, compuestos de sodio, compuestos de magnesio y otros.
Fuente
- Agentes sintéticos/artificiales
- Agentes naturales
Según la fuente, el mercado de agentes antiaglomerantes alimentarios de Oriente Medio y África está segmentado en agentes sintéticos/artificiales y agentes naturales.
Categoría de producto
- Sin OGM
- OGM
Según la categoría de producto, el mercado de agentes antiaglomerantes alimentarios de Oriente Medio y África está segmentado en no transgénicos y transgénicos.
Forma
- Polvo
- Líquido
Según la forma, el mercado de agentes antiaglomerantes alimentarios de Oriente Medio y África está segmentado en polvo y líquido.
Solicitud
- Confitería
- Productos de panadería
- Productos lácteos
- Comida preparada
- Nutrición dietética
- Nutrición deportiva
- Productos cárnicos procesados
- Bebidas
- Sopas y salsas
- Aderezos y condimentos
- Fórmula infantil
- Otros
Según la aplicación, el mercado de agentes antiaglomerantes de alimentos de Medio Oriente y África está segmentado en confitería, productos de panadería, productos lácteos, alimentos preparados, nutrición dietética, nutrición deportiva, productos cárnicos procesados, bebidas, sopas y salsas, condimentos y condimentos, fórmulas infantiles y otros.
Análisis y perspectivas regionales del mercado de agentes antiaglomerantes en Oriente Medio y África
Se analizan los agentes antiaglomerantes de Oriente Medio y África y se proporcionan información y tendencias sobre el tamaño del mercado según lo mencionado anteriormente.
Los países cubiertos en el informe del mercado de agentes antiaglomerantes alimentarios de Medio Oriente y África son los Emiratos Árabes Unidos, Qatar, Arabia Saudita, Egipto, Sudáfrica, Bahréin, Kuwait, Omán y el resto de Medio Oriente y África.
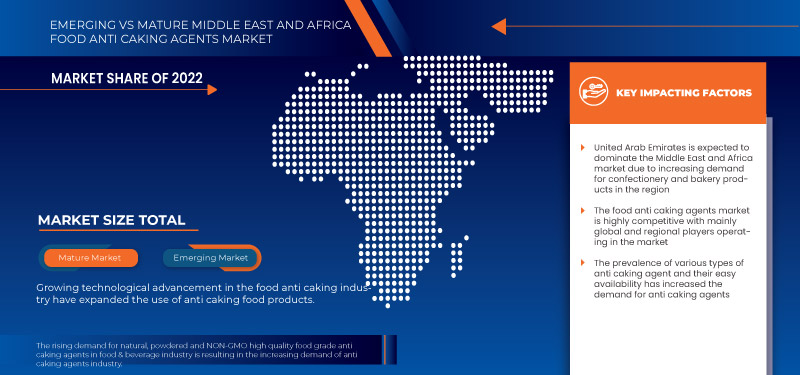
Se espera que los Emiratos Árabes Unidos dominen el mercado de agentes antiaglomerantes alimentarios de Medio Oriente y África en términos de participación de mercado e ingresos y se estima que mantendrán su dominio durante el período de pronóstico debido al aumento creciente de agentes antiaglomerantes alimentarios en varias industrias de alimentos y bebidas.
La sección de regiones del informe también proporciona factores individuales que impactan en el mercado y cambios en las regulaciones que afectan las tendencias actuales y futuras del mercado. Los puntos de datos, como las ventas de productos nuevos y de reemplazo, la demografía del país, la epidemiología de las enfermedades y los aranceles de importación y exportación, son algunos de los principales indicadores utilizados para pronosticar el escenario del mercado para cada país. Además, se consideran la presencia y disponibilidad de marcas de Medio Oriente y África y los desafíos que enfrentan debido a la alta competencia de las marcas locales y nacionales y el impacto de los canales de venta al proporcionar un análisis de pronóstico de los datos del país.
Análisis del panorama competitivo y de la cuota de mercado de los agentes antiaglomerantes alimentarios en Oriente Medio y África
El panorama competitivo del mercado de agentes antiaglomerantes alimentarios en Oriente Medio y África proporciona detalles sobre los competidores. Los detalles incluidos son una descripción general de la empresa, las finanzas de la empresa, los ingresos generados, el potencial de mercado, la inversión en investigación y desarrollo, las nuevas iniciativas de mercado, la presencia en Oriente Medio y África, los sitios e instalaciones de producción, las capacidades de producción, las fortalezas y debilidades de la empresa, el lanzamiento de productos, la amplitud y variedad de productos y el dominio de la aplicación. Los puntos de datos anteriores solo están relacionados con el enfoque de la empresa en el mercado de agentes antiaglomerantes alimentarios en Oriente Medio y África.
Algunos de los principales actores que operan en el mercado de agentes antiaglomerantes alimentarios de Oriente Medio y África son Evonik Industries AG, PPG Industries, In, PQ, WR Grace & Co.-Conn, Solvay, Huber Engineered Materials, REMEDY LABS, Sigachi Industries, Konoshima Chemical Co., Ltd, RanQ, Cellulose Manufacturer-Ankit Pulps, Ltd, MUBY CHEMICALS, JELU-WERK J. Ehrler GmbH & Co. KG, Jinsha Precipitated Silica Manufacturing Co., Ltd, Astrra Chemicals, SBF Pharma y Foodchem International Corporation, entre otros.
SKU-
Obtenga acceso en línea al informe sobre la primera nube de inteligencia de mercado del mundo

- Panel de análisis de datos interactivo
- Panel de análisis de empresas para oportunidades con alto potencial de crecimiento
- Acceso de analista de investigación para personalización y consultas
- Análisis de la competencia con panel interactivo
- Últimas noticias, actualizaciones y análisis de tendencias
- Aproveche el poder del análisis de referencia para un seguimiento integral de la competencia
Tabla de contenido
1 INTRODUCTION
1.1 OBJECTIVES OF THE STUDY
1.2 MARKET DEFINITION
1.3 OVERVIEW OF THE MIDDLE EAST & AFRICA FOOD ANTI CAKING AGENTS MARKET
1.4 LIMITATIONS
1.5 MARKETS COVERED
2 MARKET SEGMENTATION
2.1 MARKETS COVERED
2.2 GEOGRAPHICAL SCOPE
2.3 YEARS CONSIDERED FOR THE STUDY
2.4 CURRENCY AND PRICING
2.5 DBMR TRIPOD DATA VALIDATION MODEL
2.6 MULTIVARIATE MODELLING
2.7 TYPE LIFELINE CURVE
2.8 PRIMARY INTERVIEWS WITH KEY OPINION LEADERS
2.9 DBMR MARKET POSITION GRID
2.1 MARKET APPLICATION COVERAGE GRID
2.11 SECONDARY SOURCES
2.12 ASSUMPTIONS
3 EXECUTIVE SUMMARY
4 PREMIUM INSIGHTS
4.1 PORTER'S FIVE ANALYSIS FOR THE MIDDLE EAST & AFRICA ANTI CAKING AGENTS MARKET
4.2 VALUE CHAIN ANALYSIS: MIDDLE EAST & AFRICA FOOD ANTI CAKING AGENTS MARKET
4.3 FACTORS INFLUENCING PURCHASE DECISION OF END-USER
4.4 GROWTH STRATEGIES ADOPTED BY KEY MARKET PLAYERS
4.5 INDUSTRY TRENDS AND FUTURE PERSPECTIVE
4.6 OTHER BENEFITS OF ANTI CAKING AGENTS
4.7 SUPPLY CHAIN ANALYSIS
4.7.1 RAW MATERIAL PROCUREMENT & MANUFACTURING
4.7.2 DISTRIBUTION
4.7.3 END USERS
4.8 TECHNOLOGICAL ADVANCEMENT IN THE MIDDLE EAST & AFRICA FOOD ANTI CAKING AGENTS MARKET
4.9 TRADE ANALYSIS
4.1 MIDDLE EAST & AFRICA FOOD ANTI CAKING AGENTS MARKET: RAW MATERIAL SOURCING ANALYSIS
4.10.1 ABSORBENT POWDER
4.10.2 BASE LIQUID
4.10.3 FLOW AGENTS
5 IMPACT OF ECONOMIC SLOWDOWN ON THE MARKET –MIDDLE EAST & AFRICA FOOD ANTI CAKING AGENTS MARKET
6 PRICING INDEX (PRICE AT FOB & PRICES AT B2B)
7 PRODUCTION CAPACITY OF KEY MANUFACTURERS
8 BRAND OUTLOOK
8.1 BRAND COMPARATIVE ANALYSIS ON MIDDLE EAST & AFRICA FOOD ANTI CAKING AGENTS MARKET
8.2 PRODUCT VS BRAND OVERVIEW
9 REGULATORY GUIDELINES AND FRAMEWORK
10 MARKET OVERVIEW
10.1 DRIVERS
10.1.1 RISING DEMAND FOR CONVENIENCE FOOD AND READY-TO-EAT FOOD ITEMS
10.1.2 RISE IN DEMAND FOR FOOD PRODUCTS WITH BETTER QUALITY AND INCREASED SHELF LIFE
10.1.3 INCREASE IN DEMAND FOR ANTI-CAKING AGENTS IN SPICES AND CONDIMENTS
10.1.4 MULTIFUNCTIONAL CHARACTERISTICS OF ANTI-CAKING AGENTS
10.2 RESTRAINTS
10.2.1 STRINGENT RULES AND REGULATIONS ON ANTI-CAKING AGENTS
10.2.2 MANUFACTURERS LIMITING USAGE OF ADDITIVES FALLING UNDER THE E-NUMBER CATEGORY
10.3 OPPORTUNITIES
10.3.1 INCREASING NANO-TECHNOLOGICAL INNOVATIONS IN FOOD ANTI-CAKING AGENTS
10.3.2 MANUFACTURERS LAUNCHING NEW AND INNOVATIVE ANTI-CAKING AGENTS
10.3.3 RISING DEMAND FOR ORGANIC ANTI-CAKING AGENTS
10.4 CHALLENGES
10.4.1 INCREASING HEALTH HAZARDS DUE TO EXCESSIVE USE OF ANTI-CAKING AGENTS
10.4.2 IMPACT OF ANTI-CAKING AGENTS ON NUTRITIVE VALUE OF FOOD ITEMS
11 MIDDLE EAST & AFRICA FOOD ANTI CAKING AGENTS MARKET, BY TYPE
11.1 OVERVIEW
11.2 SILICON COMPOUNDS
11.2.1 SILICON DIOXIDE
11.2.2 CALCIUM SILICATE
11.2.3 ALUMINUM SILICATE
11.2.4 SODIUM ALUMINOSILICATE
11.2.5 POTASSIUM ALUMINUM SILICATE
11.2.6 CALCIUM ALUMINOSILICATE
11.2.7 POLYDIMETHYLSILOXANE
11.3 MICROCRYSTALLINE CELLULOSE
11.3.1 POWDERED CELLULOSE
11.3.2 TALCUM POWDER
11.4 CALCIUM COMPOUNDS
11.4.1 CALCIUM CARBONATES
11.4.2 TRI CALCIUM PHOSPHATE
11.4.3 CALCIUM FERROCYANIDE
11.4.4 CALCIUM PHOSPHATE
11.5 SODIUM COMPOUNDS
11.5.1 SODIUM BICARBONATE
11.5.2 SODIUM FERROCYANIDE
11.6 MAGNESIUM COMPOUNDS
11.6.1 MAGNESIUM CARBONATE
11.6.2 MAGNESIUM STEARATE
11.6.3 MAGNESIUM OXIDE
11.6.4 MAGNESIUM TRISILICATE
11.6.5 MAGNESIUM HYDROXIDE
11.7 OTHERS
11.7.1 ZEOLITES
11.7.2 BENTONITE
11.7.3 STEARIC ACID
11.7.4 OTHERS
12 MIDDLE EAST & AFRICA FOOD ANTI CAKING AGENTS MARKET, BY SOURCE
12.1 OVERVIEW
12.2 SYNTHETIC/ARTIFICIAL AGENTS
12.3 NATURAL AGENTS
13 MIDDLE EAST & AFRICA FOOD ANTI CAKING AGENTS MARKET, BY PRODUCT CATEGORY
13.1 OVERVIEW
13.2 NON GMO
13.3 GMO
14 MIDDLE EAST & AFRICA FOOD ANTI CAKING AGENTS MARKET, BY FORM
14.1 OVERVIEW
14.2 POWDER
14.3 LIQUID
15 MIDDLE EAST & AFRICA FOOD ANTI CAKING AGENTS MARKET, BY APPLICATION
15.1 OVERVIEW
15.2 CONFECTIONARY
15.2.1 CONFECTIONARY, BY TYPE
15.2.1.1 CHOCOLATE
15.2.1.2 HARD & SOFT CANDY
15.2.1.3 TOFFEES
15.2.1.4 CARAMEL & NOUGATS
15.2.1.5 GUMS& JELLY
15.2.1.6 CREAM FILLINGS
15.2.1.7 OTHERS
15.3 BAKERY PRODUCTS
15.3.1 BAKERY PRODUCTS, BY TYPE
15.3.1.1 BREAD AND ROLLS
15.3.1.2 CAKES AND PASTRIES
15.3.1.3 BISCUITS
15.3.1.4 MUFFINS
15.3.1.5 COOKIES
15.3.1.6 DOUGHNUTS
15.3.1.7 OTHERS
15.4 DAIRY PRODUCTS
15.4.1 DAIRY PRODUCTS, BY TYPE
15.4.1.1 CHEESE
15.4.1.1.1 SHREDDED CHEESE
15.4.1.1.2 CUBED CHEESE
15.4.1.1.3 HIGH MOISTURE CRUMBLED CHEESE
15.4.1.2 ICE-CREAM
15.4.1.2.1 IMPULSE ICE-CREAM
15.4.1.2.2 TAKE HOME ICE-CREAM
15.4.1.3 MILK POWDER
15.4.1.4 DAIRY SPREAD
15.4.1.5 YOGURT
15.4.1.6 OTHERS
15.5 CONVENIENCE FOOD
15.5.1 CONVENIENCE FOOD, BY TYPE
15.5.1.1 PIZZA
15.5.1.2 READY TO EAT PRODUCTS
15.5.1.3 PASTA
15.5.1.4 NOODLES
15.5.1.5 SOUPS & SAUCES
15.5.1.6 SEASONINGS & DRESSINGS
15.5.1.7 NUTS
15.5.1.8 SEEDS
15.5.1.9 PREMIXES
15.5.1.10 TRAIL MIXES
15.5.1.11 OTHERS
15.6 DIETARY NUTRITION
15.7 SPORT NUTRITION
15.8 PROCESSED MEAT PRODUCTS
15.8.1 PROCESSED MEAT, BY TYPE
15.8.1.1 BEEF
15.8.1.2 PORK
15.8.1.3 POULTRY
15.8.1.4 SWINE
15.8.1.5 MUTTON
15.8.1.6 OTHERS
15.9 BEVERAGES
15.9.1 BEVERAGES, BY TYPE
15.9.1.1 RTD BEVERAGES
15.1 SOUPS AND SAUCES
15.11 SEASONINGS AND CONDIMENTS
15.12 INFANT FORMULA
15.13 OTHERS
15.13.1 OTHERS, BY TYPE
15.13.1.1 SPICES POWDERED
15.13.1.2 HERBS EXTRACTS POWDERED
16 MIDDLE EAST & AFRICA FOOD ANTI CAKING AGENTS MARKET, BY REGION
16.1 MIDDLE EAST AND AFRICA
16.1.1 U.A.E
16.1.2 QATAR
16.1.3 SAUDI ARABIA
16.1.4 EGYPT
16.1.5 SOUTH AFRICA
16.1.6 BAHRAIN
16.1.7 KUWAIT
16.1.8 OMAN
16.1.9 REST OF MIDDLE EAST AND AFRICA
17 COMPANY LANDSCAPE
17.1 COMPANY SHARE ANALYSIS: MIDDLE EAST & AFRICA
18 SWOT ANALYSIS
19 COMPANY PROFILE
19.1 EVONIK INDUSTRIES AG
19.1.1 COMPANY SNAPSHOT
19.1.2 REVENUE ANALYSIS
19.1.3 COMPANY SHARE ANALYSIS
19.1.4 PRODUCT PORTFOLIO
19.1.5 RECENT DEVELOPMENTS
19.2 PPG INDUSTRIES, INC.
19.2.1 COMPANY SNAPSHOT
19.2.2 REVENUE ANALYSIS
19.2.3 COMPANY SHARE ANALYSIS
19.2.4 PRODUCT PORTFOLIO
19.2.5 RECENT DEVELOPMENT
19.3 PQ
19.3.1 COMPANY SNAPSHOT
19.3.2 REVENUE ANALYSIS
19.3.3 COMPANY SHARE ANALYSIS
19.3.4 PRODUCT PORTFOLIO
19.3.5 RECENT DEVELOPMENTS
19.4 W.R. GRACE & CO.-CONN
19.4.1 COMPANY SNAPSHOT
19.4.2 REVENUE ANALYSIS
19.4.3 COMPANY SHARE ANALYSIS
19.4.4 PRODUCT PORTFOLIO
19.4.5 RECENT DEVELOPMENTS
19.5 ALLIED BLENDING
19.5.1 COMPANY SNAPSHOT
19.5.2 COMPANY SHARE ANALYSIS
19.5.3 PRODUCT PORTFOLIO
19.5.4 RECENT DEVELOPMENT
19.6 ANMOL CHEMICALS
19.6.1 COMPANY SNAPSHOT
19.6.2 PRODUCT PORTFOLIO
19.6.3 RECENT DEVELOPMENT
19.7 ASTTRA CHEMICALS
19.7.1 COMPANY SNAPSHOT
19.7.2 PRODUCT PORTFOLIO
19.7.3 RECENT DEVELOPMENT
19.8 BIMAL PHARMA PVT. LTD.
19.8.1 COMPANY SNAPSHOT
19.8.2 PRODUCT PORTFOLIO
19.8.3 RECENT DEVELOPMENT
19.9 CELLULOSE MANUFACTURER- ANKIT PULPS
19.9.1 COMPANY SNAPSHOT
19.9.2 PRODUCT PORTFOLIO
19.9.3 RECENT DEVELOPMENT
19.1 FOODCHEM INTERNATIONAL CORPORATION
19.10.1 COMPANY SNAPSHOT
19.10.2 PRODUCT PORTFOLIO
19.10.3 RECENT DEVELOPMENT
19.11 FUJI CHEMICAL INDUSTRIES CO., LTD.
19.11.1 COMPANY SNAPSHOT
19.11.2 PRODUCT PORTFOLIO
19.11.3 RECENT DEVELOPMENT
19.12 HEFEI TNJ CHEMICAL INDUSTRY CO., LTD.
19.12.1 COMPANY SNAPSHOT
19.12.2 PRODUCT PORTFOLIO
19.12.3 RECENT DEVELOPMENT
19.13 HUBER ENGINEERED MATERIALS
19.13.1 COMPANY SNAPSHOT
19.13.2 PRODUCT PORTFOLIO
19.13.3 RECENT DEVELOPMENTS
19.14 JELU-WERK J. EHRLER GMBH & CO. KG
19.14.1 COMPANY SNAPSHOT
19.14.2 PRODUCT PORTFOLIO
19.14.3 RECENT DEVELOPMENT
19.15 JINSHA PRECIPITATED SILICA MANUFACTURING CO., LTD.
19.15.1 COMPANY SNAPSHOT
19.15.2 PRODUCT PORTFOLIO
19.15.3 RECENT DEVELOPMENT
19.16 KONOSHIMA CHEMICAL CO., LTD.
19.16.1 COMPANY SNAPSHOT
19.16.2 REVENUE ANALYSIS
19.16.3 PRODUCT PORTFOLIO
19.16.4 RECENT DEVELOPMENT
19.17 MUBY CHEMICALS
19.17.1 COMPANY SNAPSHOT
19.17.2 PRODUCT PORTFOLIO
19.17.3 RECENT DEVELOPMENT
19.18 NB ENTREPRENEURS
19.18.1 COMPANY SNAPSHOT
19.18.2 PRODUCT PORTFOLIO
19.18.3 RECENT DEVELOPMENT
19.19 RANQ
19.19.1 COMPANY SNAPSHOT
19.19.2 PRODUCT PORTFOLIO
19.19.3 RECENT DEVELOPMENT
19.2 REGOJ CHEMICAL INDUSTRIES
19.20.1 COMPANY SNAPSHOT
19.20.2 PRODUCT PORTFOLIO
19.20.3 RECENT DEVELOPMENT
19.21 REMEDY LABS GROUP
19.21.1 COMPANY SNAPSHOT
19.21.2 PRODUCT PORTFOLIO
19.21.3 RECENT DEVELOPMENT
19.22 SAPTHAGIRI AROMATICS
19.22.1 COMPANY SNAPSHOT
19.22.2 PRODUCT PORTFOLIO
19.22.3 RECENT DEVELOPMENT
19.23 SBF PHARMA
19.23.1 COMPANY SNAPSHOT
19.23.2 PRODUCT PORTFOLIO
19.23.3 RECENT DEVELOPMENT
19.24 SIGACHI INDUSTRIES
19.24.1 COMPANY SNAPSHOT
19.24.2 REVENUE ANALYSIS
19.24.3 PRODUCT PORTFOLIO
19.24.4 RECENT DEVELOPMENT
19.25 SINTHESIS GREENCHEM PVT. LTD.
19.25.1 COMPANY SNAPSHOT
19.25.2 PRODUCT PORTFOLIO
19.25.3 RECENT DEVELOPMENT
19.26 SOLVAY
19.26.1 COMPANY SNAPSHOT
19.26.2 REVENUE ANALYSIS
19.26.3 PRODUCT PORTFOLIO
19.26.4 RECENT DEVELOPMENTS
20 QUESTIONNAIRE
21 RELATED REPORTS
Lista de Tablas
TABLE 1 MIDDLE EAST & AFRICA IMPORTERS OF SILICON DIOXIDE HS CODE OF PRODUCT: 28112 (UNIT US DOLLAR THOUSAND)
TABLE 2 MIDDLE EAST & AFRICA EXPORTERS OF SILICON DI OXIDE, HS CODE OF PRODUCT: 28112 (UNIT: US DOLLAR THOUSAND)
TABLE 3 MIDDLE EAST & AFRICA IMPORTERS OF CALCIUM CARBONATE, HS CODE OF PRODUCT: 283650 (UNIT US DOLLAR THOUSAND)
TABLE 4 MIDDLE EAST & AFRICA EXPORTERS OF CALCIUM CARBONATE, HS CODE OF PRODUCT: 283650 (UNIT US DOLLAR THOUSAND)
TABLE 5 MIDDLE EAST & AFRICA IMPORTERS OF CALCIUM PHOSPHATE, HS CODE OF PRODUCT: 283526 (UNIT US DOLLAR THOUSAND)
TABLE 6 MIDDLE EAST & AFRICA EXPORTERS OF CALCIUM PHOSPHATE, HS CODE OF PRODUCT: 283526 (UNIT US DOLLAR THOUSAND)
TABLE 7 MIDDLE EAST & AFRICA IMPORTERS OF SODIUM BICARBONATE, HS CODE OF PRODUCT: 283630 (UNIT US DOLLAR THOUSAND)
TABLE 8 MIDDLE EAST & AFRICA EXPORTERS OF SODIUM BICARBONATE, HS CODE OF PRODUCT: 283630 (UNIT US DOLLAR THOUSAND)
TABLE 9 FREE ON BOARD (FOB) OF MIDDLE EAST & AFRICA FOOD ANTI CAKING AGENTS MARKET
TABLE 10 MIDDLE EAST & AFRICA FOOD ANTI CAKING AGENTS MARKET, BY TYPE, 2021-2030 (USD MILLION)
TABLE 11 MIDDLE EAST & AFRICA FOOD ANTI CAKING AGENTS MARKET, BY TYPE, 2021-2030 (TON)
TABLE 12 MIDDLE EAST & AFRICA SILICON COMPOUNDS IN FOOD ANTI CAKING AGENTS MARKET, BY REGION, 2021-2030 (USD MILLION)
TABLE 13 MIDDLE EAST & AFRICA SILICON COMPOUNDS IN FOOD ANTI CAKING AGENTS MARKET, BY REGION, 2021-2030 (TONS)
TABLE 14 MIDDLE EAST & AFRICA SILICON COMPOUNDS IN FOOD ANTI CAKING AGENTS MARKET, BY TYPE, 2021-2030 (USD MILLION)
TABLE 15 MIDDLE EAST & AFRICA SILICON COMPOUNDS IN FOOD ANTI CAKING AGENTS MARKET, BY TYPE, 2021-2030 (TON)
TABLE 16 MIDDLE EAST & AFRICA MICROCRYSTALLINE CELLULOSE IN FOOD ANTI CAKING AGENTS MARKET, BY REGION, 2021-2030 (USD MILLION)
TABLE 17 MIDDLE EAST & AFRICA MICROCRYSTALLINE CELLULOSE IN FOOD ANTI CAKING AGENTS MARKET, BY REGION, 2021-2030 (TON)
TABLE 18 MIDDLE EAST & AFRICA MICROCRYSTALLINE CELLULOSE IN FOOD ANTI CAKING AGENTS MARKET, BY TYPE, 2021-2030 (USD MILLION)
TABLE 19 MIDDLE EAST & AFRICA MICROCRYSTALLINE CELLULOSE IN FOOD ANTI CAKING AGENTS MARKET, BY TYPE, 2021-2030 (TON)
TABLE 20 MIDDLE EAST & AFRICA CALCIUM COMPOUNDS IN FOOD ANTI CAKING AGENTS MARKET, BY REGION, 2021-2030 (USD MILLION)
TABLE 21 MIDDLE EAST & AFRICA CALCIUM COMPOUNDS IN FOOD ANTI CAKING AGENTS MARKET, BY REGION, 2021-2030 (TON)
TABLE 22 MIDDLE EAST & AFRICA CALCIUM COMPOUNDS IN FOOD ANTI CAKING AGENTS MARKET, BY TYPE, 2021-2030 (USD MILLION)
TABLE 23 MIDDLE EAST & AFRICA CALCIUM COMPOUNDS IN FOOD ANTI CAKING AGENTS MARKET, BY TYPE, 2021-2030 (TON)
TABLE 24 MIDDLE EAST & AFRICA SODIUM COMPOUNDS IN FOOD ANTI CAKING AGENTS MARKET, BY REGION, 2021-2030 (USD MILLION)
TABLE 25 MIDDLE EAST & AFRICA SODIUM COMPOUNDS IN FOOD ANTI CAKING AGENTS MARKET, BY REGION, 2021-2030 (TON)
TABLE 26 MIDDLE EAST & AFRICA SODIUM COMPOUNDS IN FOOD ANTI CAKING AGENTS MARKET, BY TYPE, 2021-2030 (USD MILLION)
TABLE 27 MIDDLE EAST & AFRICA SODIUM COMPOUNDS IN FOOD ANTI CAKING AGENTS MARKET, BY TYPE, 2021-2030 (TON)
TABLE 28 MIDDLE EAST & AFRICA MAGNESIUM COMPOUNDS IN FOOD ANTI CAKING AGENTS MARKET, BY REGION, 2021-2030 (USD MILLION)
TABLE 29 MIDDLE EAST & AFRICA MAGNESIUM COMPOUNDS IN FOOD ANTI CAKING AGENTS MARKET, BY REGION, 2021-2030 (TON)
TABLE 30 MIDDLE EAST & AFRICA MAGNESIUM COMPOUNDS IN FOOD ANTI CAKING AGENTS MARKET, BY TYPE, 2021-2030 (USD MILLION)
TABLE 31 MIDDLE EAST & AFRICA MAGNESIUM COMPOUNDS IN FOOD ANTI CAKING AGENTS MARKET, BY TYPE, 2021-2030 (TON)
TABLE 32 MIDDLE EAST & AFRICA OTHERS IN FOOD ANTI CAKING AGENTS MARKET, BY REGION, 2021-2030 (USD MILLION)
TABLE 33 MIDDLE EAST & AFRICA OTHERS IN FOOD ANTI CAKING AGENTS MARKET, BY REGION, 2021-2030 (TON)
TABLE 34 MIDDLE EAST & AFRICA OTHERS IN FOOD ANTI CAKING AGENTS MARKET, BY TYPE, 2021-2030 (USD MILLION)
TABLE 35 MIDDLE EAST & AFRICA FOOD ANTI CAKING AGENTS MARKET, BY SOURCE, 2021-2030 (USD MILLION)
TABLE 36 MIDDLE EAST & AFRICA FOOD ANTI CAKING AGENTS MARKET, BY SOURCE, 2021-2030 (TON)
TABLE 37 MIDDLE EAST & AFRICA SYNTHETIC/ARTIFICIAL AGENTS IN FOOD ANTI CAKING AGENTS MARKET, BY REGION, 2021-2030 (USD MILLION)
TABLE 38 MIDDLE EAST & AFRICA SYNTHETIC/ARTIFICIAL AGENTS IN FOOD ANTI CAKING AGENTS MARKET, BY REGION, 2021-2030 (TON)
TABLE 39 MIDDLE EAST & AFRICA NATURAL AGENTS IN FOOD ANTI CAKING AGENTS MARKET, BY REGION, 2021-2030 (USD MILLION)
TABLE 40 MIDDLE EAST & AFRICA NATURAL AGENTS IN FOOD ANTI CAKING AGENTS MARKET, BY REGION, 2021-2030 (TON)
TABLE 41 MIDDLE EAST & AFRICA FOOD ANTI CAKING AGENTS MARKET, BY PRODUCT CATEGORY, 2021-2030 (USD MILLION)
TABLE 42 MIDDLE EAST & AFRICA FOOD ANTI CAKING AGENTS MARKET, BY PRODUCT CATEGORY, 2021-2030 (TON)
TABLE 43 MIDDLE EAST & AFRICA NON-GMO IN FOOD ANTI CAKING AGENTS MARKET, BY REGION, 2021-2030 (USD MILLION)
TABLE 44 MIDDLE EAST & AFRICA NON-GMO IN FOOD ANTI CAKING AGENTS MARKET, BY REGION, 2021-2030 (TON)
TABLE 45 MIDDLE EAST & AFRICA GMO IN FOOD ANTI CAKING AGENTS MARKET, BY REGION, 2021-2030 (USD MILLION)
TABLE 46 MIDDLE EAST & AFRICA GMO IN FOOD ANTI CAKING AGENTS MARKET, BY REGION, 2021-2030 (TON)
TABLE 47 MIDDLE EAST & AFRICA FOOD ANTI CAKING AGENTS MARKET, BY FORM, 2021-2030 (USD MILLION)
TABLE 48 MIDDLE EAST & AFRICA FOOD ANTI CAKING AGENTS MARKET, BY FORM, 2021-2030 (TON)
TABLE 49 MIDDLE EAST & AFRICA POWDER IN FOOD ANTI CAKING AGENTS MARKET, BY REGION, 2021-2030 (USD MILLION)
TABLE 50 MIDDLE EAST & AFRICA POWDER IN FOOD ANTI CAKING AGENTS MARKET, BY REGION, 2021-2030 (TON)
TABLE 51 MIDDLE EAST & AFRICA LIQUID IN FOOD ANTI CAKING AGENTS MARKET, BY REGION, 2021-2030 (USD MILLION)
TABLE 52 MIDDLE EAST & AFRICA LIQUID IN FOOD ANTI CAKING AGENTS MARKET, BY REGION, 2021-2030 (TON)
TABLE 53 MIDDLE EAST & AFRICA FOOD ANTI CAKING AGENTS MARKET, BY APPLICATION, 2021-2030 (USD MILLION)
TABLE 54 MIDDLE EAST & AFRICA FOOD ANTI CAKING AGENTS MARKET, BY APPLICATION, 2021-2030 (TON)
TABLE 55 MIDDLE EAST & AFRICA CONFECTIONERY IN FOOD ANTI CAKING AGENTS MARKET, BY REGION, 2021-2030 (USD MILLION)
TABLE 56 MIDDLE EAST & AFRICA CONFECTIONERY IN FOOD ANTI CAKING AGENTS MARKET, BY REGION, 2021-2030 (TON)
TABLE 57 MIDDLE EAST & AFRICA CONFECTIONARY IN FOOD ANTI CAKING AGENTS MARKET, BY TYPE, 2021-2030 (USD MILLION)
TABLE 58 MIDDLE EAST & AFRICA CONFECTIONARY IN FOOD ANTI CAKING AGENTS MARKET, BY TYPE, 2021-2030 (TON)
TABLE 59 MIDDLE EAST & AFRICA BAKERY PRODUCTS IN FOOD ANTI CAKING AGENTS MARKET, BY REGION, 2021-2030 (USD MILLION)
TABLE 60 MIDDLE EAST & AFRICA BAKERY PRODUCTS IN FOOD ANTI CAKING AGENTS MARKET, BY REGION, 2021-2030 (TON)
TABLE 61 MIDDLE EAST & AFRICA BAKERY PRODUCTS IN FOOD ANTI CAKING AGENTS MARKET, BY TYPE, 2021-2030 (USD MILLION)
TABLE 62 MIDDLE EAST & AFRICA BAKERY PRODUCTS IN FOOD ANTI CAKING AGENTS MARKET, BY TYPE, 2021-2030 (TON)
TABLE 63 MIDDLE EAST & AFRICA DAIRY PRODUCTS IN FOOD ANTI CAKING AGENTS MARKET, BY REGION, 2021-2030 (USD MILLION)
TABLE 64 MIDDLE EAST & AFRICA DAIRY PRODUCTS IN FOOD ANTI CAKING AGENTS MARKET, BY REGION, 2021-2030 (TON)
TABLE 65 MIDDLE EAST & AFRICA DAIRY PRODUCTS IN FOOD ANTI CAKING AGENTS MARKET, BY TYPE, 2021-2030 (USD MILLION)
TABLE 66 MIDDLE EAST & AFRICA DAIRY PRODUCTS IN FOOD ANTI CAKING AGENTS MARKET, BY TYPE, 2021-2030 (TONS)
TABLE 67 MIDDLE EAST & AFRICA CHEESE IN FOOD ANTI CAKING AGENTS MARKET, BY TYPE, 2021-2030 (USD MILLION)
TABLE 68 MIDDLE EAST & AFRICA CHEESE IN FOOD ANTI CAKING AGENTS MARKET, BY TYPE, 2021-2030 (TON)
TABLE 69 MIDDLE EAST & AFRICA ICE-CREAM IN FOOD ANTI CAKING AGENTS MARKET, BY TYPE, 2021-2030 (USD MILLION)
TABLE 70 MIDDLE EAST & AFRICA ICE-CREAM IN FOOD ANTI CAKING AGENTS MARKET, BY TYPE, 2021-2030 (TON)
TABLE 71 MIDDLE EAST & AFRICA CONVENIENCE FOOD IN FOOD ANTI CAKING AGENTS MARKET, BY REGION, 2021-2030 (USD MILLION)
TABLE 72 MIDDLE EAST & AFRICA CONVENIENCE FOOD IN FOOD ANTI CAKING AGENTS MARKET, BY REGION, 2021-2030 (TON)
TABLE 73 MIDDLE EAST & AFRICA CONVENIENCE FOOD IN FOOD ANTI CAKING AGENTS MARKET, BY TYPE, 2021-2030 (USD MILLION)
TABLE 74 MIDDLE EAST & AFRICA CONVENIENCE FOOD IN FOOD ANTI CAKING AGENTS MARKET, BY TYPE, 2021-2030 (TON)
TABLE 75 MIDDLE EAST & AFRICA DIETARY NUTRITION IN FOOD ANTI CAKING AGENTS MARKET, BY REGION, 2021-2030 (USD MILLION)
TABLE 76 MIDDLE EAST & AFRICA DIETARY NUTRITION IN FOOD ANTI CAKING AGENTS MARKET, BY REGION, 2021-2030 (TON)
TABLE 77 MIDDLE EAST & AFRICA SPORT NUTRITION IN FOOD ANTI CAKING AGENTS MARKET, BY REGION, 2021-2030 (USD MILLION)
TABLE 78 MIDDLE EAST & AFRICA SPORT NUTRITION IN FOOD ANTI CAKING AGENTS MARKET, BY REGION, 2021-2030 (TON)
TABLE 79 MIDDLE EAST & AFRICA PROCESSED MEAT PRODUCTS IN FOOD ANTI CAKING AGENTS MARKET, BY REGION, 2021-2030 (USD MILLION)
TABLE 80 MIDDLE EAST & AFRICA PROCESSED MEAT PRODUCTS IN FOOD ANTI CAKING AGENTS MARKET, BY REGION, 2021-2030 (TON)
TABLE 81 MIDDLE EAST & AFRICA PROCESSED MEAT IN FOOD ANTI CAKING AGENTS MARKET, BY TYPE, 2021-2030 (USD MILLION)
TABLE 82 MIDDLE EAST & AFRICA PROCESSED MEAT IN FOOD ANTI CAKING AGENTS MARKET, BY TYPE, 2021-2030 (TON)
TABLE 83 MIDDLE EAST & AFRICA BEVERAGES IN FOOD ANTI CAKING AGENTS MARKET, BY REGION, 2021-2030 (USD MILLION)
TABLE 84 MIDDLE EAST & AFRICA BEVERAGES IN FOOD ANTI CAKING AGENTS MARKET, BY REGION, 2021-2030 (TON)
TABLE 85 MIDDLE EAST & AFRICA BEVERAGES IN FOOD ANTI CAKING AGENTS MARKET, BY TYPE, 2021-2030 (USD MILLION)
TABLE 86 MIDDLE EAST & AFRICA BEVERAGES IN FOOD ANTI CAKING AGENTS MARKET, BY TYPE, 2021-2030 (TON)
TABLE 87 MIDDLE EAST & AFRICA SOUPS & SAUCES IN FOOD ANTI CAKING AGENTS MARKET, BY REGION, 2021-2030 (USD MILLION)
TABLE 88 MIDDLE EAST & AFRICA SOUPS & SAUCES IN FOOD ANTI CAKING AGENTS MARKET, BY REGION, 2021-2030 (TON)
TABLE 89 MIDDLE EAST & AFRICA SEASONING & CONDIMENTS IN FOOD ANTI CAKING AGENTS MARKET, BY REGION, 2021-2030 (USD MILLION)
TABLE 90 MIDDLE EAST & AFRICA SEASONING & CONDIMENTS IN FOOD ANTI CAKING AGENTS MARKET, BY REGION, 2021-2030 (TON)
TABLE 91 MIDDLE EAST & AFRICA INFANT FORMULA IN FOOD ANTI CAKING AGENTS MARKET, BY REGION, 2021-2030 (USD MILLION)
TABLE 92 MIDDLE EAST & AFRICA INFANT FORMULA IN FOOD ANTI CAKING AGENTS MARKET, BY REGION, 2021-2030 (TON)
TABLE 93 MIDDLE EAST & AFRICA OTHERS IN FOOD ANTI CAKING AGENTS MARKET, BY REGION, 2021-2030 (USD MILLION)
TABLE 94 MIDDLE EAST & AFRICA OTHERS IN FOOD ANTI CAKING AGENTS MARKET, BY REGION, 2021-2030 (TON)
TABLE 95 MIDDLE EAST & AFRICA OTHERS IN FOOD ANTI CAKING AGENTS MARKET, BY TYPE, 2021-2030 (USD MILLION)
TABLE 96 MIDDLE EAST & AFRICA OTHERS IN FOOD ANTI CAKING AGENTS MARKET, BY TYPE, 2021-2030 (TON)
TABLE 97 MIDDLE EAST AND AFRICA FOOD ANTI CAKING AGENTS MARKET, BY COUNTRY, 2021-2030 (USD MILLION)
TABLE 98 MIDDLE EAST AND AFRICA FOOD ANTI CAKING AGENTS MARKET, BY COUNTRY, 2021-2030 (TON)
TABLE 99 MIDDLE EAST AND AFRICA FOOD ANTI CAKING AGENTS MARKET, BY COUNTRY, 2021-2030 (ASP)
TABLE 100 MIDDLE EAST AND AFRICA FOOD ANTI CAKING AGENT MARKET, BY TYPE, 2021-2030 (USD MILLION)
TABLE 101 MIDDLE EAST AND AFRICA FOOD ANTI CAKING AGENT MARKET, BY TYPE, 2021-2030 (TON)
TABLE 102 MIDDLE EAST AND AFRICA FOOD ANTI CAKING AGENT MARKET, BY TYPE, 2021-2030 (ASP)
TABLE 103 MIDDLE EAST AND AFRICA CALCIUM COMPOUNDS IN FOOD ANTI CAKING AGENT MARKET, BY TYPE, 2021-2030 (USD MILLION)
TABLE 104 MIDDLE EAST AND AFRICA CALCIUM COMPOUNDS IN FOOD ANTI CAKING AGENT MARKET, BY TYPE, 2021-2030 (TON)
TABLE 105 MIDDLE EAST AND AFRICA CALCIUM COMPOUNDS IN FOOD ANTI CAKING AGENT MARKET, BY TYPE, 2021-2030 (ASP)
TABLE 106 MIDDLE EAST AND AFRICA SODIUM COMPOUNDS IN FOOD ANTI CAKING AGENT MARKET, BY TYPE, 2021-2030 (USD MILLION)
TABLE 107 MIDDLE EAST AND AFRICA SODIUM COMPOUNDS IN FOOD ANTI CAKING AGENT MARKET, BY TYPE, 2021-2030 (TON)
TABLE 108 MIDDLE EAST AND AFRICA MAGNESIUM COMPOUNDS IN FOOD ANTI CAKING AGENT MARKET, BY TYPE, 2021-2030 (USD MILLION)
TABLE 109 MIDDLE EAST AND AFRICA MAGNESIUM COMPOUNDS IN FOOD ANTI CAKING AGENT MARKET, BY TYPE, 2021-2030 (TON)
TABLE 110 MIDDLE EAST AND AFRICA MICROCRYSTALLINE CELLULOSE IN FOOD ANTI CAKING AGENT MARKET, BY TYPE, 2021-2030 (USD MILLION)
TABLE 111 MIDDLE EAST AND AFRICA MICROCRYSTALLINE CELLULOSE IN FOOD ANTI CAKING AGENT MARKET, BY TYPE, 2021-2030 (TON)
TABLE 112 MIDDLE EAST AND AFRICA SILICON COMPOUNDS IN FOOD ANTI CAKING AGENT MARKET, BY TYPE, 2021-2030 (USD MILLION)
TABLE 113 MIDDLE EAST AND AFRICA SILICON COMPOUNDS IN FOOD ANTI CAKING AGENT MARKET, BY TYPE, 2021-2030 (TON)
TABLE 114 MIDDLE EAST AND AFRICA OTHERS IN FOOD ANTI CAKING AGENT MARKET, BY TYPE, 2021-2030 (USD MILLION)
TABLE 115 MIDDLE EAST AND AFRICA OTHERS IN FOOD ANTI CAKING AGENT MARKET, BY TYPE, 2021-2030 (TON)
TABLE 116 MIDDLE EAST AND AFRICA FOOD ANTI CAKING AGENT MARKET, BY SOURCE, 2021-2030 (USD MILLION)
TABLE 117 MIDDLE EAST AND AFRICA FOOD ANTI CAKING AGENT MARKET, BY SOURCE, 2021-2030 (TON)
TABLE 118 MIDDLE EAST AND AFRICA FOOD ANTI CAKING AGENT MARKET, BY SOURCE, 2021-2030 (ASP)
TABLE 119 MIDDLE EAST AND AFRICA FOOD ANTI CAKING AGENT MARKET, BY PRODUCT CATEGORY, 2021-2030 (USD MILLION)
TABLE 120 MIDDLE EAST AND AFRICA FOOD ANTI CAKING AGENT MARKET, BY PRODUCT CATEGORY, 2021-2030 (TON)
TABLE 121 MIDDLE EAST AND AFRICA FOOD ANTI CAKING AGENT MARKET, BY PRODUCT CATEGORY, 2021-2030 (ASP)
TABLE 122 MIDDLE EAST AND AFRICA FOOD ANTI CAKING AGENT MARKET, BY FORM, 2021-2030 (USD MILLION)
TABLE 123 MIDDLE EAST AND AFRICA FOOD ANTI CAKING AGENT MARKET, BY FORM, 2021-2030 (TON)
TABLE 124 MIDDLE EAST AND AFRICA FOOD ANTI CAKING AGENT MARKET, BY FORM, 2021-2030 (ASP)
TABLE 125 MIDDLE EAST AND AFRICA FOOD ANTI CAKING AGENT MARKET, BY APPLICATION, 2021-2030 (USD MILLION)
TABLE 126 MIDDLE EAST AND AFRICA FOOD ANTI CAKING AGENT MARKET, BY APPLICATION, 2021-2030 (TON)
TABLE 127 MIDDLE EAST AND AFRICA FOOD ANTI CAKING AGENT MARKET, BY APPLICATION, 2021-2030 (ASP)
TABLE 128 MIDDLE EAST AND AFRICA DAIRY PRODUCTS IN FOOD ANTI CAKING AGENT MARKET, BY TYPE, 2021-2030 (USD MILLION)
TABLE 129 MIDDLE EAST AND AFRICA DAIRY PRODUCTS IN FOOD ANTI CAKING AGENT MARKET, BY TYPE, 2021-2030 (TON)
TABLE 130 MIDDLE EAST AND AFRICA CHEESE IN FOOD ANTI CAKING AGENT MARKET, BY TYPE, 2021-2030 (USD MILLION)
TABLE 131 MIDDLE EAST AND AFRICA CHEESE IN FOOD ANTI CAKING AGENT MARKET, BY TYPE, 2021-2030 (TON)
TABLE 132 MIDDLE EAST AND AFRICA ICE-CREAM IN FOOD ANTI CAKING AGENT MARKET, BY TYPE, 2021-2030 (USD MILLION)
TABLE 133 MIDDLE EAST AND AFRICA ICE-CREAM IN FOOD ANTI CAKING AGENT MARKET, BY TYPE, 2021-2030 (TON)
TABLE 134 MIDDLE EAST AND AFRICA BAKERY PRODUCTS IN FOOD ANTI CAKING AGENT MARKET, BY TYPE, 2021-2030 (USD MILLION)
TABLE 135 MIDDLE EAST AND AFRICA BAKERY PRODUCTS IN FOOD ANTI CAKING AGENT MARKET, BY TYPE, 2021-2030 (TON)
TABLE 136 MIDDLE EAST AND AFRICA CONVENIENCE FOOD IN FOOD ANTI CAKING AGENT MARKET, BY TYPE, 2021-2030 (USD MILLION)
TABLE 137 MIDDLE EAST AND AFRICA CONVENIENCE FOOD IN FOOD ANTI CAKING AGENT MARKET, BY TYPE, 2021-2030 (TON)
TABLE 138 MIDDLE EAST AND AFRICA PROCESSED MEAT PRODUCTS IN FOOD ANTI CAKING AGENT MARKET, BY TYPE, 2021-2030 (USD MILLION)
TABLE 139 MIDDLE EAST AND AFRICA PROCESSED MEAT PRODUCTS IN FOOD ANTI CAKING AGENT MARKET, BY TYPE, 2021-2030 (TON)
TABLE 140 MIDDLE EAST AND AFRICA CONFECTIONERY IN FOOD ANTI CAKING AGENT MARKET, BY TYPE, 2021-2030 (USD MILLION)
TABLE 141 MIDDLE EAST AND AFRICA CONFECTIONERY IN FOOD ANTI CAKING AGENT MARKET, BY TYPE, 2021-2030 (TON)
TABLE 142 MIDDLE EAST AND AFRICA BEVERAGE IN FOOD ANTI CAKING AGENT MARKET, BY TYPE, 2021-2030 (USD MILLION)
TABLE 143 MIDDLE EAST AND AFRICA BEVERAGE IN FOOD ANTI CAKING AGENT MARKET, BY TYPE, 2021-2030 (TON)
TABLE 144 MIDDLE EAST AND AFRICA OTHERS IN FOOD ANTI CAKING AGENT MARKET, BY TYPE, 2021-2030 (USD MILLION)
TABLE 145 MIDDLE EAST AND AFRICA OTHERS IN FOOD ANTI CAKING AGENT MARKET, BY TYPE, 2021-2030 (TON)
TABLE 146 U.A.E FOOD ANTI CAKING AGENT MARKET, BY TYPE, 2021-2030 (USD MILLION)
TABLE 147 U.A.E FOOD ANTI CAKING AGENT MARKET, BY TYPE, 2021-2030 (TON)
TABLE 148 U.A.E FOOD ANTI CAKING AGENT MARKET, BY TYPE, 2021-2030 (ASP)
TABLE 149 U.A.E CALCIUM COMPOUNDS IN FOOD ANTI CAKING AGENT MARKET, BY TYPE, 2021-2030 (USD MILLION)
TABLE 150 U.A.E CALCIUM COMPOUNDS IN FOOD ANTI CAKING AGENT MARKET, BY TYPE, 2021-2030 (TON)
TABLE 151 U.A.E CALCIUM COMPOUNDS IN FOOD ANTI CAKING AGENT MARKET, BY TYPE, 2021-2030 (ASP)
TABLE 152 U.A.E SODIUM COMPOUNDS IN FOOD ANTI CAKING AGENT MARKET, BY TYPE, 2021-2030 (USD MILLION)
TABLE 153 U.A.E SODIUM COMPOUNDS IN FOOD ANTI CAKING AGENT MARKET, BY TYPE, 2021-2030 (TON)
TABLE 154 U.A.E MAGNESIUM COMPOUNDS IN FOOD ANTI CAKING AGENT MARKET, BY TYPE, 2021-2030 (USD MILLION)
TABLE 155 U.A.E MAGNESIUM COMPOUNDS IN FOOD ANTI CAKING AGENT MARKET, BY TYPE, 2021-2030 (TON)
TABLE 156 U.A.E MICROCRYSTALLINE CELLULOSE IN FOOD ANTI CAKING AGENT MARKET, BY TYPE, 2021-2030 (USD MILLION)
TABLE 157 U.A.E MICROCRYSTALLINE CELLULOSE IN FOOD ANTI CAKING AGENT MARKET, BY TYPE, 2021-2030 (TON)
TABLE 158 U.A.E SILICON COMPOUNDS IN FOOD ANTI CAKING AGENT MARKET, BY TYPE, 2021-2030 (USD MILLION)
TABLE 159 U.A.E SILICON COMPOUNDS IN FOOD ANTI CAKING AGENT MARKET, BY TYPE, 2021-2030 (TON)
TABLE 160 U.A.E OTHERS IN FOOD ANTI CAKING AGENT MARKET, BY TYPE, 2021-2030 (USD MILLION)
TABLE 161 U.A.E OTHERS IN FOOD ANTI CAKING AGENT MARKET, BY TYPE, 2021-2030 (TON)
TABLE 162 U.A.E FOOD ANTI CAKING AGENT MARKET, BY SOURCE, 2021-2030 (USD MILLION)
TABLE 163 U.A.E FOOD ANTI CAKING AGENT MARKET, BY SOURCE, 2021-2030 (TON)
TABLE 164 U.A.E FOOD ANTI CAKING AGENT MARKET, BY SOURCE, 2021-2030 (ASP)
TABLE 165 U.A.E FOOD ANTI CAKING AGENT MARKET, BY PRODUCT CATEGORY, 2021-2030 (USD MILLION)
TABLE 166 U.A.E FOOD ANTI CAKING AGENT MARKET, BY PRODUCT CATEGORY, 2021-2030 (TON)
TABLE 167 U.A.E FOOD ANTI CAKING AGENT MARKET, BY PRODUCT CATEGORY, 2021-2030 (ASP)
TABLE 168 U.A.E FOOD ANTI CAKING AGENT MARKET, BY FORM, 2021-2030 (USD MILLION)
TABLE 169 U.A.E FOOD ANTI CAKING AGENT MARKET, BY FORM, 2021-2030 (TON)
TABLE 170 U.A.E FOOD ANTI CAKING AGENT MARKET, BY FORM, 2021-2030 (ASP)
TABLE 171 U.A.E FOOD ANTI CAKING AGENT MARKET, BY APPLICATION, 2021-2030 (USD MILLION)
TABLE 172 U.A.E FOOD ANTI CAKING AGENT MARKET, BY APPLICATION, 2021-2030 (TON)
TABLE 173 U.A.E FOOD ANTI CAKING AGENT MARKET, BY APPLICATION, 2021-2030 (ASP)
TABLE 174 U.A.E DAIRY PRODUCTS IN FOOD ANTI CAKING AGENT MARKET, BY TYPE, 2021-2030 (USD MILLION)
TABLE 175 U.A.E DAIRY PRODUCTS IN FOOD ANTI CAKING AGENT MARKET, BY TYPE, 2021-2030 (TON)
TABLE 176 U.A.E CHEESE IN FOOD ANTI CAKING AGENT MARKET, BY TYPE, 2021-2030 (USD MILLION)
TABLE 177 U.A.E CHEESE IN FOOD ANTI CAKING AGENT MARKET, BY TYPE, 2021-2030 (TON)
TABLE 178 U.A.E ICE-CREAM IN FOOD ANTI CAKING AGENT MARKET, BY TYPE, 2021-2030 (USD MILLION)
TABLE 179 U.A.E ICE-CREAM IN FOOD ANTI CAKING AGENT MARKET, BY TYPE, 2021-2030 (TON)
TABLE 180 U.A.E BAKERY PRODUCTS IN FOOD ANTI CAKING AGENT MARKET, BY TYPE, 2021-2030 (USD MILLION)
TABLE 181 U.A.E BAKERY PRODUCTS IN FOOD ANTI CAKING AGENT MARKET, BY TYPE, 2021-2030 (TON)
TABLE 182 U.A.E CONVENIENCE FOOD IN FOOD ANTI CAKING AGENT MARKET, BY TYPE, 2021-2030 (USD MILLION)
TABLE 183 U.A.E CONVENIENCE FOOD IN FOOD ANTI CAKING AGENT MARKET, BY TYPE, 2021-2030 (TON)
TABLE 184 U.A.E PROCESSED MEAT PRODUCTS IN FOOD ANTI CAKING AGENT MARKET, BY TYPE, 2021-2030 (USD MILLION)
TABLE 185 U.A.E PROCESSED MEAT PRODUCTS IN FOOD ANTI CAKING AGENT MARKET, BY TYPE, 2021-2030 (TON)
TABLE 186 U.A.E CONFECTIONERY IN FOOD ANTI CAKING AGENT MARKET, BY TYPE, 2021-2030 (USD MILLION)
TABLE 187 U.A.E CONFECTIONERY IN FOOD ANTI CAKING AGENT MARKET, BY TYPE, 2021-2030 (TON)
TABLE 188 U.A.E BEVERAGE IN FOOD ANTI CAKING AGENT MARKET, BY TYPE, 2021-2030 (USD MILLION)
TABLE 189 U.A.E BEVERAGE IN FOOD ANTI CAKING AGENT MARKET, BY TYPE, 2021-2030 (TON)
TABLE 190 U.A.E OTHERS IN FOOD ANTI CAKING AGENT MARKET, BY TYPE, 2021-2030 (USD MILLION)
TABLE 191 U.A.E OTHERS IN FOOD ANTI CAKING AGENT MARKET, BY TYPE, 2021-2030 (TON)
TABLE 192 QATAR FOOD ANTI CAKING AGENT MARKET, BY TYPE, 2021-2030 (USD MILLION)
TABLE 193 QATAR FOOD ANTI CAKING AGENT MARKET, BY TYPE, 2021-2030 (TON)
TABLE 194 QATAR FOOD ANTI CAKING AGENT MARKET, BY TYPE, 2021-2030 (ASP)
TABLE 195 QATAR CALCIUM COMPOUNDS IN FOOD ANTI CAKING AGENT MARKET, BY TYPE, 2021-2030 (USD MILLION)
TABLE 196 QATAR CALCIUM COMPOUNDS IN FOOD ANTI CAKING AGENT MARKET, BY TYPE, 2021-2030 (TON)
TABLE 197 QATAR CALCIUM COMPOUNDS IN FOOD ANTI CAKING AGENT MARKET, BY TYPE, 2021-2030 (ASP)
TABLE 198 QATAR SODIUM COMPOUNDS IN FOOD ANTI CAKING AGENT MARKET, BY TYPE, 2021-2030 (USD MILLION)
TABLE 199 QATAR SODIUM COMPOUNDS IN FOOD ANTI CAKING AGENT MARKET, BY TYPE, 2021-2030 (TON)
TABLE 200 QATAR MAGNESIUM COMPOUNDS IN FOOD ANTI CAKING AGENT MARKET, BY TYPE, 2021-2030 (USD MILLION)
TABLE 201 QATAR MAGNESIUM COMPOUNDS IN FOOD ANTI CAKING AGENT MARKET, BY TYPE, 2021-2030 (TON)
TABLE 202 QATAR MICROCRYSTALLINE CELLULOSE IN FOOD ANTI CAKING AGENT MARKET, BY TYPE, 2021-2030 (USD MILLION)
TABLE 203 QATAR MICROCRYSTALLINE CELLULOSE IN FOOD ANTI CAKING AGENT MARKET, BY TYPE, 2021-2030 (TON)
TABLE 204 QATAR SILICON COMPOUNDS IN FOOD ANTI CAKING AGENT MARKET, BY TYPE, 2021-2030 (USD MILLION)
TABLE 205 QATAR SILICON COMPOUNDS IN FOOD ANTI CAKING AGENT MARKET, BY TYPE, 2021-2030 (TON)
TABLE 206 QATAR OTHERS IN FOOD ANTI CAKING AGENT MARKET, BY TYPE, 2021-2030 (USD MILLION)
TABLE 207 QATAR OTHERS IN FOOD ANTI CAKING AGENT MARKET, BY TYPE, 2021-2030 (TON)
TABLE 208 QATAR FOOD ANTI CAKING AGENT MARKET, BY SOURCE, 2021-2030 (USD MILLION)
TABLE 209 QATAR FOOD ANTI CAKING AGENT MARKET, BY SOURCE, 2021-2030 (TON)
TABLE 210 QATAR FOOD ANTI CAKING AGENT MARKET, BY SOURCE, 2021-2030 (ASP)
TABLE 211 QATAR FOOD ANTI CAKING AGENT MARKET, BY PRODUCT CATEGORY, 2021-2030 (USD MILLION)
TABLE 212 QATAR FOOD ANTI CAKING AGENT MARKET, BY PRODUCT CATEGORY, 2021-2030 (TON)
TABLE 213 QATAR FOOD ANTI CAKING AGENT MARKET, BY PRODUCT CATEGORY, 2021-2030 (ASP)
TABLE 214 QATAR FOOD ANTI CAKING AGENT MARKET, BY FORM, 2021-2030 (USD MILLION)
TABLE 215 QATAR FOOD ANTI CAKING AGENT MARKET, BY FORM, 2021-2030 (TON)
TABLE 216 QATAR FOOD ANTI CAKING AGENT MARKET, BY FORM, 2021-2030 (ASP)
TABLE 217 QATAR FOOD ANTI CAKING AGENT MARKET, BY APPLICATION, 2021-2030 (USD MILLION)
TABLE 218 QATAR FOOD ANTI CAKING AGENT MARKET, BY APPLICATION, 2021-2030 (TON)
TABLE 219 QATAR FOOD ANTI CAKING AGENT MARKET, BY APPLICATION, 2021-2030 (ASP)
TABLE 220 QATAR DAIRY PRODUCTS IN FOOD ANTI CAKING AGENT MARKET, BY TYPE, 2021-2030 (USD MILLION)
TABLE 221 QATAR DAIRY PRODUCTS IN FOOD ANTI CAKING AGENT MARKET, BY TYPE, 2021-2030 (TON)
TABLE 222 QATAR CHEESE IN FOOD ANTI CAKING AGENT MARKET, BY TYPE, 2021-2030 (USD MILLION)
TABLE 223 QATAR CHEESE IN FOOD ANTI CAKING AGENT MARKET, BY TYPE, 2021-2030 (TON)
TABLE 224 QATAR ICE-CREAM IN FOOD ANTI CAKING AGENT MARKET, BY TYPE, 2021-2030 (USD MILLION)
TABLE 225 QATAR ICE-CREAM IN FOOD ANTI CAKING AGENT MARKET, BY TYPE, 2021-2030 (TON)
TABLE 226 QATAR BAKERY PRODUCTS IN FOOD ANTI CAKING AGENT MARKET, BY TYPE, 2021-2030 (USD MILLION)
TABLE 227 QATAR BAKERY PRODUCTS IN FOOD ANTI CAKING AGENT MARKET, BY TYPE, 2021-2030 (TON)
TABLE 228 QATAR CONVENIENCE FOOD IN FOOD ANTI CAKING AGENT MARKET, BY TYPE, 2021-2030 (USD MILLION)
TABLE 229 QATAR CONVENIENCE FOOD IN FOOD ANTI CAKING AGENT MARKET, BY TYPE, 2021-2030 (TON)
TABLE 230 QATAR PROCESSED MEAT PRODUCTS IN FOOD ANTI CAKING AGENT MARKET, BY TYPE, 2021-2030 (USD MILLION)
TABLE 231 QATAR PROCESSED MEAT PRODUCTS IN FOOD ANTI CAKING AGENT MARKET, BY TYPE, 2021-2030 (TON)
TABLE 232 QATAR CONFECTIONERY IN FOOD ANTI CAKING AGENT MARKET, BY TYPE, 2021-2030 (USD MILLION)
TABLE 233 QATAR CONFECTIONERY IN FOOD ANTI CAKING AGENT MARKET, BY TYPE, 2021-2030 (TON)
TABLE 234 QATAR BEVERAGE IN FOOD ANTI CAKING AGENT MARKET, BY TYPE, 2021-2030 (USD MILLION)
TABLE 235 QATAR BEVERAGE IN FOOD ANTI CAKING AGENT MARKET, BY TYPE, 2021-2030 (TON)
TABLE 236 QATAR OTHERS IN FOOD ANTI CAKING AGENT MARKET, BY TYPE, 2021-2030 (USD MILLION)
TABLE 237 QATAR OTHERS IN FOOD ANTI CAKING AGENT MARKET, BY TYPE, 2021-2030 (TON)
TABLE 238 SAUDI ARABIA FOOD ANTI CAKING AGENT MARKET, BY TYPE, 2021-2030 (USD MILLION)
TABLE 239 SAUDI ARABIA FOOD ANTI CAKING AGENT MARKET, BY TYPE, 2021-2030 (TON)
TABLE 240 SAUDI ARABIA FOOD ANTI CAKING AGENT MARKET, BY TYPE, 2021-2030 (ASP)
TABLE 241 SAUDI ARABIA CALCIUM COMPOUNDS IN FOOD ANTI CAKING AGENT MARKET, BY TYPE, 2021-2030 (USD MILLION)
TABLE 242 SAUDI ARABIA CALCIUM COMPOUNDS IN FOOD ANTI CAKING AGENT MARKET, BY TYPE, 2021-2030 (TON)
TABLE 243 SAUDI ARABIA CALCIUM COMPOUNDS IN FOOD ANTI CAKING AGENT MARKET, BY TYPE, 2021-2030 (ASP)
TABLE 244 SAUDI ARABIA SODIUM COMPOUNDS IN FOOD ANTI CAKING AGENT MARKET, BY TYPE, 2021-2030 (USD MILLION)
TABLE 245 SAUDI ARABIA SODIUM COMPOUNDS IN FOOD ANTI CAKING AGENT MARKET, BY TYPE, 2021-2030 (TON)
TABLE 246 SAUDI ARABIA MAGNESIUM COMPOUNDS IN FOOD ANTI CAKING AGENT MARKET, BY TYPE, 2021-2030 (USD MILLION)
TABLE 247 SAUDI ARABIA MAGNESIUM COMPOUNDS IN FOOD ANTI CAKING AGENT MARKET, BY TYPE, 2021-2030 (TON)
TABLE 248 SAUDI ARABIA MICROCRYSTALLINE CELLULOSE IN FOOD ANTI CAKING AGENT MARKET, BY TYPE, 2021-2030 (USD MILLION)
TABLE 249 SAUDI ARABIA MICROCRYSTALLINE CELLULOSE IN FOOD ANTI CAKING AGENT MARKET, BY TYPE, 2021-2030 (TON)
TABLE 250 SAUDI ARABIA SILICON COMPOUNDS IN FOOD ANTI CAKING AGENT MARKET, BY TYPE, 2021-2030 (USD MILLION)
TABLE 251 SAUDI ARABIA SILICON COMPOUNDS IN FOOD ANTI CAKING AGENT MARKET, BY TYPE, 2021-2030 (TON)
TABLE 252 SAUDI ARABIA OTHERS IN FOOD ANTI CAKING AGENT MARKET, BY TYPE, 2021-2030 (USD MILLION)
TABLE 253 SAUDI ARABIA OTHERS IN FOOD ANTI CAKING AGENT MARKET, BY TYPE, 2021-2030 (TON)
TABLE 254 SAUDI ARABIA FOOD ANTI CAKING AGENT MARKET, BY SOURCE, 2021-2030 (USD MILLION)
TABLE 255 SAUDI ARABIA FOOD ANTI CAKING AGENT MARKET, BY SOURCE, 2021-2030 (TON)
TABLE 256 SAUDI ARABIA FOOD ANTI CAKING AGENT MARKET, BY SOURCE, 2021-2030 (ASP)
TABLE 257 SAUDI ARABIA FOOD ANTI CAKING AGENT MARKET, BY PRODUCT CATEGORY, 2021-2030 (USD MILLION)
TABLE 258 SAUDI ARABIA FOOD ANTI CAKING AGENT MARKET, BY PRODUCT CATEGORY, 2021-2030 (TON)
TABLE 259 SAUDI ARABIA FOOD ANTI CAKING AGENT MARKET, BY PRODUCT CATEGORY, 2021-2030 (ASP)
TABLE 260 SAUDI ARABIA FOOD ANTI CAKING AGENT MARKET, BY FORM, 2021-2030 (USD MILLION)
TABLE 261 SAUDI ARABIA FOOD ANTI CAKING AGENT MARKET, BY FORM, 2021-2030 (TON)
TABLE 262 SAUDI ARABIA FOOD ANTI CAKING AGENT MARKET, BY FORM, 2021-2030 (ASP)
TABLE 263 SAUDI ARABIA FOOD ANTI CAKING AGENT MARKET, BY APPLICATION, 2021-2030 (USD MILLION)
TABLE 264 SAUDI ARABIA FOOD ANTI CAKING AGENT MARKET, BY APPLICATION, 2021-2030 (TON)
TABLE 265 SAUDI ARABIA FOOD ANTI CAKING AGENT MARKET, BY APPLICATION, 2021-2030 (ASP)
TABLE 266 SAUDI ARABIA DAIRY PRODUCTS IN FOOD ANTI CAKING AGENT MARKET, BY TYPE, 2021-2030 (USD MILLION)
TABLE 267 SAUDI ARABIA DAIRY PRODUCTS IN FOOD ANTI CAKING AGENT MARKET, BY TYPE, 2021-2030 (TON)
TABLE 268 SAUDI ARABIA CHEESE IN FOOD ANTI CAKING AGENT MARKET, BY TYPE, 2021-2030 (USD MILLION)
TABLE 269 SAUDI ARABIA CHEESE IN FOOD ANTI CAKING AGENT MARKET, BY TYPE, 2021-2030 (TON)
TABLE 270 SAUDI ARABIA ICE-CREAM IN FOOD ANTI CAKING AGENT MARKET, BY TYPE, 2021-2030 (USD MILLION)
TABLE 271 SAUDI ARABIA ICE-CREAM IN FOOD ANTI CAKING AGENT MARKET, BY TYPE, 2021-2030 (TON)
TABLE 272 SAUDI ARABIA BAKERY PRODUCTS IN FOOD ANTI CAKING AGENT MARKET, BY TYPE, 2021-2030 (USD MILLION)
TABLE 273 SAUDI ARABIA BAKERY PRODUCTS IN FOOD ANTI CAKING AGENT MARKET, BY TYPE, 2021-2030 (TON)
TABLE 274 SAUDI ARABIA CONVENIENCE FOOD IN FOOD ANTI CAKING AGENT MARKET, BY TYPE, 2021-2030 (USD MILLION)
TABLE 275 SAUDI ARABIA CONVENIENCE FOOD IN FOOD ANTI CAKING AGENT MARKET, BY TYPE, 2021-2030 (TON)
TABLE 276 SAUDI ARABIA PROCESSED MEAT PRODUCTS IN FOOD ANTI CAKING AGENT MARKET, BY TYPE, 2021-2030 (USD MILLION)
TABLE 277 SAUDI ARABIA PROCESSED MEAT PRODUCTS IN FOOD ANTI CAKING AGENT MARKET, BY TYPE, 2021-2030 (TON)
TABLE 278 SAUDI ARABIA CONFECTIONERY IN FOOD ANTI CAKING AGENT MARKET, BY TYPE, 2021-2030 (USD MILLION)
TABLE 279 SAUDI ARABIA CONFECTIONERY IN FOOD ANTI CAKING AGENT MARKET, BY TYPE, 2021-2030 (TON)
TABLE 280 SAUDI ARABIA BEVERAGE IN FOOD ANTI CAKING AGENT MARKET, BY TYPE, 2021-2030 (USD MILLION)
TABLE 281 SAUDI ARABIA BEVERAGE IN FOOD ANTI CAKING AGENT MARKET, BY TYPE, 2021-2030 (TON)
TABLE 282 SAUDI ARABIA OTHERS IN FOOD ANTI CAKING AGENT MARKET, BY TYPE, 2021-2030 (USD MILLION)
TABLE 283 SAUDI ARABIA OTHERS IN FOOD ANTI CAKING AGENT MARKET, BY TYPE, 2021-2030 (TON)
TABLE 284 EGYPT FOOD ANTI CAKING AGENT MARKET, BY TYPE, 2021-2030 (USD MILLION)
TABLE 285 EGYPT FOOD ANTI CAKING AGENT MARKET, BY TYPE, 2021-2030 (TON)
TABLE 286 EGYPT FOOD ANTI CAKING AGENT MARKET, BY TYPE, 2021-2030 (ASP)
TABLE 287 EGYPT CALCIUM COMPOUNDS IN FOOD ANTI CAKING AGENT MARKET, BY TYPE, 2021-2030 (USD MILLION)
TABLE 288 EGYPT CALCIUM COMPOUNDS IN FOOD ANTI CAKING AGENT MARKET, BY TYPE, 2021-2030 (TON)
TABLE 289 EGYPT CALCIUM COMPOUNDS IN FOOD ANTI CAKING AGENT MARKET, BY TYPE, 2021-2030 (ASP)
TABLE 290 EGYPT SODIUM COMPOUNDS IN FOOD ANTI CAKING AGENT MARKET, BY TYPE, 2021-2030 (USD MILLION)
TABLE 291 EGYPT SODIUM COMPOUNDS IN FOOD ANTI CAKING AGENT MARKET, BY TYPE, 2021-2030 (TON)
TABLE 292 EGYPT MAGNESIUM COMPOUNDS IN FOOD ANTI CAKING AGENT MARKET, BY TYPE, 2021-2030 (USD MILLION)
TABLE 293 EGYPT MAGNESIUM COMPOUNDS IN FOOD ANTI CAKING AGENT MARKET, BY TYPE, 2021-2030 (TON)
TABLE 294 EGYPT MICROCRYSTALLINE CELLULOSE IN FOOD ANTI CAKING AGENT MARKET, BY TYPE, 2021-2030 (USD MILLION)
TABLE 295 EGYPT MICROCRYSTALLINE CELLULOSE IN FOOD ANTI CAKING AGENT MARKET, BY TYPE, 2021-2030 (TON)
TABLE 296 EGYPT SILICON COMPOUNDS IN FOOD ANTI CAKING AGENT MARKET, BY TYPE, 2021-2030 (USD MILLION)
TABLE 297 EGYPT SILICON COMPOUNDS IN FOOD ANTI CAKING AGENT MARKET, BY TYPE, 2021-2030 (TON)
TABLE 298 EGYPT OTHERS IN FOOD ANTI CAKING AGENT MARKET, BY TYPE, 2021-2030 (USD MILLION)
TABLE 299 EGYPT OTHERS IN FOOD ANTI CAKING AGENT MARKET, BY TYPE, 2021-2030 (TON)
TABLE 300 EGYPT FOOD ANTI CAKING AGENT MARKET, BY SOURCE, 2021-2030 (USD MILLION)
TABLE 301 EGYPT FOOD ANTI CAKING AGENT MARKET, BY SOURCE, 2021-2030 (TON)
TABLE 302 EGYPT FOOD ANTI CAKING AGENT MARKET, BY SOURCE, 2021-2030 (ASP)
TABLE 303 EGYPT FOOD ANTI CAKING AGENT MARKET, BY PRODUCT CATEGORY, 2021-2030 (USD MILLION)
TABLE 304 EGYPT FOOD ANTI CAKING AGENT MARKET, BY PRODUCT CATEGORY, 2021-2030 (TON)
TABLE 305 EGYPT FOOD ANTI CAKING AGENT MARKET, BY PRODUCT CATEGORY, 2021-2030 (ASP)
TABLE 306 EGYPT FOOD ANTI CAKING AGENT MARKET, BY FORM, 2021-2030 (USD MILLION)
TABLE 307 EGYPT FOOD ANTI CAKING AGENT MARKET, BY FORM, 2021-2030 (TON)
TABLE 308 EGYPT FOOD ANTI CAKING AGENT MARKET, BY FORM, 2021-2030 (ASP)
TABLE 309 EGYPT FOOD ANTI CAKING AGENT MARKET, BY APPLICATION, 2021-2030 (USD MILLION)
TABLE 310 EGYPT FOOD ANTI CAKING AGENT MARKET, BY APPLICATION, 2021-2030 (TON)
TABLE 311 EGYPT FOOD ANTI CAKING AGENT MARKET, BY APPLICATION, 2021-2030 (ASP)
TABLE 312 EGYPT DAIRY PRODUCTS IN FOOD ANTI CAKING AGENT MARKET, BY TYPE, 2021-2030 (USD MILLION)
TABLE 313 EGYPT DAIRY PRODUCTS IN FOOD ANTI CAKING AGENT MARKET, BY TYPE, 2021-2030 (TON)
TABLE 314 EGYPT CHEESE IN FOOD ANTI CAKING AGENT MARKET, BY TYPE, 2021-2030 (USD MILLION)
TABLE 315 EGYPT CHEESE IN FOOD ANTI CAKING AGENT MARKET, BY TYPE, 2021-2030 (TON)
TABLE 316 EGYPT ICE-CREAM IN FOOD ANTI CAKING AGENT MARKET, BY TYPE, 2021-2030 (USD MILLION)
TABLE 317 EGYPT ICE-CREAM IN FOOD ANTI CAKING AGENT MARKET, BY TYPE, 2021-2030 (TON)
TABLE 318 EGYPT BAKERY PRODUCTS IN FOOD ANTI CAKING AGENT MARKET, BY TYPE, 2021-2030 (USD MILLION)
TABLE 319 EGYPT BAKERY PRODUCTS IN FOOD ANTI CAKING AGENT MARKET, BY TYPE, 2021-2030 (TON)
TABLE 320 EGYPT CONVENIENCE FOOD IN FOOD ANTI CAKING AGENT MARKET, BY TYPE, 2021-2030 (USD MILLION)
TABLE 321 EGYPT CONVENIENCE FOOD IN FOOD ANTI CAKING AGENT MARKET, BY TYPE, 2021-2030 (TON)
TABLE 322 EGYPT PROCESSED MEAT PRODUCTS IN FOOD ANTI CAKING AGENT MARKET, BY TYPE, 2021-2030 (USD MILLION)
TABLE 323 EGYPT PROCESSED MEAT PRODUCTS IN FOOD ANTI CAKING AGENT MARKET, BY TYPE, 2021-2030 (TON)
TABLE 324 EGYPT CONFECTIONERY IN FOOD ANTI CAKING AGENT MARKET, BY TYPE, 2021-2030 (USD MILLION)
TABLE 325 EGYPT CONFECTIONERY IN FOOD ANTI CAKING AGENT MARKET, BY TYPE, 2021-2030 (TON)
TABLE 326 EGYPT BEVERAGE IN FOOD ANTI CAKING AGENT MARKET, BY TYPE, 2021-2030 (USD MILLION)
TABLE 327 EGYPT BEVERAGE IN FOOD ANTI CAKING AGENT MARKET, BY TYPE, 2021-2030 (TON)
TABLE 328 EGYPT OTHERS IN FOOD ANTI CAKING AGENT MARKET, BY TYPE, 2021-2030 (USD MILLION)
TABLE 329 EGYPT OTHERS IN FOOD ANTI CAKING AGENT MARKET, BY TYPE, 2021-2030 (TON)
TABLE 330 SOUTH AFRICA FOOD ANTI CAKING AGENT MARKET, BY TYPE, 2021-2030 (USD MILLION)
TABLE 331 SOUTH AFRICA FOOD ANTI CAKING AGENT MARKET, BY TYPE, 2021-2030 (TON)
TABLE 332 SOUTH AFRICA FOOD ANTI CAKING AGENT MARKET, BY TYPE, 2021-2030 (ASP)
TABLE 333 SOUTH AFRICA CALCIUM COMPOUNDS IN FOOD ANTI CAKING AGENT MARKET, BY TYPE, 2021-2030 (USD MILLION)
TABLE 334 SOUTH AFRICA CALCIUM COMPOUNDS IN FOOD ANTI CAKING AGENT MARKET, BY TYPE, 2021-2030 (TON)
TABLE 335 SOUTH AFRICA CALCIUM COMPOUNDS IN FOOD ANTI CAKING AGENT MARKET, BY TYPE, 2021-2030 (ASP)
TABLE 336 SOUTH AFRICA SODIUM COMPOUNDS IN FOOD ANTI CAKING AGENT MARKET, BY TYPE, 2021-2030 (USD MILLION)
TABLE 337 SOUTH AFRICA SODIUM COMPOUNDS IN FOOD ANTI CAKING AGENT MARKET, BY TYPE, 2021-2030 (TON)
TABLE 338 SOUTH AFRICA MAGNESIUM COMPOUNDS IN FOOD ANTI CAKING AGENT MARKET, BY TYPE, 2021-2030 (USD MILLION)
TABLE 339 SOUTH AFRICA MAGNESIUM COMPOUNDS IN FOOD ANTI CAKING AGENT MARKET, BY TYPE, 2021-2030 (TON)
TABLE 340 SOUTH AFRICA MICROCRYSTALLINE CELLULOSE IN FOOD ANTI CAKING AGENT MARKET, BY TYPE, 2021-2030 (USD MILLION)
TABLE 341 SOUTH AFRICA MICROCRYSTALLINE CELLULOSE IN FOOD ANTI CAKING AGENT MARKET, BY TYPE, 2021-2030 (TON)
TABLE 342 SOUTH AFRICA SILICON COMPOUNDS IN FOOD ANTI CAKING AGENT MARKET, BY TYPE, 2021-2030 (USD MILLION)
TABLE 343 SOUTH AFRICA SILICON COMPOUNDS IN FOOD ANTI CAKING AGENT MARKET, BY TYPE, 2021-2030 (TON)
TABLE 344 SOUTH AFRICA OTHERS IN FOOD ANTI CAKING AGENT MARKET, BY TYPE, 2021-2030 (USD MILLION)
TABLE 345 SOUTH AFRICA OTHERS IN FOOD ANTI CAKING AGENT MARKET, BY TYPE, 2021-2030 (TON)
TABLE 346 SOUTH AFRICA FOOD ANTI CAKING AGENT MARKET, BY SOURCE, 2021-2030 (USD MILLION)
TABLE 347 SOUTH AFRICA FOOD ANTI CAKING AGENT MARKET, BY SOURCE, 2021-2030 (TON)
TABLE 348 SOUTH AFRICA FOOD ANTI CAKING AGENT MARKET, BY SOURCE, 2021-2030 (ASP)
TABLE 349 SOUTH AFRICA FOOD ANTI CAKING AGENT MARKET, BY PRODUCT CATEGORY, 2021-2030 (USD MILLION)
TABLE 350 SOUTH AFRICA FOOD ANTI CAKING AGENT MARKET, BY PRODUCT CATEGORY, 2021-2030 (TON)
TABLE 351 SOUTH AFRICA FOOD ANTI CAKING AGENT MARKET, BY PRODUCT CATEGORY, 2021-2030 (ASP)
TABLE 352 SOUTH AFRICA FOOD ANTI CAKING AGENT MARKET, BY FORM, 2021-2030 (USD MILLION)
TABLE 353 SOUTH AFRICA FOOD ANTI CAKING AGENT MARKET, BY FORM, 2021-2030 (TON)
TABLE 354 SOUTH AFRICA FOOD ANTI CAKING AGENT MARKET, BY FORM, 2021-2030 (ASP)
TABLE 355 SOUTH AFRICA FOOD ANTI CAKING AGENT MARKET, BY APPLICATION, 2021-2030 (USD MILLION)
TABLE 356 SOUTH AFRICA FOOD ANTI CAKING AGENT MARKET, BY APPLICATION, 2021-2030 (TON)
TABLE 357 SOUTH AFRICA FOOD ANTI CAKING AGENT MARKET, BY APPLICATION, 2021-2030 (ASP)
TABLE 358 SOUTH AFRICA DAIRY PRODUCTS IN FOOD ANTI CAKING AGENT MARKET, BY TYPE, 2021-2030 (USD MILLION)
TABLE 359 SOUTH AFRICA DAIRY PRODUCTS IN FOOD ANTI CAKING AGENT MARKET, BY TYPE, 2021-2030 (TON)
TABLE 360 SOUTH AFRICA CHEESE IN FOOD ANTI CAKING AGENT MARKET, BY TYPE, 2021-2030 (USD MILLION)
TABLE 361 SOUTH AFRICA CHEESE IN FOOD ANTI CAKING AGENT MARKET, BY TYPE, 2021-2030 (TON)
TABLE 362 SOUTH AFRICA ICE-CREAM IN FOOD ANTI CAKING AGENT MARKET, BY TYPE, 2021-2030 (USD MILLION)
TABLE 363 SOUTH AFRICA ICE-CREAM IN FOOD ANTI CAKING AGENT MARKET, BY TYPE, 2021-2030 (TON)
TABLE 364 SOUTH AFRICA BAKERY PRODUCTS IN FOOD ANTI CAKING AGENT MARKET, BY TYPE, 2021-2030 (USD MILLION)
TABLE 365 SOUTH AFRICA BAKERY PRODUCTS IN FOOD ANTI CAKING AGENT MARKET, BY TYPE, 2021-2030 (TON)
TABLE 366 SOUTH AFRICA CONVENIENCE FOOD IN FOOD ANTI CAKING AGENT MARKET, BY TYPE, 2021-2030 (USD MILLION)
TABLE 367 SOUTH AFRICA CONVENIENCE FOOD IN FOOD ANTI CAKING AGENT MARKET, BY TYPE, 2021-2030 (TON)
TABLE 368 SOUTH AFRICA PROCESSED MEAT PRODUCTS IN FOOD ANTI CAKING AGENT MARKET, BY TYPE, 2021-2030 (USD MILLION)
TABLE 369 SOUTH AFRICA PROCESSED MIDDLE EAST AND AFRICAT PRODUCTS IN FOOD ANTI CAKING AGENT MARKET, BY TYPE, 2021-2030 (TON)
TABLE 370 SOUTH AFRICA CONFECTIONERY IN FOOD ANTI CAKING AGENT MARKET, BY TYPE, 2021-2030 (USD MILLION)
TABLE 371 SOUTH AFRICA CONFECTIONERY IN FOOD ANTI CAKING AGENT MARKET, BY TYPE, 2021-2030 (TON)
TABLE 372 SOUTH AFRICA BEVERAGE IN FOOD ANTI CAKING AGENT MARKET, BY TYPE, 2021-2030 (USD MILLION)
TABLE 373 SOUTH AFRICA BEVERAGE IN FOOD ANTI CAKING AGENT MARKET, BY TYPE, 2021-2030 (TON)
TABLE 374 SOUTH AFRICA OTHERS IN FOOD ANTI CAKING AGENT MARKET, BY TYPE, 2021-2030 (USD MILLION)
TABLE 375 SOUTH AFRICA OTHERS IN FOOD ANTI CAKING AGENT MARKET, BY TYPE, 2021-2030 (TON)
TABLE 376 BAHRAIN FOOD ANTI CAKING AGENT MARKET, BY TYPE, 2021-2030 (USD MILLION)
TABLE 377 BAHRAIN FOOD ANTI CAKING AGENT MARKET, BY TYPE, 2021-2030 (TON)
TABLE 378 BAHRAIN FOOD ANTI CAKING AGENT MARKET, BY TYPE, 2021-2030 (ASP)
TABLE 379 BAHRAIN CALCIUM COMPOUNDS IN FOOD ANTI CAKING AGENT MARKET, BY TYPE, 2021-2030 (USD MILLION)
TABLE 380 BAHRAIN CALCIUM COMPOUNDS IN FOOD ANTI CAKING AGENT MARKET, BY TYPE, 2021-2030 (TON)
TABLE 381 BAHRAIN CALCIUM COMPOUNDS IN FOOD ANTI CAKING AGENT MARKET, BY TYPE, 2021-2030 (ASP)
TABLE 382 BAHRAIN SODIUM COMPOUNDS IN FOOD ANTI CAKING AGENT MARKET, BY TYPE, 2021-2030 (USD MILLION)
TABLE 383 BAHRAIN SODIUM COMPOUNDS IN FOOD ANTI CAKING AGENT MARKET, BY TYPE, 2021-2030 (TON)
TABLE 384 BAHRAIN MAGNESIUM COMPOUNDS IN FOOD ANTI CAKING AGENT MARKET, BY TYPE, 2021-2030 (USD MILLION)
TABLE 385 BAHRAIN MAGNESIUM COMPOUNDS IN FOOD ANTI CAKING AGENT MARKET, BY TYPE, 2021-2030 (TON)
TABLE 386 BAHRAIN MICROCRYSTALLINE CELLULOSE IN FOOD ANTI CAKING AGENT MARKET, BY TYPE, 2021-2030 (USD MILLION)
TABLE 387 BAHRAIN MICROCRYSTALLINE CELLULOSE IN FOOD ANTI CAKING AGENT MARKET, BY TYPE, 2021-2030 (TON)
TABLE 388 BAHRAIN SILICON COMPOUNDS IN FOOD ANTI CAKING AGENT MARKET, BY TYPE, 2021-2030 (USD MILLION)
TABLE 389 BAHRAIN SILICON COMPOUNDS IN FOOD ANTI CAKING AGENT MARKET, BY TYPE, 2021-2030 (TON)
TABLE 390 BAHRAIN OTHERS IN FOOD ANTI CAKING AGENT MARKET, BY TYPE, 2021-2030 (USD MILLION)
TABLE 391 BAHRAIN OTHERS IN FOOD ANTI CAKING AGENT MARKET, BY TYPE, 2021-2030 (TON)
TABLE 392 BAHRAIN FOOD ANTI CAKING AGENT MARKET, BY SOURCE, 2021-2030 (USD MILLION)
TABLE 393 BAHRAIN FOOD ANTI CAKING AGENT MARKET, BY SOURCE, 2021-2030 (TON)
TABLE 394 BAHRAIN FOOD ANTI CAKING AGENT MARKET, BY SOURCE, 2021-2030 (ASP)
TABLE 395 BAHRAIN FOOD ANTI CAKING AGENT MARKET, BY PRODUCT CATEGORY, 2021-2030 (USD MILLION)
TABLE 396 BAHRAIN FOOD ANTI CAKING AGENT MARKET, BY PRODUCT CATEGORY, 2021-2030 (TON)
TABLE 397 BAHRAIN FOOD ANTI CAKING AGENT MARKET, BY PRODUCT CATEGORY, 2021-2030 (ASP)
TABLE 398 BAHRAIN FOOD ANTI CAKING AGENT MARKET, BY FORM, 2021-2030 (USD MILLION)
TABLE 399 BAHRAIN FOOD ANTI CAKING AGENT MARKET, BY FORM, 2021-2030 (TON)
TABLE 400 BAHRAIN FOOD ANTI CAKING AGENT MARKET, BY FORM, 2021-2030 (ASP)
TABLE 401 BAHRAIN FOOD ANTI CAKING AGENT MARKET, BY APPLICATION, 2021-2030 (USD MILLION)
TABLE 402 BAHRAIN FOOD ANTI CAKING AGENT MARKET, BY APPLICATION, 2021-2030 (TON)
TABLE 403 BAHRAIN FOOD ANTI CAKING AGENT MARKET, BY APPLICATION, 2021-2030 (ASP)
TABLE 404 BAHRAIN DAIRY PRODUCTS IN FOOD ANTI CAKING AGENT MARKET, BY TYPE, 2021-2030 (USD MILLION)
TABLE 405 BAHRAIN DAIRY PRODUCTS IN FOOD ANTI CAKING AGENT MARKET, BY TYPE, 2021-2030 (TON)
TABLE 406 BAHRAIN CHEESE IN FOOD ANTI CAKING AGENT MARKET, BY TYPE, 2021-2030 (USD MILLION)
TABLE 407 BAHRAIN CHEESE IN FOOD ANTI CAKING AGENT MARKET, BY TYPE, 2021-2030 (TON)
TABLE 408 BAHRAIN ICE-CREAM IN FOOD ANTI CAKING AGENT MARKET, BY TYPE, 2021-2030 (USD MILLION)
TABLE 409 BAHRAIN ICE-CREAM IN FOOD ANTI CAKING AGENT MARKET, BY TYPE, 2021-2030 (TON)
TABLE 410 BAHRAIN BAKERY PRODUCTS IN FOOD ANTI CAKING AGENT MARKET, BY TYPE, 2021-2030 (USD MILLION)
TABLE 411 BAHRAIN BAKERY PRODUCTS IN FOOD ANTI CAKING AGENT MARKET, BY TYPE, 2021-2030 (TON)
TABLE 412 BAHRAIN CONVENIENCE FOOD IN FOOD ANTI CAKING AGENT MARKET, BY TYPE, 2021-2030 (USD MILLION)
TABLE 413 BAHRAIN CONVENIENCE FOOD IN FOOD ANTI CAKING AGENT MARKET, BY TYPE, 2021-2030 (TON)
TABLE 414 BAHRAIN PROCESSED MEAT PRODUCTS IN FOOD ANTI CAKING AGENT MARKET, BY TYPE, 2021-2030 (USD MILLION)
TABLE 415 BAHRAIN PROCESSED MEAT PRODUCTS IN FOOD ANTI CAKING AGENT MARKET, BY TYPE, 2021-2030 (TON)
TABLE 416 BAHRAIN CONFECTIONERY IN FOOD ANTI CAKING AGENT MARKET, BY TYPE, 2021-2030 (USD MILLION)
TABLE 417 BAHRAIN CONFECTIONERY IN FOOD ANTI CAKING AGENT MARKET, BY TYPE, 2021-2030 (TON)
TABLE 418 BAHRAIN BEVERAGE IN FOOD ANTI CAKING AGENT MARKET, BY TYPE, 2021-2030 (USD MILLION)
TABLE 419 BAHRAIN BEVERAGE IN FOOD ANTI CAKING AGENT MARKET, BY TYPE, 2021-2030 (TON)
TABLE 420 BAHRAIN OTHERS IN FOOD ANTI CAKING AGENT MARKET, BY TYPE, 2021-2030 (USD MILLION)
TABLE 421 BAHRAIN OTHERS IN FOOD ANTI CAKING AGENT MARKET, BY TYPE, 2021-2030 (TON)
TABLE 422 KUWAIT FOOD ANTI CAKING AGENT MARKET, BY TYPE, 2021-2030 (USD MILLION)
TABLE 423 KUWAIT FOOD ANTI CAKING AGENT MARKET, BY TYPE, 2021-2030 (TON)
TABLE 424 KUWAIT FOOD ANTI CAKING AGENT MARKET, BY TYPE, 2021-2030 (ASP)
TABLE 425 KUWAIT CALCIUM COMPOUNDS IN FOOD ANTI CAKING AGENT MARKET, BY TYPE, 2021-2030 (USD MILLION)
TABLE 426 KUWAIT CALCIUM COMPOUNDS IN FOOD ANTI CAKING AGENT MARKET, BY TYPE, 2021-2030 (TON)
TABLE 427 KUWAIT CALCIUM COMPOUNDS IN FOOD ANTI CAKING AGENT MARKET, BY TYPE, 2021-2030 (ASP)
TABLE 428 KUWAIT SODIUM COMPOUNDS IN FOOD ANTI CAKING AGENT MARKET, BY TYPE, 2021-2030 (USD MILLION)
TABLE 429 KUWAIT SODIUM COMPOUNDS IN FOOD ANTI CAKING AGENT MARKET, BY TYPE, 2021-2030 (TON)
TABLE 430 KUWAIT MAGNESIUM COMPOUNDS IN FOOD ANTI CAKING AGENT MARKET, BY TYPE, 2021-2030 (USD MILLION)
TABLE 431 KUWAIT MAGNESIUM COMPOUNDS IN FOOD ANTI CAKING AGENT MARKET, BY TYPE, 2021-2030 (TON)
TABLE 432 KUWAIT MICROCRYSTALLINE CELLULOSE IN FOOD ANTI CAKING AGENT MARKET, BY TYPE, 2021-2030 (USD MILLION)
TABLE 433 KUWAIT MICROCRYSTALLINE CELLULOSE IN FOOD ANTI CAKING AGENT MARKET, BY TYPE, 2021-2030 (TON)
TABLE 434 KUWAIT SILICON COMPOUNDS IN FOOD ANTI CAKING AGENT MARKET, BY TYPE, 2021-2030 (USD MILLION)
TABLE 435 KUWAIT SILICON COMPOUNDS IN FOOD ANTI CAKING AGENT MARKET, BY TYPE, 2021-2030 (TON)
TABLE 436 KUWAIT OTHERS IN FOOD ANTI CAKING AGENT MARKET, BY TYPE, 2021-2030 (USD MILLION)
TABLE 437 KUWAIT OTHERS IN FOOD ANTI CAKING AGENT MARKET, BY TYPE, 2021-2030 (TON)
TABLE 438 KUWAIT FOOD ANTI CAKING AGENT MARKET, BY SOURCE, 2021-2030 (USD MILLION)
TABLE 439 KUWAIT FOOD ANTI CAKING AGENT MARKET, BY SOURCE, 2021-2030 (TON)
TABLE 440 KUWAIT FOOD ANTI CAKING AGENT MARKET, BY SOURCE, 2021-2030 (ASP)
TABLE 441 KUWAIT FOOD ANTI CAKING AGENT MARKET, BY PRODUCT CATEGORY, 2021-2030 (USD MILLION)
TABLE 442 KUWAIT FOOD ANTI CAKING AGENT MARKET, BY PRODUCT CATEGORY, 2021-2030 (TON)
TABLE 443 KUWAIT FOOD ANTI CAKING AGENT MARKET, BY PRODUCT CATEGORY, 2021-2030 (ASP)
TABLE 444 KUWAIT FOOD ANTI CAKING AGENT MARKET, BY FORM, 2021-2030 (USD MILLION)
TABLE 445 KUWAIT FOOD ANTI CAKING AGENT MARKET, BY FORM, 2021-2030 (TON)
TABLE 446 KUWAIT FOOD ANTI CAKING AGENT MARKET, BY FORM, 2021-2030 (ASP)
TABLE 447 KUWAIT FOOD ANTI CAKING AGENT MARKET, BY APPLICATION, 2021-2030 (USD MILLION)
TABLE 448 KUWAIT FOOD ANTI CAKING AGENT MARKET, BY APPLICATION, 2021-2030 (TON)
TABLE 449 KUWAIT FOOD ANTI CAKING AGENT MARKET, BY APPLICATION, 2021-2030 (ASP)
TABLE 450 KUWAIT DAIRY PRODUCTS IN FOOD ANTI CAKING AGENT MARKET, BY TYPE, 2021-2030 (USD MILLION)
TABLE 451 KUWAIT DAIRY PRODUCTS IN FOOD ANTI CAKING AGENT MARKET, BY TYPE, 2021-2030 (TON)
TABLE 452 KUWAIT CHEESE IN FOOD ANTI CAKING AGENT MARKET, BY TYPE, 2021-2030 (USD MILLION)
TABLE 453 KUWAIT CHEESE IN FOOD ANTI CAKING AGENT MARKET, BY TYPE, 2021-2030 (TON)
TABLE 454 KUWAIT ICE-CREAM IN FOOD ANTI CAKING AGENT MARKET, BY TYPE, 2021-2030 (USD MILLION)
TABLE 455 KUWAIT ICE-CREAM IN FOOD ANTI CAKING AGENT MARKET, BY TYPE, 2021-2030 (TON)
TABLE 456 KUWAIT BAKERY PRODUCTS IN FOOD ANTI CAKING AGENT MARKET, BY TYPE, 2021-2030 (USD MILLION)
TABLE 457 KUWAIT BAKERY PRODUCTS IN FOOD ANTI CAKING AGENT MARKET, BY TYPE, 2021-2030 (TON)
TABLE 458 KUWAIT CONVENIENCE FOOD IN FOOD ANTI CAKING AGENT MARKET, BY TYPE, 2021-2030 (USD MILLION)
TABLE 459 KUWAIT CONVENIENCE FOOD IN FOOD ANTI CAKING AGENT MARKET, BY TYPE, 2021-2030 (TON)
TABLE 460 KUWAIT PROCESSED MEAT PRODUCTS IN FOOD ANTI CAKING AGENT MARKET, BY TYPE, 2021-2030 (USD MILLION)
TABLE 461 KUWAIT PROCESSED MEAT PRODUCTS IN FOOD ANTI CAKING AGENT MARKET, BY TYPE, 2021-2030 (TON)
TABLE 462 KUWAIT CONFECTIONERY IN FOOD ANTI CAKING AGENT MARKET, BY TYPE, 2021-2030 (USD MILLION)
TABLE 463 KUWAIT CONFECTIONERY IN FOOD ANTI CAKING AGENT MARKET, BY TYPE, 2021-2030 (TON)
TABLE 464 KUWAIT BEVERAGE IN FOOD ANTI CAKING AGENT MARKET, BY TYPE, 2021-2030 (USD MILLION)
TABLE 465 KUWAIT BEVERAGE IN FOOD ANTI CAKING AGENT MARKET, BY TYPE, 2021-2030 (TON)
TABLE 466 KUWAIT OTHERS IN FOOD ANTI CAKING AGENT MARKET, BY TYPE, 2021-2030 (USD MILLION)
TABLE 467 KUWAIT OTHERS IN FOOD ANTI CAKING AGENT MARKET, BY TYPE, 2021-2030 (TON)
TABLE 468 OMAN FOOD ANTI CAKING AGENT MARKET, BY TYPE, 2021-2030 (USD MILLION)
TABLE 469 OMAN FOOD ANTI CAKING AGENT MARKET, BY TYPE, 2021-2030 (TON)
TABLE 470 OMAN FOOD ANTI CAKING AGENT MARKET, BY TYPE, 2021-2030 (ASP)
TABLE 471 OMAN CALCIUM COMPOUNDS IN FOOD ANTI CAKING AGENT MARKET, BY TYPE, 2021-2030 (USD MILLION)
TABLE 472 OMAN CALCIUM COMPOUNDS IN FOOD ANTI CAKING AGENT MARKET, BY TYPE, 2021-2030 (TON)
TABLE 473 OMAN CALCIUM COMPOUNDS IN FOOD ANTI CAKING AGENT MARKET, BY TYPE, 2021-2030 (ASP)
TABLE 474 OMAN SODIUM COMPOUNDS IN FOOD ANTI CAKING AGENT MARKET, BY TYPE, 2021-2030 (USD MILLION)
TABLE 475 OMAN SODIUM COMPOUNDS IN FOOD ANTI CAKING AGENT MARKET, BY TYPE, 2021-2030 (TON)
TABLE 476 OMAN MAGNESIUM COMPOUNDS IN FOOD ANTI CAKING AGENT MARKET, BY TYPE, 2021-2030 (USD MILLION)
TABLE 477 OMAN MAGNESIUM COMPOUNDS IN FOOD ANTI CAKING AGENT MARKET, BY TYPE, 2021-2030 (TON)
TABLE 478 OMAN MICROCRYSTALLINE CELLULOSE IN FOOD ANTI CAKING AGENT MARKET, BY TYPE, 2021-2030 (USD MILLION)
TABLE 479 OMAN MICROCRYSTALLINE CELLULOSE IN FOOD ANTI CAKING AGENT MARKET, BY TYPE, 2021-2030 (TON)
TABLE 480 OMAN SILICON COMPOUNDS IN FOOD ANTI CAKING AGENT MARKET, BY TYPE, 2021-2030 (USD MILLION)
TABLE 481 OMAN SILICON COMPOUNDS IN FOOD ANTI CAKING AGENT MARKET, BY TYPE, 2021-2030 (TON)
TABLE 482 OMAN OTHERS IN FOOD ANTI CAKING AGENT MARKET, BY TYPE, 2021-2030 (USD MILLION)
TABLE 483 OMAN OTHERS IN FOOD ANTI CAKING AGENT MARKET, BY TYPE, 2021-2030 (TON)
TABLE 484 OMAN FOOD ANTI CAKING AGENT MARKET, BY SOURCE, 2021-2030 (USD MILLION)
TABLE 485 OMAN FOOD ANTI CAKING AGENT MARKET, BY SOURCE, 2021-2030 (TON)
TABLE 486 OMAN FOOD ANTI CAKING AGENT MARKET, BY SOURCE, 2021-2030 (ASP)
TABLE 487 OMAN FOOD ANTI CAKING AGENT MARKET, BY PRODUCT CATEGORY, 2021-2030 (USD MILLION)
TABLE 488 OMAN FOOD ANTI CAKING AGENT MARKET, BY PRODUCT CATEGORY, 2021-2030 (TON)
TABLE 489 OMAN FOOD ANTI CAKING AGENT MARKET, BY PRODUCT CATEGORY, 2021-2030 (ASP)
TABLE 490 OMAN FOOD ANTI CAKING AGENT MARKET, BY FORM, 2021-2030 (USD MILLION)
TABLE 491 OMAN FOOD ANTI CAKING AGENT MARKET, BY FORM, 2021-2030 (TON)
TABLE 492 OMAN FOOD ANTI CAKING AGENT MARKET, BY FORM, 2021-2030 (ASP)
TABLE 493 OMAN FOOD ANTI CAKING AGENT MARKET, BY APPLICATION, 2021-2030 (USD MILLION)
TABLE 494 OMAN FOOD ANTI CAKING AGENT MARKET, BY APPLICATION, 2021-2030 (TON)
TABLE 495 OMAN FOOD ANTI CAKING AGENT MARKET, BY APPLICATION, 2021-2030 (ASP)
TABLE 496 OMAN DAIRY PRODUCTS IN FOOD ANTI CAKING AGENT MARKET, BY TYPE, 2021-2030 (USD MILLION)
TABLE 497 OMAN DAIRY PRODUCTS IN FOOD ANTI CAKING AGENT MARKET, BY TYPE, 2021-2030 (TON)
TABLE 498 OMAN CHEESE IN FOOD ANTI CAKING AGENT MARKET, BY TYPE, 2021-2030 (USD MILLION)
TABLE 499 OMAN CHEESE IN FOOD ANTI CAKING AGENT MARKET, BY TYPE, 2021-2030 (TON)
TABLE 500 OMAN ICE-CREAM IN FOOD ANTI CAKING AGENT MARKET, BY TYPE, 2021-2030 (USD MILLION)
TABLE 501 OMAN ICE-CREAM IN FOOD ANTI CAKING AGENT MARKET, BY TYPE, 2021-2030 (TON)
TABLE 502 OMAN BAKERY PRODUCTS IN FOOD ANTI CAKING AGENT MARKET, BY TYPE, 2021-2030 (USD MILLION)
TABLE 503 OMAN BAKERY PRODUCTS IN FOOD ANTI CAKING AGENT MARKET, BY TYPE, 2021-2030 (TON)
TABLE 504 OMAN CONVENIENCE FOOD IN FOOD ANTI CAKING AGENT MARKET, BY TYPE, 2021-2030 (USD MILLION)
TABLE 505 OMAN CONVENIENCE FOOD IN FOOD ANTI CAKING AGENT MARKET, BY TYPE, 2021-2030 (TON)
TABLE 506 OMAN PROCESSED MEAT PRODUCTS IN FOOD ANTI CAKING AGENT MARKET, BY TYPE, 2021-2030 (USD MILLION)
TABLE 507 OMAN PROCESSED MEAT PRODUCTS IN FOOD ANTI CAKING AGENT MARKET, BY TYPE, 2021-2030 (TON)
TABLE 508 OMAN CONFECTIONERY IN FOOD ANTI CAKING AGENT MARKET, BY TYPE, 2021-2030 (USD MILLION)
TABLE 509 OMAN CONFECTIONERY IN FOOD ANTI CAKING AGENT MARKET, BY TYPE, 2021-2030 (TON)
TABLE 510 OMAN BEVERAGE IN FOOD ANTI CAKING AGENT MARKET, BY TYPE, 2021-2030 (USD MILLION)
TABLE 511 OMAN BEVERAGE IN FOOD ANTI CAKING AGENT MARKET, BY TYPE, 2021-2030 (TON)
TABLE 512 OMAN OTHERS IN FOOD ANTI CAKING AGENT MARKET, BY TYPE, 2021-2030 (USD MILLION)
TABLE 513 OMAN OTHERS IN FOOD ANTI CAKING AGENT MARKET, BY TYPE, 2021-2030 (TON)
TABLE 514 REST OF MIDDLE EAST AND AFRICA FOOD ANTI CAKING AGENT MARKET, BY TYPE, 2021-2030 (USD MILLION)
TABLE 515 REST OF MIDDLE EAST AND AFRICA FOOD ANTI CAKING AGENT MARKET, BY TYPE, 2021-2030 (TON)
TABLE 516 REST OF MIDDLE EAST AND AFRICA FOOD ANTI CAKING AGENT MARKET, BY TYPE, 2021-2030 (ASP)
Lista de figuras
FIGURE 1 MIDDLE EAST & AFRICA FOOD ANTI CAKING AGENTS MARKET: SEGMENTATION
FIGURE 2 MIDDLE EAST & AFRICA FOOD ANTI CAKING AGENTS MARKET: DATA TRIANGULATION
FIGURE 3 MIDDLE EAST & AFRICA FOOD ANTI CAKING AGENTS MARKET: DROC ANALYSIS
FIGURE 4 MIDDLE EAST & AFRICA FOOD ANTI CAKING AGENTS MARKET: MIDDLE EAST & AFRICA VS REGIONAL MARKET ANALYSIS
FIGURE 5 MIDDLE EAST & AFRICA FOOD ANTI CAKING AGENTS MARKET: COMPANY RESEARCH ANALYSIS
FIGURE 6 MIDDLE EAST & AFRICA FOOD ANTI CAKING AGENTS MARKET: INTERVIEW DEMOGRAPHICS
FIGURE 7 MIDDLE EAST & AFRICA FOOD ANTI CAKING AGENTS MARKET: DBMR MARKET POSITION GRID
FIGURE 8 MIDDLE EAST & AFRICA FOOD ANTI CAKING AGENTS MARKET: MARKET APPLICATION COVERAGE GRID
FIGURE 9 MIDDLE EAST & AFRICA FOOD ANTI CAKING AGENTS MARKET: SEGMENTATION
FIGURE 10 THE RISE IN DEMAND FOR CONVENIENCE FOOD PRODUCTS ACROSS THE GLOBE, LEADING TO THE RISE IN THE DEMAND FOR FOOD ANTI CAKING AGENTS, IS EXPECTED TO DRIVE THE MIDDLE EAST & AFRICA FOOD ANTI CAKING AGENTS MARKET IN THE FORECAST PERIOD OF 2023 TO 2030
FIGURE 11 THE SILICON COMPOUNDS SEGMENT IS EXPECTED TO ACCOUNT FOR THE LARGEST SHARE OF THE MIDDLE EAST & AFRICA FOOD ANTI CAKING AGENTS MARKET IN 2023 AND 2030
FIGURE 12 VALUE CHAIN ANALYSIS OF THE MIDDLE EAST & AFRICA FOOD ANTI CAKING AGENTS MARKET
FIGURE 13 SUPPLY CHAIN OF MIDDLE EAST & AFRICA FOOD ANTI CAKING AGENTS MARKET
FIGURE 14 DRIVERS, RESTRAINTS, OPPORTUNITIES, AND CHALLENGES OF THE MIDDLE EAST & AFRICA FOOD ANTI CAKING AGENTS MARKET
FIGURE 15 MIDDLE EAST & AFRICA FOOD ANTI CAKING AGENTS MARKET: BY TYPE, 2022
FIGURE 16 MIDDLE EAST & AFRICA FOOD ANTI CAKING AGENTS MARKET: BY SOURCE, 2022
FIGURE 17 MIDDLE EAST & AFRICA FOOD ANTI CAKING AGENTS MARKET: BY PRODUCT CATEGORY, 2022
FIGURE 18 MIDDLE EAST & AFRICA FOOD ANTI CAKING AGENTS MARKET: BY FORM, 2022
FIGURE 19 MIDDLE EAST & AFRICA FOOD ANTI CAKING AGENTS MARKET: BY APPLICATION, 2022
FIGURE 20 MIDDLE EAST AND AFRICA FOOD ANTI CAKING AGENTS MARKET: SNAPSHOT (2022)
FIGURE 21 MIDDLE EAST AND AFRICA FOOD ANTI CAKING AGENTS MARKET: BY REGION (2022)
FIGURE 22 MIDDLE EAST AND AFRICA FOOD ANTI CAKING AGENTS MARKET: BY REGION (2023 & 2030)
FIGURE 23 MIDDLE EAST AND AFRICA FOOD ANTI CAKING AGENTS MARKET: BY REGION (2022 & 2030)
FIGURE 24 MIDDLE EAST AND AFRICA FOOD ANTI CAKING AGENTS MARKET: BY TYPE (2023-2030)
FIGURE 25 MIDDLE EAST & AFRICA FOOD ANTI CAKING AGENTS MARKET: COMPANY SHARE 2022 (%)
Metodología de investigación
La recopilación de datos y el análisis del año base se realizan utilizando módulos de recopilación de datos con muestras de gran tamaño. La etapa incluye la obtención de información de mercado o datos relacionados a través de varias fuentes y estrategias. Incluye el examen y la planificación de todos los datos adquiridos del pasado con antelación. Asimismo, abarca el examen de las inconsistencias de información observadas en diferentes fuentes de información. Los datos de mercado se analizan y estiman utilizando modelos estadísticos y coherentes de mercado. Además, el análisis de la participación de mercado y el análisis de tendencias clave son los principales factores de éxito en el informe de mercado. Para obtener más información, solicite una llamada de un analista o envíe su consulta.
La metodología de investigación clave utilizada por el equipo de investigación de DBMR es la triangulación de datos, que implica la extracción de datos, el análisis del impacto de las variables de datos en el mercado y la validación primaria (experto en la industria). Los modelos de datos incluyen cuadrícula de posicionamiento de proveedores, análisis de línea de tiempo de mercado, descripción general y guía del mercado, cuadrícula de posicionamiento de la empresa, análisis de patentes, análisis de precios, análisis de participación de mercado de la empresa, estándares de medición, análisis global versus regional y de participación de proveedores. Para obtener más información sobre la metodología de investigación, envíe una consulta para hablar con nuestros expertos de la industria.
Personalización disponible
Data Bridge Market Research es líder en investigación formativa avanzada. Nos enorgullecemos de brindar servicios a nuestros clientes existentes y nuevos con datos y análisis que coinciden y se adaptan a sus objetivos. El informe se puede personalizar para incluir análisis de tendencias de precios de marcas objetivo, comprensión del mercado de países adicionales (solicite la lista de países), datos de resultados de ensayos clínicos, revisión de literatura, análisis de mercado renovado y base de productos. El análisis de mercado de competidores objetivo se puede analizar desde análisis basados en tecnología hasta estrategias de cartera de mercado. Podemos agregar tantos competidores sobre los que necesite datos en el formato y estilo de datos que esté buscando. Nuestro equipo de analistas también puede proporcionarle datos en archivos de Excel sin procesar, tablas dinámicas (libro de datos) o puede ayudarlo a crear presentaciones a partir de los conjuntos de datos disponibles en el informe.

