
Middle East and Africa Fleet Management Market, By Offering (Solution and Services), Lease Type (On-Lease and Without Lease), Mode of Transport (Automotive, Marine, Rolling Stock, and Aircraft), Vehicle Type (Internal Combustion Engines and Electric Vehicle), Hardware (GPS Tracking Devices, Dash Cameras, Bluetooth Tracking Tags ,Data Loggers, and Others), Fleet Size (Small Fleets (1-5 Vehicles), Medium Fleets (5-20 Vehicles), and Large and Enterprise Fleets (20-50+ Vehicles), Communication Range (Short-Range Communication and Long-Range Communication), Deployment Model (On-Premise, Cloud, and Hybrid), Technology (GNSS, Cellular Systems, Electronic Data Interchange (EDI), Remote Sensing, Computational Methods and Decision-Making, RFID, and Others), Function (Monitoring Driver Behaviour, Fuel Consumption, Asset Management, ELD Complaint, Route Management, Vehicle Maintenance Updates, Delivery Schedule, Accident Prevention, Real-Time Vehicle Location, Mobile Apps, and Others), Operations (Private and Commercial), Business Type (Small Businesses and Large Businesses), End User (Automotive, Transportation & Logistics, Retail, Manufacturing, Food & Beverages, Energy & Utilities, Mining, Government, Healthcare, Agriculture, Construction, and Others) – Industry Trends and Forecast to 2030.
Middle East and Africa Fleet Management Market Analysis and Size
Major factors expected to boost the growth of the fleet management market in the forecast period are the rise in several industrial applications, including aerospace, steel, power, chemical, and others. Furthermore, the increased resistance to load variations is the benefit of fleet management, which is further anticipated to propel the growth of the fleet management market.
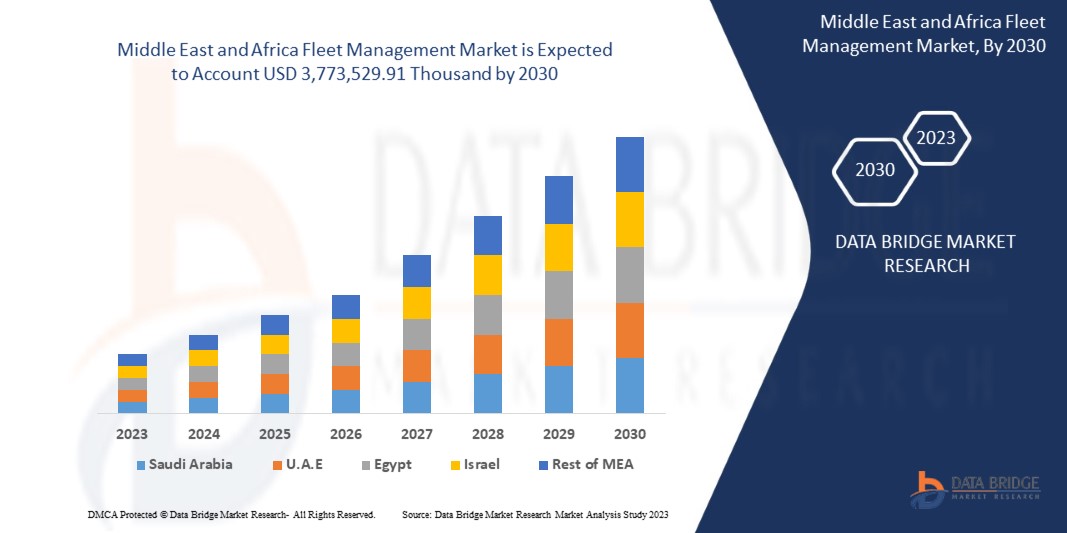
Data Bridge Market Research analyses that the Middle East and Africa fleet management market is expected to reach the value of USD 3,773,529.91 thousand by 2030, at a CAGR of 8.6% during the forecast period. The fleet management market report also covers pricing analysis, patent analysis, and technological advancements in depth.
|
Report Metric |
Details |
|
Forecast Period |
2023 – 2030 |
|
Base Year |
2022 |
|
Historic Years |
2021 (Customizable to 2015 – 2020) |
|
Quantitative Units |
Revenue in USD Thousand |
|
Segments Covered |
Oferta (solución y servicios), tipo de arrendamiento (arrendamiento y sin arrendamiento), modo de transporte (automotriz, marítimo, material rodante y aeronaves), tipo de vehículo (motores de combustión interna y vehículo eléctrico), hardware (dispositivos de seguimiento GPS, cámaras de tablero, etiquetas de seguimiento Bluetooth, registradores de datos y otros), tamaño de la flota (flotas pequeñas (1 a 5 vehículos), flotas medianas (5 a 20 vehículos) y flotas grandes y empresariales (20 a más de 50 vehículos), alcance de comunicación (comunicación de corto alcance y comunicación de largo alcance), modelo de implementación (local, en la nube e híbrido), tecnología (GNSS, sistemas celulares, intercambio electrónico de datos (EDI), teledetección, métodos computacionales y toma de decisiones, RFID y otros), función (monitoreo del comportamiento del conductor, consumo de combustible, gestión de activos, quejas de ELD, gestión de rutas, actualizaciones de mantenimiento del vehículo, cronograma de entrega, prevención de accidentes, ubicación del vehículo en tiempo real, aplicaciones móviles y Otros), Operaciones (Privadas y Comerciales), Tipo de Negocio (Pequeñas y Grandes Empresas), Usuario Final (Automotriz, Transporte y Logística, Minorista, Manufactura, Alimentos y Bebidas, Energía y Servicios Públicos, Minería, Gobierno, Salud, Agricultura, Construcción y Otros) |
|
Países cubiertos |
Arabia Saudita, Emiratos Árabes Unidos, Israel, Egipto, Sudáfrica y el resto de Oriente Medio y África |
|
Actores del mercado cubiertos |
TRAXALL, Donlen LeasePlan, Enterprise Holdings, Emkay, Chevin Fleet Solutions, Deutsche Leasing AG, BERGSTROM AUTOMOTIVE, TÜV SÜD, Motive Technologies, Inc., ALD Automotive, VEL'CO, Avrios, Element Fleet Management Corp., Rarestep, Inc., OviDrive BV, FleetCompany GmbH, Sixt Leasing (adquirida por Hyundai Capital Bank Europe GmbH), Fleetcare Pty Ltd., Capital Lease Group, Wilmar Inc., Wheels, NEXTRAQ, LLC, Avis Budget Group y Zeemac Vehicle Acquisition & Fleet Services, entre otros. |
Definición de mercado
La gestión de flotas son los procesos y prácticas involucrados en la gestión de la flota de vehículos de una empresa. La gestión de flotas incluye automóviles, camiones, furgonetas y otros vehículos utilizados para fines comerciales. También involucra muchas prácticas, como la adquisición de vehículos, el mantenimiento, la gestión del combustible, la gestión de conductores y la seguridad y el cumplimiento. El objetivo de la gestión de flotas es optimizar el uso de los vehículos de la empresa para mejorar la eficiencia, reducir los costos y mejorar la seguridad. Una gestión de flotas eficaz puede ayudar a las empresas a aumentar la productividad, reducir el tiempo de inactividad y extender la vida útil de sus vehículos. También puede ayudar a mejorar el comportamiento del conductor, reducir los accidentes y garantizar el cumplimiento de las regulaciones y políticas. La gestión de flotas se utiliza en varias industrias, incluido el transporte, la logística, los servicios de entrega y la construcción. Las tecnologías avanzadas, como el seguimiento por GPS y la telemática, han hecho que la gestión de flotas sea más efectiva y eficiente en los últimos años.
Dinámica del mercado de gestión de flotas en Oriente Medio y África
En esta sección se aborda la comprensión de los factores impulsores, las oportunidades, las limitaciones y los desafíos del mercado. Todo esto se analiza en detalle a continuación:
Conductores
- Aumento de la demanda de logística debido a la industria del comercio electrónico
La gestión de flotas es una práctica que permite a las organizaciones gestionar y coordinar los vehículos de reparto para lograr una eficiencia óptima y reducir los costes. La práctica de la gestión de flotas se utiliza para supervisar y registrar a los mensajeros y al personal de reparto. Requiere un sistema de tecnologías que faciliten al gestor de la flota la coordinación de las actividades, desde la gestión del combustible hasta la planificación de las rutas, y se puede gestionar fácilmente mediante un software de gestión de flotas. La expansión de la industria del comercio electrónico ha tenido un impacto significativo en la industria de la logística. La logística se ha considerado la columna vertebral de la industria del comercio electrónico, ya que afecta de forma inmediata a las operaciones planificadas, los almacenes y las organizaciones de la red de producción. Dependerán progresivamente de la reevaluación para hacer frente a las crecientes solicitudes relacionadas con el desarrollo de la parte comercial de Internet. La adopción de este curso, ya sea para el transporte de última milla o para la satisfacción de los pedidos, les permitirá garantizar un transporte predecible, fiable, productivo y sin fallos. Por tanto, esto puede ser un gran factor a la hora de gestionar y ampliar la presión debido al crecimiento previsto de la industria comercial del comercio electrónico.
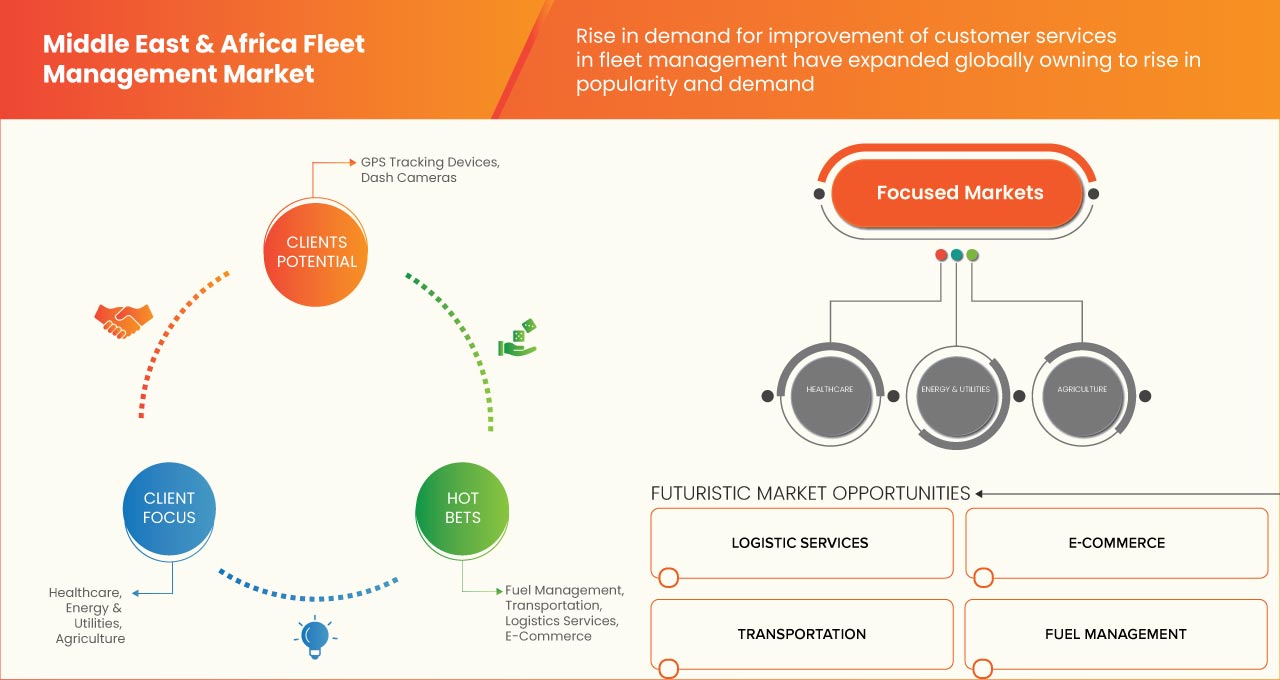
- Aumento de la demanda de mejoras en los servicios al cliente
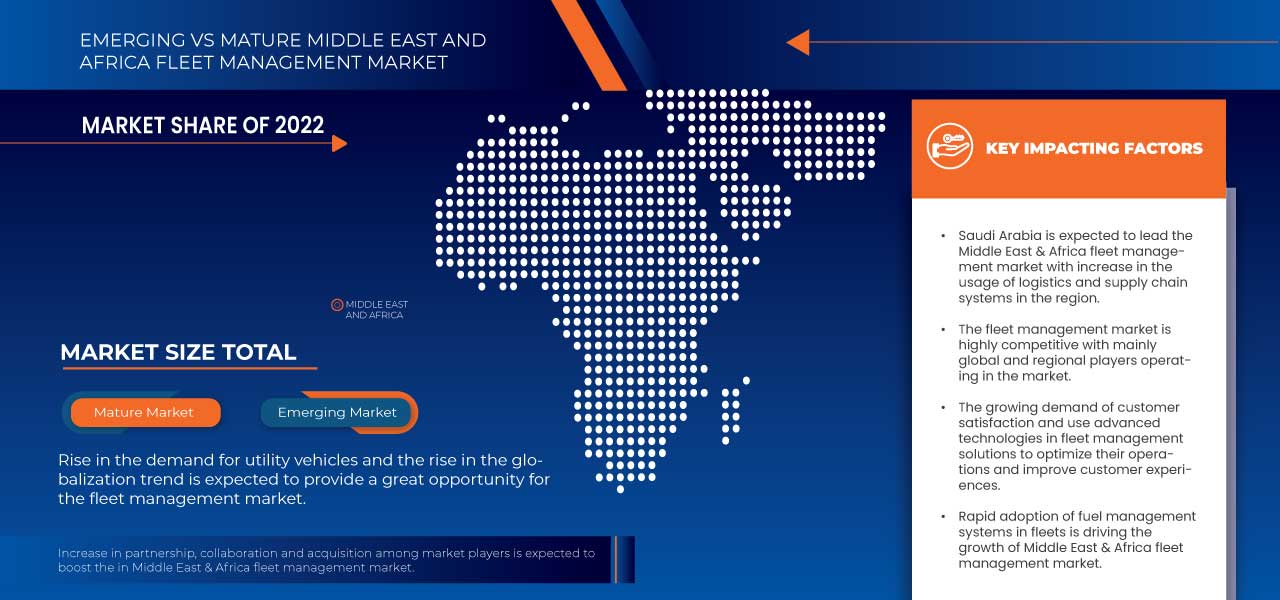
Los clientes de hoy son más inteligentes y tienen mayores expectativas que nunca. La satisfacción y la felicidad del cliente son dos de los aspectos más importantes para cualquier empresa. Independientemente del sector empresarial, los clientes insatisfechos no lo serán por mucho tiempo, por lo que es importante mantenerlos felices y hacer que se sientan valorados. Esto también es cierto para la logística y la gestión de flotas, donde la retención de los clientes es clave para el éxito a largo plazo. Mejorar los servicios y la satisfacción del cliente mediante un mejor rendimiento de la gestión de flotas es un factor clave que se espera que impulse el mercado de gestión de flotas de Oriente Medio y África. En el competitivo mercado actual, las empresas reconocen la importancia de la satisfacción del cliente y utilizan tecnologías avanzadas en soluciones de gestión de flotas para optimizar sus operaciones y mejorar las experiencias de los clientes.
Oportunidades
- Aumento de la demanda de vehículos utilitarios
Los vehículos utilitarios son vehículos diseñados y utilizados para transportar mercancías o pasajeros. Estos vehículos incluyen camiones, furgonetas, autobuses y vehículos similares utilizados con fines comerciales. El mercado de vehículos utilitarios es un componente crucial de la industria automotriz de Oriente Medio y África y ha experimentado un crecimiento significativo en las últimas décadas. El aumento de la demanda de vehículos utilitarios se puede atribuir a varios factores, incluido el crecimiento de la industria del comercio electrónico, la creciente urbanización y la necesidad de sistemas de transporte eficientes. A medida que más y más empresas dependen de los vehículos utilitarios para sus necesidades de transporte, también se espera que aumente la demanda de servicios y software de gestión de flotas. Una de las razones del aumento de la demanda de vehículos utilitarios es el crecimiento de la industria del comercio electrónico. La demanda de servicios de transporte ha aumentado con el creciente número de plataformas de compras en línea. Como resultado, el uso de vehículos utilitarios se ha vuelto más común y la gestión de flotas se ha vuelto más crítica.
Restricciones/Desafíos
- Menor eficiencia en la conectividad
La industria de la logística y el transporte ha cambiado significativamente en los últimos años. Se han introducido conceptos como la digitalización, la aparición del big data y la conectividad, y muchas flotas están utilizando ahora las primeras versiones de estas nuevas tecnologías. En muchos casos, están cambiando la forma en que los administradores de flotas operan a diario. La conectividad es uno de los conceptos más importantes y efectivos. Aquí es donde un administrador de flota puede tener una visión general de toda la flota y mantenerse en contacto con los conductores, camiones y remolques a través de procesos automatizados que brindan datos procesables desde dispositivos a bordo. A través de dispositivos telemáticos y soluciones de software conectadas, se pueden alertar los problemas de la flota sobre problemas menores del vehículo a medida que surgen, lo que les permite abordar los problemas antes y lidiar con los problemas antes de que se produzcan averías. Esto brinda la flexibilidad de realizar reparaciones en curso o mantenimiento programado con anticipación, lo que permite que los camiones permanezcan en la carretera con más frecuencia y pasen más tiempo entregando mercancías.
- Orientación inadecuada para habilitar la ruta
Un sistema de seguimiento de vehículos puede definirse como una parte de un sistema de gestión de flotas, que permite al operador de la flota conocer la ubicación del vehículo a lo largo de su recorrido en función del tiempo. Además de utilizar los datos generados por el sistema de seguimiento de vehículos para hacer cumplir el horario de los autobuses, estos datos también proporcionan información importante para la toma de decisiones. El sistema facilita el cálculo de la distancia exacta recorrida en un período de tiempo determinado, el cálculo de la velocidad del autobús en una ubicación determinada y el análisis del tiempo que tarda el vehículo en cubrir una determinada distancia. Se convierte en una herramienta muy poderosa en el caso de las agencias operativas.
Impacto posterior al COVID-19 en el mercado de gestión de flotas en Oriente Medio y África
La COVID-19 generó un impacto negativo en el mercado de gestión de flotas debido a las regulaciones y reglas de bloqueo en las instalaciones de fabricación.
La pandemia de COVID-19 ha afectado al mercado de gestión de flotas de manera negativa. Sin embargo, la creciente adopción de la gestión de flotas en el sector de la aviación ha ayudado al mercado a crecer después de la pandemia. Además, el crecimiento ha sido alto desde que se abrió el mercado después de COVID-19, y se espera que haya un crecimiento considerable en el sector.
Los fabricantes están tomando diversas decisiones estratégicas para recuperarse tras la COVID-19. Los actores están llevando a cabo múltiples actividades de investigación y desarrollo para mejorar la tecnología involucrada en la gestión de flotas. Con esto, las empresas traerán tecnologías avanzadas al mercado. Además, las iniciativas gubernamentales para el uso de tecnología de automatización han impulsado el crecimiento del mercado.
Desarrollo reciente
- En octubre de 2022, Chevin Fleet Solutions anunció que la empresa había lanzado nuevas aplicaciones, 'FleetWave Technician' y 'FleetWave Driver', para sus productos de software de gestión de flotas.
- En febrero de 2022, Element Fleet Management Corp. anunció que la empresa lanzó Arc by Element, una oferta de flota de vehículos eléctricos (VE) de extremo a extremo para ayudar a los clientes a navegar y simplificar la compleja transición de vehículos con motor de combustión interna (ICE) a vehículos eléctricos.
Alcance del mercado de gestión de flotas en Oriente Medio y África
El mercado de gestión de flotas de Oriente Medio y África está segmentado en función de la oferta, el tipo de arrendamiento, el modo de transporte, el tipo de vehículo, el hardware, el tamaño de la flota, el alcance de las comunicaciones, el modelo de implementación, la tecnología, las funciones, las operaciones, el tipo de negocio y el usuario final. El crecimiento entre estos segmentos le ayudará a analizar los segmentos de crecimiento reducido de las industrias y a proporcionar a los usuarios una valiosa descripción general del mercado y conocimientos del mercado para ayudarlos a tomar decisiones estratégicas para identificar las principales aplicaciones del mercado.
Ofrenda
- Solución
- Servicios
En función de la oferta, el mercado se segmenta en soluciones y servicios.
Tipo de arrendamiento
- En arrendamiento
- Sin contrato de arrendamiento
En función del tipo de arrendamiento, el mercado se segmenta en arrendamiento con y sin arrendamiento.
Modo de transporte
- Automotor
- Marina
- Material rodante
- Aeronave
Según el modo de transporte, el mercado está segmentado en automoción, marítimo, material rodante y aeronáutica.
Tipo de vehículo
- Motores de combustión interna (MCI)
- Vehículo eléctrico
Según el tipo de vehículo, el mercado está segmentado en motores de combustión interna (ICE) y vehículos eléctricos.
Hardware
- Dispositivos de seguimiento GPS
- Cámaras de tablero
- Etiquetas de seguimiento Bluetooth (balizas BLE)
- Registradores de datos
- Otros
Sobre la base del hardware, el mercado está segmentado en dispositivos de rastreo GPS, cámaras de tablero, etiquetas de rastreo Bluetooth (balizas BLE), registradores de datos y otros.
Tamaño de la flota
- Flotas pequeñas (1-5 vehículos)
- Flotas medianas (5-20 vehículos)
- Flotas grandes y empresariales (entre 20 y 50 vehículos)
En función del tamaño de la flota, el mercado se segmenta en flotas pequeñas (1 a 5 vehículos), flotas medianas (5 a 20 vehículos) y flotas grandes y empresariales (20 a 50+ vehículos).
Alcance de la comunicación
- Comunicación de corto alcance
- Comunicación de largo alcance
Sobre la base del alcance de comunicación, el mercado se segmenta en comunicación de corto alcance y comunicación de largo alcance.
Modelo de implementación
- En las instalaciones
- Nube
- Híbrido
Sobre la base del modelo de implementación, el mercado está segmentado en local, en la nube e híbrido.
Tecnología
- Sistema global de navegación por satélite (GNSS)
- Sistemas celulares
- Intercambio electrónico de datos (EDI)
- Detección remota
- Métodos computacionales
- Toma de decisiones
- RFID
- Otros
Sobre la base de la tecnología, el mercado está segmentado en GNSS, sistemas celulares, intercambio electrónico de datos (EDI), teledetección, métodos computacionales, toma de decisiones, RFID y otros.
Función
- Monitoreo del comportamiento del conductor
- Consumo de combustible
- Gestión de activos
- Queja ELD
- Gestión de rutas
- Actualizaciones de mantenimiento de vehículos
- Horario de entrega
- Prevención de accidentes
- Ubicación del vehículo en tiempo real
- Aplicaciones móviles
- Otros
Sobre la base de la función, el mercado está segmentado en monitoreo del comportamiento del conductor, consumo de combustible, gestión de activos, quejas de ELD, gestión de rutas, actualizaciones de mantenimiento del vehículo, cronograma de entrega, prevención de accidentes, ubicación del vehículo en tiempo real, aplicaciones móviles y otros.
Operaciones
- Privado
- Comercial
En función de las operaciones, el mercado está segmentado en privado y comercial.
Tipo de negocio
- Pequeñas empresas
- Grandes empresas
Según el tipo de negocio, el mercado se segmenta en pequeñas empresas y grandes empresas.
Usuario final
- Automotor
- Transporte y Logística
- Minorista
- Fabricación
- Alimentos y bebidas
- Energía y servicios públicos
- Minería
- Gobierno
- Cuidado de la salud
- Agricultura
- Construcción
- Otros
En función del usuario final, el mercado se segmenta en automoción, transporte y logística, venta minorista, fabricación, alimentos y bebidas, energía y servicios públicos, minería, gobierno, atención médica, agricultura, construcción y otros. Todos los sectores automotrices, de transporte y logística, venta minorista, fabricación, alimentos y bebidas, energía y servicios públicos, minería, gobierno, atención médica, agricultura y construcción.

Análisis y perspectivas regionales del mercado de gestión de flotas en Oriente Medio y África
Se analiza el mercado de gestión de flotas de Oriente Medio y África, y se proporcionan información y tendencias del tamaño del mercado mediante la oferta, el tipo de arrendamiento, el modo de transporte, el tipo de vehículo, el hardware, el tamaño de la flota, el alcance de comunicación, el modelo de implementación, la tecnología, las funciones, las operaciones, el tipo de negocio y el usuario final como se menciona anteriormente.
Los países cubiertos en el informe del mercado de gestión de flotas son Arabia Saudita, Emiratos Árabes Unidos, Israel, Egipto, Sudáfrica y el resto de Medio Oriente y África.
Arabia Saudita domina la región de Medio Oriente y África debido a la creciente adopción de la automatización en la fabricación y la robótica industrial.
The country section of the report also provides individual market impacting factors and changes in market regulation that impact the current and future trends of the market. Data points like down-stream and upstream value chain analysis, technical trends, and porter's five forces analysis, case studies are some of the pointers used to forecast the market scenario for individual countries. Also, the presence and availability of Middle East and Africa brands and their challenges faced due to large or scarce competition from local and domestic brands, the impact of domestic tariffs, and trade routes are considered while providing forecast analysis of the country data.
Competitive Landscape and Middle East and Africa Fleet Management Market Share Analysis
Middle East and Africa fleet management market competitive landscape provide details by competitor. Details included are company overview, company financials, revenue generated, market potential, investment in research and development, new market initiatives, Middle East and Africa presence, production sites and facilities, production capacities, company strengths and weaknesses, product launch, product width, and breadth, application dominance. The above data points provided are only related to the companies' focus related to the fleet management market.
Some of the major players operating in the Middle East and Africa fleet management market are TRAXALL, Donlen LeasePlan, Enterprise Holdings, Emkay, Chevin Fleet Solutions, Deutsche Leasing AG, BERGSTROM AUTOMOTIVE, TÜV SÜD, Motive Technologies, Inc., ALD Automotive, VEL’CO, Avrios, Element Fleet Management Corp., Rarestep, Inc., OviDrive B.V., FleetCompany GmbH, Sixt Leasing (Acquired by Hyundai Capital Bank Europe GmbH) , Fleetcare Pty Ltd., Capital Lease Group, Wilmar Inc., Wheels, NEXTRAQ, LLC, Avis Budget Group, and Zeemac Vehicle Acquisition & Fleet Services among others.
SKU-
Obtenga acceso en línea al informe sobre la primera nube de inteligencia de mercado del mundo

- Panel de análisis de datos interactivo
- Panel de análisis de empresas para oportunidades con alto potencial de crecimiento
- Acceso de analista de investigación para personalización y consultas
- Análisis de la competencia con panel interactivo
- Últimas noticias, actualizaciones y análisis de tendencias
- Aproveche el poder del análisis de referencia para un seguimiento integral de la competencia
Tabla de contenido
1 INTRODUCTION
1.1 OBJECTIVES OF THE STUDY
1.2 MARKET DEFINITION
1.3 OVERVIEW OF THE MIDDLE EAST & AFRICA FLEET MANAGEMENT MARKET
1.4 CURRENCY AND PRICING
1.5 LIMITATIONS
1.6 MARKETS COVERED
2 MARKET SEGMENTATION
2.1 MARKETS COVERED
2.2 GEOGRAPHICAL SCOPE
2.3 YEARS CONSIDERED FOR THE STUDY
2.4 DBMR TRIPOD DATA VALIDATION MODEL
2.5 PRIMARY INTERVIEWS WITH KEY OPINION LEADERS
2.6 DBMR MARKET POSITION GRID
2.7 VENDOR SHARE ANALYSIS
2.8 MULTIVARIATE MODELING
2.9 OFFERING TIMELINE CURVE
2.1 MARKET END-USE COVERAGE GRID
2.11 SECONDARY SOURCES
2.12 ASSUMPTIONS
3 EXECUTIVE SUMMARY
4 PREMIUM INSIGHTS
4.1 PORTERS MODEL
4.2 REGULATORY LANDSCAPE
4.3 TOP WINNING STRATEGIES
4.4 COMPANY CAR POLICY
4.4.1 BENEFITS OF CAR POLICY CENTRALIZATION
4.4.2 CORPORATE POLICIES ON THE USAGE OF COMPANY CARS
4.5 FLEET MANAGEMENT PROFIT ALLOCATION ALONG THE VALUE CHAIN
4.6 BRAND COMPARATIVE ANALYSIS
4.6.1 TRAXALL
4.6.2 LEASEPLAN
4.6.3 ENTERPRISE HOLDINGS
4.6.4 ELEMENT FLEET MANAGEMENT
4.6.5 WHEELS
4.7 DISRUPTIVE TECHNOLOGIES
5 MARKET OVERVIEW
5.1 DRIVERS
5.1.1 INCREASE IN DEMAND FOR THE LOGISTICS DUE TO THE E-COMMERCE INDUSTRY
5.1.2 RISE IN DEMAND FOR IMPROVEMENT OF CUSTOMER SERVICES
5.1.3 RAPID ADOPTION OF FUEL MANAGEMENT SYSTEMS IN FLEETS
5.1.4 INCREASE IN DEMAND FOR FULL-SERVICE LEASING
5.2 RESTRAINTS
5.2.1 LOWER EFFICIENCY IN CONNECTIVITY
5.2.2 IMPROPER GUIDANCE FOR ENABLING THE ROUTE
5.3 OPPORTUNITIES
5.3.1 RISE IN THE DEMAND FOR UTILITY VEHICLES
5.3.2 RISE IN THE TREND OF MIDDLE EAST & AFRICAIZATION
5.3.3 INCREASING PARTNERSHIP, ACQUISITION, AND COLLABORATION AMONG MARKET PLAYERS
5.3.4 INCREASE IN DATA-DRIVEN MODELS IN MOBILITY
5.4 CHALLENGES
5.4.1 ACCUMULATION OF HUGE DATA VOLUME
5.4.2 RISE IN CYBER THREATS
6 MIDDLE EAST & AFRICA FLEET MANAGEMENT MARKET, BY COMMUNICATION RANGE
6.1 OVERVIEW
6.2 SHORT RANGE COMMUNICATION
6.3 LONG RANGE COMMUNICATION
7 MIDDLE EAST & AFRICA FLEET MANAGEMENT MARKET, BY DEPLOYMENT MODEL
7.1 OVERVIEW
7.2 ON-PREMISE
7.3 CLOUD
7.4 HYBRID
8 MIDDLE EAST & AFRICA FLEET MANAGEMENT MARKET, BY TECHNOLOGY
8.1 OVERVIEW
8.2 GNSS
8.3 CELLULAR SYSTEMS
8.4 LECTRONIC DATA INTERCHANGE (EDI)
8.5 REMOTE SENSING
8.6 COMPUTATIONAL METHOD & DECISION MAKING
8.7 RFID
8.8 OTHERS
9 MIDDLE EAST & AFRICA FLEET MANAGEMENT MARKET, BY FUNCTIONS
9.1 OVERVIEW
9.2 ASSET MANAGEMENT
9.3 ROUTE MANAGEMENT
9.4 FUEL CONSUMPTION
9.5 REAL TIME VEHICLE LOCATION
9.6 DELIVERY SCHEDULE
9.7 ACCIDENT PREVENTION
9.8 MOBILE APPS
9.9 MONITORING DRIVER BEHAVIOR
9.1 VEHICLE MAINTENANCE UPDATES
9.11 ELD COMPLIANCE
9.12 OTHERS
10 MIDDLE EAST & AFRICA FLEET MANAGEMENT MARKET, BY OPERATIONS
10.1 OVERVIEW
10.2 COMMERCIAL
10.3 PRIVATE
11 MIDDLE EAST & AFRICA FLEET MANAGEMENT MARKET, BY BUSINESS TYPE
11.1 OVERVIEW
11.2 LARGE BUSINESS
11.2.1 FLORIST & GIFT DELIVERY BUSINESS
11.2.2 CATERING & FOOD DELIVERING COMPANY
11.2.3 CLEANING SERVICE COMPANY
11.2.4 ELECTRICIAN/PLUMBING/HVAC COMPANY
11.2.5 LANDSCAPING BUSINESS
11.3 SMALL BUSINESS
11.3.1 RENTAL CAR/TRUCK COMPANY
11.3.2 MOVING COMPANY
11.3.3 TAXI COMPANY
11.3.4 DELIVERY COMPANY
11.3.5 LONG HAUL SEMI-TRUCK COMPANY
12 MIDDLE EAST & AFRICA FLEET MANAGEMENT MARKET, BY VEHICLE TYPE
12.1 OVERVIEW
12.2 INTERNAL COMBUSTION ENGINE
12.3 ELECTRIC VEHICLE
13 MIDDLE EAST & AFRICA FLEET MANAGEMENT MARKET, BY OFFERING
13.1 OVERVIEW
13.2 SOLUTIONS
13.2.1 ETA PREDICTIONS
13.2.1.1 STREAMLINED ROUTES
13.2.1.2 DETAILED LOCATION DATA
13.2.1.3 BREAKDOWN NOTIFICATION
13.2.2 OPERATIONS MANAGEMENT
13.2.2.1 FLEET TRACKING & GEO-FENCING
13.2.2.2 ROUTING & SCHEDULING
13.2.2.3 REAL & IDLE TIME MONITORING
13.2.3 PERFORMANCE MANAGEMENT
13.2.3.1 DRIVER MANAGEMENT
13.2.3.1.1 TRACKING
13.2.3.1.2 ROADSIDE/EMERGENCY ASSISTANCE FOR DRIVERS
13.2.3.1.3 MONITORING OF MISUSE (HARD BRAKING)
13.2.3.2 FLEET MANAGEMENT & TRACKING
13.2.3.2.1 REAL TIME ROUTING
13.2.3.2.2 SPEED/IDLING REAL TIME FEEDBACK
13.2.3.2.3 ENGINE DATA VIA ON-BOARD SENSORS
13.2.4 VEHICLE MAINTENANCE & DIAGNOSTICS
13.2.5 SAFETY & COMPLIANCE MANAGEMENT
13.2.6 RISK MANAGEMENT
13.2.7 CONTRACT MANAGEMENT
13.2.7.1 FUEL MANAGEMENT
13.2.7.2 ACCIDENT MANAGEMENT
13.2.7.3 ADMINISTRATIVE COST
13.2.7.4 LONG TERM CONTRACT
13.2.7.5 SHORT TERM CONTRACT
13.3 SERVICES
13.3.1 PROFESSIONAL SERVICES
13.3.1.1 SUPPORT & MAINTENANCE
13.3.1.2 IMPLEMENTATION
13.3.1.3 CONSULTING
13.3.2 MANAGED SERVICES
14 MIDDLE EAST & AFRICA FLEET MANAGEMENT MARKET, BY LEASE TYPE
14.1 OVERVIEW
14.2 ON-LEASE
14.3 WITHOUT LEASE
14.3.1 OPEN ENDED
14.3.2 CLOSE ENDED
15 MIDDLE EAST & AFRICA FLEET MANAGEMENT MARKET, BY HARDWARE
15.1 OVERVIEW
15.2 GPS TRACKING DEVICES
15.3 DASH CAMERAS
15.4 BLUETOOTH TRACKING TAGS
15.5 DATA LOGGERS
15.6 OTHERS
16 MIDDLE EAST & AFRICA FLEET MANAGEMENT MARKET, BY FLEET SIZE
16.1 OVERVIEW
16.2 SMALL FLEETS (1-5 VEHICLES)
16.3 MEDIUM FLEETS (5-20 VEHICLES)
16.4 LARGE & ENTERPRISE FLEETS (20-50+ VEHICLES)
17 MIDDLE EAST & AFRICA FLEET MANAGEMENT MARKET, BY MODE OF TRANSPORT
17.1 OVERVIEW
17.1.1 AUTOMOTIVE
17.1.2 LIGHT DUTY VEHICLE
17.1.2.1 PASSENGER CARS
17.1.2.2 VANS
17.1.3 MEDIUM & HEAVY VEHICLE
17.1.3.1 TRUCKS
17.1.3.2 TRAILERS
17.1.3.3 FORKLIFTS
17.1.3.4 SPECIALIST VEHICLES
17.1.4 MARINE
17.1.5 ROLLING STOCK
17.1.6 AIRCRAFT
18 MIDDLE EAST & AFRICA FLEET MANAGEMENT MARKET, BY END USER
18.1 OVERVIEW
18.2 AUTOMOTIVE
18.2.1 SOLUTIONS
18.2.1.1 ETA PREDICTIONS
18.2.1.2 OPERATIONS MANAGEMENT
18.2.1.3 PERFORMANCE MANAGEMENT
18.2.1.4 VEHICLE MAINTENANCE & DIAGNOSTICS
18.2.1.5 SAFETY & COMPLIANCE MANAGEMENT
18.2.1.6 RISK MANAGEMENT
18.2.1.7 CONTRACT MANAGEMENT
18.2.2 SERVICES
18.2.2.1 PROFESSIONAL SERVICES
18.2.2.2 MANAGED SERVICES
18.3 TRANSPORTATION & LOGISTICS
18.3.1 SOLUTIONS
18.3.1.1 ETA PREDICTIONS
18.3.1.2 OPERATIONS MANAGEMENT
18.3.1.3 PERFORMANCE MANAGEMENT
18.3.1.4 VEHICLE MAINTENANCE & DIAGNOSTICS
18.3.1.5 SAFETY & COMPLIANCE MANAGEMENT
18.3.1.6 RISK MANAGEMENT
18.3.1.7 CONTRACT MANAGEMENT
18.3.2 SERVICES
18.3.2.1 PROFESSIONAL SERVICES
18.3.2.2 MANAGED SERVICES
18.4 RETAIL
18.4.1 SOLUTIONS
18.4.1.1 ETA PREDICTIONS
18.4.1.2 OPERATIONS MANAGEMENT
18.4.1.3 PERFORMANCE MANAGEMENT
18.4.1.4 VEHICLE MAINTENANCE & DIAGNOSTICS
18.4.1.5 SAFETY & COMPLIANCE MANAGEMENT
18.4.1.6 RISK MANAGEMENT
18.4.1.7 CONTRACT MANAGEMENT
18.4.2 SERVICES
18.4.2.1 PROFESSIONAL SERVICES
18.4.2.2 MANAGED SERVICES
18.5 MANUFACTURING
18.5.1 SOLUTIONS
18.5.1.1 ETA PREDICTIONS
18.5.1.2 OPERATIONS MANAGEMENT
18.5.1.3 PERFORMANCE MANAGEMENT
18.5.1.4 VEHICLE MAINTENANCE & DIAGNOSTICS
18.5.1.5 SAFETY & COMPLIANCE MANAGEMENT
18.5.1.6 RISK MANAGEMENT
18.5.1.7 CONTRACT MANAGEMENT
18.5.2 SERVICES
18.5.2.1 PROFESSIONAL SERVICES
18.5.2.2 MANAGED SERVICES
18.6 FOOD & BEVERAGES
18.6.1 SOLUTIONS
18.6.1.1 ETA PREDICTIONS
18.6.1.2 OPERATIONS MANAGEMENT
18.6.1.3 PERFORMANCE MANAGEMENT
18.6.1.4 VEHICLE MAINTENANCE & DIAGNOSTICS
18.6.1.5 SAFETY & COMPLIANCE MANAGEMENT
18.6.1.6 RISK MANAGEMENT
18.6.1.7 CONTRACT MANAGEMENT
18.6.2 SERVICES
18.6.2.1 PROFESSIONAL SERVICES
18.6.2.2 MANAGED SERVICES
18.7 ENERGY & UTILITIES
18.7.1 SOLUTIONS
18.7.1.1 ETA PREDICTIONS
18.7.1.2 OPERATIONS MANAGEMENT
18.7.1.3 PERFORMANCE MANAGEMENT
18.7.1.4 VEHICLE MAINTENANCE & DIAGNOSTICS
18.7.1.5 SAFETY & COMPLIANCE MANAGEMENT
18.7.1.6 RISK MANAGEMENT
18.7.1.7 CONTRACT MANAGEMENT
18.7.2 SERVICES
18.7.2.1 PROFESSIONAL SERVICES
18.7.2.2 MANAGED SERVICES
18.8 MINING
18.8.1 SOLUTIONS
18.8.1.1 ETA PREDICTIONS
18.8.1.2 OPERATIONS MANAGEMENT
18.8.1.3 PERFORMANCE MANAGEMENT
18.8.1.4 VEHICLE MAINTENANCE & DIAGNOSTICS
18.8.1.5 SAFETY & COMPLIANCE MANAGEMENT
18.8.1.6 RISK MANAGEMENT
18.8.1.7 CONTRACT MANAGEMENT
18.8.2 SERVICES
18.8.2.1 PROFESSIONAL SERVICES
18.8.2.2 MANAGED SERVICES
18.9 GOVERNMENT
18.9.1 SOLUTIONS
18.9.1.1 ETA PREDICTIONS
18.9.1.2 OPERATIONS MANAGEMENT
18.9.1.3 PERFORMANCE MANAGEMENT
18.9.1.4 VEHICLE MAINTENANCE & DIAGNOSTICS
18.9.1.5 SAFETY & COMPLIANCE MANAGEMENT
18.9.1.6 RISK MANAGEMENT
18.9.1.7 CONTRACT MANAGEMENT
18.9.2 SERVICES
18.9.2.1 PROFESSIONAL SERVICES
18.9.2.2 MANAGED SERVICES
18.1 HEALTHCARE
18.10.1 SOLUTIONS
18.10.1.1 ETA PREDICTIONS
18.10.1.2 OPERATIONS MANAGEMENT
18.10.1.3 PERFORMANCE MANAGEMENT
18.10.1.4 VEHICLE MAINTENANCE & DIAGNOSTICS
18.10.1.5 SAFETY & COMPLIANCE MANAGEMENT
18.10.1.6 RISK MANAGEMENT
18.10.1.7 CONTRACT MANAGEMENT
18.10.2 SERVICES
18.10.2.1 PROFESSIONAL SERVICES
18.10.2.2 MANAGED SERVICES
18.11 AGRICULTURE
18.11.1 SOLUTIONS
18.11.1.1 ETA PREDICTIONS
18.11.1.2 OPERATIONS MANAGEMENT
18.11.1.3 PERFORMANCE MANAGEMENT
18.11.1.4 VEHICLE MAINTENANCE & DIAGNOSTICS
18.11.1.5 SAFETY & COMPLIANCE MANAGEMENT
18.11.1.6 RISK MANAGEMENT
18.11.1.7 CONTRACT MANAGEMENT
18.11.2 SERVICES
18.11.2.1 PROFESSIONAL SERVICES
18.11.2.2 MANAGED SERVICES
18.12 CONSTRUCTION
18.12.1 SOLUTIONS
18.12.1.1 ETA PREDICTIONS
18.12.1.2 OPERATIONS MANAGEMENT
18.12.1.3 PERFORMANCE MANAGEMENT
18.12.1.4 VEHICLE MAINTENANCE & DIAGNOSTICS
18.12.1.5 SAFETY & COMPLIANCE MANAGEMENT
18.12.1.6 RISK MANAGEMENT
18.12.1.7 CONTRACT MANAGEMENT
18.12.2 SERVICES
18.12.2.1 PROFESSIONAL SERVICES
18.12.2.2 MANAGED SERVICES
18.13 OTHERS
19 MIDDLE EAST & AFRICA FLEET MANAGEMENT MARKET, BY REGION
19.1 MIDDLE EAST AND AFRICA
19.1.1 SAUDI ARABIA
19.1.2 SOUTH AFRICA
19.1.3 EGYPT
19.1.4 ISRAEL
19.1.5 REST OF MIDDLE EAST AND AFRICA
20 MIDDLE EAST & AFRICA FLEET MANAGEMENT MARKET: COMPANY LANDSCAPE
20.1 COMPANY SHARE ANALYSIS: MIDDLE EAST & AFRICA
21 SWOT ANALYSIS
22 COMPANY PROFILE
22.1 ENTERPRISE HOLDINGS
22.1.1 COMPANY SNAPSHOT
22.1.2 COMPANY SHARE ANALYSIS
22.1.3 SOLUTION PORTFOLIO
22.1.4 RECENT DEVELOPMENTS
22.2 AVIS BUDGET GROUP
22.2.1 COMPANY SNAPSHOT
22.2.2 REVENUE ANALYSIS
22.2.3 COMPANY SHARE ANALYSIS
22.2.4 SOLUTION PORTFOLIO
22.2.5 RECENT DEVELOPMENTS
22.3 DEUTSCHE LEASING AG
22.3.1 COMPANY SNAPSHOT
22.3.2 REVENUE ANALYSIS
22.3.3 COMPANY SHARE ANALYSIS
22.3.4 SOLUTION PORTFOLIO
22.3.5 RECENT DEVELOPMENT
22.4 ALD AUTOMOTIVE
22.4.1 COMPANY SNAPSHOT
22.4.2 REVENUE ANALYSIS
22.4.3 COMPANY SHARE ANALYSIS
22.4.4 SOLUTION PORTFOLIO
22.4.5 RECENT DEVELOPMENTS
22.5 LEASEPLAN
22.5.1 COMPANY SNAPSHOT
22.5.2 REVENUE ANALYSIS
22.5.3 COMPANY SHARE ANALYSIS
22.5.4 SOLUTION PORTFOLIO
22.5.5 RECENT DEVELOPMENTS
22.6 AVRIOS
22.6.1 COMPANY SNAPSHOT
22.6.2 SOLUTION PORTFOLIO
22.6.3 RECENT DEVELOPMENT
22.7 BERGSTROM AUTOMOTIVE
22.7.1 COMPANY SNAPSHOT
22.7.2 SOLUTION PORTFOLIO
22.7.3 RECENT DEVELOPMENT
22.8 CAPITAL LEASE GROUP
22.8.1 COMPANY SNAPSHOT
22.8.2 SOLUTION PORTFOLIO
22.8.3 RECENT DEVELOPMENTS
22.9 CHEVIN FLEET SOLUTIONS
22.9.1 COMPANY SNAPSHOT
22.9.2 PRODUCT PORTFOLIO
22.9.3 RECENT DEVELOPMENTS
22.1 DONLEN
22.10.1 COMPANY SNAPSHOT
22.10.2 SOLUTION PORTFOLIO
22.10.3 RECENT DEVELOPMENTS
22.11 ELEMENT FLEET MANAGEMENT CORP.
22.11.1 COMPANY SNAPSHOT
22.11.2 REVENUE ANALYSIS
22.11.3 SOLUTION PORTFOLIO
22.11.4 RECENT DEVELOPMENT
22.12 EMKAY
22.12.1 COMPANY SNAPSHOT
22.12.2 SOLUTION PORTFOLIO
22.12.3 RECENT DEVELOPMENT
22.13 FLEETCARE PTY LTD.
22.13.1 COMPANY SNAPSHOT
22.13.2 SOLUTION PORTFOLIO
22.13.3 RECENT DEVELOPMENT
22.14 FLEETCOMPANY GMBH
22.14.1 COMPANY SNAPSHOT
22.14.2 SOLUTION PORTFOLIO
22.14.3 RECENT DEVELOPMENTS
22.15 MOTIVE TECHNOLOGIES, INC.
22.15.1 COMPANY SNAPSHOT
22.15.2 PRODUCT PORTFOLIO
22.15.3 RECENT DEVELOPMENTS
22.16 NEXTRAQ, LLC
22.16.1 COMPANY SNAPSHOT
22.16.2 SOLUTION PORTFOLIO
22.16.3 RECENT DEVELOPMENTS
22.17 OVIDRIVE B.V.
22.17.1 COMPANY SNAPSHOT
22.17.2 SOLUTION PORTFOLIO
22.17.3 RECENT DEVELOPMENTS
22.18 RARESTEP, INC.
22.18.1 COMPANY SNAPSHOT
22.18.2 SOLUTION PORTFOLIO
22.18.3 RECENT DEVELOPMENTS
22.19 SIXT LEASING
22.19.1 COMPANY SNAPSHOT
22.19.2 REVENUE ANALYSIS
22.19.3 SOLUTION PORTFOLIO
22.19.4 RECENT DEVELOPMENT
22.2 TRAXALL
22.20.1 COMPANY SNAPSHOT
22.20.2 SOLUTION PORTFOLIO
22.20.3 RECENT DEVELOPMENTS
22.21 TÜV SÜD
22.21.1 COMPANY SNAPSHOT
22.21.2 REVENUE ANALYSIS
22.21.3 SOLUTION PORTFOLIO
22.21.4 RECENT DEVELOPMENT
22.22 VELCO
22.22.1 COMPANY SNAPSHOT
22.22.2 SOLUTION PORTFOLIO
22.22.3 RECENT DEVELOPMENTS
22.23 WHEELS
22.23.1 COMPANY SNAPSHOT
22.23.2 SOLUTION PORTFOLIO
22.23.3 RECENT DEVELOPMENTS
22.24 WILMAR INC.
22.24.1 COMPANY SNAPSHOT
22.24.2 SOLUTION PORTFOLIO
22.24.3 RECENT DEVELOPMENTS
22.25 ZEEMAC VEHICLE ACQUISITION & FLEET SERVICES
22.25.1 COMPANY SNAPSHOT
22.25.2 SOLUTION PORTFOLIO
22.25.3 RECENT DEVELOPMENTS
23 QUESTIONNAIRE
24 RELATED REPORTS
Lista de Tablas
TABLE 1 VARIOUS REGULATORY STANDARDS RELATED TO FLEET MANAGEMENT
TABLE 2 MIDDLE EAST & AFRICA FLEET MANAGEMENT MARKET, BY COMMUNICATION RANGE, 2021-2030 (USD THOUSAND)
TABLE 3 MIDDLE EAST & AFRICA SHORT RANGE COMMUNICATION IN FLEET MANAGEMENT MARKET, BY REGION, 2021-2030 (USD THOUSAND)
TABLE 4 MIDDLE EAST & AFRICA LONG RANGE COMMUNICATION IN FLEET MANAGEMENT MARKET, BY REGION, 2021-2030 (USD THOUSAND)
TABLE 5 MIDDLE EAST & AFRICA FLEET MANAGEMENT MARKET, BY DEPLOYMENT MODEL, 2021-2030 (USD THOUSAND)
TABLE 6 MIDDLE EAST & AFRICA ON-PREMISE IN FLEET MANAGEMENT MARKET, BY REGION, 2021-2030 (USD THOUSAND)
TABLE 7 MIDDLE EAST & AFRICA CLOUD IN FLEET MANAGEMENT MARKET, BY REGION, 2021-2030 (USD THOUSAND)
TABLE 8 MIDDLE EAST & AFRICA HYBRID IN FLEET MANAGEMENT MARKET, BY REGION, 2021-2030 (USD THOUSAND)
TABLE 9 MIDDLE EAST & AFRICA FLEET MANAGEMENT MARKET, BY TECHNOLOGY, 2021-2030 (USD THOUSAND)
TABLE 10 MIDDLE EAST & AFRICA GNSS IN FLEET MANAGEMENT MARKET, BY REGION, 2021-2030 (USD THOUSAND)
TABLE 11 MIDDLE EAST & AFRICA CELLULAR SYSTEMS IN FLEET MANAGEMENT MARKET, BY REGION, 2021-2030 (USD THOUSAND)
TABLE 12 MIDDLE EAST & AFRICA ELECTRONIC DATA INTERCHANGE (EDI) IN FLEET MANAGEMENT MARKET, BY REGION, 2021-2030 (USD THOUSAND)
TABLE 13 MIDDLE EAST & AFRICA REMOTE SENSING IN FLEET MANAGEMENT MARKET, BY REGION, 2021-2030 (USD THOUSAND)
TABLE 14 MIDDLE EAST & AFRICA COMPUTATIONAL METHOD & DECISION MAKING IN FLEET MANAGEMENT MARKET, BY REGION, 2021-2030 (USD THOUSAND)
TABLE 15 MIDDLE EAST & AFRICA RFID IN FLEET MANAGEMENT MARKET, BY REGION, 2021-2030 (USD THOUSAND)
TABLE 16 MIDDLE EAST & AFRICA OTHERS IN FLEET MANAGEMENT MARKET, BY REGION, 2021-2030 (USD THOUSAND)
TABLE 17 MIDDLE EAST & AFRICA FLEET MANAGEMENT MARKET, BY FUNCTIONS, 2021-2030 (USD THOUSAND)
TABLE 18 MIDDLE EAST & AFRICA ASSET MANAGEMENT IN FLEET MANAGEMENT MARKET, BY REGION, 2021-2030 (USD THOUSAND)
TABLE 19 MIDDLE EAST & AFRICA ROUTE MANAGEMENT IN FLEET MANAGEMENT MARKET, BY REGION, 2021-2030 (USD THOUSAND)
TABLE 20 MIDDLE EAST & AFRICA FUEL CONSUMPTION IN FLEET MANAGEMENT MARKET, BY REGION, 2021-2030 (USD THOUSAND)
TABLE 21 MIDDLE EAST & AFRICA REAL TIME VEHICLE LOCATION IN FLEET MANAGEMENT MARKET, BY REGION, 2021-2030 (USD THOUSAND)
TABLE 22 MIDDLE EAST & AFRICA DELIVERY SCHEDULE IN FLEET MANAGEMENT MARKET, BY REGION, 2021-2030 (USD THOUSAND)
TABLE 23 MIDDLE EAST & AFRICA ACCIDENT PREVENTION IN FLEET MANAGEMENT MARKET, BY REGION, 2021-2030 (USD THOUSAND)
TABLE 24 MIDDLE EAST & AFRICA MOBILE APPS IN FLEET MANAGEMENT MARKET, BY REGION, 2021-2030 (USD THOUSAND)
TABLE 25 MIDDLE EAST & AFRICA MONITORING DRIVER BEHAVIOR IN FLEET MANAGEMENT MARKET, BY REGION, 2021-2030 (USD THOUSAND)
TABLE 26 MIDDLE EAST & AFRICA VEHICLE MAINTENANCE UPDATES IN FLEET MANAGEMENT MARKET, BY REGION, 2021-2030 (USD THOUSAND)
TABLE 27 MIDDLE EAST & AFRICA ELD COMPLIANCE IN FLEET MANAGEMENT MARKET, BY REGION, 2021-2030 (USD THOUSAND)
TABLE 28 MIDDLE EAST & AFRICA OTHERS IN FLEET MANAGEMENT MARKET, BY REGION, 2021-2030 (USD THOUSAND)
TABLE 29 MIDDLE EAST & AFRICA FLEET MANAGEMENT MARKET, BY OPERATIONS, 2021-2030 (USD THOUSAND)
TABLE 30 MIDDLE EAST & AFRICA COMMERCIAL IN FLEET MANAGEMENT MARKET, BY REGION, 2021-2030 (USD THOUSAND)
TABLE 31 MIDDLE EAST & AFRICA PRIVATE IN FLEET MANAGEMENT MARKET, BY REGION, 2021-2030 (USD THOUSAND)
TABLE 32 MIDDLE EAST & AFRICA FLEET MANAGEMENT MARKET, BY BUSINESS TYPE, 2021-2030 (USD THOUSAND)
TABLE 33 MIDDLE EAST & AFRICA LARGE BUSINESS IN FLEET MANAGEMENT MARKET, BY REGION, 2021-2030 (USD THOUSAND)
TABLE 34 MIDDLE EAST & AFRICA LARGE BUSINESS IN FLEET MANAGEMENT MARKET, BY TYPE, 2021-2030 (USD THOUSAND)
TABLE 35 MIDDLE EAST & AFRICA SMALL BUSINESS IN FLEET MANAGEMENT MARKET, BY REGION, 2021-2030 (USD THOUSAND)
TABLE 36 MIDDLE EAST & AFRICA SMALL BUSINESS IN FLEET MANAGEMENT MARKET, BY TYPE, 2021-2030 (USD THOUSAND)
TABLE 37 MIDDLE EAST & AFRICA FLEET MANAGEMENT MARKET, BY VEHICLE TYPE, 2021-2030 (USD THOUSAND)
TABLE 38 MIDDLE EAST & AFRICA INTERNAL COMBUSTION ENGINE IN FLEET MANAGEMENT MARKET, BY REGION, 2021-2030 (USD THOUSAND)
TABLE 39 MIDDLE EAST & AFRICA ELECTRIC VEHICLE IN FLEET MANAGEMENT MARKET, BY REGION, 2021-2030 (USD THOUSAND)
TABLE 40 MIDDLE EAST & AFRICA FLEET MANAGEMENT MARKET, BY OFFERING, 2021-2030 (USD THOUSAND)
TABLE 41 MIDDLE EAST & AFRICA SOLUTIONS IN FLEET MANAGEMENT MARKET, BY REGION, 2021-2030 (USD THOUSAND)
TABLE 42 MIDDLE EAST & AFRICA SOLUTIONS IN FLEET MANAGEMENT MARKET, BY TYPE, 2021-2030 (USD THOUSAND)
TABLE 43 MIDDLE EAST & AFRICA ETA PREDICTIONS IN FLEET MANAGEMENT MARKET, BY TYPE, 2021-2030 (USD THOUSAND)
TABLE 44 MIDDLE EAST & AFRICA OPERATIONS MANAGEMENT IN FLEET MANAGEMENT MARKET, BY TYPE, 2021-2030 (USD THOUSAND)
TABLE 45 MIDDLE EAST & AFRICA PERFORMANCE MANAGEMENT IN FLEET MANAGEMENT MARKET, BY TYPE, 2021-2030 (USD THOUSAND)
TABLE 46 MIDDLE EAST & AFRICA DRIVER MANAGEMENT IN FLEET MANAGEMENT MARKET, BY TYPE, 2021-2030 (USD THOUSAND)
TABLE 47 MIDDLE EAST & AFRICA FLEET MANAGEMENT & TRACKING IN FLEET MANAGEMENT MARKET, BY TYPE, 2021-2030 (USD THOUSAND)
TABLE 48 MIDDLE EAST & AFRICA CONTRACT MANAGEMENT IN FLEET MANAGEMENT MARKET, BY STRUCTURE, 2021-2030 (USD THOUSAND)
TABLE 49 MIDDLE EAST & AFRICA CONTRACT MANAGEMENT IN FLEET MANAGEMENT MARKET, BY MODEL, 2021-2030 (USD THOUSAND)
TABLE 50 MIDDLE EAST & AFRICA SERVICES IN FLEET MANAGEMENT MARKET, BY REGION, 2021-2030 (USD THOUSAND)
TABLE 51 MIDDLE EAST & AFRICA SERVICES IN FLEET MANAGEMENT MARKET, BY TYPE, 2021-2030 (USD THOUSAND)
TABLE 52 MIDDLE EAST & AFRICA PROFESSIONAL SERVICES IN FLEET MANAGEMENT MARKET, BY TYPE, 2021-2030 (USD THOUSAND)
TABLE 53 MIDDLE EAST & AFRICA FLEET MANAGEMENT MARKET, BY LEASE TYPE, 2021-2030 (USD THOUSAND)
TABLE 54 MIDDLE EAST & AFRICA ON-LEASE IN FLEET MANAGEMENT MARKET, BY REGION, 2021-2030 (USD THOUSAND)
TABLE 55 MIDDLE EAST & AFRICA WITHOUT LEASE IN FLEET MANAGEMENT MARKET, BY REGION, 2021-2030 (USD THOUSAND)
TABLE 56 MIDDLE EAST & AFRICA WITHOUT LEASE IN FLEET MANAGEMENT MARKET, BY TYPE, 2021-2030 (USD THOUSAND)
TABLE 57 MIDDLE EAST & AFRICA FLEET MANAGEMENT MARKET, BY HARDWARE, 2021-2030 (USD THOUSAND)
TABLE 58 MIDDLE EAST & AFRICA GPS TRACKING DEVICES IN FLEET MANAGEMENT MARKET, BY REGION, 2021-2030 (USD THOUSAND)
TABLE 59 MIDDLE EAST & AFRICA DASH CAMERAS IN FLEET MANAGEMENT MARKET, BY REGION, 2021-2030 (USD THOUSAND)
TABLE 60 MIDDLE EAST & AFRICA BLUETOOTH TRACKING TAGS IN FLEET MANAGEMENT MARKET, BY REGION, 2021-2030 (USD THOUSAND)
TABLE 61 MIDDLE EAST & AFRICA DATA LOGGERS IN FLEET MANAGEMENT MARKET, BY REGION, 2021-2030 (USD THOUSAND)
TABLE 62 MIDDLE EAST & AFRICA OTHERS IN FLEET MANAGEMENT MARKET, BY REGION, 2021-2030 (USD THOUSAND)
TABLE 63 MIDDLE EAST & AFRICA FLEET MANAGEMENT MARKET, BY FLEET SIZE, 2021-2030 (USD THOUSAND)
TABLE 64 MIDDLE EAST & AFRICA SMALL FLEETS (1-5 VEHICLES) IN FLEET MANAGEMENT MARKET, BY REGION, 2021-2030 (USD THOUSAND)
TABLE 65 MIDDLE EAST & AFRICA MEDIUM FLEETS (5-20 VEHICLES) IN FLEET MANAGEMENT MARKET, BY REGION, 2021-2030 (USD THOUSAND)
TABLE 66 MIDDLE EAST & AFRICA LARGE & ENTERPRISE FLEETS (20-50+ VEHICLES) IN FLEET MANAGEMENT MARKET, BY REGION, 2021-2030 (USD THOUSAND)
TABLE 67 MIDDLE EAST & AFRICA FLEET MANAGEMENT MARKET, BY MODE OF TRANSPORT, 2021-2030 (USD THOUSAND)
TABLE 68 MIDDLE EAST & AFRICA AUTOMOTIVE IN FLEET MANAGEMENT MARKET, BY REGION, 2021-2030 (USD THOUSAND)
TABLE 69 MIDDLE EAST & AFRICA AUTOMOTIVE IN FLEET MANAGEMENT MARKET, BY TYPE, 2021-2030 (USD THOUSAND)
TABLE 70 MIDDLE EAST & AFRICA LIGHT DUTY VEHICLE IN FLEET MANAGEMENT MARKET, BY TYPE, 2021-2030 (USD THOUSAND)
TABLE 71 MIDDLE EAST & AFRICA MEDIUM & HEAVY VEHICLE IN FLEET MANAGEMENT MARKET, BY TYPE, 2021-2030 (USD THOUSAND)
TABLE 72 MIDDLE EAST & AFRICA MARINE IN FLEET MANAGEMENT MARKET, BY REGION, 2021-2030 (USD THOUSAND)
TABLE 73 MIDDLE EAST & AFRICA ROLLING STOCK IN FLEET MANAGEMENT MARKET, BY REGION, 2021-2030 (USD THOUSAND)
TABLE 74 MIDDLE EAST & AFRICA AIRCRAFT STOCK IN FLEET MANAGEMENT MARKET, BY REGION, 2021-2030 (USD THOUSAND)
TABLE 75 MIDDLE EAST & AFRICA FLEET MANAGEMENT MARKET, BY END USER, 2021-2030 (USD THOUSAND)
TABLE 76 MIDDLE EAST & AFRICA AUTOMOTIVE IN FLEET MANAGEMENT MARKET, BY REGION, 2021-2030 (USD THOUSAND)
TABLE 77 MIDDLE EAST & AFRICA AUTOMOTIVE IN FLEET MANAGEMENT MARKET, BY OFFERING, 2021-2030 (USD THOUSAND)
TABLE 78 MIDDLE EAST & AFRICA SOLUTIONS IN FLEET MANAGEMENT MARKET, BY TYPE, 2021-2030 (THOUSAND )
TABLE 79 MIDDLE EAST & AFRICA SERVICES IN FLEET MANAGEMENT MARKET, BY TYPE, 2021-2030 (USD THOUSAND)
TABLE 80 MIDDLE EAST & AFRICA TRANSPORTATION & LOGISTICS IN FLEET MANAGEMENT MARKET, BY REGION, 2021-2030 (USD THOUSAND)
TABLE 81 MIDDLE EAST & AFRICA TRANSPORTATION & LOGISTICS IN FLEET MANAGEMENT MARKET, BY OFFERING, 2021-2030 (USD THOUSAND)
TABLE 82 MIDDLE EAST & AFRICA SOLUTIONS IN FLEET MANAGEMENT MARKET, BY TYPE, 2021-2030 (THOUSAND)
TABLE 83 MIDDLE EAST & AFRICA SERVICES IN FLEET MANAGEMENT MARKET, BY TYPE, 2021-2030 (USD THOUSAND)
TABLE 84 MIDDLE EAST & AFRICA RETAIL IN FLEET MANAGEMENT MARKET, BY REGION, 2021-2030 (USD THOUSAND)
TABLE 85 MIDDLE EAST & AFRICA RETAIL IN FLEET MANAGEMENT MARKET, BY OFFERING, 2021-2030 (USD THOUSAND)
TABLE 86 MIDDLE EAST & AFRICA SOLUTIONS IN FLEET MANAGEMENT MARKET, BY TYPE, 2021-2030 (USD THOUSAND)
TABLE 87 MIDDLE EAST & AFRICA SERVICES IN FLEET MANAGEMENT MARKET, BY TYPE, 2021-2030 (USD THOUSAND)
TABLE 88 MIDDLE EAST & AFRICA MANUFACTURING IN FLEET MANAGEMENT MARKET, BY REGION, 2021-2030 (USD THOUSAND)
TABLE 89 MIDDLE EAST & AFRICA MANUFACTURING IN FLEET MANAGEMENT MARKET, BY OFFERING, 2021-2030 (USD THOUSAND)
TABLE 90 MIDDLE EAST & AFRICA SOLUTIONS IN FLEET MANAGEMENT MARKET, BY TYPE, 2021-2030 (USD THOUSAND)
TABLE 91 MIDDLE EAST & AFRICA SERVICES IN FLEET MANAGEMENT MARKET, BY TYPE, 2021-2030 (USD THOUSAND)
TABLE 92 MIDDLE EAST & AFRICA FOOD & BEVERAGES IN FLEET MANAGEMENT MARKET, BY REGION, 2021-2030 (USD THOUSAND)
TABLE 93 MIDDLE EAST & AFRICA FOOD & BEVERAGES IN FLEET MANAGEMENT MARKET, BY OFFERING, 2021-2030 (USD THOUSAND)
TABLE 94 MIDDLE EAST & AFRICA SOLUTIONS IN FLEET MANAGEMENT MARKET, BY TYPE, 2021-2030 (USD THOUSAND)
TABLE 95 MIDDLE EAST & AFRICA SERVICES IN FLEET MANAGEMENT MARKET, BY TYPE, 2021-2030 (USD THOUSAND)
TABLE 96 MIDDLE EAST & AFRICA ENERGY & UTILITIES IN FLEET MANAGEMENT MARKET, BY REGION, 2021-2030 (USD THOUSAND)
TABLE 97 MIDDLE EAST & AFRICA ENERGY & UTILITIES IN FLEET MANAGEMENT MARKET, BY OFFERING, 2021-2030 (USD THOUSAND)
TABLE 98 MIDDLE EAST & AFRICA SOLUTIONS IN FLEET MANAGEMENT MARKET, BY TYPE, 2021-2030 (USD THOUSAND)
TABLE 99 MIDDLE EAST & AFRICA SERVICES IN FLEET MANAGEMENT MARKET, BY TYPE, 2021-2030 (USD THOUSAND)
TABLE 100 MIDDLE EAST & AFRICA MINING IN FLEET MANAGEMENT MARKET, BY REGION, 2021-2030 (USD THOUSAND)
TABLE 101 MIDDLE EAST & AFRICA MINING IN FLEET MANAGEMENT MARKET, BY OFFERING, 2021-2030 (USD THOUSAND)
TABLE 102 MIDDLE EAST & AFRICA SOLUTIONS IN FLEET MANAGEMENT MARKET, BY TYPE, 2021-2030 (USD THOUSAND)
TABLE 103 MIDDLE EAST & AFRICA SERVICES IN FLEET MANAGEMENT MARKET, BY TYPE, 2021-2030 (USD THOUSAND)
TABLE 104 MIDDLE EAST & AFRICA GOVERNMENT IN FLEET MANAGEMENT MARKET, BY REGION, 2021-2030 (USD THOUSAND)
TABLE 105 MIDDLE EAST & AFRICA GOVERNMENT IN FLEET MANAGEMENT MARKET, BY OFFERING, 2021-2030 (USD THOUSAND)
TABLE 106 MIDDLE EAST & AFRICA SOLUTIONS IN FLEET MANAGEMENT MARKET, BY TYPE, 2021-2030 (USD THOUSAND)
TABLE 107 MIDDLE EAST & AFRICA SERVICES IN FLEET MANAGEMENT MARKET, BY TYPE, 2021-2030 (USD THOUSAND)
TABLE 108 MIDDLE EAST & AFRICA HEALTHCARE IN FLEET MANAGEMENT MARKET, BY REGION, 2021-2030 (USD THOUSAND)
TABLE 109 MIDDLE EAST & AFRICA HEALTHCARE IN FLEET MANAGEMENT MARKET, BY OFFERING, 2021-2030 (USD THOUSAND)
TABLE 110 MIDDLE EAST & AFRICA SOLUTIONS IN FLEET MANAGEMENT MARKET, BY TYPE, 2021-2030 (USD THOUSAND)
TABLE 111 MIDDLE EAST & AFRICA SERVICES IN FLEET MANAGEMENT MARKET, BY TYPE, 2021-2030 (USD THOUSAND)
TABLE 112 MIDDLE EAST & AFRICA AGRICULTURE IN FLEET MANAGEMENT MARKET, BY REGION, 2021-2030 (USD THOUSAND)
TABLE 113 MIDDLE EAST & AFRICA AGRICULTURE IN FLEET MANAGEMENT MARKET, BY OFFERING, 2021-2030 (USD THOUSAND)
TABLE 114 MIDDLE EAST & AFRICA SOLUTIONS IN FLEET MANAGEMENT MARKET, BY TYPE, 2021-2030 (USD THOUSAND)
TABLE 115 MIDDLE EAST & AFRICA SERVICES IN FLEET MANAGEMENT MARKET, BY TYPE, 2021-2030 (USD THOUSAND)
TABLE 116 MIDDLE EAST & AFRICA CONSTRUCTION IN FLEET MANAGEMENT MARKET, BY REGION, 2021-2030 (USD THOUSAND)
TABLE 117 MIDDLE EAST & AFRICA CONSTRUCTION IN FLEET MANAGEMENT MARKET, BY OFFERING, 2021-2030 (USD THOUSAND)
TABLE 118 MIDDLE EAST & AFRICA SOLUTIONS IN FLEET MANAGEMENT MARKET, BY TYPE, 2021-2030 (USD THOUSAND)
TABLE 119 MIDDLE EAST & AFRICA SERVICES IN FLEET MANAGEMENT MARKET, BY TYPE, 2021-2030 (USD THOUSAND)
TABLE 120 MIDDLE EAST & AFRICA OTHERS IN FLEET MANAGEMENT MARKET, BY REGION, 2021-2030 (USD THOUSAND)
TABLE 121 MIDDLE EAST AND AFRICA FLEET MANAGEMENT MARKET, BY COUNTRY, 2021-2030 (USD THOUSAND)
TABLE 122 MIDDLE EAST AND AFRICA FLEET MANAGEMENT MARKET, BY OFFERING, 2021-2030 (USD THOUSAND)
TABLE 123 MIDDLE EAST AND AFRICA SOLUTIONS IN FLEET MANAGEMENT MARKET, BY TYPE, 2021-2030 (USD THOUSAND)
TABLE 124 MIDDLE EAST AND AFRICA ETA PREDICTIONS IN FLEET MANAGEMENT MARKET, BY TYPE, 2021-2030 (USD THOUSAND)
TABLE 125 MIDDLE EAST AND AFRICA OPERATIONS MANAGEMENT IN FLEET MANAGEMENT MARKET, BY TYPE, 2021-2030 (USD THOUSAND)
TABLE 126 MIDDLE EAST AND AFRICA PERFORMANCE MANAGEMENT IN FLEET MANAGEMENT MARKET, BY TYPE, 2021-2030 (USD THOUSAND)
TABLE 127 MIDDLE EAST AND AFRICA DRIVER MANAGEMENT IN FLEET MANAGEMENT MARKET, BY TYPE, 2021-2030 (USD THOUSAND)
TABLE 128 MIDDLE EAST AND AFRICA FLEET MANAGEMENT & TRACKING IN FLEET MANAGEMENT MARKET, BY TYPE, 2021-2030 (USD THOUSAND)
TABLE 129 MIDDLE EAST AND AFRICA CONTRACT MANAGEMENT IN FLEET MANAGEMENT MARKET, BY STRUCTURE, 2021-2030 (USD THOUSAND)
TABLE 130 MIDDLE EAST AND AFRICA CONTRACT MANAGEMENT IN FLEET MANAGEMENT MARKET, BY MODEL, 2021-2030 (USD THOUSAND)
TABLE 131 MIDDLE EAST AND AFRICA SERVICES IN FLEET MANAGEMENT MARKET, BY TYPE, 2021-2030 (USD THOUSAND)
TABLE 132 MIDDLE EAST AND AFRICA PROFESSIONAL SERVICES IN FLEET MANAGEMENT MARKET, BY TYPE, 2021-2030 (USD THOUSAND)
TABLE 133 MIDDLE EAST AND AFRICA FLEET MANAGEMENT MARKET, BY LEASE TYPE, 2021-2030 (USD THOUSAND)
TABLE 134 MIDDLE EAST AND AFRICA WITHOUT LEASE IN FLEET MANAGEMENT MARKET, BY TYPE, 2021-2030 (USD THOUSAND)
TABLE 135 MIDDLE EAST AND AFRICA FLEET MANAGEMENT MARKET, BY HARDWARE, 2021-2030 (USD THOUSAND)
TABLE 136 MIDDLE EAST AND AFRICA FLEET MANAGEMENT MARKET, BY FLEET SIZE, 2021-2030 (USD THOUSAND)
TABLE 137 MIDDLE EAST AND AFRICA FLEET MANAGEMENT MARKET, BY COMMUNICATION RANGE, 2021-2030 (USD THOUSAND)
TABLE 138 MIDDLE EAST AND AFRICA FLEET MANAGEMENT MARKET, BY DEPLOYMENT MODEL, 2021-2030 (USD THOUSAND)
TABLE 139 MIDDLE EAST AND AFRICA FLEET MANAGEMENT MARKET, BY TECHNOLOGY, 2021-2030 (USD THOUSAND)
TABLE 140 MIDDLE EAST AND AFRICA FLEET MANAGEMENT MARKET, BY FUNCTIONS, 2021-2030 (USD THOUSAND)
TABLE 141 MIDDLE EAST AND AFRICA FLEET MANAGEMENT MARKET, BY OPERATIONS, 2021-2030 (USD THOUSAND)
TABLE 142 MIDDLE EAST AND AFRICA FLEET MANAGEMENT MARKET, BY BUSINESS TYPE, 2021-2030 (USD THOUSAND)
TABLE 143 MIDDLE EAST AND AFRICA LARGE BUSINESS IN FLEET MANAGEMENT MARKET, BY TYPE, 2021-2030 (USD THOUSAND)
TABLE 144 MIDDLE EAST AND AFRICA SMALL BUSINESS IN FLEET MANAGEMENT MARKET, BY TYPE, 2021-2030 (USD THOUSAND)
TABLE 145 MIDDLE EAST AND AFRICA FLEET MANAGEMENT MARKET, BY VEHICLE TYPE, 2021-2030 (USD THOUSAND)
TABLE 146 MIDDLE EAST AND AFRICA FLEET MANAGEMENT MARKET, BY MODE OF TRANSPORT, 2021-2030 (USD THOUSAND)
TABLE 147 MIDDLE EAST AND AFRICA AUTOMOTIVE IN FLEET MANAGEMENT MARKET, BY TYPE, 2021-2030 (USD THOUSAND)
TABLE 148 MIDDLE EAST AND AFRICA LIGHT DUTY VEHICLE IN FLEET MANAGEMENT MARKET, BY TYPE, 2021-2030 (USD THOUSAND)
TABLE 149 MIDDLE EAST AND AFRICA MEDIUM & HEAVY VEHICLE IN FLEET MANAGEMENT MARKET, BY TYPE, 2021-2030 (USD THOUSAND)
TABLE 150 MIDDLE EAST AND AFRICA FLEET MANAGEMENT MARKET, BY END USER, 2021-2030 (USD THOUSAND)
TABLE 151 MIDDLE EAST AND AFRICA AUTOMOTIVE IN FLEET MANAGEMENT MARKET, BY OFFERING, 2021-2030 (USD THOUSAND)
TABLE 152 MIDDLE EAST AND AFRICA SOLUTIONS IN FLEET MANAGEMENT MARKET, BY TYPE, 2021-2030 (USD THOUSAND)
TABLE 153 MIDDLE EAST AND AFRICA SERVICES IN FLEET MANAGEMENT MARKET, BY TYPE, 2021-2030 (USD THOUSAND)
TABLE 154 MIDDLE EAST AND AFRICA TRANSPORTATION & LOGISTICS IN FLEET MANAGEMENT MARKET, BY OFFERING, 2021-2030 (USD THOUSAND)
TABLE 155 MIDDLE EAST AND AFRICA SOLUTIONS IN FLEET MANAGEMENT MARKET, BY TYPE, 2021-2030 (USD THOUSAND)
TABLE 156 MIDDLE EAST AND AFRICA SERVICES IN FLEET MANAGEMENT MARKET, BY TYPE, 2021-2030 (USD THOUSAND)
TABLE 157 MIDDLE EAST AND AFRICA RETAIL IN FLEET MANAGEMENT MARKET, BY OFFERING, 2021-2030 (USD THOUSAND)
TABLE 158 MIDDLE EAST AND AFRICA SOLUTIONS IN FLEET MANAGEMENT MARKET, BY TYPE, 2021-2030 (USD THOUSAND)
TABLE 159 MIDDLE EAST AND AFRICA SERVICES IN FLEET MANAGEMENT MARKET, BY TYPE, 2021-2030 (USD THOUSAND)
TABLE 160 MIDDLE EAST AND AFRICA MANUFACTURING IN FLEET MANAGEMENT MARKET, BY OFFERING, 2021-2030 (USD THOUSAND)
TABLE 161 MIDDLE EAST AND AFRICA SOLUTIONS IN FLEET MANAGEMENT MARKET, BY TYPE, 2021-2030 (USD THOUSAND)
TABLE 162 MIDDLE EAST AND AFRICA SERVICES IN FLEET MANAGEMENT MARKET, BY TYPE, 2021-2030 (USD THOUSAND)
TABLE 163 MIDDLE EAST AND AFRICA FOOD & BEVERAGES IN FLEET MANAGEMENT MARKET, BY OFFERING, 2021-2030 (USD THOUSAND)
TABLE 164 MIDDLE EAST AND AFRICA SOLUTIONS IN FLEET MANAGEMENT MARKET, BY TYPE, 2021-2030 (USD THOUSAND)
TABLE 165 MIDDLE EAST AND AFRICA SERVICES IN FLEET MANAGEMENT MARKET, BY TYPE, 2021-2030 (USD THOUSAND)
TABLE 166 MIDDLE EAST AND AFRICA ENERGY & UTILITIES IN FLEET MANAGEMENT MARKET, BY OFFERING, 2021-2030 (USD THOUSAND)
TABLE 167 MIDDLE EAST AND AFRICA SOLUTIONS IN FLEET MANAGEMENT MARKET, BY TYPE, 2021-2030 (USD THOUSAND)
TABLE 168 MIDDLE EAST AND AFRICA SERVICES IN FLEET MANAGEMENT MARKET, BY TYPE, 2021-2030 (USD THOUSAND)
TABLE 169 MIDDLE EAST AND AFRICA MINING IN FLEET MANAGEMENT MARKET, BY OFFERING, 2021-2030 (USD THOUSAND)
TABLE 170 MIDDLE EAST AND AFRICA SOLUTIONS IN FLEET MANAGEMENT MARKET, BY TYPE, 2021-2030 (USD THOUSAND)
TABLE 171 MIDDLE EAST AND AFRICA SERVICES IN FLEET MANAGEMENT MARKET, BY TYPE, 2021-2030 (USD THOUSAND)
TABLE 172 MIDDLE EAST AND AFRICA GOVERNMENT IN FLEET MANAGEMENT MARKET, BY OFFERING, 2021-2030 (USD THOUSAND)
TABLE 173 MIDDLE EAST AND AFRICA SOLUTIONS IN FLEET MANAGEMENT MARKET, BY TYPE, 2021-2030 (USD THOUSAND)
TABLE 174 MIDDLE EAST AND AFRICA SERVICES IN FLEET MANAGEMENT MARKET, BY TYPE, 2021-2030 (USD THOUSAND)
TABLE 175 MIDDLE EAST AND AFRICA HEALTHCARE IN FLEET MANAGEMENT MARKET, BY OFFERING, 2021-2030 (USD THOUSAND)
TABLE 176 MIDDLE EAST AND AFRICA SOLUTIONS IN FLEET MANAGEMENT MARKET, BY TYPE, 2021-2030 (USD THOUSAND)
TABLE 177 MIDDLE EAST AND AFRICA SERVICES IN FLEET MANAGEMENT MARKET, BY TYPE, 2021-2030 (USD THOUSAND)
TABLE 178 MIDDLE EAST AND AFRICA AGRICULTURE IN FLEET MANAGEMENT MARKET, BY OFFERING, 2021-2030 (USD THOUSAND)
TABLE 179 MIDDLE EAST AND AFRICA SOLUTIONS IN FLEET MANAGEMENT MARKET, BY TYPE, 2021-2030 (USD THOUSAND)
TABLE 180 MIDDLE EAST AND AFRICA SERVICES IN FLEET MANAGEMENT MARKET, BY TYPE, 2021-2030 (USD THOUSAND)
TABLE 181 MIDDLE EAST AND AFRICA CONSTRUCTION IN FLEET MANAGEMENT MARKET, BY OFFERING, 2021-2030 (USD THOUSAND)
TABLE 182 MIDDLE EAST AND AFRICA SOLUTIONS IN FLEET MANAGEMENT MARKET, BY TYPE, 2021-2030 (USD THOUSAND)
TABLE 183 MIDDLE EAST AND AFRICA SERVICES IN FLEET MANAGEMENT MARKET, BY TYPE, 2021-2030 (USD THOUSAND)
TABLE 184 SAUDI ARABIA FLEET MANAGEMENT MARKET, BY OFFERING, 2021-2030 (USD THOUSAND)
TABLE 185 SAUDI ARABIA SOLUTIONS IN FLEET MANAGEMENT MARKET, BY TYPE, 2021-2030 (USD THOUSAND)
TABLE 186 SAUDI ARABIA ETA PREDICTIONS IN FLEET MANAGEMENT MARKET, BY TYPE, 2021-2030 (USD THOUSAND)
TABLE 187 SAUDI ARABIA OPERATIONS MANAGEMENT IN FLEET MANAGEMENT MARKET, BY TYPE, 2021-2030 (USD THOUSAND)
TABLE 188 SAUDI ARABIA PERFORMANCE MANAGEMENT IN FLEET MANAGEMENT MARKET, BY TYPE, 2021-2030 (USD THOUSAND)
TABLE 189 SAUDI ARABIA DRIVER MANAGEMENT IN FLEET MANAGEMENT MARKET, BY TYPE, 2021-2030 (USD THOUSAND)
TABLE 190 SAUDI ARABIA FLEET MANAGEMENT & TRACKING IN FLEET MANAGEMENT MARKET, BY TYPE, 2021-2030 (USD THOUSAND)
TABLE 191 SAUDI ARABIA CONTRACT MANAGEMENT IN FLEET MANAGEMENT MARKET, BY STRUCTURE, 2021-2030 (USD THOUSAND)
TABLE 192 SAUDI ARABIA CONTRACT MANAGEMENT IN FLEET MANAGEMENT MARKET, BY MODEL, 2021-2030 (USD THOUSAND)
TABLE 193 SAUDI ARABIA SERVICES IN FLEET MANAGEMENT MARKET, BY TYPE, 2021-2030 (USD THOUSAND)
TABLE 194 SAUDI ARABIA PROFESSIONAL SERVICES IN FLEET MANAGEMENT MARKET, BY TYPE, 2021-2030 (USD THOUSAND)
TABLE 195 SAUDI ARABIA FLEET MANAGEMENT MARKET, BY LEASE TYPE, 2021-2030 (USD THOUSAND)
TABLE 196 SAUDI ARABIA WITHOUT LEASE IN FLEET MANAGEMENT MARKET, BY TYPE, 2021-2030 (USD THOUSAND)
TABLE 197 SAUDI ARABIA FLEET MANAGEMENT MARKET, BY HARDWARE, 2021-2030 (USD THOUSAND)
TABLE 198 SAUDI ARABIA FLEET MANAGEMENT MARKET, BY FLEET SIZE, 2021-2030 (USD THOUSAND)
TABLE 199 SAUDI ARABIA FLEET MANAGEMENT MARKET, BY COMMUNICATION RANGE, 2021-2030 (USD THOUSAND)
TABLE 200 SAUDI ARABIA FLEET MANAGEMENT MARKET, BY DEPLOYMENT MODEL, 2021-2030 (USD THOUSAND)
TABLE 201 SAUDI ARABIA FLEET MANAGEMENT MARKET, BY TECHNOLOGY, 2021-2030 (USD THOUSAND)
TABLE 202 SAUDI ARABIA FLEET MANAGEMENT MARKET, BY FUNCTIONS, 2021-2030 (USD THOUSAND)
TABLE 203 SAUDI ARABIA FLEET MANAGEMENT MARKET, BY OPERATIONS, 2021-2030 (USD THOUSAND)
TABLE 204 SAUDI ARABIA FLEET MANAGEMENT MARKET, BY BUSINESS TYPE, 2021-2030 (USD THOUSAND)
TABLE 205 SAUDI ARABIA LARGE BUSINESS IN FLEET MANAGEMENT MARKET, BY TYPE, 2021-2030 (USD THOUSAND)
TABLE 206 SAUDI ARABIA SMALL BUSINESS IN FLEET MANAGEMENT MARKET, BY TYPE, 2021-2030 (USD THOUSAND)
TABLE 207 SAUDI ARABIA FLEET MANAGEMENT MARKET, BY VEHICLE TYPE, 2021-2030 (USD THOUSAND)
TABLE 208 SAUDI ARABIA FLEET MANAGEMENT MARKET, BY MODE OF TRANSPORT, 2021-2030 (USD THOUSAND)
TABLE 209 SAUDI ARABIA AUTOMOTIVE IN FLEET MANAGEMENT MARKET, BY TYPE, 2021-2030 (USD THOUSAND)
TABLE 210 SAUDI ARABIA LIGHT DUTY VEHICLE IN FLEET MANAGEMENT MARKET, BY TYPE, 2021-2030 (USD THOUSAND)
TABLE 211 SAUDI ARABIA MEDIUM & HEAVY VEHICLE IN FLEET MANAGEMENT MARKET, BY TYPE, 2021-2030 (USD THOUSAND)
TABLE 212 SAUDI ARABIA FLEET MANAGEMENT MARKET, BY END USER, 2021-2030 (USD THOUSAND)
TABLE 213 SAUDI ARABIA AUTOMOTIVE IN FLEET MANAGEMENT MARKET, BY OFFERING, 2021-2030 (USD THOUSAND)
TABLE 214 SAUDI ARABIA SOLUTIONS IN FLEET MANAGEMENT MARKET, BY TYPE, 2021-2030 (USD THOUSAND)
TABLE 215 SAUDI ARABIA SERVICES IN FLEET MANAGEMENT MARKET, BY TYPE, 2021-2030 (USD THOUSAND)
TABLE 216 SAUDI ARABIA TRANSPORTATION & LOGISTICS IN FLEET MANAGEMENT MARKET, BY OFFERING, 2021-2030 (USD THOUSAND)
TABLE 217 SAUDI ARABIA SOLUTIONS IN FLEET MANAGEMENT MARKET, BY TYPE, 2021-2030 (USD THOUSAND)
TABLE 218 SAUDI ARABIA SERVICES IN FLEET MANAGEMENT MARKET, BY TYPE, 2021-2030 (USD THOUSAND)
TABLE 219 SAUDI ARABIA RETAIL IN FLEET MANAGEMENT MARKET, BY OFFERING, 2021-2030 (USD THOUSAND)
TABLE 220 SAUDI ARABIA SOLUTIONS IN FLEET MANAGEMENT MARKET, BY TYPE, 2021-2030 (USD THOUSAND)
TABLE 221 SAUDI ARABIA SERVICES IN FLEET MANAGEMENT MARKET, BY TYPE, 2021-2030 (USD THOUSAND)
TABLE 222 SAUDI ARABIA MANUFACTURING IN FLEET MANAGEMENT MARKET, BY OFFERING, 2021-2030 (USD THOUSAND)
TABLE 223 SAUDI ARABIA SOLUTIONS IN FLEET MANAGEMENT MARKET, BY TYPE, 2021-2030 (USD THOUSAND)
TABLE 224 SAUDI ARABIA SERVICES IN FLEET MANAGEMENT MARKET, BY TYPE, 2021-2030 (USD THOUSAND)
TABLE 225 SAUDI ARABIA FOOD & BEVERAGES IN FLEET MANAGEMENT MARKET, BY OFFERING, 2021-2030 (USD THOUSAND)
TABLE 226 SAUDI ARABIA SOLUTIONS IN FLEET MANAGEMENT MARKET, BY TYPE, 2021-2030 (USD THOUSAND)
TABLE 227 SAUDI ARABIA SERVICES IN FLEET MANAGEMENT MARKET, BY TYPE, 2021-2030 (USD THOUSAND)
TABLE 228 SAUDI ARABIA ENERGY & UTILITIES IN FLEET MANAGEMENT MARKET, BY OFFERING, 2021-2030 (USD THOUSAND)
TABLE 229 SAUDI ARABIA SOLUTIONS IN FLEET MANAGEMENT MARKET, BY TYPE, 2021-2030 (USD THOUSAND)
TABLE 230 SAUDI ARABIA SERVICES IN FLEET MANAGEMENT MARKET, BY TYPE, 2021-2030 (USD THOUSAND)
TABLE 231 SAUDI ARABIA MINING IN FLEET MANAGEMENT MARKET, BY OFFERING, 2021-2030 (USD THOUSAND)
TABLE 232 SAUDI ARABIA SOLUTIONS IN FLEET MANAGEMENT MARKET, BY TYPE, 2021-2030 (USD THOUSAND)
TABLE 233 SAUDI ARABIA SERVICES IN FLEET MANAGEMENT MARKET, BY TYPE, 2021-2030 (USD THOUSAND)
TABLE 234 SAUDI ARABIA GOVERNMENT IN FLEET MANAGEMENT MARKET, BY OFFERING, 2021-2030 (USD THOUSAND)
TABLE 235 SAUDI ARABIA SOLUTIONS IN FLEET MANAGEMENT MARKET, BY TYPE, 2021-2030 (USD THOUSAND)
TABLE 236 SAUDI ARABIA SERVICES IN FLEET MANAGEMENT MARKET, BY TYPE, 2021-2030 (USD THOUSAND)
TABLE 237 SAUDI ARABIA HEALTHCARE IN FLEET MANAGEMENT MARKET, BY OFFERING, 2021-2030 (USD THOUSAND)
TABLE 238 SAUDI ARABIA SOLUTIONS IN FLEET MANAGEMENT MARKET, BY TYPE, 2021-2030 (USD THOUSAND)
TABLE 239 SAUDI ARABIA SERVICES IN FLEET MANAGEMENT MARKET, BY TYPE, 2021-2030 (USD THOUSAND)
TABLE 240 SAUDI ARABIA AGRICULTURE IN FLEET MANAGEMENT MARKET, BY OFFERING, 2021-2030 (USD THOUSAND)
TABLE 241 SAUDI ARABIA SOLUTIONS IN FLEET MANAGEMENT MARKET, BY TYPE, 2021-2030 (USD THOUSAND)
TABLE 242 SAUDI ARABIA SERVICES IN FLEET MANAGEMENT MARKET, BY TYPE, 2021-2030 (USD THOUSAND)
TABLE 243 SAUDI ARABIA CONSTRUCTION IN FLEET MANAGEMENT MARKET, BY OFFERING, 2021-2030 (USD THOUSAND)
TABLE 244 SAUDI ARABIA SOLUTIONS IN FLEET MANAGEMENT MARKET, BY TYPE, 2021-2030 (USD THOUSAND)
TABLE 245 SAUDI ARABIA SERVICES IN FLEET MANAGEMENT MARKET, BY TYPE, 2021-2030 (USD THOUSAND)
TABLE 246 SOUTH AFRICA FLEET MANAGEMENT MARKET, BY OFFERING, 2021-2030 (USD THOUSAND)
TABLE 247 SOUTH AFRICA SOLUTIONS IN FLEET MANAGEMENT MARKET, BY TYPE, 2021-2030 (USD THOUSAND)
TABLE 248 SOUTH AFRICA ETA PREDICTIONS IN FLEET MANAGEMENT MARKET, BY TYPE, 2021-2030 (USD THOUSAND)
TABLE 249 SOUTH AFRICA OPERATIONS MANAGEMENT IN FLEET MANAGEMENT MARKET, BY TYPE, 2021-2030 (USD THOUSAND)
TABLE 250 SOUTH AFRICA PERFORMANCE MANAGEMENT IN FLEET MANAGEMENT MARKET, BY TYPE, 2021-2030 (USD THOUSAND)
TABLE 251 SOUTH AFRICA DRIVER MANAGEMENT IN FLEET MANAGEMENT MARKET, BY TYPE, 2021-2030 (USD THOUSAND)
TABLE 252 SOUTH AFRICA FLEET MANAGEMENT & TRACKING IN FLEET MANAGEMENT MARKET, BY TYPE, 2021-2030 (USD THOUSAND)
TABLE 253 SOUTH AFRICA CONTRACT MANAGEMENT IN FLEET MANAGEMENT MARKET, BY STRUCTURE, 2021-2030 (USD THOUSAND)
TABLE 254 SOUTH AFRICA CONTRACT MANAGEMENT IN FLEET MANAGEMENT MARKET, BY MODEL, 2021-2030 (USD THOUSAND)
TABLE 255 SOUTH AFRICA SERVICES IN FLEET MANAGEMENT MARKET, BY TYPE, 2021-2030 (USD THOUSAND)
TABLE 256 SOUTH AFRICA PROFESSIONAL SERVICES IN FLEET MANAGEMENT MARKET, BY TYPE, 2021-2030 (USD THOUSAND)
TABLE 257 SOUTH AFRICA FLEET MANAGEMENT MARKET, BY LEASE TYPE, 2021-2030 (USD THOUSAND)
TABLE 258 SOUTH AFRICA WITHOUT LEASE IN FLEET MANAGEMENT MARKET, BY TYPE, 2021-2030 (USD THOUSAND)
TABLE 259 SOUTH AFRICA FLEET MANAGEMENT MARKET, BY HARDWARE, 2021-2030 (USD THOUSAND)
TABLE 260 SOUTH AFRICA FLEET MANAGEMENT MARKET, BY FLEET SIZE, 2021-2030 (USD THOUSAND)
TABLE 261 SOUTH AFRICA FLEET MANAGEMENT MARKET, BY COMMUNICATION RANGE, 2021-2030 (USD THOUSAND)
TABLE 262 SOUTH AFRICA FLEET MANAGEMENT MARKET, BY DEPLOYMENT MODEL, 2021-2030 (USD THOUSAND)
TABLE 263 SOUTH AFRICA FLEET MANAGEMENT MARKET, BY TECHNOLOGY, 2021-2030 (USD THOUSAND)
TABLE 264 SOUTH AFRICA FLEET MANAGEMENT MARKET, BY FUNCTIONS, 2021-2030 (USD THOUSAND)
TABLE 265 SOUTH AFRICA FLEET MANAGEMENT MARKET, BY OPERATIONS, 2021-2030 (USD THOUSAND)
TABLE 266 SOUTH AFRICA FLEET MANAGEMENT MARKET, BY BUSINESS TYPE, 2021-2030 (USD THOUSAND)
TABLE 267 SOUTH AFRICA LARGE BUSINESS IN FLEET MANAGEMENT MARKET, BY TYPE, 2021-2030 (USD THOUSAND)
TABLE 268 SOUTH AFRICA SMALL BUSINESS IN FLEET MANAGEMENT MARKET, BY TYPE, 2021-2030 (USD THOUSAND)
TABLE 269 SOUTH AFRICA FLEET MANAGEMENT MARKET, BY VEHICLE TYPE, 2021-2030 (USD THOUSAND)
TABLE 270 SOUTH AFRICA FLEET MANAGEMENT MARKET, BY MODE OF TRANSPORT, 2021-2030 (USD THOUSAND)
TABLE 271 SOUTH AFRICA AUTOMOTIVE IN FLEET MANAGEMENT MARKET, BY TYPE, 2021-2030 (USD THOUSAND)
TABLE 272 SOUTH AFRICA LIGHT DUTY VEHICLE IN FLEET MANAGEMENT MARKET, BY TYPE, 2021-2030 (USD THOUSAND)
TABLE 273 SOUTH AFRICA MEDIUM & HEAVY VEHICLE IN FLEET MANAGEMENT MARKET, BY TYPE, 2021-2030 (USD THOUSAND)
TABLE 274 SOUTH AFRICA FLEET MANAGEMENT MARKET, BY END USER, 2021-2030 (USD THOUSAND)
TABLE 275 SOUTH AFRICA AUTOMOTIVE IN FLEET MANAGEMENT MARKET, BY OFFERING, 2021-2030 (USD THOUSAND)
TABLE 276 SOUTH AFRICA SOLUTIONS IN FLEET MANAGEMENT MARKET, BY TYPE, 2021-2030 (USD THOUSAND)
TABLE 277 SOUTH AFRICA SERVICES IN FLEET MANAGEMENT MARKET, BY TYPE, 2021-2030 (USD THOUSAND)
TABLE 278 SOUTH AFRICA TRANSPORTATION & LOGISTICS IN FLEET MANAGEMENT MARKET, BY OFFERING, 2021-2030 (USD THOUSAND)
TABLE 279 SOUTH AFRICA SOLUTIONS IN FLEET MANAGEMENT MARKET, BY TYPE, 2021-2030 (USD THOUSAND)
TABLE 280 SOUTH AFRICA SERVICES IN FLEET MANAGEMENT MARKET, BY TYPE, 2021-2030 (USD THOUSAND)
TABLE 281 SOUTH AFRICA RETAIL IN FLEET MANAGEMENT MARKET, BY OFFERING, 2021-2030 (USD THOUSAND)
TABLE 282 SOUTH AFRICA SOLUTIONS IN FLEET MANAGEMENT MARKET, BY TYPE, 2021-2030 (USD THOUSAND)
TABLE 283 SOUTH AFRICA SERVICES IN FLEET MANAGEMENT MARKET, BY TYPE, 2021-2030 (USD THOUSAND)
TABLE 284 SOUTH AFRICA MANUFACTURING IN FLEET MANAGEMENT MARKET, BY OFFERING, 2021-2030 (USD THOUSAND)
TABLE 285 SOUTH AFRICA SOLUTIONS IN FLEET MANAGEMENT MARKET, BY TYPE, 2021-2030 (USD THOUSAND)
TABLE 286 SOUTH AFRICA SERVICES IN FLEET MANAGEMENT MARKET, BY TYPE, 2021-2030 (USD THOUSAND)
TABLE 287 SOUTH AFRICA FOOD & BEVERAGES IN FLEET MANAGEMENT MARKET, BY OFFERING, 2021-2030 (USD THOUSAND)
TABLE 288 SOUTH AFRICA SOLUTIONS IN FLEET MANAGEMENT MARKET, BY TYPE, 2021-2030 (USD THOUSAND)
TABLE 289 SOUTH AFRICA SERVICES IN FLEET MANAGEMENT MARKET, BY TYPE, 2021-2030 (USD THOUSAND)
TABLE 290 SOUTH AFRICA ENERGY & UTILITIES IN FLEET MANAGEMENT MARKET, BY OFFERING, 2021-2030 (USD THOUSAND)
TABLE 291 SOUTH AFRICA SOLUTIONS IN FLEET MANAGEMENT MARKET, BY TYPE, 2021-2030 (USD THOUSAND)
TABLE 292 SOUTH AFRICA SERVICES IN FLEET MANAGEMENT MARKET, BY TYPE, 2021-2030 (USD THOUSAND)
TABLE 293 SOUTH AFRICA MINING IN FLEET MANAGEMENT MARKET, BY OFFERING, 2021-2030 (USD THOUSAND)
TABLE 294 SOUTH AFRICA SOLUTIONS IN FLEET MANAGEMENT MARKET, BY TYPE, 2021-2030 (USD THOUSAND)
TABLE 295 SOUTH AFRICA SERVICES IN FLEET MANAGEMENT MARKET, BY TYPE, 2021-2030 (USD THOUSAND)
TABLE 296 SOUTH AFRICA GOVERNMENT IN FLEET MANAGEMENT MARKET, BY OFFERING, 2021-2030 (USD THOUSAND)
TABLE 297 SOUTH AFRICA SOLUTIONS IN FLEET MANAGEMENT MARKET, BY TYPE, 2021-2030 (USD THOUSAND)
TABLE 298 SOUTH AFRICA SERVICES IN FLEET MANAGEMENT MARKET, BY TYPE, 2021-2030 (USD THOUSAND)
TABLE 299 SOUTH AFRICA HEALTHCARE IN FLEET MANAGEMENT MARKET, BY OFFERING, 2021-2030 (USD THOUSAND)
TABLE 300 SOUTH AFRICA SOLUTIONS IN FLEET MANAGEMENT MARKET, BY TYPE, 2021-2030 (USD THOUSAND)
TABLE 301 SOUTH AFRICA SERVICES IN FLEET MANAGEMENT MARKET, BY TYPE, 2021-2030 (USD THOUSAND)
TABLE 302 SOUTH AFRICA AGRICULTURE IN FLEET MANAGEMENT MARKET, BY OFFERING, 2021-2030 (USD THOUSAND)
TABLE 303 SOUTH AFRICA SOLUTIONS IN FLEET MANAGEMENT MARKET, BY TYPE, 2021-2030 (USD THOUSAND)
TABLE 304 SOUTH AFRICA SERVICES IN FLEET MANAGEMENT MARKET, BY TYPE, 2021-2030 (USD THOUSAND)
TABLE 305 SOUTH AFRICA CONSTRUCTION IN FLEET MANAGEMENT MARKET, BY OFFERING, 2021-2030 (USD THOUSAND)
TABLE 306 SOUTH AFRICA SOLUTIONS IN FLEET MANAGEMENT MARKET, BY TYPE, 2021-2030 (USD THOUSAND)
TABLE 307 SOUTH AFRICA SERVICES IN FLEET MANAGEMENT MARKET, BY TYPE, 2021-2030 (USD THOUSAND)
TABLE 308 EGYPT FLEET MANAGEMENT MARKET, BY OFFERING, 2021-2030 (USD THOUSAND)
TABLE 309 EGYPT SOLUTIONS IN FLEET MANAGEMENT MARKET, BY TYPE, 2021-2030 (USD THOUSAND)
TABLE 310 EGYPT ETA PREDICTIONS IN FLEET MANAGEMENT MARKET, BY TYPE, 2021-2030 (USD THOUSAND)
TABLE 311 EGYPT OPERATIONS MANAGEMENT IN FLEET MANAGEMENT MARKET, BY TYPE, 2021-2030 (USD THOUSAND)
TABLE 312 EGYPT PERFORMANCE MANAGEMENT IN FLEET MANAGEMENT MARKET, BY TYPE, 2021-2030 (USD THOUSAND)
TABLE 313 EGYPT DRIVER MANAGEMENT IN FLEET MANAGEMENT MARKET, BY TYPE, 2021-2030 (USD THOUSAND)
TABLE 314 EGYPT FLEET MANAGEMENT & TRACKING IN FLEET MANAGEMENT MARKET, BY TYPE, 2021-2030 (USD THOUSAND)
TABLE 315 EGYPT CONTRACT MANAGEMENT IN FLEET MANAGEMENT MARKET, BY STRUCTURE, 2021-2030 (USD THOUSAND)
TABLE 316 EGYPT CONTRACT MANAGEMENT IN FLEET MANAGEMENT MARKET, BY MODEL, 2021-2030 (USD THOUSAND)
TABLE 317 EGYPT SERVICES IN FLEET MANAGEMENT MARKET, BY TYPE, 2021-2030 (USD THOUSAND)
TABLE 318 EGYPT PROFESSIONAL SERVICES IN FLEET MANAGEMENT MARKET, BY TYPE, 2021-2030 (USD THOUSAND)
TABLE 319 EGYPT FLEET MANAGEMENT MARKET, BY LEASE TYPE, 2021-2030 (USD THOUSAND)
TABLE 320 EGYPT WITHOUT LEASE IN FLEET MANAGEMENT MARKET, BY TYPE, 2021-2030 (USD THOUSAND)
TABLE 321 EGYPT FLEET MANAGEMENT MARKET, BY HARDWARE, 2021-2030 (USD THOUSAND)
TABLE 322 EGYPT FLEET MANAGEMENT MARKET, BY FLEET SIZE, 2021-2030 (USD THOUSAND)
TABLE 323 EGYPT FLEET MANAGEMENT MARKET, BY COMMUNICATION RANGE, 2021-2030 (USD THOUSAND)
TABLE 324 EGYPT FLEET MANAGEMENT MARKET, BY DEPLOYMENT MODEL, 2021-2030 (USD THOUSAND)
TABLE 325 EGYPT FLEET MANAGEMENT MARKET, BY TECHNOLOGY, 2021-2030 (USD THOUSAND)
TABLE 326 EGYPT FLEET MANAGEMENT MARKET, BY FUNCTIONS, 2021-2030 (USD THOUSAND)
TABLE 327 EGYPT FLEET MANAGEMENT MARKET, BY OPERATIONS, 2021-2030 (USD THOUSAND)
TABLE 328 EGYPT FLEET MANAGEMENT MARKET, BY BUSINESS TYPE, 2021-2030 (USD THOUSAND)
TABLE 329 EGYPT LARGE BUSINESS IN FLEET MANAGEMENT MARKET, BY TYPE, 2021-2030 (USD THOUSAND)
TABLE 330 EGYPT SMALL BUSINESS IN FLEET MANAGEMENT MARKET, BY TYPE, 2021-2030 (USD THOUSAND)
TABLE 331 EGYPT FLEET MANAGEMENT MARKET, BY VEHICLE TYPE, 2021-2030 (USD THOUSAND)
TABLE 332 EGYPT FLEET MANAGEMENT MARKET, BY MODE OF TRANSPORT, 2021-2030 (USD THOUSAND)
TABLE 333 EGYPT AUTOMOTIVE IN FLEET MANAGEMENT MARKET, BY TYPE, 2021-2030 (USD THOUSAND)
TABLE 334 EGYPT LIGHT DUTY VEHICLE IN FLEET MANAGEMENT MARKET, BY TYPE, 2021-2030 (USD THOUSAND)
TABLE 335 EGYPT MEDIUM & HEAVY VEHICLE IN FLEET MANAGEMENT MARKET, BY TYPE, 2021-2030 (USD THOUSAND)
TABLE 336 EGYPT FLEET MANAGEMENT MARKET, BY END USER, 2021-2030 (USD THOUSAND)
TABLE 337 EGYPT AUTOMOTIVE IN FLEET MANAGEMENT MARKET, BY OFFERING, 2021-2030 (USD THOUSAND)
TABLE 338 EGYPT SOLUTIONS IN FLEET MANAGEMENT MARKET, BY TYPE, 2021-2030 (USD THOUSAND)
TABLE 339 EGYPT SERVICES IN FLEET MANAGEMENT MARKET, BY TYPE, 2021-2030 (USD THOUSAND)
TABLE 340 EGYPT TRANSPORTATION & LOGISTICS IN FLEET MANAGEMENT MARKET, BY OFFERING, 2021-2030 (USD THOUSAND)
TABLE 341 EGYPT SOLUTIONS IN FLEET MANAGEMENT MARKET, BY TYPE, 2021-2030 (USD THOUSAND)
TABLE 342 EGYPT SERVICES IN FLEET MANAGEMENT MARKET, BY TYPE, 2021-2030 (USD THOUSAND)
TABLE 343 EGYPT RETAIL IN FLEET MANAGEMENT MARKET, BY OFFERING, 2021-2030 (USD THOUSAND)
TABLE 344 EGYPT SOLUTIONS IN FLEET MANAGEMENT MARKET, BY TYPE, 2021-2030 (USD THOUSAND)
TABLE 345 EGYPT SERVICES IN FLEET MANAGEMENT MARKET, BY TYPE, 2021-2030 (USD THOUSAND)
TABLE 346 EGYPT MANUFACTURING IN FLEET MANAGEMENT MARKET, BY OFFERING, 2021-2030 (USD THOUSAND)
TABLE 347 EGYPT SOLUTIONS IN FLEET MANAGEMENT MARKET, BY TYPE, 2021-2030 (USD THOUSAND)
TABLE 348 EGYPT SERVICES IN FLEET MANAGEMENT MARKET, BY TYPE, 2021-2030 (USD THOUSAND)
TABLE 349 EGYPT FOOD & BEVERAGES IN FLEET MANAGEMENT MARKET, BY OFFERING, 2021-2030 (USD THOUSAND)
TABLE 350 EGYPT SOLUTIONS IN FLEET MANAGEMENT MARKET, BY TYPE, 2021-2030 (USD THOUSAND)
TABLE 351 EGYPT SERVICES IN FLEET MANAGEMENT MARKET, BY TYPE, 2021-2030 (USD THOUSAND)
TABLE 352 EGYPT ENERGY & UTILITIES IN FLEET MANAGEMENT MARKET, BY OFFERING, 2021-2030 (USD THOUSAND)
TABLE 353 EGYPT SOLUTIONS IN FLEET MANAGEMENT MARKET, BY TYPE, 2021-2030 (USD THOUSAND)
TABLE 354 EGYPT SERVICES IN FLEET MANAGEMENT MARKET, BY TYPE, 2021-2030 (USD THOUSAND)
TABLE 355 EGYPT MINING IN FLEET MANAGEMENT MARKET, BY OFFERING, 2021-2030 (USD THOUSAND)
TABLE 356 EGYPT SOLUTIONS IN FLEET MANAGEMENT MARKET, BY TYPE, 2021-2030 (USD THOUSAND)
TABLE 357 EGYPT SERVICES IN FLEET MANAGEMENT MARKET, BY TYPE, 2021-2030 (USD THOUSAND)
TABLE 358 EGYPT GOVERNMENT IN FLEET MANAGEMENT MARKET, BY OFFERING, 2021-2030 (USD THOUSAND)
TABLE 359 EGYPT SOLUTIONS IN FLEET MANAGEMENT MARKET, BY TYPE, 2021-2030 (USD THOUSAND)
TABLE 360 EGYPT SERVICES IN FLEET MANAGEMENT MARKET, BY TYPE, 2021-2030 (USD THOUSAND)
TABLE 361 EGYPT HEALTHCARE IN FLEET MANAGEMENT MARKET, BY OFFERING, 2021-2030 (USD THOUSAND)
TABLE 362 EGYPT SOLUTIONS IN FLEET MANAGEMENT MARKET, BY TYPE, 2021-2030 (USD THOUSAND)
TABLE 363 EGYPT SERVICES IN FLEET MANAGEMENT MARKET, BY TYPE, 2021-2030 (USD THOUSAND)
TABLE 364 EGYPT AGRICULTURE IN FLEET MANAGEMENT MARKET, BY OFFERING, 2021-2030 (USD THOUSAND)
TABLE 365 EGYPT SOLUTIONS IN FLEET MANAGEMENT MARKET, BY TYPE, 2021-2030 (USD THOUSAND)
TABLE 366 EGYPT SERVICES IN FLEET MANAGEMENT MARKET, BY TYPE, 2021-2030 (USD THOUSAND)
TABLE 367 EGYPT CONSTRUCTION IN FLEET MANAGEMENT MARKET, BY OFFERING, 2021-2030 (USD THOUSAND)
TABLE 368 EGYPT SOLUTIONS IN FLEET MANAGEMENT MARKET, BY TYPE, 2021-2030 (USD THOUSAND)
TABLE 369 EGYPT SERVICES IN FLEET MANAGEMENT MARKET, BY TYPE, 2021-2030 (USD THOUSAND)
TABLE 370 ISRAEL FLEET MANAGEMENT MARKET, BY OFFERING, 2021-2030 (USD THOUSAND)
TABLE 371 ISRAEL SOLUTIONS IN FLEET MANAGEMENT MARKET, BY TYPE, 2021-2030 (USD THOUSAND)
TABLE 372 ISRAEL ETA PREDICTIONS IN FLEET MANAGEMENT MARKET, BY TYPE, 2021-2030 (USD THOUSAND)
TABLE 373 ISRAEL OPERATIONS MANAGEMENT IN FLEET MANAGEMENT MARKET, BY TYPE, 2021-2030 (USD THOUSAND)
TABLE 374 ISRAEL PERFORMANCE MANAGEMENT IN FLEET MANAGEMENT MARKET, BY TYPE, 2021-2030 (USD THOUSAND)
TABLE 375 ISRAEL DRIVER MANAGEMENT IN FLEET MANAGEMENT MARKET, BY TYPE, 2021-2030 (USD THOUSAND)
TABLE 376 ISRAEL FLEET MANAGEMENT & TRACKING IN FLEET MANAGEMENT MARKET, BY TYPE, 2021-2030 (USD THOUSAND)
TABLE 377 ISRAEL CONTRACT MANAGEMENT IN FLEET MANAGEMENT MARKET, BY STRUCTURE, 2021-2030 (USD THOUSAND)
TABLE 378 ISRAEL CONTRACT MANAGEMENT IN FLEET MANAGEMENT MARKET, BY MODEL, 2021-2030 (USD THOUSAND)
TABLE 379 ISRAEL SERVICES IN FLEET MANAGEMENT MARKET, BY TYPE, 2021-2030 (USD THOUSAND)
TABLE 380 ISRAEL PROFESSIONAL SERVICES IN FLEET MANAGEMENT MARKET, BY TYPE, 2021-2030 (USD THOUSAND)
TABLE 381 ISRAEL FLEET MANAGEMENT MARKET, BY LEASE TYPE, 2021-2030 (USD THOUSAND)
TABLE 382 ISRAEL WITHOUT LEASE IN FLEET MANAGEMENT MARKET, BY TYPE, 2021-2030 (USD THOUSAND)
TABLE 383 ISRAEL FLEET MANAGEMENT MARKET, BY HARDWARE, 2021-2030 (USD THOUSAND)
TABLE 384 ISRAEL FLEET MANAGEMENT MARKET, BY FLEET SIZE, 2021-2030 (USD THOUSAND)
TABLE 385 ISRAEL FLEET MANAGEMENT MARKET, BY COMMUNICATION RANGE, 2021-2030 (USD THOUSAND)
TABLE 386 ISRAEL FLEET MANAGEMENT MARKET, BY DEPLOYMENT MODEL, 2021-2030 (USD THOUSAND)
TABLE 387 ISRAEL FLEET MANAGEMENT MARKET, BY TECHNOLOGY, 2021-2030 (USD THOUSAND)
TABLE 388 ISRAEL FLEET MANAGEMENT MARKET, BY FUNCTIONS, 2021-2030 (USD THOUSAND)
TABLE 389 ISRAEL FLEET MANAGEMENT MARKET, BY OPERATIONS, 2021-2030 (USD THOUSAND)
TABLE 390 ISRAEL FLEET MANAGEMENT MARKET, BY BUSINESS TYPE, 2021-2030 (USD THOUSAND)
TABLE 391 ISRAEL LARGE BUSINESS IN FLEET MANAGEMENT MARKET, BY TYPE, 2021-2030 (USD THOUSAND)
TABLE 392 ISRAEL SMALL BUSINESS IN FLEET MANAGEMENT MARKET, BY TYPE, 2021-2030 (USD THOUSAND)
TABLE 393 ISRAEL FLEET MANAGEMENT MARKET, BY VEHICLE TYPE, 2021-2030 (USD THOUSAND)
TABLE 394 ISRAEL FLEET MANAGEMENT MARKET, BY MODE OF TRANSPORT, 2021-2030 (USD THOUSAND)
TABLE 395 ISRAEL AUTOMOTIVE IN FLEET MANAGEMENT MARKET, BY TYPE, 2021-2030 (USD THOUSAND)
TABLE 396 ISRAEL LIGHT DUTY VEHICLE IN FLEET MANAGEMENT MARKET, BY TYPE, 2021-2030 (USD THOUSAND)
TABLE 397 ISRAEL MEDIUM & HEAVY VEHICLE IN FLEET MANAGEMENT MARKET, BY TYPE, 2021-2030 (USD THOUSAND)
TABLE 398 ISRAEL FLEET MANAGEMENT MARKET, BY END USER, 2021-2030 (USD THOUSAND)
TABLE 399 ISRAEL AUTOMOTIVE IN FLEET MANAGEMENT MARKET, BY OFFERING, 2021-2030 (USD THOUSAND)
TABLE 400 ISRAEL SOLUTIONS IN FLEET MANAGEMENT MARKET, BY TYPE, 2021-2030 (USD THOUSAND)
TABLE 401 ISRAEL SERVICES IN FLEET MANAGEMENT MARKET, BY TYPE, 2021-2030 (USD THOUSAND)
TABLE 402 ISRAEL TRANSPORTATION & LOGISTICS IN FLEET MANAGEMENT MARKET, BY OFFERING, 2021-2030 (USD THOUSAND)
TABLE 403 ISRAEL SOLUTIONS IN FLEET MANAGEMENT MARKET, BY TYPE, 2021-2030 (USD THOUSAND)
TABLE 404 ISRAEL SERVICES IN FLEET MANAGEMENT MARKET, BY TYPE, 2021-2030 (USD THOUSAND)
TABLE 405 ISRAEL RETAIL IN FLEET MANAGEMENT MARKET, BY OFFERING, 2021-2030 (USD THOUSAND)
TABLE 406 ISRAEL SOLUTIONS IN FLEET MANAGEMENT MARKET, BY TYPE, 2021-2030 (USD THOUSAND)
TABLE 407 ISRAEL SERVICES IN FLEET MANAGEMENT MARKET, BY TYPE, 2021-2030 (USD THOUSAND)
TABLE 408 ISRAEL MANUFACTURING IN FLEET MANAGEMENT MARKET, BY OFFERING, 2021-2030 (USD THOUSAND)
TABLE 409 ISRAEL SOLUTIONS IN FLEET MANAGEMENT MARKET, BY TYPE, 2021-2030 (USD THOUSAND)
TABLE 410 ISRAEL SERVICES IN FLEET MANAGEMENT MARKET, BY TYPE, 2021-2030 (USD THOUSAND)
TABLE 411 ISRAEL FOOD & BEVERAGES IN FLEET MANAGEMENT MARKET, BY OFFERING, 2021-2030 (USD THOUSAND)
TABLE 412 ISRAEL SOLUTIONS IN FLEET MANAGEMENT MARKET, BY TYPE, 2021-2030 (USD THOUSAND)
TABLE 413 ISRAEL SERVICES IN FLEET MANAGEMENT MARKET, BY TYPE, 2021-2030 (USD THOUSAND)
TABLE 414 ISRAEL ENERGY & UTILITIES IN FLEET MANAGEMENT MARKET, BY OFFERING, 2021-2030 (USD THOUSAND)
TABLE 415 ISRAEL SOLUTIONS IN FLEET MANAGEMENT MARKET, BY TYPE, 2021-2030 (USD THOUSAND)
TABLE 416 ISRAEL SERVICES IN FLEET MANAGEMENT MARKET, BY TYPE, 2021-2030 (USD THOUSAND)
TABLE 417 ISRAEL MINING IN FLEET MANAGEMENT MARKET, BY OFFERING, 2021-2030 (USD THOUSAND)
TABLE 418 ISRAEL SOLUTIONS IN FLEET MANAGEMENT MARKET, BY TYPE, 2021-2030 (USD THOUSAND)
TABLE 419 ISRAEL SERVICES IN FLEET MANAGEMENT MARKET, BY TYPE, 2021-2030 (USD THOUSAND)
TABLE 420 ISRAEL GOVERNMENT IN FLEET MANAGEMENT MARKET, BY OFFERING, 2021-2030 (USD THOUSAND)
TABLE 421 ISRAEL SOLUTIONS IN FLEET MANAGEMENT MARKET, BY TYPE, 2021-2030 (USD THOUSAND)
TABLE 422 ISRAEL SERVICES IN FLEET MANAGEMENT MARKET, BY TYPE, 2021-2030 (USD THOUSAND)
TABLE 423 ISRAEL HEALTHCARE IN FLEET MANAGEMENT MARKET, BY OFFERING, 2021-2030 (USD THOUSAND)
TABLE 424 ISRAEL SOLUTIONS IN FLEET MANAGEMENT MARKET, BY TYPE, 2021-2030 (USD THOUSAND)
TABLE 425 ISRAEL SERVICES IN FLEET MANAGEMENT MARKET, BY TYPE, 2021-2030 (USD THOUSAND)
TABLE 426 ISRAEL AGRICULTURE IN FLEET MANAGEMENT MARKET, BY OFFERING, 2021-2030 (USD THOUSAND)
TABLE 427 ISRAEL SOLUTIONS IN FLEET MANAGEMENT MARKET, BY TYPE, 2021-2030 (USD THOUSAND)
TABLE 428 ISRAEL SERVICES IN FLEET MANAGEMENT MARKET, BY TYPE, 2021-2030 (USD THOUSAND)
TABLE 429 ISRAEL CONSTRUCTION IN FLEET MANAGEMENT MARKET, BY OFFERING, 2021-2030 (USD THOUSAND)
TABLE 430 ISRAEL SOLUTIONS IN FLEET MANAGEMENT MARKET, BY TYPE, 2021-2030 (USD THOUSAND)
TABLE 431 ISRAEL SERVICES IN FLEET MANAGEMENT MARKET, BY TYPE, 2021-2030 (USD THOUSAND)
TABLE 432 REST OF MIDDLE EAST AND AFRICA FLEET MANAGEMENT MARKET, BY OFFERING, 2021-2030 (USD THOUSAND)
Lista de figuras
FIGURE 1 MIDDLE EAST & AFRICA FLEET MANAGEMENT MARKET: SEGMENTATION
FIGURE 2 MIDDLE EAST & AFRICA FLEET MANAGEMENT MARKET: DATA TRIANGULATION
FIGURE 3 MIDDLE EAST & AFRICA FLEET MANAGEMENT MARKET: DROC ANALYSIS
FIGURE 4 MIDDLE EAST & AFRICA FLEET MANAGEMENT MARKET: MIDDLE EAST & AFRICA VS REGIONAL MARKET ANALYSIS
FIGURE 5 MIDDLE EAST & AFRICA FLEET MANAGEMENT MARKET: COMPANY RESEARCH ANALYSIS
FIGURE 6 MIDDLE EAST & AFRICA FLEET MANAGEMENT MARKET: INTERVIEW DEMOGRAPHICS
FIGURE 7 MIDDLE EAST & AFRICA FLEET MANAGEMENT MARKET: DBMR MARKET POSITION GRID
FIGURE 8 MIDDLE EAST & AFRICA FLEET MANAGEMENT MARKET: VENDOR SHARE ANALYSIS
FIGURE 9 MIDDLE EAST & AFRICA FLEET MANAGEMENT MARKET: MULTIVARIATE MODELING
FIGURE 10 MIDDLE EAST & AFRICA FLEET MANAGEMENT MARKET: OFFERING TIMELINE CURVE
FIGURE 11 MIDDLE EAST & AFRICA FLEET MANAGEMENT MARKET: MARKET END-USE COVERAGE GRID
FIGURE 12 MIDDLE EAST & AFRICA FLEET MANAGEMENT MARKET: SEGMENTATION
FIGURE 13 RISE IN DEMAND FOR IMPROVEMENT OF CUSTOMER SERICES IS EXPECTED TO DRIVE THE MIDDLE EAST & AFRICA FLEET MANAGEMENT MARKET IN THE FORECAST PERIOD OF 2023 TO 2030
FIGURE 14 SOLUTIONS SEGMENT IS EXPECTED TO ACCOUNT FOR THE LARGEST SHARE OF THE MIDDLE EAST & AFRICA FLEET MANAGEMENT MARKET IN 2023 & 2030
FIGURE 15 PROFIT ALLOCATION FOR FLEET MANAGEMENT MARKET
FIGURE 16 VALUE CHAIN FOR FLEET MANAGEMENT MARKET
FIGURE 17 DRIVERS, RESTRAINTS, OPPORTUNITIES AND CHALLENGES OF THE MIDDLE EAST & AFRICA FLEET MANAGEMENT MARKET
FIGURE 18 MIDDLE EAST & AFRICA FLEET MANAGEMENT MARKET: BY COMMUNIATION RANGE, 2022
FIGURE 19 MIDDLE EAST & AFRICA FLEET MANAGEMENT MARKET: BY DEPLOYMENT MODEL, 2022
FIGURE 20 MIDDLE EAST & AFRICA FLEET MANAGEMENT MARKET: BY TECHNOLOGY, 2022
FIGURE 21 MIDDLE EAST & AFRICA FLEET MANAGEMENT MARKET: BY FUNCTIONS, 2022
FIGURE 22 MIDDLE EAST & AFRICA FLEET MANAGEMENT MARKET: BY OPERATIONS, 2022
FIGURE 23 MIDDLE EAST & AFRICA FLEET MANAGEMENT MARKET: BY BUSINESS TYPE, 2022
FIGURE 24 MIDDLE EAST & AFRICA FLEET MANAGEMENT MARKET: BY VEHICLE TYPE, 2022
FIGURE 25 MIDDLE EAST & AFRICA FLEET MANAGEMENT MARKET: BY OFFERING, 2022
FIGURE 26 MIDDLE EAST & AFRICA FLEET MANAGEMENT MARKET: BY LEASE TYPE, 2022
FIGURE 27 MIDDLE EAST & AFRICA FLEET MANAGEMENT MARKET: BY HARDWARE, 2022
FIGURE 28 MIDDLE EAST & AFRICA FLEET MANAGEMENT MARKET: BY FLEET SIZE, 2022
FIGURE 29 MIDDLE EAST & AFRICA FLEET MANAGEMENT MARKET: BY MODE OF TRANSPORT, 2022
FIGURE 30 MIDDLE EAST & AFRICA FLEET MANAGEMENT MARKET: END USER, 2022
FIGURE 31 MIDDLE EAST AND AFRICA FLEET MANAGEMENT MARKET: SNAPSHOT (2022)
FIGURE 32 MIDDLE EAST AND AFRICA FLEET MANAGEMENT MARKET: BY COUNTRY (2022)
FIGURE 33 MIDDLE EAST AND AFRICA FLEET MANAGEMENT MARKET: BY COUNTRY (2023 & 2030)
FIGURE 34 MIDDLE EAST AND AFRICA FLEET MANAGEMENT MARKET: BY COUNTRY (2022 & 2030)
FIGURE 35 MIDDLE EAST AND AFRICA FLEET MANAGEMENT MARKET: BY OFFERING (2023-2030)
FIGURE 36 MIDDLE EAST & AFRICA FLEET MANAGEMENT MARKET: COMPANY SHARE 2022 (%)
Metodología de investigación
La recopilación de datos y el análisis del año base se realizan utilizando módulos de recopilación de datos con muestras de gran tamaño. La etapa incluye la obtención de información de mercado o datos relacionados a través de varias fuentes y estrategias. Incluye el examen y la planificación de todos los datos adquiridos del pasado con antelación. Asimismo, abarca el examen de las inconsistencias de información observadas en diferentes fuentes de información. Los datos de mercado se analizan y estiman utilizando modelos estadísticos y coherentes de mercado. Además, el análisis de la participación de mercado y el análisis de tendencias clave son los principales factores de éxito en el informe de mercado. Para obtener más información, solicite una llamada de un analista o envíe su consulta.
La metodología de investigación clave utilizada por el equipo de investigación de DBMR es la triangulación de datos, que implica la extracción de datos, el análisis del impacto de las variables de datos en el mercado y la validación primaria (experto en la industria). Los modelos de datos incluyen cuadrícula de posicionamiento de proveedores, análisis de línea de tiempo de mercado, descripción general y guía del mercado, cuadrícula de posicionamiento de la empresa, análisis de patentes, análisis de precios, análisis de participación de mercado de la empresa, estándares de medición, análisis global versus regional y de participación de proveedores. Para obtener más información sobre la metodología de investigación, envíe una consulta para hablar con nuestros expertos de la industria.
Personalización disponible
Data Bridge Market Research es líder en investigación formativa avanzada. Nos enorgullecemos de brindar servicios a nuestros clientes existentes y nuevos con datos y análisis que coinciden y se adaptan a sus objetivos. El informe se puede personalizar para incluir análisis de tendencias de precios de marcas objetivo, comprensión del mercado de países adicionales (solicite la lista de países), datos de resultados de ensayos clínicos, revisión de literatura, análisis de mercado renovado y base de productos. El análisis de mercado de competidores objetivo se puede analizar desde análisis basados en tecnología hasta estrategias de cartera de mercado. Podemos agregar tantos competidores sobre los que necesite datos en el formato y estilo de datos que esté buscando. Nuestro equipo de analistas también puede proporcionarle datos en archivos de Excel sin procesar, tablas dinámicas (libro de datos) o puede ayudarlo a crear presentaciones a partir de los conjuntos de datos disponibles en el informe.

