
Middle East And Africa Explosion Proof Equipment Market
Tamaño del mercado en miles de millones de dólares
Tasa de crecimiento anual compuesta (CAGR) :
% 
 USD
1.06 Billion
USD
1.92 Billion
2024
2032
USD
1.06 Billion
USD
1.92 Billion
2024
2032
| 2025 –2032 | |
| USD 1.06 Billion | |
| USD 1.92 Billion | |
| % | |
|
Segmentación del mercado de equipos a prueba de explosiones en Oriente Medio y África, por oferta (hardware, software y servicios), clase de temperatura (T1 ( 450 °C), T2 ( 300 °C a 200 °C a 135 °C a 100 °C a 85 °C a
Tamaño del mercado de equipos a prueba de explosiones en Oriente Medio y África
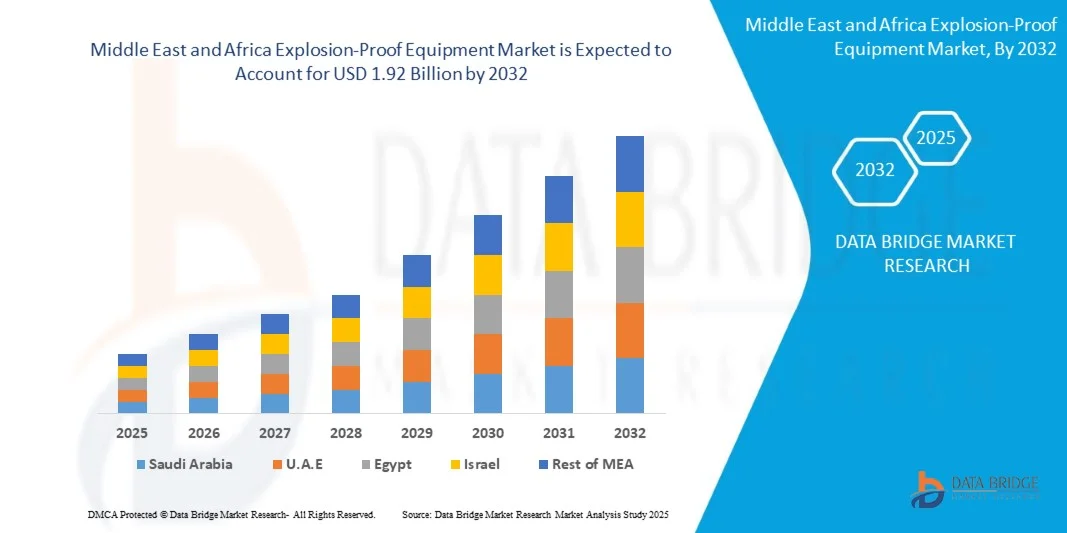
- El tamaño del mercado de equipos a prueba de explosiones de Medio Oriente y África se valoró en USD 1.06 mil millones en 2024 y se proyecta que alcance los USD 1.92 mil millones para 2032 , creciendo a una CAGR del 7,70% durante el período de pronóstico.
- El crecimiento del mercado está impulsado principalmente por la creciente industrialización, las estrictas normas de seguridad y la creciente necesidad de protección contra riesgos en los sectores de petróleo y gas, minería y productos químicos en toda la región.
- Además, la adopción de tecnologías de automatización avanzadas y las crecientes inversiones en infraestructura están creando una fuerte demanda de soluciones duraderas y a prueba de explosiones, lo que acelera significativamente la expansión del mercado.
Análisis del mercado de equipos a prueba de explosiones en Oriente Medio y África
- Los equipos a prueba de explosiones, diseñados para evitar la ignición en entornos peligrosos, se están volviendo cada vez más esenciales en los sectores industriales de Medio Oriente y África, particularmente en petróleo y gas, minería y procesamiento químico, debido a los mayores requisitos de seguridad y demandas de cumplimiento normativo.
- La creciente demanda de soluciones a prueba de explosiones se ve impulsada principalmente por el aumento de las actividades industriales, la creciente conciencia de la seguridad en el lugar de trabajo y la aplicación más estricta de las normas de seguridad por parte de los gobiernos regionales.
- Los Emiratos Árabes Unidos dominaron el mercado de equipos a prueba de explosiones de Medio Oriente y África con la mayor participación en los ingresos del 33,4 % en 2024, impulsado por su amplia infraestructura de petróleo y gas, megaproyectos en curso e inversiones gubernamentales destinadas a mejorar la seguridad industrial y la modernización.
- Se espera que Arabia Saudita sea el país de más rápido crecimiento en el mercado de equipos a prueba de explosiones de Medio Oriente y África durante el período de pronóstico debido a la rápida industrialización, el aumento de las inversiones extranjeras y el enfoque estratégico en la protección de los trabajadores en industrias peligrosas.
- El segmento de hardware dominó el mercado con una participación del 62,5% en 2024, en gran parte debido al uso generalizado de componentes físicos robustos como carcasas, sensores y sistemas de control esenciales para prevenir la ignición en entornos peligrosos.
Alcance del informe y segmentación del mercado de equipos a prueba de explosiones en Oriente Medio y África
|
Atributos |
Perspectivas clave del mercado de equipos a prueba de explosiones en Oriente Medio y África |
|
Segmentos cubiertos |
|
|
Países cubiertos |
Oriente Medio y África
|
|
Actores clave del mercado |
|
|
Oportunidades de mercado |
|
|
Conjuntos de información de datos de valor añadido |
Además de los conocimientos sobre escenarios de mercado como valor de mercado, tasa de crecimiento, segmentación, cobertura geográfica y actores principales, los informes de mercado seleccionados por Data Bridge Market Research también incluyen un análisis profundo de expertos, producción y capacidad por empresa representadas geográficamente, diseños de red de distribuidores y socios, análisis detallado y actualizado de tendencias de precios y análisis deficitario de la cadena de suministro y la demanda. |
Tendencias del mercado de equipos a prueba de explosiones en Oriente Medio y África
Integración de IoT y Monitoreo Inteligente en Entornos Peligrosos
- Una tendencia clave que está transformando el mercado de equipos a prueba de explosiones es la integración de sistemas de monitorización inteligente basados en IoT, que proporcionan diagnóstico en tiempo real, mantenimiento predictivo y acceso remoto en entornos de alto riesgo. Estos sistemas mejoran la seguridad operativa, reducen el tiempo de inactividad y contribuyen al cumplimiento de las normas de seguridad globales.
- Por ejemplo, Pepperl+Fuchs ha desarrollado sensores inteligentes e interfaces a prueba de explosiones que permiten la comunicación en zonas peligrosas al tiempo que ofrecen diagnóstico y monitorización de datos de procesos a través de protocolos Ethernet industriales.
- Los equipos a prueba de explosiones con IoT permiten a los operadores monitorear las condiciones ambientales, como la concentración de gases, la temperatura y los niveles de presión, en tiempo real, lo que garantiza respuestas de seguridad proactivas. Este enfoque basado en datos también ayuda a reducir las falsas alarmas y a garantizar un mantenimiento oportuno.
- Las capacidades de monitoreo inteligente son particularmente vitales en las industrias de petróleo y gas, química y minería, donde el riesgo de fallas en los equipos o peligros no detectados es extremadamente alto. Al combinar una construcción robusta con funcionalidad inteligente, las empresas pueden optimizar simultáneamente la seguridad y el rendimiento.
- Esta tendencia impulsa a fabricantes como R. STAHL y BARTEC a innovar con soluciones digitales a prueba de explosiones que se integran fácilmente en sistemas de automatización y control industrial más amplios. Estos sistemas admiten actualizaciones escalables y cumplen con los estándares de certificación específicos de cada zona.
- A medida que las operaciones industriales continúan digitalizándose y aumenta la demanda de soluciones seguras y eficientes en zonas peligrosas, se espera que la adopción de sistemas inteligentes y conectados a prueba de explosiones se acelere tanto en los mercados desarrollados como en los emergentes.
Dinámica del mercado de equipos a prueba de explosiones en Oriente Medio y África
Conductor
“Estrictas normas de seguridad y creciente conciencia sobre los riesgos industriales
- Los estrictos estándares de seguridad impuestos por organismos reguladores como ATEX (Europa), IECEx (Internacional) y NEC (EE. UU.) son una fuerza importante que impulsa la demanda de equipos a prueba de explosiones en entornos industriales peligrosos.
- Por ejemplo, las industrias de Europa y Oriente Medio han adoptado cada vez más soluciones certificadas a prueba de explosiones siguiendo los mandatos de cumplimiento regional destinados a minimizar los riesgos de explosión y proteger a los trabajadores.
- La creciente conciencia de los riesgos industriales, junto con las crecientes inversiones en infraestructura de seguridad, ha impulsado la demanda de industrias como el petróleo y el gas, la petroquímica, la farmacéutica y la minería, donde las atmósferas volátiles son comunes.
- Los dispositivos a prueba de explosiones, incluidos gabinetes, sistemas de iluminación, motores y prensaestopas, son esenciales para prevenir fuentes de ignición y su uso se está expandiendo debido a una mayor automatización y al despliegue de sistemas eléctricos en zonas explosivas.
- Actores importantes como ABB y Eaton están lanzando productos certificados que cumplen con las regulaciones internacionales de seguridad y también ofrecen funciones digitales, lo que permite operaciones más seguras e inteligentes en entornos exigentes.
Restricción/Desafío
“Altos costos de instalación y complejidad de mantenimiento”
- Uno de los desafíos importantes que enfrenta el mercado de equipos a prueba de explosiones es el alto costo de instalación y la complejidad constante del mantenimiento en cumplimiento con los estándares de seguridad globales.
- Por ejemplo, la instalación de equipos certificados en entornos de Zona 0 o Zona 1 requiere ingeniería especializada, materiales robustos y mano de obra calificada, lo que aumenta el costo general del proyecto y disuade a los operadores de pequeña escala.
- Mantener el rendimiento y la conformidad de dichos equipos implica inspecciones, calibraciones y documentación rutinarias, lo que puede requerir muchos recursos. Esto es especialmente difícil en ubicaciones remotas o en alta mar con acceso limitado.
- El incumplimiento de las condiciones certificadas puede provocar incumplimientos normativos o fallos en los equipos, lo que aumenta el riesgo de responsabilidad civil. Por lo tanto, las empresas deben invertir tanto en personal cualificado como en sistemas de monitorización sofisticados.
- Para abordar este problema, los fabricantes están trabajando para simplificar el diseño de productos, ampliar los intervalos de mantenimiento e introducir soluciones modulares que reduzcan los costos totales del ciclo de vida sin comprometer la seguridad ni el cumplimiento.
Mercado de equipos a prueba de explosiones en Oriente Medio y África
El mercado está segmentado en función de la oferta, clase de temperatura, zona, servicio de conectividad, ubicación, método de protección, equipo y usuario final.
- Ofreciendo
Según la oferta, el mercado de equipos a prueba de explosiones de Oriente Medio y África se segmenta en hardware, software y servicios. El segmento de hardware dominó el mercado con una participación del 62,5 % en 2024, debido principalmente al uso generalizado de componentes físicos robustos, como carcasas, sensores y sistemas de control, esenciales para prevenir la ignición en entornos peligrosos. Estos componentes de hardware son cruciales en industrias como la del petróleo y el gas y la de procesamiento químico, donde la seguridad es primordial.
Se prevé que el segmento de servicios registre la tasa de crecimiento anual compuesta (TCAC) más rápida, del 21,3 %, entre 2025 y 2032, impulsada por la creciente demanda de servicios de instalación, mantenimiento, inspección y cumplimiento normativo. La creciente complejidad de los sistemas a prueba de explosiones y la criticidad de su mantenimiento fomentan la adopción de servicios profesionales, lo que garantiza la seguridad operativa y el cumplimiento de los estrictos estándares del sector.
- Por clase de temperatura
Según la clase de temperatura, el mercado se clasifica en T1 (>450 °C), T2 (>300 °C a <450 °C), T3 (>200 °C a <300 °C), T4 (>135 °C a <200 °C), T5 (>100 °C a <135 °C) y T6 (>85 °C a <100 °C). El segmento T4 tuvo la mayor participación de mercado, con un 35,7 % en 2024, ya que abarca una amplia gama de equipos industriales utilizados en atmósferas volátiles, ofreciendo umbrales térmicos operativos seguros, ideales para refinerías y plantas de procesamiento.
Se proyecta que el segmento T6 experimente la tasa de crecimiento anual compuesta (TCAC) más rápida, del 22,1 %, entre 2025 y 2032, impulsada por la mayor demanda de las industrias farmacéutica, de procesamiento de alimentos y propensas al polvo, donde las temperaturas de ignición son bajas y es obligatorio un estricto cumplimiento de las normas de seguridad. Estas industrias dependen en gran medida de los dispositivos con clasificación T6 para garantizar la seguridad operativa en condiciones de alta sensibilidad.
- Por zona
Según la zona, el mercado de equipos a prueba de explosiones se segmenta en Zona 0, Zona 1, Zona 2, Zona 20, Zona 21 y Zona 22. La Zona 1 dominó el mercado con una participación del 40,2 % en 2024, lo que refleja su frecuente exposición a atmósferas explosivas durante las operaciones rutinarias, especialmente en instalaciones upstream de petróleo y gas y plantas químicas. Los equipos diseñados para la Zona 1 están fabricados para ofrecer una gran durabilidad y sellado para resistir fuentes de ignición.
Se prevé que el segmento de la Zona 21 registre la tasa de crecimiento anual compuesta (TCAC) más rápida, del 20,7 %, entre 2025 y 2032, gracias a la creciente adopción en sectores con presencia intermitente de polvo explosivo, como la molienda de alimentos, la fabricación farmacéutica y el almacenamiento agrícola. Estos entornos requieren equipos especializados para gestionar los riesgos de explosión por polvo combustible.
- Por Servicio de Conectividad
En cuanto a los servicios de conectividad, el mercado se divide en servicios de conectividad alámbricos e inalámbricos. El segmento cableado mantuvo una participación dominante del 70,1 % en 2024, favorecido por su comunicación confiable y segura en entornos industriales donde la transmisión de datos críticos es esencial. La conectividad alámbrica minimiza los riesgos asociados a las interferencias electromagnéticas comunes en zonas propensas a explosiones.
Se prevé que el segmento inalámbrico experimente el mayor crecimiento, con una tasa de crecimiento anual compuesta (TCAC) del 24,5 % entre 2025 y 2032, impulsado por la digitalización de las instalaciones industriales y la integración de sensores y dispositivos de monitorización basados en el IoT. La conectividad inalámbrica mejora la recopilación de datos en tiempo real, facilita la instalación y las capacidades de monitorización remota, cada vez más valoradas en entornos peligrosos.
- Por ubicación
Según la ubicación, el mercado se segmenta en equipos para interiores y exteriores. El segmento de exteriores lideró el mercado con una participación del 55,6 % en 2024, impulsado por las instalaciones robustas requeridas para plataformas petrolíferas, gasoductos y operaciones mineras, que exigen dispositivos a prueba de explosiones resistentes a la intemperie y duraderos para evitar la ignición.
Se prevé que el segmento de interiores experimente la tasa de crecimiento anual compuesta (TCAC) más rápida, del 19,8 %, entre 2025 y 2032, debido a los estándares de seguridad más estrictos en espacios industriales cerrados como laboratorios, líneas de producción y almacenes. Los equipos de interior deben gestionar los riesgos derivados de la acumulación de gases o polvo en áreas confinadas, lo que aumenta la demanda de soluciones avanzadas a prueba de explosiones.
- Por método de protección
Según el método de protección, el mercado se segmenta en métodos de protección a prueba de explosiones, prevención de explosiones y segregación de explosiones. En 2024, la prevención de explosiones representó la mayor participación en los ingresos, con un 28,1 %, debido a la creciente demanda de equipos intrínsecamente seguros que minimicen el consumo de energía para evitar la ignición, especialmente en los sectores farmacéutico y químico, que priorizan la seguridad proactiva.
Se prevé que el método a prueba de explosiones experimente la tasa de crecimiento más rápida, con una tasa de crecimiento anual compuesta (TCAC) del 22,6 % entre 2025 y 2032, impulsada por su eficacia para contener explosiones dentro de recintos cerrados, un requisito fundamental en entornos de alto riesgo como refinerías de petróleo y plantas de gas. Este segmento se beneficia de estrictas normas de seguridad que exigen estrategias de contención fiables.
- Por equipo
En cuanto a equipos, el mercado de equipos a prueba de explosiones incluye prensaestopas y accesorios, instrumentos de proceso, controles industriales, motores, luces estroboscópicas, productos de protección contra rayos, sensores, timbres y bocinas, alarmas de incendio/pulsadores, altavoces y generadores de tonos, y unidades combinadas visuales y sonoras. Los prensaestopas y accesorios representaron la mayor cuota de mercado, con un 31,3%, en 2024, ya que son esenciales para mantener la integridad de las carcasas y evitar la propagación de llamas a través de las entradas de cables.
Se prevé que el segmento de sensores crezca a la CAGR más rápida del 25,0 % entre 2025 y 2032, impulsado por la creciente adopción de tecnologías de monitoreo ambiental en tiempo real y mantenimiento predictivo, que mejoran la seguridad y la eficiencia operativa en condiciones peligrosas.
- Por el usuario final
En cuanto al usuario final, el mercado por usuario final abarca los sectores de petróleo y gas, química y petroquímica, energía y electricidad, minería, farmacéutica, procesamiento de alimentos, construcción naval y naval, aeroespacial, militar y de defensa, entre otros. El sector de petróleo y gas obtuvo la mayor participación, con un 34,5 % en 2024, impulsado por la necesidad crítica de la industria de soluciones a prueba de explosiones para mitigar los riesgos en las actividades de extracción, refinación y distribución.
Se prevé que el segmento farmacéutico registre la CAGR más rápida del 21,9 % durante el período 2025-2032, impulsada por estrictos mandatos regulatorios para entornos de fabricación seguros, particularmente en procesos que involucran solventes volátiles e ingredientes farmacéuticos activos.
Análisis regional del mercado de equipos a prueba de explosiones en Oriente Medio y África
- Los Emiratos Árabes Unidos dominan el mercado de equipos a prueba de explosiones con la mayor participación en los ingresos del 33,4 % en 2024, impulsado por estrictas regulaciones de seguridad industrial, crecientes inversiones en infraestructura de petróleo y gas y una fuerte presencia de industrias basadas en ubicaciones peligrosas.
- La región se beneficia de la adopción de tecnología avanzada, la aplicación constante de normas por parte de organismos como OSHA y NEC, y una fuerte demanda de soluciones a prueba de explosiones en los sectores de procesamiento químico y energía.
- El crecimiento se ve respaldado además por una base industrial madura, una rápida integración de soluciones de IoT industrial en entornos peligrosos y un mayor énfasis en el cumplimiento de la seguridad de los trabajadores en las instalaciones industriales nuevas y tradicionales.
Análisis del mercado de equipos a prueba de explosiones en Arabia Saudita
Arabia Saudita obtuvo la mayor participación en los ingresos, con un 40,01 %, en el mercado de equipos a prueba de explosiones de Oriente Medio y África en 2024. Este dominio se atribuye a las vastas operaciones de petróleo y gas del Reino, su infraestructura petroquímica y las continuas inversiones en el marco de las iniciativas Visión 2030. El estricto cumplimiento normativo en entornos peligrosos, junto con un importante flujo de capital hacia megaproyectos energéticos e industriales, impulsa una demanda sostenida de equipos a prueba de explosiones tanto en las operaciones upstream como downstream.
Análisis del mercado de equipos a prueba de explosiones de Sudáfrica
El mercado sudafricano de equipos a prueba de explosiones está cobrando impulso, principalmente debido al aumento de las actividades mineras y manufactureras. El consolidado sector minero del país, sumado a los esfuerzos para reducir los incidentes laborales, está impulsando la implementación de iluminación, envolventes e instrumentación a prueba de explosiones. Además, las políticas gubernamentales que promueven la seguridad laboral en entornos volátiles están impulsando la demanda de equipos robustos y que cumplan con las normas en plantas industriales clave.
Cuota de mercado de equipos a prueba de explosiones en Oriente Medio y África
La industria de equipos a prueba de explosiones está liderada principalmente por empresas bien establecidas, entre las que se incluyen:
- R. STAHL AG (Alemania)
- Extronics (Reino Unido)
- Honeywell International Inc (EE. UU.)
- ABB (Suiza)
- BARTEC Top Holding GmbH (Alemania)
- Eaton (Irlanda)
- Pepperl+Fuchs (Alemania)
- Bosch Rexroth AG (Alemania)
- MarechalElectric (Francia)
- Pelco (EE. UU.)
- DEHN SE (Alemania)
- Schneider Electric (Francia)
- nVent (Reino Unido)
- Axis Communications AB (Suecia)
- ClearView Communications LTD (Reino Unido)
- Zenitel (Noruega)
- MIRETTI (Italia)
- Emerson Electric Co (EE. UU.)
¿Cuáles son los desarrollos recientes en el mercado de equipos a prueba de explosiones en Oriente Medio y África?
- En noviembre de 2024, Konecranes amplió su cartera de equipos a prueba de explosiones con el lanzamiento del polipasto eléctrico de cadena serie EX C, diseñado para su uso en entornos peligrosos de Zona 1/2/21. Introducido en las regiones EMEA y APAC, el polipasto incorpora características avanzadas de seguridad y eficiencia, lo que lo hace ideal para operaciones en atmósferas explosivas como refinerías de petróleo, plantas químicas e instalaciones de gas.
- En agosto de 2022, ARCHON Industries, Inc. lanzó la luz antideflagrante EX20100, diseñada específicamente para proporcionar iluminación continua a diversos equipos industriales en áreas peligrosas y no peligrosas. Diseñada para su uso en ubicaciones de Clase I, División I, Grupo C y D, y Clase I, División II, Grupo C y D, la luminaria mejora la seguridad y la visibilidad en entornos difíciles.
- En abril de 2022, Mitsubishi Heavy Industries, Ltd., en colaboración con ENEOS Corporation, presentó el robot de inspección de plantas «EX ROVR» de segunda generación con capacidades a prueba de explosiones. Mediante tecnología de mantenimiento remoto, mejora la seguridad de los trabajadores, incrementa la eficiencia laboral y garantiza inspecciones continuas de las instalaciones en atmósferas potencialmente explosivas, satisfaciendo así las demandas del mercado de equipos a prueba de explosiones.
- En febrero de 2022, Pyroban reintrodujo la Consultoría de Soluciones Ex para ayudar a los fabricantes a abordar sus necesidades de diseño y certificación Ex o la escasez de personal cualificado. Este servicio agiliza la comercialización de productos a prueba de explosiones, minimizando los gastos de certificación Ex. Sirve como un recurso valioso para los fabricantes que se enfrentan a las complejidades del mercado de equipos a prueba de explosiones.
- En mayo de 2021, Zenitel y AMAG Technology colaboraron para brindar una solución de seguridad de vanguardia a un desarrollo en el oeste de Los Ángeles. Con una superficie de 18.000 metros cuadrados y ocho plantas, el proyecto integra equipos a prueba de explosiones para garantizar la seguridad tanto en las oficinas creativas como en los apartamentos.
SKU-
Obtenga acceso en línea al informe sobre la primera nube de inteligencia de mercado del mundo

- Panel de análisis de datos interactivo
- Panel de análisis de empresas para oportunidades con alto potencial de crecimiento
- Acceso de analista de investigación para personalización y consultas
- Análisis de la competencia con panel interactivo
- Últimas noticias, actualizaciones y análisis de tendencias
- Aproveche el poder del análisis de referencia para un seguimiento integral de la competencia
Metodología de investigación
La recopilación de datos y el análisis del año base se realizan utilizando módulos de recopilación de datos con muestras de gran tamaño. La etapa incluye la obtención de información de mercado o datos relacionados a través de varias fuentes y estrategias. Incluye el examen y la planificación de todos los datos adquiridos del pasado con antelación. Asimismo, abarca el examen de las inconsistencias de información observadas en diferentes fuentes de información. Los datos de mercado se analizan y estiman utilizando modelos estadísticos y coherentes de mercado. Además, el análisis de la participación de mercado y el análisis de tendencias clave son los principales factores de éxito en el informe de mercado. Para obtener más información, solicite una llamada de un analista o envíe su consulta.
La metodología de investigación clave utilizada por el equipo de investigación de DBMR es la triangulación de datos, que implica la extracción de datos, el análisis del impacto de las variables de datos en el mercado y la validación primaria (experto en la industria). Los modelos de datos incluyen cuadrícula de posicionamiento de proveedores, análisis de línea de tiempo de mercado, descripción general y guía del mercado, cuadrícula de posicionamiento de la empresa, análisis de patentes, análisis de precios, análisis de participación de mercado de la empresa, estándares de medición, análisis global versus regional y de participación de proveedores. Para obtener más información sobre la metodología de investigación, envíe una consulta para hablar con nuestros expertos de la industria.
Personalización disponible
Data Bridge Market Research es líder en investigación formativa avanzada. Nos enorgullecemos de brindar servicios a nuestros clientes existentes y nuevos con datos y análisis que coinciden y se adaptan a sus objetivos. El informe se puede personalizar para incluir análisis de tendencias de precios de marcas objetivo, comprensión del mercado de países adicionales (solicite la lista de países), datos de resultados de ensayos clínicos, revisión de literatura, análisis de mercado renovado y base de productos. El análisis de mercado de competidores objetivo se puede analizar desde análisis basados en tecnología hasta estrategias de cartera de mercado. Podemos agregar tantos competidores sobre los que necesite datos en el formato y estilo de datos que esté buscando. Nuestro equipo de analistas también puede proporcionarle datos en archivos de Excel sin procesar, tablas dinámicas (libro de datos) o puede ayudarlo a crear presentaciones a partir de los conjuntos de datos disponibles en el informe.

