
Mercado de embalajes ecológicos en Oriente Medio y África, por tipo (embalajes con contenido reciclado, embalajes reutilizables y embalajes degradables), tipo de material (papel y cartón, plástico, metal, vidrio, materiales a base de almidón y otros), tipo de producto (bolsas, sobres y bolsitas, cajas, contenedores, películas, bandejas, tubos, botellas y tarros, latas y otros), técnica (embalaje activo, embalaje moldeado, embalaje de fibra alternativa y otros), capa (embalaje primario, embalaje secundario y embalaje terciario), aplicación (alimentos, bebidas, productos farmacéuticos, cuidado personal, cuidado del hogar y otros), país (EAU, Arabia Saudita, Egipto, Israel y Sudáfrica), tendencias de la industria y pronóstico hasta 2029
Análisis y perspectivas del mercado : mercado de envases ecológicos en Oriente Medio y África
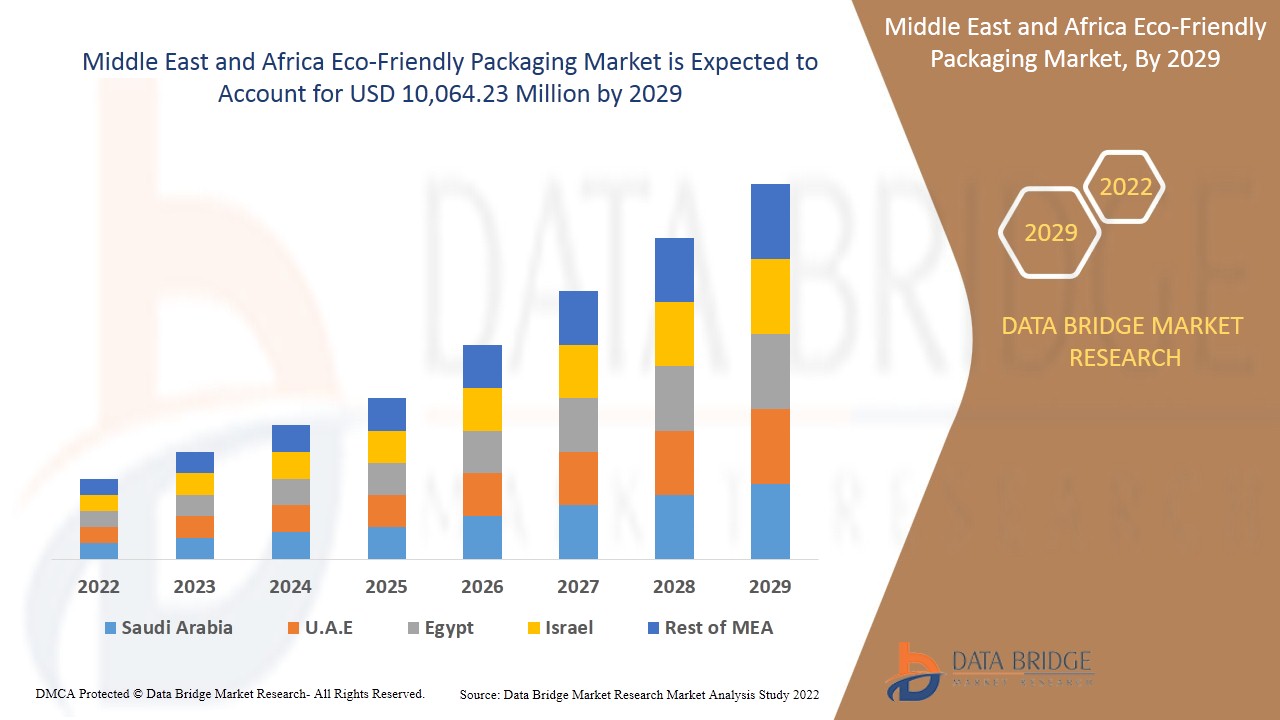
Se espera que el mercado de envases ecológicos de Oriente Medio y África gane crecimiento de mercado en el período de pronóstico de 2022 a 2029. Data Bridge Market Research analiza que el mercado está creciendo a una CAGR del 3,4% en el período de pronóstico de 2022 a 2029 y se espera que alcance los USD 10.064,23 millones para 2029.
Los envases ecológicos son aquellos que son fáciles de reciclar, seguros para las personas y el medio ambiente y que están fabricados con materiales reciclados. En ellos se utilizan materiales y prácticas de fabricación que tienen un impacto mínimo en el consumo de energía y los recursos naturales. Los consumidores están cada vez más preocupados por las consecuencias medioambientales de los envases. Los consumidores y los gobiernos presionan a las empresas para que utilicen envases ecológicos para sus productos.
Las soluciones de embalaje ecológico tienen como objetivo: reducir la cantidad de embalajes de productos, promover el uso de materiales renovables/reutilizables, reducir los gastos relacionados con los embalajes, eliminar el uso de materiales tóxicos en la producción de embalajes y brindar opciones para reciclar los embalajes fácilmente.
La creciente conciencia pública sobre las preocupaciones ambientales y la contaminación causada por los envases convencionales, como el plástico, ha dado lugar a una mayor demanda de envases ecológicos, lo que se espera que impulse en gran medida el crecimiento del mercado de envases ecológicos en Oriente Medio y África. La principal limitación puede ser la falta de concienciación sobre los beneficios de los productos de embalaje ecológicos. Se espera que las innovaciones considerables en los productos de embalaje brinden oportunidades en el mercado. El alto coste y la infraestructura deficiente para los procesos de reciclaje pueden suponer un reto para el mercado de envases ecológicos en Oriente Medio y África.
Este informe sobre el mercado de envases ecológicos de Oriente Medio y África proporciona detalles sobre la cuota de mercado, los nuevos desarrollos y el análisis de la cartera de productos, el impacto de los actores del mercado nacional y localizado, analiza las oportunidades en términos de bolsas de ingresos emergentes, cambios en las regulaciones del mercado, aprobaciones de productos, decisiones estratégicas, lanzamientos de productos, expansiones geográficas e innovaciones tecnológicas en el mercado. Para comprender el análisis y el escenario del mercado, contáctenos para obtener un resumen analítico; nuestro equipo lo ayudará a crear una solución de impacto en los ingresos para lograr su objetivo deseado.
Alcance y tamaño del mercado de envases ecológicos en Oriente Medio y África
El mercado de envases ecológicos de Oriente Medio y África se divide en seis segmentos importantes, según el tipo, el tipo de material, el tipo de producto, la técnica, la capa y la aplicación. El crecimiento entre segmentos le ayuda a analizar nichos de crecimiento y estrategias para abordar el mercado y determinar sus principales áreas de aplicación y la diferencia en sus mercados objetivo.
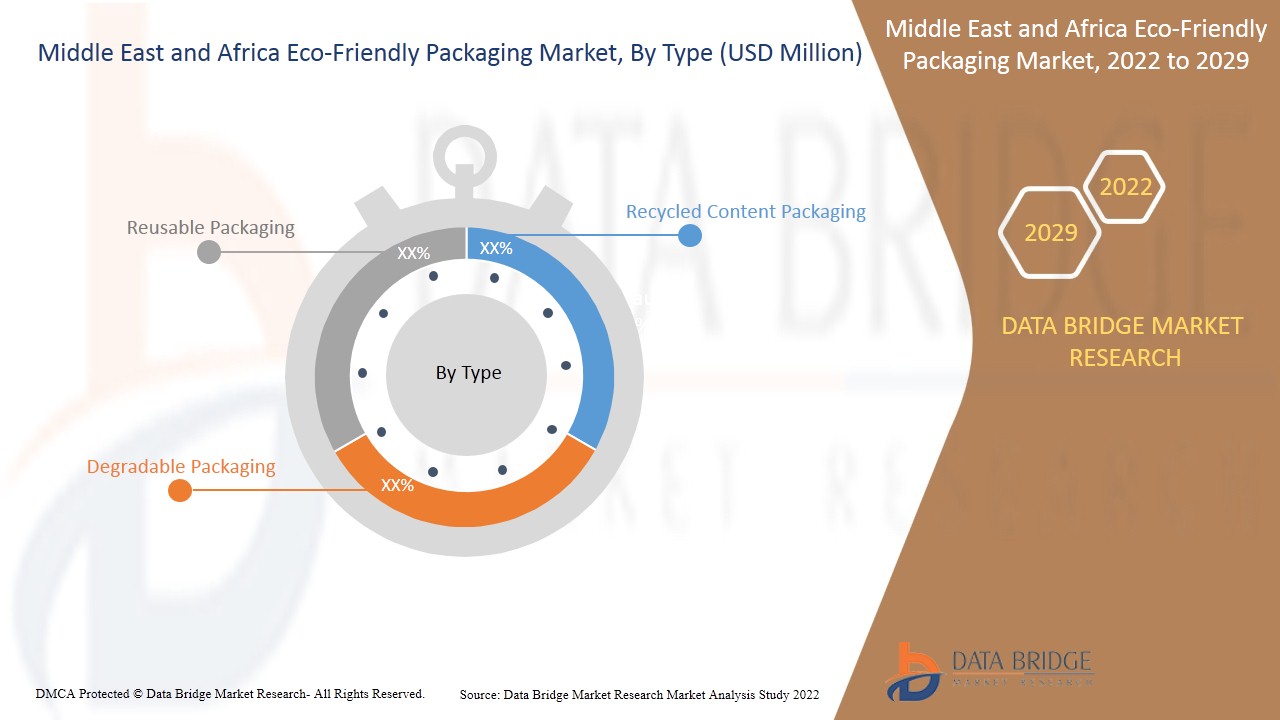
- En función del tipo, el mercado de envases ecológicos de Oriente Medio y África se segmenta en envases con contenido reciclado, envases reutilizables y envases degradables. En 2022, se espera que el segmento de envases reutilizables domine el mercado debido a su naturaleza de poder reutilizarse una y otra vez sin ninguna pérdida de sus propiedades.
- En función del tipo de material, el mercado de embalajes ecológicos de Oriente Medio y África se segmenta en papel y cartón, plástico, metal, vidrio, materiales a base de almidón y otros. En 2022, se espera que el segmento de papel y cartón domine el mercado de embalajes ecológicos de Oriente Medio y África, ya que es una propiedad 100% degradable de forma natural para las soluciones de embalaje con bajo impacto en el medio ambiente.
- Según el tipo de producto, el mercado de embalajes ecológicos de Oriente Medio y África se segmenta en bolsas, sobres y saquitos, cajas, contenedores, películas, bandejas, tubos, botellas y frascos, latas y otros. En 2022, se espera que el segmento de las cajas domine el mercado de embalajes ecológicos de Oriente Medio y África, ya que las cajas protegen los materiales envasados de forma muy eficiente y tienen una buena resistencia para soportar pesos pesados.
- En función de la técnica, el mercado de embalajes ecológicos de Oriente Medio y África se segmenta en embalajes activos, embalajes moldeados, embalajes de fibras alternativas y otros. En 2022, se espera que los embalajes de fibras alternativas dominen el mercado de embalajes ecológicos de Oriente Medio y África, demostrando ser una alternativa ecológica al papel. También proporciona una alternativa muy necesaria al poliestireno, perjudicial tanto para el medio ambiente como para la salud humana.
- En función de las capas, el mercado de envases ecológicos de Oriente Medio y África se segmenta en envases primarios, secundarios y terciarios. En 2022, se espera que el segmento de envases primarios domine el mercado de envases ecológicos de Oriente Medio y África, ya que permite conservar el producto de la misma manera que está sin que se altere por las condiciones ambientales externas.
- En función de la aplicación, el mercado de envases ecológicos de Oriente Medio y África se segmenta en alimentos, bebidas, productos farmacéuticos, cuidado personal, cuidado del hogar y otros. En 2022, se espera que el segmento de alimentos domine el mercado de envases ecológicos de Oriente Medio y África, debido al rápido crecimiento de la industria alimentaria en la región y al creciente uso de envases desechables ecológicos en la industria alimentaria.
Análisis a nivel de país del mercado de envases ecológicos en Oriente Medio y África
Se analiza el mercado de envases ecológicos de Oriente Medio y África, y se proporciona información sobre el tamaño del mercado por país, tipo, tipo de material, tipo de producto, técnica, capa y aplicación.
Los países incluidos en el informe sobre el mercado de envases ecológicos de Oriente Medio y África son Sudáfrica, Egipto, Arabia Saudita, Emiratos Árabes Unidos, Israel y el resto de Oriente Medio y África. En 2022, se espera que los Emiratos Árabes Unidos dominen el mercado de envases ecológicos de Oriente Medio y África debido a un aumento del crecimiento de los envases ecológicos en la región debido a la alta demanda de bienes de consumo de rápido movimiento y la inclinación de los consumidores hacia los envases ecológicos. Se espera que Sudáfrica crezca debido a las crecientes preocupaciones ambientales y la creciente conciencia pública sobre los productos ecológicos. Se espera que Arabia Saudita crezca en el mercado de envases ecológicos de Oriente Medio y África debido a las estrictas regulaciones implementadas por la mayoría de los gobiernos sobre las bolsas de plástico.
La sección de países del informe también proporciona factores de impacto de mercado individuales y cambios en la regulación del mercado que afectan las tendencias actuales y futuras del mercado. Los puntos de datos como nuevas ventas, ventas de reemplazo, demografía del país, leyes regulatorias y aranceles de importación y exportación son algunos de los principales indicadores utilizados para pronosticar el escenario del mercado para países individuales. Además, la presencia y disponibilidad de marcas de Medio Oriente y África y sus desafíos enfrentados debido a la competencia grande o escasa de las marcas locales y nacionales, el impacto de los canales de venta se consideran al proporcionar un análisis de pronóstico de los datos del país.
Crecimiento del mercado de envases ecológicos en Oriente Medio y África
El mercado de envases ecológicos de Oriente Medio y África también le ofrece un análisis detallado del mercado para el crecimiento de cada país en la base instalada de diferentes tipos de productos para el mercado, el impacto de la tecnología que utiliza curvas de línea de vida y los cambios en los escenarios regulatorios de las fórmulas infantiles, y su impacto en el mercado de envases ecológicos. Los datos están disponibles para el período histórico de 2011 a 2019.
Análisis del panorama competitivo y de la cuota de mercado de los envases ecológicos en Oriente Medio y África
El panorama competitivo del mercado de envases ecológicos de Oriente Medio y África ofrece detalles por competidor. Los detalles incluidos son la descripción general de la empresa, las finanzas de la empresa, los ingresos generados, el potencial de mercado, la inversión en investigación y desarrollo, las nuevas iniciativas de mercado, la presencia en Oriente Medio y África, los sitios e instalaciones de producción, las fortalezas y debilidades de la empresa, el lanzamiento de productos, los procesos de ensayos clínicos, el análisis de la marca, las aprobaciones de productos, las patentes, la amplitud y la extensión de los productos, el dominio de las aplicaciones y la curva de supervivencia de la tecnología. Los puntos de datos anteriores solo están relacionados con el enfoque de la empresa en el mercado de envases ecológicos de Oriente Medio y África.
Algunos de los principales actores incluidos en el informe sobre envases ecológicos de Oriente Medio y África son Mondi, Sealed Air, Crown Holdings, Inc., Tetra Pak, Huhtamaki, Berry Global Inc., Amcor plc, Ball Corporation, Pactiv Evergreen Inc., Plastipak Holdings, Inc., Nampak Ltd., Elopak, UFlex Limited y otros. Los analistas de DBMR comprenden las fortalezas competitivas y brindan un análisis competitivo para cada competidor por separado.
Por ejemplo,
- En octubre de 2021, Mondi comenzó a suministrar una gama de envases monomateriales reciclables para alimentos para mascotas a Hau-Hau Champion, una de las marcas más reconocidas de Finlandia en el segmento de alimentos premium para perros. Este desarrollo ayudará a Mondi a adquirir más empresas de alimentos para mascotas para sus soluciones de envasado.
SKU-
Obtenga acceso en línea al informe sobre la primera nube de inteligencia de mercado del mundo

- Panel de análisis de datos interactivo
- Panel de análisis de empresas para oportunidades con alto potencial de crecimiento
- Acceso de analista de investigación para personalización y consultas
- Análisis de la competencia con panel interactivo
- Últimas noticias, actualizaciones y análisis de tendencias
- Aproveche el poder del análisis de referencia para un seguimiento integral de la competencia
Tabla de contenido
1 INTRODUCTION
1.1 OBJECTIVES OF THE STUDY
1.2 MARKET DEFINITION
1.3 OVERVIEW OF MIDDLE EAST & AFRICA ECO-FRIENDLY PACKAGING MARKET
1.4 LIMITATION
1.5 MARKETS COVERED
2 MARKET SEGMENTATION
2.1 MARKETS COVERED
2.2 GEOGRAPHICAL SCOPE
2.3 YEARS CONSIDERED FOR THE STUDY
2.4 CURRENCY AND PRICING
2.5 DBMR TRIPOD DATA VALIDATION MODEL
2.6 TYPE LIFE LINE CURVE
2.7 MULTIVARIATE MODELING
2.8 PRIMARY INTERVIEWS WITH KEY OPINION LEADERS
2.9 DBMR MARKET POSITION GRID
2.1 MARKET APPLICATION COVERAGE GRID
2.11 DBMR MARKET CHALLENGE MATRIX
2.12 DBMR VENDOR SHARE ANALYSIS
2.13 IMPORT-EXPORT DATA
2.14 SECONDARY SOURCES
2.15 ASSUMPTIONS
3 EXECUTIVE SUMMARY
4 PREMIUM INSIGHTS
5 MARKET OVERVIEW
5.1 DRIVERS
5.1.1 SINGLE-USE PLASTIC BAN HAS HEIGHTENED DEMAND FOR ECO-FRIENDLY PACKAGING
5.1.2 CHANGING CONSUMER PREFERENCES TOWARDS CONVENIENCE AND PACKAGED FOODS
5.1.3 RISE IN AWARENESS REGARDING ENVIRONMENTAL CONSERVATION AND SUSTAINABLE LIVING
5.1.4 STRINGENT GOVERNMENT REGULATIONS REGARDING ENVIRONMENTAL SUSTAINABILITY
5.2 RESTRAINTS
5.2.1 PRICE VOLATILITY OF RAW MATERIALS
5.2.2 CONSTRAINT IN PRODUCTION CAPACITIES
5.2.3 LACK OF KNOWLEDGE AND LOW ACCEPTANCE FOR SUSTAINABLE PACKAGING IN DEVELOPING ECONOMIES
5.3 OPPORTUNITIES
5.3.1 CONSIDERABLE INNOVATIONS IN PACKAGING PRODUCTS
5.3.2 SIGNIFICANT GOVERNMENT INITIATIVES TO PROMOTE USE OF ECO-FRIENDLY PACKAGING
5.3.3 INCREASE IN GROWTH POTENTIAL IN PACKAGING MARKET AND RISING R&D ACTIVITIES
5.4 CHALLENGES
5.4.1 HIGH COST OF ECO-FRIENDLY PACKAGING AS COMPARED TO CONVENTIONAL PRODUCTS
5.4.2 HIGH COST AND POOR INFRASTRUCTURE FOR RECYCLING PROCESSES
6 COVID 19 IMPACT ON THE MIDDLE EAST & AFRICA ECO-FRIENDLY PACKAGING MARKET
6.1 AFTERMATH OF COVID-19 AND GOVERNMENT INITIATIVE TO BOOST THE MIDDLE EAST & AFRICA ECO-FRIENDLY PACKAGING MARKET
6.2 STRATEGIC DECISIONS FOR MANUFACTURERS AFTER COVID-19 TO GAIN COMPETITIVE MARKET SHARE
6.3 IMPACT ON PRICE
6.4 IMPACT ON DEMAND
6.5 IMPACT ON SUPPLY CHAIN
6.6 CONCLUSION
7 MIDDLE EAST & AFRICA ECO-FRIENDLY PACKAGING MARKET, BY TYPE
7.1 OVERVIEW
7.2 REUSABLE PACKAGING
7.3 RECYCLED CONTENT PACKAGING
7.4 DEGRADABLE PACKAGING
8 MIDDLE EAST & AFRICA ECO-FRIENDLY PACKAGING MARKET, BY MATERIAL TYPE
8.1 OVERVIEW
8.2 PAPER & PAPER BOARD
8.2.1 PAPER & PAPER BOARD, BY MATERIAL TYPE
8.2.1.1 RECYCLED (COATED AND UNCOATED)
8.2.1.2 SOLID BLEACH SULFATE (SBS)
8.2.1.3 COATED UNBLEACHED KRAFT (CUK)
8.2.1.4 OTHERS
8.3 PLASTIC
8.3.1 PLASTIC, BY MATERIAL TYPE
8.3.1.1 BIO-BASED PLASTIC
8.3.1.2 BIODEGRADABLE PLASTIC
8.3.1.3 OTHERS
8.4 GLASS
8.4.1 GLASS, BY MATERIAL TYPE
8.4.1.1 SODA ASH
8.4.1.2 SAND
8.4.1.3 LIMESTONE
8.5 METAL
8.5.1 METAL, BY MATERIAL TYPE
8.5.1.1 ALUMINIUM
8.5.1.2 STEEL
8.5.1.3 OTHER
8.6 STARCH-BASED MATERIALS
8.7 OTHERS
9 MIDDLE EAST & AFRICA ECO-FRIENDLY PACKAGING MARKET, BY PRODUCT TYPE
9.1 OVERVIEW
9.2 BOXES
9.3 BAGS
9.4 POUCHES & SACHETS
9.5 CONTAINERS
9.6 BOTTLES & JARS
9.7 CANS
9.8 FILMS
9.9 TUBES
9.1 TRAYS
9.11 OTHERS
10 MIDDLE EAST & AFRICA ECO-FRIENDLY PACKAGING MARKET, BY TECHNIQUE
10.1 OVERVIEW
10.2 ALTERNATE FIBER PACKAGING
10.2.1 ALTERNATE FIBER PACKAGING, BY TECHNIQUE
10.2.1.1 BAMBOO FIBER
10.2.1.2 MUSHROOM PACKAGING
10.2.1.3 OTHERS
10.3 MOLDED PACKAGING
10.3.1 MOLDED PACKAGING, BY TECHNIQUE
10.3.1.1 TRANSFER MOLDED PULP PACKAGING
10.3.1.2 THICK WALL PULP PACKAGING
10.3.1.3 THERMOFORMED PULP PACKAGING
10.3.1.4 PROCESSED PULP PACKAGING
10.4 ACTIVE PACKAGING
10.4.1 ACTIVE PACKAGING, BY TECHNIQUE
10.4.1.1 MODIFIED ATMOSPHERE PACKAGING (MAP)
10.4.1.2 ANTIMICROBIAL PACKAGING
10.4.1.3 BARRIER PACKAGING
10.5 OTHERS
11 MIDDLE EAST & AFRICA ECO-FRIENDLY PACKAGING MARKET, BY LAYER
11.1 OVERVIEW
11.2 PRIMARY PACKAGING
11.3 SECONDARY PACKAGING
11.4 TERTIARY PACKAGING
12 MIDDLE EAST & AFRICA ECO-FRIENDLY PACKAGING MARKET, BY APPLICATION
12.1 OVERVIEW
12.2 FOOD
12.2.1 FOOD, BY APPLICATION
12.2.1.1 BAKERY & CONFECTIONARY
12.2.1.2 DAIRY PRODUCTS
12.2.1.3 READY TO EAT FOOD
12.2.1.4 FROZEN FOOD
12.2.1.5 FRUITS & VEGETABLES
12.2.1.6 MEAT PRODUCTS
12.2.1.7 OTHERS
12.2.2 FOOD, BY TYPE
12.2.2.1 REUSABLE PACKAGING
12.2.2.2 RECYCLED CONTENT PACKAGING
12.2.2.3 DEGRADABLE PACKAGING
12.3 BEVERAGES
12.3.1 BEVERAGES, BY APPLICATION
12.3.1.1 NON-ALCOHOLIC
12.3.1.2 ALCOHOLIC
12.3.2 BEVERAGES, BY TYPE
12.3.2.1 REUSABLE PACKAGING
12.3.2.2 RECYCLED CONTENT PACKAGING
12.3.2.3 DEGRADABLE PACKAGING
12.4 PHARMACEUTICALS
12.4.1 PHARMACEUTICALS, BY TYPE
12.4.1.1 REUSABLE PACKAGING
12.4.1.2 RECYCLED CONTENT PACKAGING
12.4.1.3 DEGRADABLE PACKAGING
12.5 PERSONAL CARE
12.5.1 PERSONAL CARE, BY TYPE
12.5.1.1 REUSABLE PACKAGING
12.5.1.2 RECYCLED CONTENT PACKAGING
12.5.1.3 DEGRADABLE PACKAGING
12.6 HOME CARE
12.6.1 HOME CARE, BY TYPE
12.6.1.1 REUSABLE PACKAGING
12.6.1.2 RECYCLED CONTENT PACKAGING
12.6.1.3 DEGRADABLE PACKAGING
12.7 OTHERS
12.7.1 OTHERS, BY TYPE
12.7.1.1 REUSABLE PACKAGING
12.7.1.2 RECYCLED CONTENT PACKAGING
12.7.1.3 DEGRADABLE PACKAGING
13 MIDDLE EAST & AFRICA ECO-FRIENDLY PACKAGING MARKET, BY REGION
13.1 MIDDLE EAST AND AFRICA
13.1.1 UNITED ARAB EMIRATE
13.1.2 SAUDI ARABIA
13.1.3 SOUTH AFRICA
13.1.4 EGYPT
13.1.5 ISRAEL
13.1.6 REST OF MIDDLE EAST AND AFRICA
14 MIDDLE EAST & AFRICA ECO-FRIENDLY PACKAGING MARKET, COMPANY LANDSCAPE
14.1 COMPANY SHARE ANALYSIS: MIDDLE EAST & AFRICA
14.2 MERGER & ACQUISITION
14.3 EXPANSIONS
14.4 NEW PRODUCT DEVELOPMENT
14.5 AWARD
14.6 PARTNERSHIP
15 SWOT ANALYSIS
16 COMPANY PROFILE
16.1 WEST ROCK COMPANY
16.1.1 COMPANY SNAPSHOT
16.1.2 REVENUE ANALYSIS
16.1.3 COMPANY SHARE ANALYSIS
16.1.4 PRODUCT PORTFOLIO
16.1.5 RECENT UPDATES
16.2 CROWN HOLDING, INC.
16.2.1 COMPANY SNAPSHOT
16.2.2 REVENUE ANALYSIS
16.2.3 COMPANY SHARE ANALYSIS
16.2.4 PRODUCT PORTFOLIO
16.2.5 RECENT UPDATES
16.3 AMCOR PLC
16.3.1 COMPANY SNAPSHOT
16.3.2 REVENUE ANALYSIS
16.3.3 COMPANY SHARE ANALYSIS
16.3.4 PRODUCT PORTFOLIO
16.3.5 RECENT UPDATES
16.4 TETRA PAK
16.4.1 COMPANY SNAPSHOT
16.4.2 COMPANY SHARE ANALYSIS
16.4.3 PRODUCT PORTFOLIO
16.4.4 RECENT UPDATES
16.5 BERRY MIDDLE EAST & AFRICA INC.
16.5.1 COMPANY SNAPSHOT
16.5.2 REVENUE ANALYSIS
16.5.3 COMPANY SHARE ANALYSIS
16.5.4 PRODUCT PORTFOLIO
16.5.5 RECENT UPDATES
16.6 SMUFIT KAPPA
16.6.1 COMPANY SNAPSHOT
16.6.2 REVENUE ANALYSIS
16.6.3 PRODUCT PORTFOLIO
16.6.4 RECENT UPDATES
16.7 DS SMITH
16.7.1 COMPANY SNAPSHOT
16.7.2 REVENUE ANALYSIS
16.7.3 PRODUCT PORTFOLIO
16.7.4 RECENT UPDATES
16.8 MONDI
16.8.1 COMPANY SNAPSHOT
16.8.2 REVENUE ANALYSIS
16.8.3 PRODUCT PORTFOLIO
16.8.4 RECENT UPDATES
16.9 ARDAGH GROUP S.A.
16.9.1 COMPANY SNAPSHOT
16.9.2 REVENUE ANALYSIS
16.9.3 PRODUCT PORTFOLIO
16.9.4 RECENT UPDATES
16.1 BALL CORPORATION
16.10.1 COMPANY SNAPSHOT
16.10.2 REVENUE ANALYSIS
16.10.3 PRODUCT PORTFOLIO
16.10.4 RECENT UPDATES
16.11 ELOPAK
16.11.1 COMPANY SNAPSHOT
16.11.2 PRODUCT PORTFOLIO
16.11.3 RECENT UPDATES
16.12 EMERALD PACKAGING
16.12.1 COMPANY SNAPSHOT
16.12.2 PRODUCT PORTFOLIO
16.12.3 RECENT UPDATES
16.13 HUHTAMAKI
16.13.1 COMPANY SNAPSHOT
16.13.2 REVENUE ANALYSIS
16.13.3 PRODUCT PORTFOLIO
16.13.4 RECENT UPDATES
16.14 NAMPAK LTD.
16.14.1 COMPANY SNAPSHOT
16.14.2 REVENUE ANALYSIS
16.14.3 PRODUCT PORTFOLIO
16.14.4 RECENT UPDATES
16.15 PACTIV EVERGREEN INC.
16.15.1 COMPANY SNAPSHOT
16.15.2 REVENUE ANALYSIS
16.15.3 PRODUCT PORTFOLIO
16.15.4 RECENT UPDATES
16.16 PLASTIPAK HOLDINGS, INC.
16.16.1 COMPANY SNAPSHOT
16.16.2 PRODUCT PORTFOLIO
16.16.3 RECENT UPDATES
16.17 PRINTPACK
16.17.1 COMPANY SNAPSHOT
16.17.2 PRODUCT PORTFOLIO
16.17.3 RECENT UPDATE
16.18 SEALED AIR
16.18.1 COMPANY SNAPSHOT
16.18.2 REVENUE ANALYSIS
16.18.3 PRODUCT PORTFOLIO
16.18.4 RECENT UPDATES
16.19 SONOCO PRODUCTS COMPANY
16.19.1 COMPANY SNAPSHOT
16.19.2 REVENUE ANALYSIS
16.19.3 PRODUCT PORTFOLIO
16.19.4 RECENT UPDATES
16.2 UFLEX LIMITED
16.20.1 COMPANY SNAPSHOT
16.20.2 REVENUE ANALYSIS
16.20.3 PRODUCT PORTFOLIO
16.20.4 RECENT UPDATES
17 QUESTIONNAIRE
18 RELATED REPORTS
Lista de Tablas
TABLE 1 IMPORT DATA OF CARTONS, BOXES, CASES, BAGS AND OTHER PACKING CONTAINERS, OF PAPER, PAPERBOARD, CELLULOSE WADDING; HS CODE - 4819 (USD THOUSAND)
TABLE 2 EXPORT DATA OF CARTONS, BOXES, CASES, BAGS AND OTHER PACKING CONTAINERS, OF PAPER, PAPERBOARD, CELLULOSE WADDING; HS CODE – 4819 (USD THOUSAND)
TABLE 3 MIDDLE EAST & AFRICA ECO-FRIENDLY PACKAGING MARKET, BY TYPE, 2020-2029 (USD MILLION)
TABLE 4 MIDDLE EAST & AFRICA ECO-FRIENDLY PACKAGING MARKET, BY TYPE, 2020-2029 (MILLION UNITS)
TABLE 5 MIDDLE EAST & AFRICA REUSABLE PACKAGING IN ECO-FRIENDLY PACKAGING MARKET, BY REGION, 2020-2029 (USD MILLION)
TABLE 6 MIDDLE EAST & AFRICA REUSABLE PACKAGING IN ECO-FRIENDLY PACKAGING MARKET, BY REGION, 2020-2029 (MILLION UNITS)
TABLE 7 MIDDLE EAST & AFRICA RECYCLED CONTENT PACKAGING IN ECO-FRIENDLY PACKAGING MARKET, BY REGION, 2020-2029 (USD MILLION)
TABLE 8 MIDDLE EAST & AFRICA RECYCLED CONTENT PACKAGING IN ECO-FRIENDLY PACKAGING MARKET, BY REGION, 2020-2029 (MILLION UNITS)
TABLE 9 MIDDLE EAST & AFRICA DEGRADABLE PACKAGING IN ECO-FRIENDLY PACKAGING MARKET, BY REGION, 2020-2029 (USD MILLION)
TABLE 10 MIDDLE EAST & AFRICA DEGRADABLE PACKAGING IN ECO-FRIENDLY PACKAGING MARKET, BY REGION, 2020-2029 (MILLION UNITS)
TABLE 11 MIDDLE EAST & AFRICA ECO-FRIENDLY PACKAGING MARKET, BY MATERIAL TYPE, 2020-2029 (USD MILLION)
TABLE 12 MIDDLE EAST & AFRICA PAPER & PAPER BOARD IN ECO-FRIENDLY PACKAGING MARKET, BY REGION, 2020-2029 (USD MILLION)
TABLE 13 MIDDLE EAST & AFRICA PAPER & PAPER BOARD IN ECO-FRIENDLY PACKAGING MARKET, BY MATERIAL TYPE, 2020-2029 (USD MILLION)
TABLE 14 MIDDLE EAST & AFRICA PLASTIC IN ECO-FRIENDLY PACKAGING MARKET, BY REGION, 2020-2029 (USD MILLION)
TABLE 15 MIDDLE EAST & AFRICA PLASTIC IN ECO-FRIENDLY PACKAGING MARKET, BY MATERIAL TYPE, 2020-2029 (USD MILLION)
TABLE 16 MIDDLE EAST & AFRICA GLASS IN ECO-FRIENDLY PACKAGING MARKET, BY REGION, 2020-2029 (USD MILLION)
TABLE 17 MIDDLE EAST & AFRICA GLASS IN ECO-FRIENDLY PACKAGING MARKET, BY MATERIAL TYPE, 2020-2029 (USD MILLION)
TABLE 18 MIDDLE EAST & AFRICA METAL IN ECO-FRIENDLY PACKAGING MARKET, BY REGION, 2020-2029 (USD MILLION)
TABLE 19 MIDDLE EAST & AFRICA METAL IN ECO-FRIENDLY PACKAGING MARKET, BY MATERIAL TYPE, 2020-2029 (USD MILLION)
TABLE 20 MIDDLE EAST & AFRICA STARCH-BASED MATERIALS IN ECO-FRIENDLY PACKAGING MARKET, BY REGION, 2020-2029 (USD MILLION)
TABLE 21 MIDDLE EAST & AFRICA OTHERS IN ECO-FRIENDLY PACKAGING MARKET, BY REGION, 2020-2029 (USD MILLION)
TABLE 22 MIDDLE EAST & AFRICA ECO-FRIENDLY PACKAGING MARKET, BY PRODUCT TYPE, 2020-2029 (USD MILLION)
TABLE 23 MIDDLE EAST & AFRICA BOXES IN ECO-FRIENDLY PACKAGING MARKET, BY REGION, 2020-2029 (USD MILLION)
TABLE 24 MIDDLE EAST & AFRICA BAGS IN ECO-FRIENDLY PACKAGING MARKET, BY REGION, 2020-2029 (USD MILLION)
TABLE 25 MIDDLE EAST & AFRICA POUCHES & SACHETS IN ECO-FRIENDLY PACKAGING MARKET, BY REGION, 2020-2029 (USD MILLION)
TABLE 26 MIDDLE EAST & AFRICA CONTAINERS IN ECO-FRIENDLY PACKAGING MARKET, BY REGION, 2020-2029 (USD MILLION)
TABLE 27 MIDDLE EAST & AFRICA BOTTLES & JARS IN ECO-FRIENDLY PACKAGING MARKET, BY REGION, 2020-2029 (USD MILLION)
TABLE 28 MIDDLE EAST & AFRICA CANS IN ECO-FRIENDLY PACKAGING MARKET, BY REGION, 2020-2029 (USD MILLION)
TABLE 29 MIDDLE EAST & AFRICA FILMS IN ECO-FRIENDLY PACKAGING MARKET, BY REGION, 2020-2029 (USD MILLION)
TABLE 30 MIDDLE EAST & AFRICA TUBES IN ECO-FRIENDLY PACKAGING MARKET, BY REGION, 2020-2029 (USD MILLION)
TABLE 31 MIDDLE EAST & AFRICA TRAYS IN ECO-FRIENDLY PACKAGING MARKET, BY REGION, 2020-2029 (USD MILLION)
TABLE 32 MIDDLE EAST & AFRICA OTHERS IN ECO-FRIENDLY PACKAGING MARKET, BY REGION, 2020-2029 (USD MILLION)
TABLE 33 MIDDLE EAST & AFRICA ECO-FRIENDLY PACKAGING MARKET, BY TECHNIQUE, 2020-2029 (USD MILLION)
TABLE 34 MIDDLE EAST & AFRICA ALTERNATE FIBER PACKAGING IN ECO-FRIENDLY PACKAGING MARKET, BY REGION, 2020-2029 (USD MILLION)
TABLE 35 MIDDLE EAST & AFRICA ALTERNATE FIBER PACKAGING IN ECO-FRIENDLY PACKAGING MARKET, BY TECHNIQUE, 2020-2029 (USD MILLION)
TABLE 36 MIDDLE EAST & AFRICA MOLDED PACKAGING IN ECO-FRIENDLY PACKAGING MARKET, BY REGION, 2020-2029 (USD MILLION)
TABLE 37 MIDDLE EAST & AFRICA MOLDED PACKAGING IN ECO-FRIENDLY PACKAGING MARKET, BY TECHNIQUE, 2020-2029 (USD MILLION)
TABLE 38 MIDDLE EAST & AFRICA ACTIVE PACKAGING IN ECO-FRIENDLY PACKAGING MARKET, BY REGION, 2020-2029 (USD MILLION)
TABLE 39 MIDDLE EAST & AFRICA ACTIVE PACKAGING IN ECO-FRIENDLY PACKAGING MARKET, BY TECHNIQUE, 2020-2029 (USD MILLION)
TABLE 40 MIDDLE EAST & AFRICA OTHERS IN ECO-FRIENDLY PACKAGING MARKET, BY REGION, 2020-2029 (USD MILLION)
TABLE 41 MIDDLE EAST & AFRICA ECO-FRIENDLY PACKAGING MARKET, BY LAYER, 2020-2029 (USD MILLION)
TABLE 42 MIDDLE EAST & AFRICA PRIMARY PACKAGING IN ECO-FRIENDLY PACKAGING MARKET, BY REGION, 2020-2029 (USD MILLION)
TABLE 43 MIDDLE EAST & AFRICA SECONDARY PACKAGING IN ECO-FRIENDLY PACKAGING MARKET, BY REGION, 2020-2029 (USD MILLION)
TABLE 44 MIDDLE EAST & AFRICA TERTIARY PACKAGING IN ECO-FRIENDLY PACKAGING MARKET, BY REGION, 2020-2029 (USD MILLION)
TABLE 45 MIDDLE EAST & AFRICA ECO-FRIENDLY PACKAGING MARKET, BY APPLICATION, 2020-2029 (USD MILLION)
TABLE 46 MIDDLE EAST & AFRICA FOOD IN ECO-FRIENDLY PACKAGING MARKET, BY REGION, 2020-2029 (USD MILLION)
TABLE 47 MIDDLE EAST & AFRICA FOOD IN ECO-FRIENDLY PACKAGING MARKET, BY APPLICATION, 2020-2029 (USD MILLION)
TABLE 48 MIDDLE EAST & AFRICA FOOD IN ECO-FRIENDLY PACKAGING MARKET, BY TYPE, 2020-2029 (USD MILLION)
TABLE 49 MIDDLE EAST & AFRICA BEVERAGES IN ECO-FRIENDLY PACKAGING MARKET, BY REGION, 2020-2029 (USD MILLION)
TABLE 50 MIDDLE EAST & AFRICA BEVERAGES IN ECO-FRIENDLY PACKAGING MARKET, BY APPLICATION, 2020-2029 (USD MILLION)
TABLE 51 MIDDLE EAST & AFRICA BEVERAGES IN ECO-FRIENDLY PACKAGING MARKET, BY TYPE, 2020-2029 (USD MILLION)
TABLE 52 MIDDLE EAST & AFRICA PHARMACEUTICALS IN ECO-FRIENDLY PACKAGING MARKET, BY REGION, 2020-2029 (USD MILLION)
TABLE 53 MIDDLE EAST & AFRICA PHARMACEUTICALS IN ECO-FRIENDLY PACKAGING MARKET, BY TYPE, 2020-2029 (USD MILLION)
TABLE 54 MIDDLE EAST & AFRICA PERSONAL CARE IN ECO-FRIENDLY PACKAGING MARKET, BY REGION, 2020-2029 (USD MILLION)
TABLE 55 MIDDLE EAST & AFRICA PERSONAL CARE IN ECO-FRIENDLY PACKAGING MARKET, BY TYPE, 2020-2029 (USD MILLION)
TABLE 56 MIDDLE EAST & AFRICA HOME CARE IN ECO-FRIENDLY PACKAGING MARKET, BY REGION, 2020-2029 (USD MILLION)
TABLE 57 MIDDLE EAST & AFRICA HOME CARE IN ECO-FRIENDLY PACKAGING MARKET, BY TYPE, 2020-2029 (USD MILLION)
TABLE 58 MIDDLE EAST & AFRICA OTHERS IN ECO-FRIENDLY PACKAGING MARKET, BY REGION, 2020-2029 (USD MILLION)
TABLE 59 MIDDLE EAST & AFRICA OTHERS IN ECO-FRIENDLY PACKAGING MARKET, BY TYPE, 2020-2029 (USD MILLION)
TABLE 60 MIDDLE EAST AND AFRICA ECO-FRIENDLY PACKAGING MARKET, BY COUNTRY, 2020-2029 (USD MILLION)
TABLE 61 MIDDLE EAST AND AFRICA ECO-FRIENDLY PACKAGING MARKET, BY COUNTRY, 2020-2029 (MILLION UNITS)
TABLE 62 MIDDLE EAST AND AFRICA ECO-FRIENDLY PACKAGING MARKET, BY TYPE, 2020-2029 (USD MILLION)
TABLE 63 MIDDLE EAST AND AFRICA ECO-FRIENDLY PACKAGING MARKET, BY TYPE, 2020-2029 (MILLION UNITS)
TABLE 64 MIDDLE EAST AND AFRICA ECO-FRIENDLY PACKAGING MARKET, BY MATERIAL TYPE, 2020-2029 (USD MILLION)
TABLE 65 MIDDLE EAST AND AFRICA PAPER & PAPER BOARD IN ECO-FRIENDLY PACKAGING MARKET, BY MATERIAL TYPE, 2020-2029 (USD MILLION)
TABLE 66 MIDDLE EAST AND AFRICA PLASTIC IN ECO-FRIENDLY PACKAGING MARKET, BY MATERIAL TYPE, 2020-2029 (USD MILLION)
TABLE 67 MIDDLE EAST AND AFRICA METAL IN ECO-FRIENDLY PACKAGING MARKET, BY MATERIAL TYPE, 2020-2029 (USD MILLION)
TABLE 68 MIDDLE EAST AND AFRICA GLASS IN ECO-FRIENDLY PACKAGING MARKET, BY MATERIAL TYPE, 2020-2029 (USD MILLION)
TABLE 69 MIDDLE EAST AND AFRICA ECO-FRIENDLY PACKAGING MARKET, BY PRODUCT TYPE, 2020-2029 (USD MILLION)
TABLE 70 MIDDLE EAST AND AFRICA ECO-FRIENDLY PACKAGING MARKET, BY TECHNIQUE, 2020-2029 (USD MILLION)
TABLE 71 MIDDLE EAST AND AFRICA ACTIVE PACKAGING IN ECO-FRIENDLY PACKAGING MARKET, BY TECHNIQUE, 2020-2029 (USD MILLION)
TABLE 72 MIDDLE EAST AND AFRICA MOLDED PACKAGING IN ECO-FRIENDLY PACKAGING MARKET, BY TECHNIQUE, 2020-2029 (USD MILLION)
TABLE 73 MIDDLE EAST AND AFRICA ALTERNATE FIBER PACKAGING IN ECO-FRIENDLY PACKAGING MARKET, BY TECHNIQUE, 2020-2029 (USD MILLION)
TABLE 74 MIDDLE EAST AND AFRICA ECO-FRIENDLY PACKAGING MARKET, BY LAYER, 2020-2029 (USD MILLION)
TABLE 75 MIDDLE EAST AND AFRICA ECO-FRIENDLY PACKAGING MARKET, BY APPLICATION, 2020-2029 (USD MILLION)
TABLE 76 MIDDLE EAST AND AFRICA FOOD IN ECO-FRIENDLY PACKAGING MARKET, BY APPLICATION, 2020-2029 (USD MILLION)
TABLE 77 MIDDLE EAST AND AFRICA FOOD IN ECO-FRIENDLY PACKAGING MARKET, BY TYPE, 2020-2029 (USD MILLION)
TABLE 78 MIDDLE EAST AND AFRICA BEVERAGES IN ECO-FRIENDLY PACKAGING MARKET, BY APPLICATION, 2020-2029 (USD MILLION)
TABLE 79 MIDDLE EAST AND AFRICA BEVERAGES IN ECO-FRIENDLY PACKAGING MARKET, BY TYPE, 2020-2029 (USD MILLION)
TABLE 80 MIDDLE EAST AND AFRICA PHARMACEUTICALS IN ECO-FRIENDLY PACKAGING MARKET, BY TYPE, 2020-2029 (USD MILLION)
TABLE 81 MIDDLE EAST AND AFRICA PERSONAL CARE IN ECO-FRIENDLY PACKAGING MARKET, BY TYPE, 2020-2029 (USD MILLION)
TABLE 82 MIDDLE EAST AND AFRICA HOME CARE IN ECO-FRIENDLY PACKAGING MARKET, BY TYPE, 2020-2029 (USD MILLION)
TABLE 83 MIDDLE EAST AND AFRICA OTHERS IN ECO-FRIENDLY PACKAGING MARKET, BY TYPE, 2020-2029 (USD MILLION)
TABLE 84 UNITED ARAB EMIRATE ECO-FRIENDLY PACKAGING MARKET, BY TYPE, 2020-2029 (USD MILLION)
TABLE 85 UNITED ARAB EMIRATE ECO-FRIENDLY PACKAGING MARKET, BY TYPE, 2020-2029 (MILLION UNITS)
TABLE 86 UNITED ARAB EMIRATE ECO-FRIENDLY PACKAGING MARKET, BY MATERIAL TYPE, 2020-2029 (USD MILLION)
TABLE 87 UNITED ARAB EMIRATE PAPER & PAPER BOARD IN ECO-FRIENDLY PACKAGING MARKET, BY MATERIAL TYPE, 2020-2029 (USD MILLION)
TABLE 88 UNITED ARAB EMIRATE PLASTIC IN ECO-FRIENDLY PACKAGING MARKET, BY MATERIAL TYPE, 2020-2029 (USD MILLION)
TABLE 89 UNITED ARAB EMIRATE METAL IN ECO-FRIENDLY PACKAGING MARKET, BY MATERIAL TYPE, 2020-2029 (USD MILLION)
TABLE 90 UNITED ARAB EMIRATE GLASS IN ECO-FRIENDLY PACKAGING MARKET, BY MATERIAL TYPE, 2020-2029 (USD MILLION)
TABLE 91 UNITED ARAB EMIRATE ECO-FRIENDLY PACKAGING MARKET, BY PRODUCT TYPE, 2020-2029 (USD MILLION)
TABLE 92 UNITED ARAB EMIRATE ECO-FRIENDLY PACKAGING MARKET, BY TECHNIQUE, 2020-2029 (USD MILLION)
TABLE 93 UNITED ARAB EMIRATE ACTIVE PACKAGING IN ECO-FRIENDLY PACKAGING MARKET, BY TECHNIQUE, 2020-2029 (USD MILLION)
TABLE 94 UNITED ARAB EMIRATE MOLDED PACKAGING IN ECO-FRIENDLY PACKAGING MARKET, BY TECHNIQUE, 2020-2029 (USD MILLION)
TABLE 95 UNITED ARAB EMIRATE ALTERNATE FIBER PACKAGING IN ECO-FRIENDLY PACKAGING MARKET, BY TECHNIQUE, 2020-2029 (USD MILLION)
TABLE 96 UNITED ARAB EMIRATE ECO-FRIENDLY PACKAGING MARKET, BY LAYER, 2020-2029 (USD MILLION)
TABLE 97 UNITED ARAB EMIRATE ECO-FRIENDLY PACKAGING MARKET, BY APPLICATION, 2020-2029 (USD MILLION)
TABLE 98 UNITED ARAB EMIRATE FOOD IN ECO-FRIENDLY PACKAGING MARKET, BY APPLICATION, 2020-2029 (USD MILLION)
TABLE 99 UNITED ARAB EMIRATE FOOD IN ECO-FRIENDLY PACKAGING MARKET, BY TYPE, 2020-2029 (USD MILLION)
TABLE 100 UNITED ARAB EMIRATE BEVERAGES IN ECO-FRIENDLY PACKAGING MARKET, BY APPLICATION, 2020-2029 (USD MILLION)
TABLE 101 UNITED ARAB EMIRATE BEVERAGES IN ECO-FRIENDLY PACKAGING MARKET, BY TYPE, 2020-2029 (USD MILLION)
TABLE 102 UNITED ARAB EMIRATE PHARMACEUTICALS IN ECO-FRIENDLY PACKAGING MARKET, BY TYPE, 2020-2029 (USD MILLION)
TABLE 103 UNITED ARAB EMIRATE PERSONAL CARE IN ECO-FRIENDLY PACKAGING MARKET, BY TYPE, 2020-2029 (USD MILLION)
TABLE 104 UNITED ARAB EMIRATE HOME CARE IN ECO-FRIENDLY PACKAGING MARKET, BY TYPE, 2020-2029 (USD MILLION)
TABLE 105 UNITED ARAB EMIRATE OTHERS IN ECO-FRIENDLY PACKAGING MARKET, BY TYPE, 2020-2029 (USD MILLION)
TABLE 106 SAUDI ARABIA ECO-FRIENDLY PACKAGING MARKET, BY TYPE, 2020-2029 (USD MILLION)
TABLE 107 SAUDI ARABIA ECO-FRIENDLY PACKAGING MARKET, BY TYPE, 2020-2029 (MILLION UNITS)
TABLE 108 SAUDI ARABIA ECO-FRIENDLY PACKAGING MARKET, BY MATERIAL TYPE, 2020-2029 (USD MILLION)
TABLE 109 SAUDI ARABIA PAPER & PAPER BOARD IN ECO-FRIENDLY PACKAGING MARKET, BY MATERIAL TYPE, 2020-2029 (USD MILLION)
TABLE 110 SAUDI ARABIA PLASTIC IN ECO-FRIENDLY PACKAGING MARKET, BY MATERIAL TYPE, 2020-2029 (USD MILLION)
TABLE 111 SAUDI ARABIA METAL IN ECO-FRIENDLY PACKAGING MARKET, BY MATERIAL TYPE, 2020-2029 (USD MILLION)
TABLE 112 SAUDI ARABIA GLASS IN ECO-FRIENDLY PACKAGING MARKET, BY MATERIAL TYPE, 2020-2029 (USD MILLION)
TABLE 113 SAUDI ARABIA ECO-FRIENDLY PACKAGING MARKET, BY PRODUCT TYPE, 2020-2029 (USD MILLION)
TABLE 114 SAUDI ARABIA ECO-FRIENDLY PACKAGING MARKET, BY TECHNIQUE, 2020-2029 (USD MILLION)
TABLE 115 SAUDI ARABIA ACTIVE PACKAGING IN ECO-FRIENDLY PACKAGING MARKET, BY TECHNIQUE, 2020-2029 (USD MILLION)
TABLE 116 SAUDI ARABIA MOLDED PACKAGING IN ECO-FRIENDLY PACKAGING MARKET, BY TECHNIQUE, 2020-2029 (USD MILLION)
TABLE 117 SAUDI ARABIA ALTERNATE FIBER PACKAGING IN ECO-FRIENDLY PACKAGING MARKET, BY TECHNIQUE, 2020-2029 (USD MILLION)
TABLE 118 SAUDI ARABIA ECO-FRIENDLY PACKAGING MARKET, BY LAYER, 2020-2029 (USD MILLION)
TABLE 119 SAUDI ARABIA ECO-FRIENDLY PACKAGING MARKET, BY APPLICATION, 2020-2029 (USD MILLION)
TABLE 120 SAUDI ARABIA FOOD IN ECO-FRIENDLY PACKAGING MARKET, BY APPLICATION, 2020-2029 (USD MILLION)
TABLE 121 SAUDI ARABIA FOOD IN ECO-FRIENDLY PACKAGING MARKET, BY TYPE, 2020-2029 (USD MILLION)
TABLE 122 SAUDI ARABIA BEVERAGES IN ECO-FRIENDLY PACKAGING MARKET, BY APPLICATION, 2020-2029 (USD MILLION)
TABLE 123 SAUDI ARABIA BEVERAGES IN ECO-FRIENDLY PACKAGING MARKET, BY TYPE, 2020-2029 (USD MILLION)
TABLE 124 SAUDI ARABIA PHARMACEUTICALS IN ECO-FRIENDLY PACKAGING MARKET, BY TYPE, 2020-2029 (USD MILLION)
TABLE 125 SAUDI ARABIA PERSONAL CARE IN ECO-FRIENDLY PACKAGING MARKET, BY TYPE, 2020-2029 (USD MILLION)
TABLE 126 SAUDI ARABIA HOME CARE IN ECO-FRIENDLY PACKAGING MARKET, BY TYPE, 2020-2029 (USD MILLION)
TABLE 127 SAUDI ARABIA OTHERS IN ECO-FRIENDLY PACKAGING MARKET, BY TYPE, 2020-2029 (USD MILLION)
TABLE 128 SOUTH AFRICA ECO-FRIENDLY PACKAGING MARKET, BY TYPE, 2020-2029 (USD MILLION)
TABLE 129 SOUTH AFRICA ECO-FRIENDLY PACKAGING MARKET, BY TYPE, 2020-2029 (MILLION UNITS)
TABLE 130 SOUTH AFRICA ECO-FRIENDLY PACKAGING MARKET, BY MATERIAL TYPE, 2020-2029 (USD MILLION)
TABLE 131 SOUTH AFRICA PAPER & PAPER BOARD IN ECO-FRIENDLY PACKAGING MARKET, BY MATERIAL TYPE, 2020-2029 (USD MILLION)
TABLE 132 SOUTH AFRICA PLASTIC IN ECO-FRIENDLY PACKAGING MARKET, BY MATERIAL TYPE, 2020-2029 (USD MILLION)
TABLE 133 SOUTH AFRICA METAL IN ECO-FRIENDLY PACKAGING MARKET, BY MATERIAL TYPE, 2020-2029 (USD MILLION)
TABLE 134 SOUTH AFRICA GLASS IN ECO-FRIENDLY PACKAGING MARKET, BY MATERIAL TYPE, 2020-2029 (USD MILLION)
TABLE 135 SOUTH AFRICA ECO-FRIENDLY PACKAGING MARKET, BY PRODUCT TYPE, 2020-2029 (USD MILLION)
TABLE 136 SOUTH AFRICA ECO-FRIENDLY PACKAGING MARKET, BY TECHNIQUE, 2020-2029 (USD MILLION)
TABLE 137 SOUTH AFRICA ACTIVE PACKAGING IN ECO-FRIENDLY PACKAGING MARKET, BY TECHNIQUE, 2020-2029 (USD MILLION)
TABLE 138 SOUTH AFRICA MOLDED PACKAGING IN ECO-FRIENDLY PACKAGING MARKET, BY TECHNIQUE, 2020-2029 (USD MILLION)
TABLE 139 SOUTH AFRICA ALTERNATE FIBER PACKAGING IN ECO-FRIENDLY PACKAGING MARKET, BY TECHNIQUE, 2020-2029 (USD MILLION)
TABLE 140 SOUTH AFRICA ECO-FRIENDLY PACKAGING MARKET, BY LAYER, 2020-2029 (USD MILLION)
TABLE 141 SOUTH AFRICA ECO-FRIENDLY PACKAGING MARKET, BY APPLICATION, 2020-2029 (USD MILLION)
TABLE 142 SOUTH AFRICA FOOD IN ECO-FRIENDLY PACKAGING MARKET, BY APPLICATION, 2020-2029 (USD MILLION)
TABLE 143 SOUTH AFRICA FOOD IN ECO-FRIENDLY PACKAGING MARKET, BY TYPE, 2020-2029 (USD MILLION)
TABLE 144 SOUTH AFRICA BEVERAGES IN ECO-FRIENDLY PACKAGING MARKET, BY APPLICATION, 2020-2029 (USD MILLION)
TABLE 145 SOUTH AFRICA BEVERAGES IN ECO-FRIENDLY PACKAGING MARKET, BY TYPE, 2020-2029 (USD MILLION)
TABLE 146 SOUTH AFRICA PHARMACEUTICALS IN ECO-FRIENDLY PACKAGING MARKET, BY TYPE, 2020-2029 (USD MILLION)
TABLE 147 SOUTH AFRICA PERSONAL CARE IN ECO-FRIENDLY PACKAGING MARKET, BY TYPE, 2020-2029 (USD MILLION)
TABLE 148 SOUTH AFRICA HOME CARE IN ECO-FRIENDLY PACKAGING MARKET, BY TYPE, 2020-2029 (USD MILLION)
TABLE 149 SOUTH AFRICA OTHERS IN ECO-FRIENDLY PACKAGING MARKET, BY TYPE, 2020-2029 (USD MILLION)
TABLE 150 EGYPT ECO-FRIENDLY PACKAGING MARKET, BY TYPE, 2020-2029 (USD MILLION)
TABLE 151 EGYPT ECO-FRIENDLY PACKAGING MARKET, BY TYPE, 2020-2029 (MILLION UNITS)
TABLE 152 EGYPT ECO-FRIENDLY PACKAGING MARKET, BY MATERIAL TYPE, 2020-2029 (USD MILLION)
TABLE 153 EGYPT PAPER & PAPER BOARD IN ECO-FRIENDLY PACKAGING MARKET, BY MATERIAL TYPE, 2020-2029 (USD MILLION)
TABLE 154 EGYPT PLASTIC IN ECO-FRIENDLY PACKAGING MARKET, BY MATERIAL TYPE, 2020-2029 (USD MILLION)
TABLE 155 EGYPT METAL IN ECO-FRIENDLY PACKAGING MARKET, BY MATERIAL TYPE, 2020-2029 (USD MILLION)
TABLE 156 EGYPT GLASS IN ECO-FRIENDLY PACKAGING MARKET, BY MATERIAL TYPE, 2020-2029 (USD MILLION)
TABLE 157 EGYPT ECO-FRIENDLY PACKAGING MARKET, BY PRODUCT TYPE, 2020-2029 (USD MILLION)
TABLE 158 EGYPT ECO-FRIENDLY PACKAGING MARKET, BY TECHNIQUE, 2020-2029 (USD MILLION)
TABLE 159 EGYPT ACTIVE PACKAGING IN ECO-FRIENDLY PACKAGING MARKET, BY TECHNIQUE, 2020-2029 (USD MILLION)
TABLE 160 EGYPT MOLDED PACKAGING IN ECO-FRIENDLY PACKAGING MARKET, BY TECHNIQUE, 2020-2029 (USD MILLION)
TABLE 161 EGYPT ALTERNATE FIBER PACKAGING IN ECO-FRIENDLY PACKAGING MARKET, BY TECHNIQUE, 2020-2029 (USD MILLION)
TABLE 162 EGYPT ECO-FRIENDLY PACKAGING MARKET, BY LAYER, 2020-2029 (USD MILLION)
TABLE 163 EGYPT ECO-FRIENDLY PACKAGING MARKET, BY APPLICATION, 2020-2029 (USD MILLION)
TABLE 164 EGYPT FOOD IN ECO-FRIENDLY PACKAGING MARKET, BY APPLICATION, 2020-2029 (USD MILLION)
TABLE 165 EGYPT FOOD IN ECO-FRIENDLY PACKAGING MARKET, BY TYPE, 2020-2029 (USD MILLION)
TABLE 166 EGYPT BEVERAGES IN ECO-FRIENDLY PACKAGING MARKET, BY APPLICATION, 2020-2029 (USD MILLION)
TABLE 167 EGYPT BEVERAGES IN ECO-FRIENDLY PACKAGING MARKET, BY TYPE, 2020-2029 (USD MILLION)
TABLE 168 EGYPT PHARMACEUTICALS IN ECO-FRIENDLY PACKAGING MARKET, BY TYPE, 2020-2029 (USD MILLION)
TABLE 169 EGYPT PERSONAL CARE IN ECO-FRIENDLY PACKAGING MARKET, BY TYPE, 2020-2029 (USD MILLION)
TABLE 170 EGYPT HOME CARE IN ECO-FRIENDLY PACKAGING MARKET, BY TYPE, 2020-2029 (USD MILLION)
TABLE 171 EGYPT OTHERS IN ECO-FRIENDLY PACKAGING MARKET, BY TYPE, 2020-2029 (USD MILLION)
TABLE 172 ISRAEL ECO-FRIENDLY PACKAGING MARKET, BY TYPE, 2020-2029 (USD MILLION)
TABLE 173 ISRAEL ECO-FRIENDLY PACKAGING MARKET, BY TYPE, 2020-2029 (MILLION UNITS)
TABLE 174 ISRAEL ECO-FRIENDLY PACKAGING MARKET, BY MATERIAL TYPE, 2020-2029 (USD MILLION)
TABLE 175 ISRAEL PAPER & PAPER BOARD IN ECO-FRIENDLY PACKAGING MARKET, BY MATERIAL TYPE, 2020-2029 (USD MILLION)
TABLE 176 ISRAEL PLASTIC IN ECO-FRIENDLY PACKAGING MARKET, BY MATERIAL TYPE, 2020-2029 (USD MILLION)
TABLE 177 ISRAEL METAL IN ECO-FRIENDLY PACKAGING MARKET, BY MATERIAL TYPE, 2020-2029 (USD MILLION)
TABLE 178 ISRAEL GLASS IN ECO-FRIENDLY PACKAGING MARKET, BY MATERIAL TYPE, 2020-2029 (USD MILLION)
TABLE 179 ISRAEL ECO-FRIENDLY PACKAGING MARKET, BY PRODUCT TYPE, 2020-2029 (USD MILLION)
TABLE 180 ISRAEL ECO-FRIENDLY PACKAGING MARKET, BY TECHNIQUE, 2020-2029 (USD MILLION)
TABLE 181 ISRAEL ACTIVE PACKAGING IN ECO-FRIENDLY PACKAGING MARKET, BY TECHNIQUE, 2020-2029 (USD MILLION)
TABLE 182 ISRAEL MOLDED PACKAGING IN ECO-FRIENDLY PACKAGING MARKET, BY TECHNIQUE, 2020-2029 (USD MILLION)
TABLE 183 ISRAEL ALTERNATE FIBER PACKAGING IN ECO-FRIENDLY PACKAGING MARKET, BY TECHNIQUE, 2020-2029 (USD MILLION)
TABLE 184 ISRAEL ECO-FRIENDLY PACKAGING MARKET, BY LAYER, 2020-2029 (USD MILLION)
TABLE 185 ISRAEL ECO-FRIENDLY PACKAGING MARKET, BY APPLICATION, 2020-2029 (USD MILLION)
TABLE 186 ISRAEL FOOD IN ECO-FRIENDLY PACKAGING MARKET, BY APPLICATION, 2020-2029 (USD MILLION)
TABLE 187 ISRAEL FOOD IN ECO-FRIENDLY PACKAGING MARKET, BY TYPE, 2020-2029 (USD MILLION)
TABLE 188 ISRAEL BEVERAGES IN ECO-FRIENDLY PACKAGING MARKET, BY APPLICATION, 2020-2029 (USD MILLION)
TABLE 189 ISRAEL BEVERAGES IN ECO-FRIENDLY PACKAGING MARKET, BY TYPE, 2020-2029 (USD MILLION)
TABLE 190 ISRAEL PHARMACEUTICALS IN ECO-FRIENDLY PACKAGING MARKET, BY TYPE, 2020-2029 (USD MILLION)
TABLE 191 ISRAEL PERSONAL CARE IN ECO-FRIENDLY PACKAGING MARKET, BY TYPE, 2020-2029 (USD MILLION)
TABLE 192 ISRAEL HOME CARE IN ECO-FRIENDLY PACKAGING MARKET, BY TYPE, 2020-2029 (USD MILLION)
TABLE 193 ISRAEL OTHERS IN ECO-FRIENDLY PACKAGING MARKET, BY TYPE, 2020-2029 (USD MILLION)
TABLE 194 REST OF MIDDLE EAST AND AFRICA ECO-FRIENDLY PACKAGING MARKET, BY TYPE, 2020-2029 (USD MILLION)
TABLE 195 REST OF MIDDLE EAST AND AFRICA ECO-FRIENDLY PACKAGING MARKET, BY TYPE, 2020-2029 (MILLION UNITS)
Lista de figuras
FIGURE 1 MIDDLE EAST & AFRICA ECO-FRIENDLY PACKAGING MARKET
FIGURE 2 MIDDLE EAST & AFRICA ECO-FRIENDLY PACKAGING MARKET: DATA TRIANGULATION
FIGURE 3 MIDDLE EAST & AFRICA ECO-FRIENDLY PACKAGING MARKET: DROC ANALYSIS
FIGURE 4 MIDDLE EAST & AFRICA ECO-FRIENDLY PACKAGING MARKET: MIDDLE EAST & AFRICA VS REGIONAL MARKET ANALYSIS
FIGURE 5 MIDDLE EAST & AFRICA ECO-FRIENDLY PACKAGING MARKET: COMPANY RESEARCH ANALYSIS
FIGURE 6 MIDDLE EAST & AFRICA ECO-FRIENDLY PACKAGING MARKET: THE TYPE LIFE LINE CURVE
FIGURE 7 MIDDLE EAST & AFRICA ECO-FRIENDLY PACKAGING MARKET: MULTIVARIATE MODELLING
FIGURE 8 MIDDLE EAST & AFRICA ECO-FRIENDLY PACKAGING MARKET: INTERVIEW DEMOGRAPHICS
FIGURE 9 MIDDLE EAST & AFRICA ECO-FRIENDLY PACKAGING MARKET: DBMR MARKET POSITION GRID
FIGURE 10 MIDDLE EAST & AFRICA ECO-FRIENDLY PACKAGING MARKET: MARKET APPLICATION COVERAGE GRID
FIGURE 11 MIDDLE EAST & AFRICA ECO-FRIENDLY PACKAGING MARKET: THE MARKET CHALLENGE MATRIX
FIGURE 12 MIDDLE EAST & AFRICA ECO-FRIENDLY PACKAGING MARKET: VENDOR SHARE ANALYSIS
FIGURE 13 MIDDLE EAST & AFRICA ECO-FRIENDLY PACKAGING MARKET: SEGMENTATION
FIGURE 14 ASIA-PACIFIC IS EXPECTED TO DOMINATE THE MIDDLE EAST & AFRICA ECO-FRIENDLY PACKAGING MARKET AND IS EXPECTED TO GROW WITH THE HIGHEST CAGR IN THE FORECAST PERIOD OF 2022 TO 2029
FIGURE 15 CHANGING CONSUMER PREFERENCES TOWARDS CONVENIENCE AND PACKAGED FOODS IS DRIVING MIDDLE EAST & AFRICA ECO-FRIENDLY PACKAGING MARKET IN THE FORECAST PERIOD OF 2022 TO 2029
FIGURE 16 REUSABLE PACKAGING SEGMENT IS EXPECTED TO ACCOUNT FOR THE LARGEST SHARE OF THE MIDDLE EAST & AFRICA ECO-FRIENDLY PACKAGING MARKET IN 2022 & 2029
FIGURE 17 DRIVERS, RESTRAINTS, OPPORTUNITIES, AND CHALLENGES OF MIDDLE EAST & AFRICA ECO-FRIENDLY PACKAGING MARKET
FIGURE 18 PLASTIC WASTE GENERATED BY KEY COUNTRIES, 2021
FIGURE 19 CARDBOARD COSTS IN MONTH OF MAY 2020 & 2021
FIGURE 20 MIDDLE EAST & AFRICA ECO-FRIENDLY PACKAGING MARKET, BY TYPE, 2021
FIGURE 21 MIDDLE EAST & AFRICA ECO-FRIENDLY PACKAGING MARKET, BY MATERIAL TYPE, 2021
FIGURE 22 MIDDLE EAST & AFRICA ECO-FRIENDLY PACKAGING MARKET, BY PRODUCT TYPE, 2021
FIGURE 23 MIDDLE EAST & AFRICA ECO-FRIENDLY PACKAGING MARKET, BY TECHNIQUE, 2021
FIGURE 24 MIDDLE EAST & AFRICA ECO-FRIENDLY PACKAGING MARKET, BY LAYER, 2021
FIGURE 25 MIDDLE EAST & AFRICA ECO-FRIENDLY PACKAGING MARKET, BY APPLICATION, 2021
FIGURE 26 MIDDLE EAST AND AFRICA ECO-FRIENDLY PACKAGING MARKET: SNAPSHOT (2021)
FIGURE 27 MIDDLE EAST AND AFRICA ECO-FRIENDLY PACKAGING MARKET: BY COUNTRY (2021)
FIGURE 28 MIDDLE EAST AND AFRICA ECO-FRIENDLY PACKAGING MARKET: BY COUNTRY (2022 & 2029)
FIGURE 29 MIDDLE EAST AND AFRICA ECO-FRIENDLY PACKAGING MARKET: BY COUNTRY (2021 & 2029)
FIGURE 30 MIDDLE EAST AND AFRICA ECO-FRIENDLY PACKAGING MARKET: BY TYPE (2022-2029)
FIGURE 31 MIDDLE EAST & AFRICA ECO-FRIENDLY PACKAGING MARKET: COMPANY SHARE 2021 (%)
Metodología de investigación
La recopilación de datos y el análisis del año base se realizan utilizando módulos de recopilación de datos con muestras de gran tamaño. La etapa incluye la obtención de información de mercado o datos relacionados a través de varias fuentes y estrategias. Incluye el examen y la planificación de todos los datos adquiridos del pasado con antelación. Asimismo, abarca el examen de las inconsistencias de información observadas en diferentes fuentes de información. Los datos de mercado se analizan y estiman utilizando modelos estadísticos y coherentes de mercado. Además, el análisis de la participación de mercado y el análisis de tendencias clave son los principales factores de éxito en el informe de mercado. Para obtener más información, solicite una llamada de un analista o envíe su consulta.
La metodología de investigación clave utilizada por el equipo de investigación de DBMR es la triangulación de datos, que implica la extracción de datos, el análisis del impacto de las variables de datos en el mercado y la validación primaria (experto en la industria). Los modelos de datos incluyen cuadrícula de posicionamiento de proveedores, análisis de línea de tiempo de mercado, descripción general y guía del mercado, cuadrícula de posicionamiento de la empresa, análisis de patentes, análisis de precios, análisis de participación de mercado de la empresa, estándares de medición, análisis global versus regional y de participación de proveedores. Para obtener más información sobre la metodología de investigación, envíe una consulta para hablar con nuestros expertos de la industria.
Personalización disponible
Data Bridge Market Research es líder en investigación formativa avanzada. Nos enorgullecemos de brindar servicios a nuestros clientes existentes y nuevos con datos y análisis que coinciden y se adaptan a sus objetivos. El informe se puede personalizar para incluir análisis de tendencias de precios de marcas objetivo, comprensión del mercado de países adicionales (solicite la lista de países), datos de resultados de ensayos clínicos, revisión de literatura, análisis de mercado renovado y base de productos. El análisis de mercado de competidores objetivo se puede analizar desde análisis basados en tecnología hasta estrategias de cartera de mercado. Podemos agregar tantos competidores sobre los que necesite datos en el formato y estilo de datos que esté buscando. Nuestro equipo de analistas también puede proporcionarle datos en archivos de Excel sin procesar, tablas dinámicas (libro de datos) o puede ayudarlo a crear presentaciones a partir de los conjuntos de datos disponibles en el informe.

