Middle East And Africa Down Syndrome Market
Tamaño del mercado en miles de millones de dólares
Tasa de crecimiento anual compuesta (CAGR) :
% 
 USD
42.37 Million
USD
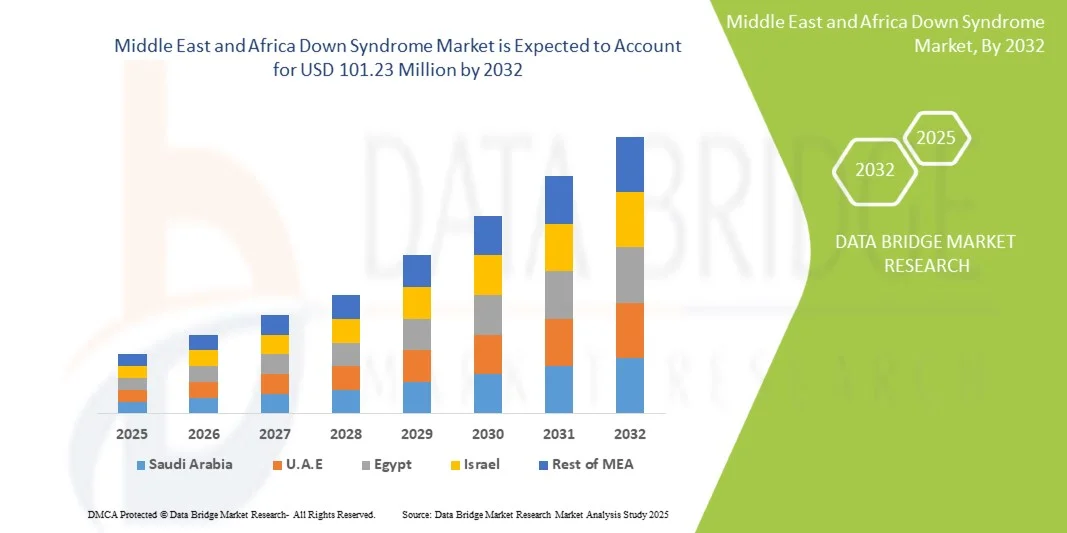
101.23 Million
2024
2032
USD
42.37 Million
USD
101.23 Million
2024
2032
| 2025 –2032 | |
| USD 42.37 Million | |
| USD 101.23 Million | |
| % | |
|
Segmentación del mercado del síndrome de Down en Oriente Medio y África, por tipo de enfermedad (trisomía 21, síndrome de Down por translocación y síndrome de Down en mosaico), tratamiento (diagnóstico y terapia), usuario final (hospital, clínicas, centros de atención domiciliaria, centros de terapia y otros), canal de distribución (licitación directa, ventas minoristas y otros): tendencias de la industria y pronóstico hasta 2032.
Tamaño del mercado del síndrome de Down en Oriente Medio y África
- El tamaño del mercado del síndrome de Down en Oriente Medio y África se valoró en 42,37 millones de USD en 2024 y se espera que alcance los 101,23 millones de USD en 2032 , con una CAGR del 11,5 % durante el período de pronóstico.
- El crecimiento del mercado se debe en gran medida a una mayor conciencia, a los avances en las tecnologías de pruebas genéticas y a un enfoque en el diagnóstico temprano y las estrategias de intervención, lo que conduce a mejores resultados de atención médica para las personas con síndrome de Down.
- Además, el creciente apoyo gubernamental, los avances tecnológicos y la creciente demanda de soluciones integrales de atención están consolidando los servicios y productos relacionados con el síndrome de Down como una oferta sanitaria esencial en la región. Estos factores convergentes están acelerando la adopción de soluciones diagnósticas y terapéuticas, impulsando así significativamente el crecimiento del sector.
Análisis del mercado del síndrome de Down en Oriente Medio y África
- El síndrome de Down, un trastorno genético causado por la presencia de un cromosoma 21 adicional, requiere un tratamiento sanitario especializado y programas de intervención temprana, lo que lo convierte en un área de enfoque fundamental para los proveedores de atención sanitaria y los servicios de apoyo en Medio Oriente y África.
- La creciente prevalencia de casos de síndrome de Down, combinada con una mayor conciencia entre los cuidadores y los profesionales de la salud, está impulsando la demanda de herramientas de diagnóstico avanzadas, pruebas genéticas e intervenciones terapéuticas en la región.
- Arabia Saudita dominó el mercado con la mayor participación en los ingresos del 39% en 2024, respaldada por la mejora de la infraestructura de atención médica, la financiación gubernamental para los trastornos genéticos y las iniciativas para mejorar el diagnóstico temprano y la atención inclusiva para las personas afectadas.
- Se espera que Sudáfrica sea el país de más rápido crecimiento durante el período de pronóstico, debido a las mejoras continuas en la accesibilidad a la atención médica, las crecientes inversiones en servicios de atención médica pediátrica y genética y las crecientes campañas de concientización.
- El segmento de diagnóstico dominó el mercado en 2024 con una participación del 45,5%, impulsado por su papel fundamental en la gestión oportuna, la mejora de los resultados del desarrollo y la facilitación de una mejor integración de las personas con síndrome de Down en los programas educativos y sociales.
Alcance del informe y segmentación del mercado del síndrome de Down en Oriente Medio y África
|
Atributos |
Perspectivas clave del mercado del síndrome de Down en Oriente Medio y África |
|
Segmentos cubiertos |
|
|
Países cubiertos |
Oriente Medio y África
|
|
Actores clave del mercado |
|
|
Oportunidades de mercado |
|
|
Conjuntos de información de datos de valor añadido |
Además de los conocimientos sobre escenarios de mercado como valor de mercado, tasa de crecimiento, segmentación, cobertura geográfica y actores principales, los informes de mercado seleccionados por Data Bridge Market Research también incluyen análisis de expertos en profundidad, análisis de precios, análisis de participación de marca, encuesta de consumidores, análisis demográfico, análisis de la cadena de suministro, análisis de la cadena de valor, descripción general de materias primas/consumibles, criterios de selección de proveedores, análisis PESTLE, análisis de Porter y marco regulatorio. |
Tendencias del mercado del síndrome de Down en Oriente Medio y África
Avances en los programas de diagnóstico e intervención temprana
- Una tendencia significativa y en aceleración en el mercado del síndrome de Down en Oriente Medio y África es la creciente adopción de herramientas de diagnóstico temprano y programas de intervención integrales, que mejoran significativamente los resultados del desarrollo y la calidad de vida de las personas afectadas.
- Por ejemplo, en 2024, Arabia Saudita introdujo una iniciativa nacional de detección de recién nacidos destinada a la detección temprana del síndrome de Down, lo que permitió el acceso oportuno a programas de apoyo terapéutico y educativo.
- Las tecnologías de pruebas genéticas y los planes de intervención personalizados permiten a los proveedores de atención médica identificar retrasos en el desarrollo de forma temprana, optimizar las estrategias de tratamiento y monitorear el progreso de manera más efectiva a lo largo del tiempo.
- La integración mejorada de las herramientas de diagnóstico con los sistemas de información sanitaria facilita la gestión centralizada de los datos de los pacientes, lo que permite a los médicos, cuidadores y terapeutas coordinar la atención de manera eficiente y realizar un seguimiento de los resultados del tratamiento.
- Esta tendencia hacia una atención temprana, proactiva e integrada está transformando fundamentalmente las expectativas de los servicios de atención médica pediátrica y genética, y las empresas y los proveedores de atención médica están desarrollando soluciones que apoyan el monitoreo continuo, la gestión de la terapia y la orientación familiar.
- La demanda de programas de diagnóstico e intervención temprana está creciendo rápidamente tanto en áreas urbanas como rurales, a medida que los gobiernos, las ONG y los proveedores de atención médica privados priorizan cada vez más la atención integral para las personas con síndrome de Down.
Dinámica del mercado del síndrome de Down en Oriente Medio y África
Conductor
“Aumento de la Concienciación y Mejoras en la Infraestructura Sanitaria”
- La creciente conciencia sobre el síndrome de Down entre los padres, cuidadores y profesionales de la salud, junto con la mejora de la infraestructura de atención médica, es un impulsor importante de la creciente demanda de servicios de diagnóstico e intervención especializados.
- Por ejemplo, en 2023, Sudáfrica amplió sus unidades de atención genética pediátrica, integrando servicios de detección y terapia del síndrome de Down en centros de atención médica comunitarios para mejorar la accesibilidad y la atención temprana.
- A medida que las familias se informan mejor sobre los desafíos del desarrollo y los servicios de apoyo disponibles, la demanda de intervención temprana, programas educativos y soluciones terapéuticas aumenta constantemente en toda la región.
- Además, la financiación gubernamental, las iniciativas de las ONG y las inversiones del sector privado están haciendo que los servicios de pruebas y terapias genéticas avanzadas sean más accesibles, lo que permite que más niños reciban atención oportuna y eficaz.
- Las políticas de atención sanitaria mejoradas, las campañas de concienciación y los programas de apoyo específicos son factores fundamentales que impulsan la adopción de servicios de diagnóstico y terapéuticos para el síndrome de Down, garantizando mejores resultados de desarrollo a largo plazo.
Restricción/Desafío
“Accesibilidad limitada y estigma social”
- Los desafíos relacionados con la accesibilidad limitada a las instalaciones de atención médica, especialmente en regiones rurales y marginadas, junto con el estigma social que rodea al síndrome de Down, son restricciones importantes para un crecimiento más amplio del mercado.
- Por ejemplo, los informes de 2024 indican que en algunas partes del África subsahariana, las familias enfrentan dificultades para acceder a pruebas genéticas especializadas y programas de intervención, lo que retrasa el diagnóstico y el inicio del tratamiento.
- El estigma social y la falta de concienciación pueden llevar a un retraso en la inscripción en programas educativos y terapéuticos, lo que afecta el desarrollo general y la integración social de los niños afectados.
- Abordar estos desafíos mediante campañas de concientización pública, la expansión de la infraestructura de atención médica e iniciativas de apoyo basadas en la comunidad es crucial para mejorar la aceptación del servicio y los resultados de los pacientes.
- Además, las barreras de costo para las pruebas de diagnóstico avanzadas y los programas de terapia en hogares de bajos ingresos pueden limitar la adopción, lo que requiere subsidios gubernamentales y apoyo de las ONG para mejorar el acceso a una atención integral.
Alcance del mercado del síndrome de Down en Oriente Medio y África
El mercado está segmentado según el tipo de enfermedad, el tratamiento, el usuario final y el canal de distribución.
- Por tipo de enfermedad
Según el tipo de enfermedad, el mercado se segmenta en trisomía 21, síndrome de Down por translocación y síndrome de Down en mosaico. El segmento de la trisomía 21 dominó el mercado con la mayor participación en ingresos, un 61 %, en 2024, gracias a su mayor prevalencia en comparación con otros tipos. Los programas de diagnóstico precoz y las terapias especializadas dirigidas a la trisomía 21 contribuyen a su sólida cuota de mercado. Padres y cuidadores buscan cada vez más asesoramiento genético y programas de intervención específicos para la trisomía 21. Los profesionales sanitarios priorizan los recursos y las campañas de concienciación para este tipo de enfermedad, lo que refuerza aún más su dominio. Los programas de cribado financiados por el gobierno en países como Arabia Saudí y los Emiratos Árabes Unidos mejoran las tasas de detección temprana. Este segmento también se beneficia de una amplia investigación y desarrollo, lo que conduce a mejores enfoques terapéuticos y soluciones de atención.
Se prevé que el segmento del síndrome de Down mosaico experimente el mayor crecimiento, con una tasa de crecimiento anual compuesta (TCAC) del 7,1 % entre 2025 y 2032, impulsado por una mayor concienciación y mejores capacidades de diagnóstico. Los casos de síndrome de Down mosaico suelen estar infradiagnosticados, por lo que los avances en las pruebas genéticas están incrementando las tasas de detección. Los profesionales sanitarios están implementando planes especializados de seguimiento y tratamiento para este grupo. La creciente disponibilidad de programas de apoyo educativo para niños con síndrome de Down mosaico está contribuyendo a la adopción de servicios relacionados. Las ONG y los grupos de defensa de los pacientes se centran cada vez más en los casos de síndrome de Down mosaico para garantizar un acceso inclusivo a la atención médica. Los avances tecnológicos en el cribado prenatal y posnatal también impulsan un crecimiento más rápido del mercado.
- Por tratamiento
En función del tratamiento, el mercado se segmenta en diagnóstico y terapia. El segmento de Diagnóstico dominó el mercado con una participación del 45,5% en 2024 debido a la importancia crucial de la detección temprana para un manejo eficaz. Las pruebas genéticas tempranas y los programas de cribado permiten una intervención oportuna, mejorando los resultados del desarrollo a largo plazo. Los hospitales y clínicas ofrecen cada vez más paquetes de diagnóstico integrales a padres y cuidadores. Los servicios de diagnóstico cuentan con el apoyo de iniciativas gubernamentales y campañas de concienciación en la región. Este segmento se beneficia de los avances tecnológicos en los kits de pruebas prenatales y posnatales. El diagnóstico temprano también ayuda a los cuidadores a planificar el apoyo educativo y terapéutico, lo que impulsa la demanda de servicios de diagnóstico.
Se prevé que el segmento de terapias experimente el crecimiento más rápido, con una tasa de crecimiento anual compuesta (TCAC) del 7,5 % entre 2025 y 2032, impulsado por el creciente enfoque en programas de intervención temprana y terapias de rehabilitación. La fisioterapia, la terapia ocupacional y la terapia del habla se están adoptando ampliamente para mejorar los resultados del desarrollo. Los centros de terapia y los proveedores de atención domiciliaria están ampliando su oferta de servicios, lo que contribuye al crecimiento del mercado. Las campañas de concienciación enfatizan la importancia de una atención terapéutica consistente. El apoyo gubernamental y de las ONG a los servicios de terapia está aumentando en países como Sudáfrica y Egipto. Los planes de terapia personalizados y la integración tecnológica con los sistemas de monitorización están acelerando su adopción.
- Por el usuario final
Según el usuario final, el mercado se segmenta en hospitales, clínicas, centros de atención domiciliaria, centros de terapia y otros. El segmento de hospitales dominó el mercado con la mayor participación (42%) en 2024, debido a su función como centros primarios para programas de diagnóstico, tratamiento e intervención. Los hospitales ofrecen vías de atención integradas que incluyen pruebas genéticas, asesoramiento y derivaciones a terapia. Las iniciativas y la financiación gubernamentales suelen canalizar recursos a través de los sistemas hospitalarios, lo que impulsa la adopción. Los hospitales están cada vez más equipados con unidades especializadas de atención pediátrica y genética. Los equipos multidisciplinarios en los hospitales garantizan una atención integral a los niños con síndrome de Down. Los hospitales también son centros centrales para la formación de profesionales sanitarios en el manejo del síndrome de Down.
Se prevé que el segmento de Atención Domiciliaria experimente el mayor crecimiento, con una tasa de crecimiento anual compuesta (TCAC) del 8% entre 2025 y 2032, impulsado por la creciente demanda de servicios de terapia a domicilio y planes de atención personalizados. Los padres prefieren la terapia domiciliaria por la comodidad y conveniencia de sus hijos. Los servicios de atención domiciliaria permiten un seguimiento continuo y un apoyo personalizado para el desarrollo. La integración de la telesalud está aumentando el acceso a la orientación profesional en el hogar. La adopción de la atención domiciliaria cuenta con el apoyo de programas de ONG e iniciativas gubernamentales en zonas rurales. Las herramientas tecnológicas y las aplicaciones móviles facilitan la terapia remota y el seguimiento del progreso.
- Por canal de distribución
Según el canal de distribución, el mercado se segmenta en Licitación Directa, Ventas Minoristas y Otros. El segmento de Licitación Directa dominó el mercado con la mayor participación, un 47%, en 2024, impulsado por las compras gubernamentales para hospitales y clínicas, así como por la compra a granel de kits de diagnóstico y equipos de terapia. Las licitaciones gubernamentales y los programas de salud pública garantizan la amplia disponibilidad de servicios relacionados con el síndrome de Down. La Licitación Directa ofrece ventajas en costos y acceso a productos de calidad estandarizada. La adquisición mediante licitaciones suele estar respaldada por colaboraciones internacionales e iniciativas de financiación. Este segmento garantiza la gestión centralizada de suministros para centros de salud. Las alianzas estratégicas entre proveedores y organismos gubernamentales mejoran la penetración en el mercado.
Se prevé que el segmento de Ventas Minoristas experimente el mayor crecimiento, con una tasa de crecimiento anual compuesta (TCAC) del 7,8 % entre 2025 y 2032, impulsado por la creciente disponibilidad de kits de diagnóstico para el hogar, ayudas terapéuticas y herramientas educativas en farmacias y plataformas en línea. La creciente concienciación entre los cuidadores impulsa las compras directas para uso doméstico. Los canales minoristas ofrecen comodidad y acceso oportuno a productos esenciales. Las plataformas de comercio electrónico y las tiendas en línea están ampliando su alcance a las poblaciones urbanas y semiurbanas. Este segmento se beneficia de la creciente disposición de los consumidores a invertir en soluciones de atención personalizada. Las campañas de marketing y los programas de concienciación están impulsando aún más la adopción a través de los canales minoristas.
Análisis regional del mercado del síndrome de Down en Oriente Medio y África
- Arabia Saudita dominó el mercado con la mayor participación en los ingresos del 39% en 2024, respaldada por la mejora de la infraestructura de atención médica, la financiación gubernamental para los trastornos genéticos y las iniciativas para mejorar el diagnóstico temprano y la atención inclusiva para las personas afectadas.
- Las familias y los proveedores de atención médica del país priorizan la detección temprana, las pruebas genéticas y los programas de intervención integral, lo que apoya una mayor adopción de servicios de diagnóstico y terapéuticos.
- La amplia disponibilidad de hospitales, clínicas y centros de terapia especializados, junto con programas financiados por el gobierno, garantiza un acceso efectivo a la atención para las personas con síndrome de Down.
Perspectivas del mercado del síndrome de Down en Sudáfrica
Se prevé que el mercado sudafricano del síndrome de Down crezca a la tasa de crecimiento anual compuesta (TCAC) más alta, del 7,8 %, durante el período de pronóstico, impulsado por las mejoras en la accesibilidad a la atención médica, la creciente concienciación y las iniciativas gubernamentales para optimizar la atención pediátrica y genética. Los programas de diagnóstico temprano, combinados con servicios de intervención comunitaria, están impulsando la adopción de soluciones diagnósticas y terapéuticas. Las ONG y los proveedores de atención médica privados promueven activamente programas de educación y rehabilitación inclusivos para los niños afectados. La creciente disponibilidad de servicios de atención domiciliaria y telesalud está mejorando el acceso a la terapia en zonas rurales y marginadas. Las inversiones en la formación de profesionales sanitarios y la expansión de los centros de terapia contribuyen al crecimiento del mercado. Los avances tecnológicos en kits de diagnóstico y herramientas terapéuticas aceleran aún más la adopción de servicios relacionados con el síndrome de Down.
Perspectivas del mercado del síndrome de Down en Egipto
El mercado egipcio del síndrome de Down está experimentando un crecimiento constante gracias a la creciente concienciación, la mejora de los servicios de salud y el mayor apoyo gubernamental al tratamiento de los trastornos genéticos. Hospitales y clínicas en centros urbanos ofrecen programas de atención integral, que incluyen diagnóstico temprano, asesoramiento e intervenciones terapéuticas. La creciente colaboración entre los sectores público y privado de la salud está mejorando el acceso a servicios especializados. Las campañas de concienciación dirigidas a padres y cuidadores fomentan la detección temprana y la adopción de terapias. Los centros educativos y terapéuticos están ampliando sus programas para niños con síndrome de Down, lo que contribuye al desarrollo del mercado. Los avances en las tecnologías de pruebas prenatales y posnatales también respaldan las iniciativas de detección e intervención tempranas.
Perspectivas del mercado del síndrome de Down en Nigeria
Se espera que el mercado nigeriano del síndrome de Down crezca a una tasa de crecimiento anual compuesta (TCAC) notable, impulsado por un mayor enfoque en la atención genética pediátrica, programas de extensión comunitaria y una mayor concienciación pública sobre los trastornos del desarrollo. Hospitales y clínicas en las principales ciudades están incorporando programas de detección y terapia. Las ONG y las organizaciones internacionales desempeñan un papel fundamental en la mejora del acceso a la atención en zonas rurales. Los servicios de atención domiciliaria y las soluciones de telesalud se están expandiendo, permitiendo que las familias reciban apoyo continuo. Las políticas gubernamentales que apoyan la atención médica infantil y las intervenciones educativas están facilitando el crecimiento del mercado. La mayor disponibilidad de herramientas de diagnóstico y servicios terapéuticos impulsa aún más su adopción.
Cuota de mercado del síndrome de Down en Oriente Medio y África
La industria del síndrome de Down en Oriente Medio y África está liderada principalmente por empresas bien establecidas, entre las que se incluyen:
- Natera, Inc. (EE. UU.)
- Next Biosciences (Sudáfrica)
- Myriad Genetics, Inc. (EE. UU.)
- F. Hoffmann-La Roche Ltd (Suiza)
- Abbott (EE. UU.)
- Illumina, Inc. (EE. UU.)
- AC Immune SA (Suiza)
- Alzheon (EE. UU.)
- Annovis Bio, Inc. (EE. UU.)
- ManRos Therapeutics (Francia)
- NeuroNascent, Inc. (EE. UU.)
- OPKO Health, Inc. (EE. UU.)
- Fundación LuMind IDSC (EE. UU.)
- Centro Alana del MIT (EE. UU.)
- Pfizer Inc. (EE. UU.)
- Ionis Pharmaceuticals, Inc. (EE. UU.)
- Eli Lilly and Company (EE. UU.)
- Takeda Pharmaceutical Company Limited (Japón)
- Johnson & Johnson Services, Inc. (EE. UU.)
- Biogen Inc. (EE. UU.)
¿Cuáles son los desarrollos recientes en el mercado del síndrome de Down en Oriente Medio y África?
- En octubre de 2025, la Asociación Benéfica de Dubái firmó un acuerdo de colaboración estratégica con la Asociación de Síndrome de Down de los Emiratos durante la 7.ª edición de la Access Abilities Expo. Esta colaboración se centra en empoderar a las personas con síndrome de Down y mejorar su integración en la sociedad.
- En septiembre de 2025, el Centro de Aprendizaje Independiente de Yeda y Riad fue reconocido como el primer Centro de Excelencia para el Síndrome de Down. El centro se especializa en trabajar con niños con síndrome de Down, brindándoles terapia y educación personalizadas para apoyar su desarrollo.
- En septiembre de 2025, Amanda D'Silva, una joven de 22 años con síndrome de Down de Dubái, apareció en las icónicas pantallas de Times Square en la ciudad de Nueva York. Seleccionada entre más de 2600 candidaturas internacionales, su inclusión en la campaña de la Sociedad Nacional del Síndrome de Down tuvo como objetivo promover la inclusión y la representación de las personas con síndrome de Down a nivel mundial.
- En agosto de 2024, la artista egipcia Mariam Wagih, que tiene síndrome de Down, realizó su primera exposición de arte individual en la Sala Salah Tahir de la Ópera Egipcia, lo que la convirtió en la primera persona con síndrome de Down admitida en la Facultad de Bellas Artes de Egipto y destacó los avances en la inclusión cultural.
- En marzo de 2021, la Iglesia Copta inauguró «Al-Fulk» (El Arca), el mayor centro de tratamiento para personas con síndrome de Down en Oriente Medio. Ubicado en El Cairo, este centro busca brindar atención integral, que incluye servicios médicos, educativos y terapéuticos, para mejorar la calidad de vida de las personas afectadas.
SKU-
Obtenga acceso en línea al informe sobre la primera nube de inteligencia de mercado del mundo
- Panel de análisis de datos interactivo
- Panel de análisis de empresas para oportunidades con alto potencial de crecimiento
- Acceso de analista de investigación para personalización y consultas
- Análisis de la competencia con panel interactivo
- Últimas noticias, actualizaciones y análisis de tendencias
- Aproveche el poder del análisis de referencia para un seguimiento integral de la competencia
Metodología de investigación
La recopilación de datos y el análisis del año base se realizan utilizando módulos de recopilación de datos con muestras de gran tamaño. La etapa incluye la obtención de información de mercado o datos relacionados a través de varias fuentes y estrategias. Incluye el examen y la planificación de todos los datos adquiridos del pasado con antelación. Asimismo, abarca el examen de las inconsistencias de información observadas en diferentes fuentes de información. Los datos de mercado se analizan y estiman utilizando modelos estadísticos y coherentes de mercado. Además, el análisis de la participación de mercado y el análisis de tendencias clave son los principales factores de éxito en el informe de mercado. Para obtener más información, solicite una llamada de un analista o envíe su consulta.
La metodología de investigación clave utilizada por el equipo de investigación de DBMR es la triangulación de datos, que implica la extracción de datos, el análisis del impacto de las variables de datos en el mercado y la validación primaria (experto en la industria). Los modelos de datos incluyen cuadrícula de posicionamiento de proveedores, análisis de línea de tiempo de mercado, descripción general y guía del mercado, cuadrícula de posicionamiento de la empresa, análisis de patentes, análisis de precios, análisis de participación de mercado de la empresa, estándares de medición, análisis global versus regional y de participación de proveedores. Para obtener más información sobre la metodología de investigación, envíe una consulta para hablar con nuestros expertos de la industria.
Personalización disponible
Data Bridge Market Research es líder en investigación formativa avanzada. Nos enorgullecemos de brindar servicios a nuestros clientes existentes y nuevos con datos y análisis que coinciden y se adaptan a sus objetivos. El informe se puede personalizar para incluir análisis de tendencias de precios de marcas objetivo, comprensión del mercado de países adicionales (solicite la lista de países), datos de resultados de ensayos clínicos, revisión de literatura, análisis de mercado renovado y base de productos. El análisis de mercado de competidores objetivo se puede analizar desde análisis basados en tecnología hasta estrategias de cartera de mercado. Podemos agregar tantos competidores sobre los que necesite datos en el formato y estilo de datos que esté buscando. Nuestro equipo de analistas también puede proporcionarle datos en archivos de Excel sin procesar, tablas dinámicas (libro de datos) o puede ayudarlo a crear presentaciones a partir de los conjuntos de datos disponibles en el informe.