Mercado de fabricación por contrato en Oriente Medio y África, por producto (fabricación de productos farmacéuticos y fabricación de dispositivos médicos), por usuario final (empresas farmacéuticas, empresas de biotecnología, empresas biofarmacéuticas, empresas de dispositivos médicos, fabricantes de equipos originales e institutos de investigación), por canal de distribución (ventas minoristas, licitación directa y otros): tendencias de la industria y pronóstico hasta 2030.
Análisis y perspectivas del mercado de fabricación por contrato en Oriente Medio y África
El mercado de fabricación por contrato de Oriente Medio y África está impulsado por factores como el aumento de los avances técnicos y la rentabilidad de los productos farmacéuticos y de desarrollo, que aumentan su demanda, y la creciente inversión en investigación y desarrollo que conduce al crecimiento del mercado. Actualmente, el gasto en atención sanitaria ha aumentado en los países desarrollados y emergentes, lo que se espera que cree una ventaja competitiva para que los fabricantes desarrollen productos nuevos e innovadores.
La fabricación por contrato es un contrato entre una empresa y un fabricante para fabricar una cierta cantidad de componentes o productos para la empresa en un período de tiempo específico. Los bienes creados estarán bajo la marca o el sello de la empresa. Esto se denomina fabricación con marca propia. A menudo, también se denomina subcontratación si se realiza a través de las fronteras. Los fabricantes brindan su servicio en función de sus propios diseños, fórmulas y especificaciones, a menos que el cliente proporcione los suyos propios. Ellos crearán estos productos para quienquiera que hayan contratado, incluso empresas de la competencia.
Uno de los principales factores que impulsan el crecimiento del mercado de fabricación por contrato es la creciente demanda en el sector de dispositivos médicos y farmacéuticos a nivel mundial. La continua investigación de ensayos clínicos que realizan varias empresas para mejorar el diagnóstico conduce a la expansión del mercado. El mercado también está influenciado por los crecientes avances tecnológicos y la rentabilidad. Sin embargo, el riesgo de información confidencial y las estrictas regulaciones pueden actuar como factores restrictivos para el mercado de fabricación por contrato de Oriente Medio y África en el período de pronóstico.
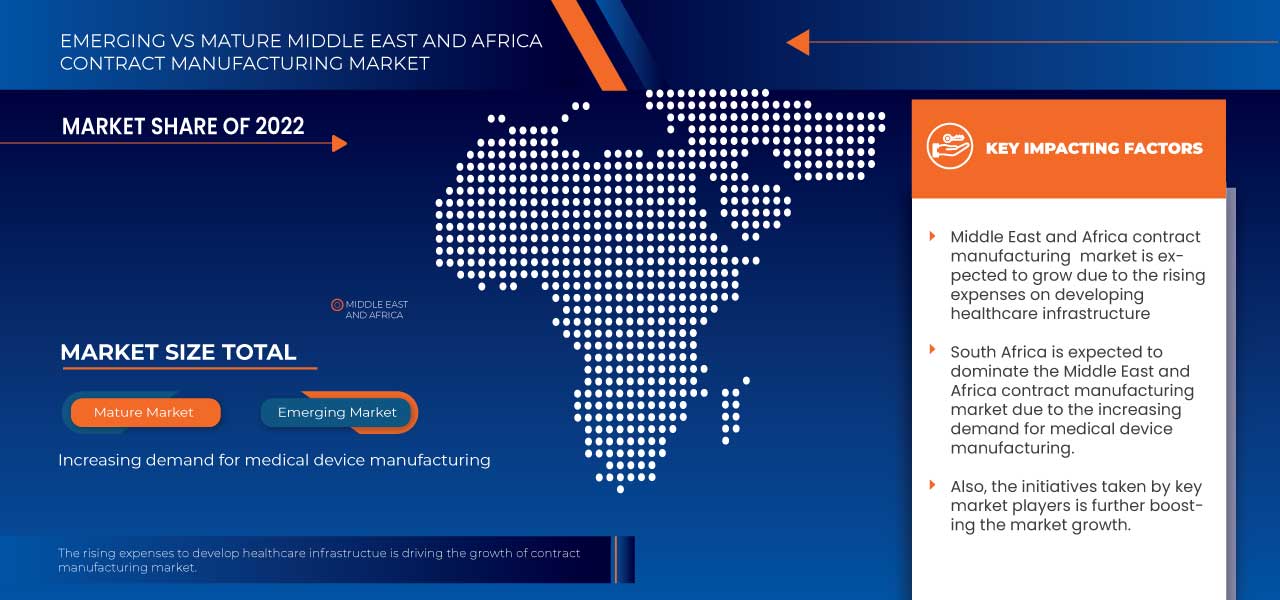
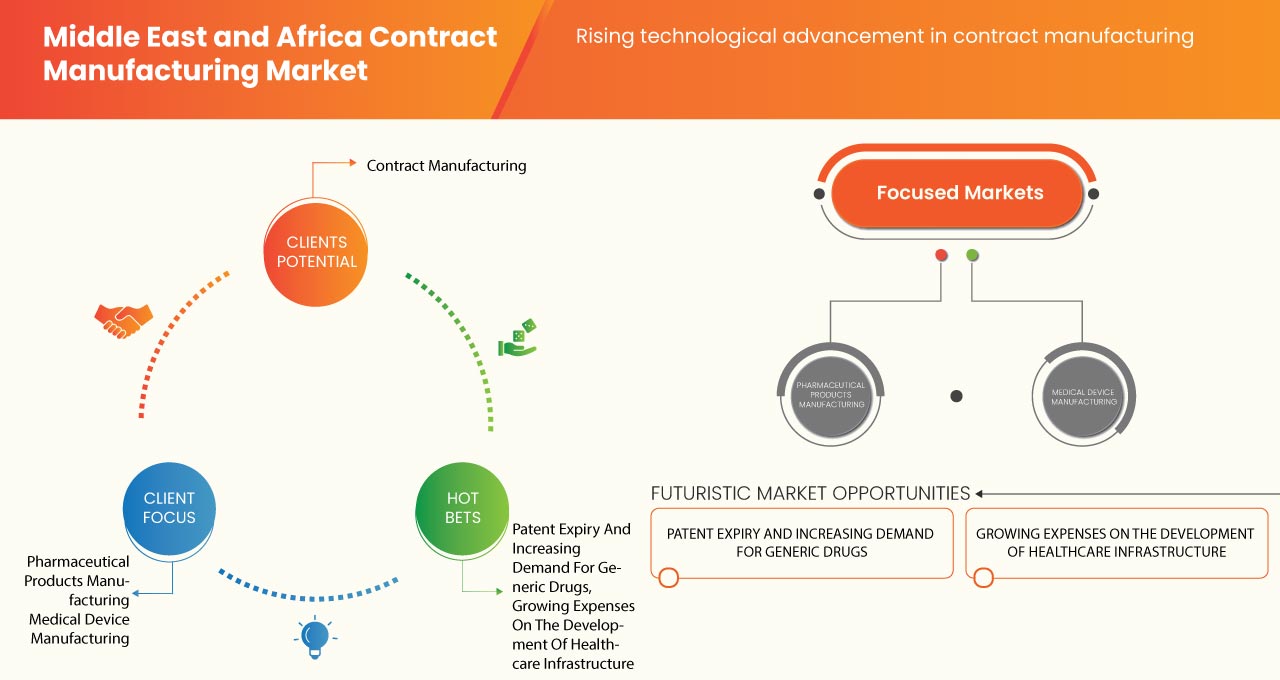
Por otra parte, la expiración de patentes y la creciente demanda de medicamentos genéricos, los crecientes gastos en infraestructura sanitaria y las iniciativas estratégicas de los principales actores del mercado actúan como una oportunidad para el crecimiento del mercado. Sin embargo, el riesgo de la propiedad intelectual y el creciente número de empresas farmacéuticas que establecen sus propias unidades de fabricación pueden crear desafíos para el mercado de fabricación por contrato de Oriente Medio y África.
La demanda de fabricación por contrato aumentará a nivel mundial debido a una mayor inclinación hacia los diagnósticos en el punto de atención . Varias empresas están tomando iniciativas que conducen gradualmente al crecimiento del mercado.
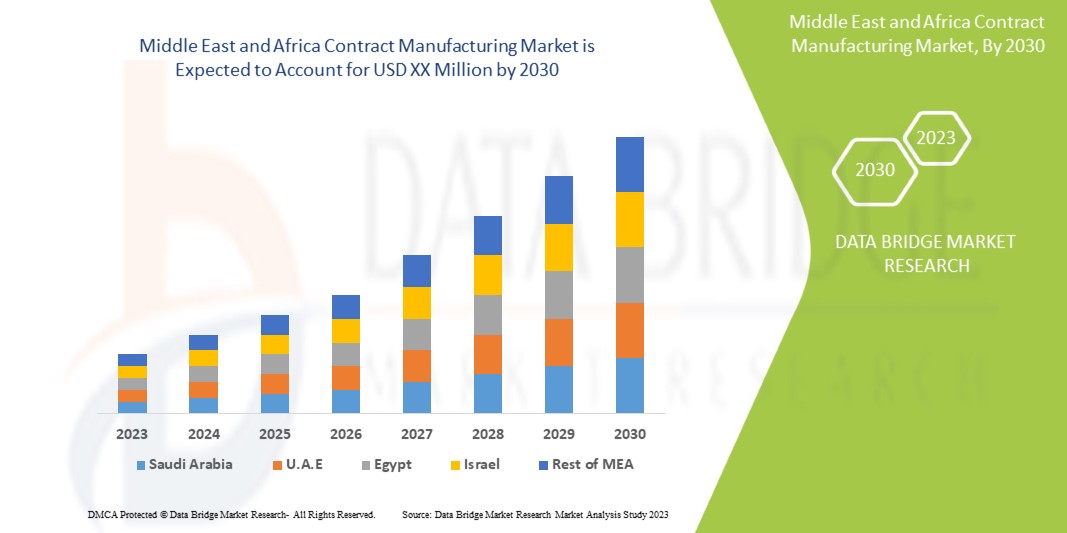
El mercado de fabricación por contrato de Oriente Medio y África es favorable y tiene como objetivo reducir los esfuerzos de fabricación de las organizaciones de atención médica. Data Bridge Market Research analiza que el mercado de fabricación por contrato de Oriente Medio y África crecerá a una CAGR del 5,3 % durante el período de pronóstico de 2023 a 2030.
|
Métrica del informe |
Detalles |
|
Período de pronóstico |
2023 a 2030 |
|
Año base |
2022 |
|
Años históricos |
2021 (Personalizable para 2015-2020) |
|
Unidades cuantitativas |
Ingresos en millones de USD, precios en USD |
|
Segmentos cubiertos |
Por producto (fabricación de productos farmacéuticos y fabricación de dispositivos médicos), por usuario final (empresas farmacéuticas, empresas de biotecnología, empresas biofarmacéuticas, empresas de dispositivos médicos, fabricantes de equipos originales e institutos de investigación), por canal de distribución (ventas minoristas, licitación directa y otros) |
|
Países cubiertos |
Arabia Saudita, Sudáfrica, Emiratos Árabes Unidos, Israel, Kuwait, Egipto y el resto de Oriente Medio y África |
|
Actores del mercado cubiertos |
Aenova Group, Thermo Fisher Scientific Inc., EVONIK INDUSTRIES AG, Lonza, Boehringer Ingelheim Biopharmaceuticals GmbH. y Catalent, Inc, entre otros. |
Dinámica de la fabricación por contrato en Oriente Medio y África
Definición de mercado
La fabricación por contrato en los mercados internacionales se utiliza en situaciones en las que una empresa encarga a otra empresa de un país diferente la fabricación de sus productos; esto también se conoce como subcontratación internacional o externalización internacional. La empresa proporciona al fabricante todas las especificaciones y, si es necesario, también los materiales necesarios para el proceso de producción. Este tipo de contrato establece los requisitos que debe cumplir el fabricante en cuanto a calidad de los productos, certificación, cantidades, condiciones y fechas de entrega, etc. También establece directrices para la inspección y prueba de los productos establecidos por la empresa que subcontrata la fabricación o por sus propios clientes. Además, también describe modificaciones de los pedidos, así como garantías y compensaciones en caso de incumplimiento del contrato. Dado que el proceso consiste básicamente en externalizar la producción en mercados extranjeros a un socio que comercializa el producto final con una marca privada, existen varias empresas e industrias diferentes que pueden hacer uso de este tipo de contrato.
Conductores
- Rentabilidad para las empresas manufactureras
La fabricación intensiva en tiempo y la producción ineficaz de diversos productos y su gestión son grandes cargas para las organizaciones del sector público y privado. También son esenciales para abordar desafíos complejos porque una sola organización es menos eficaz a la hora de impulsar el cambio y, a veces, los resultados requeridos. Las empresas de fabricación por contrato actuarán como oportunidades crecientes tanto para el sector público como para el privado.
La creciente demanda de fabricación por contrato con mayor precisión y menos restricciones de tiempo impulsa a los actores clave a adoptar iniciativas estratégicas. La fabricación por contrato permite ahorrar los gastos generales necesarios para invertir en maquinaria, material y otra mano de obra, lo que simplifica el proceso de producción y agiliza la cadena de suministro al reducir el coste general.
Sin embargo, los principales actores del mercado están invirtiendo grandes cantidades de capital en la fabricación para satisfacer las demandas de sus usuarios finales. Los actores de la fabricación por contrato participan en la elaboración de estrategias y su implementación, reduciendo el coste de producción de estos actores. Los servicios de fabricación por contrato a otras empresas también garantizan la eficiencia y el uso óptimo de los recursos mediante el uso de mano de obra eficaz, inteligencia estratégica o recursos de trabajo necesarios en el ciclo de producción.
- Aumento de los avances tecnológicos en la fabricación por contrato
Introducir un nuevo medicamento en el mercado con rapidez requiere inversiones considerables en la fabricación debido a la creciente demanda en la industria farmacéutica. Se requieren tecnologías y habilidades avanzadas, ya que algunos medicamentos tienen fórmulas complejas y requieren equipos y técnicas específicos para su producción en masa.
Se está considerando el uso de tecnologías innovadoras como el aprendizaje automático, el big data y la inteligencia artificial para desarrollar medicamentos farmacéuticos o fabricar dispositivos médicos con el fin de lograr una producción rápida y veloz. Estos avances técnicos también ayudan a la producción en masa y a la escalabilidad en un corto período de tiempo.
Sin embargo, las empresas farmacéuticas tradicionalmente auditan o supervisan los procesos de producción y entrega de sus organizaciones de fabricación por contrato para monitorear el proceso de fabricación mediante rastreo remoto en tiempo real.
Oportunidades
- Crecientes gastos en el desarrollo de infraestructura sanitaria
La infraestructura es un pilar fundamental que sustenta el objetivo fundamental de promover mejores estándares de atención y bienestar para todos los pacientes, junto con una buena experiencia en el sistema de atención de salud. Al mismo tiempo, el sistema de atención de salud y el personal deben respaldar la promoción de la salud, la prevención y el autocuidado efectivos de toda la población. La infraestructura debe integrar el hospital, como centro de atención aguda y hospitalaria, en el sistema de atención de salud más amplio y debe facilitar los siete dominios de la experiencia de calidad del paciente, la eficacia, la eficiencia, la puntualidad, la seguridad, la equidad y la sostenibilidad. La infraestructura incluye el entorno construido y los elementos de apoyo: equipos, acceso, tecnología de la información (TI), sistemas y procesos, iniciativas de sostenibilidad y personal.
Sin embargo, los crecientes gastos en el desarrollo de infraestructura de atención médica están impulsando el crecimiento del mercado de fabricación por contrato en Medio Oriente y África en el período de pronóstico.
Restricciones/Desafíos
- Aumenta el número de empresas farmacéuticas que instalan sus plantas de fabricación
La mayoría de las compañías farmacéuticas están construyendo plantas de fabricación para producir productos farmacéuticos y reducir costos. Los fabricantes están más centrados en la introducción de tecnologías avanzadas y el proceso de digitalización. La industria farmacéutica también enfrenta disrupciones debido a nuevos modelos de negocios y una población más enfocada en medicamentos y tratamientos personalizados. Por lo tanto, la demanda de atención personalizada es alta. Los perfiles ocupacionales también están cambiando: algunos trabajos están desapareciendo debido a la automatización, mientras que están surgiendo trabajos completamente nuevos.
Por lo tanto, el creciente número de empresas farmacéuticas que establecen sus unidades de fabricación puede desafiar el crecimiento del mercado de fabricación por contrato de Medio Oriente y África en el período de pronóstico.
Acontecimientos recientes
- En octubre de 2021, Boehringer Ingelheim International gmbh. inauguró su moderna planta de producción biofarmacéutica de cultivo celular a gran escala (LSCC) en Viena, Austria, con un volumen de inversión de más de 700 millones de euros, que es la mayor inversión individual en la historia de la empresa.
- En marzo de 2023, Evonik Industries AG anunció la apertura de una nueva planta GMP para fabricar lípidos para aplicaciones avanzadas de administración de fármacos farmacéuticos. La planta de lanzamiento de lípidos está ubicada en la planta de la empresa en Hanau, Alemania, y proporciona a los clientes cantidades de lípidos según sea necesario para la fabricación comercial a pequeña escala y clínica.
Segmentación del mercado de fabricación por contrato en Oriente Medio y África
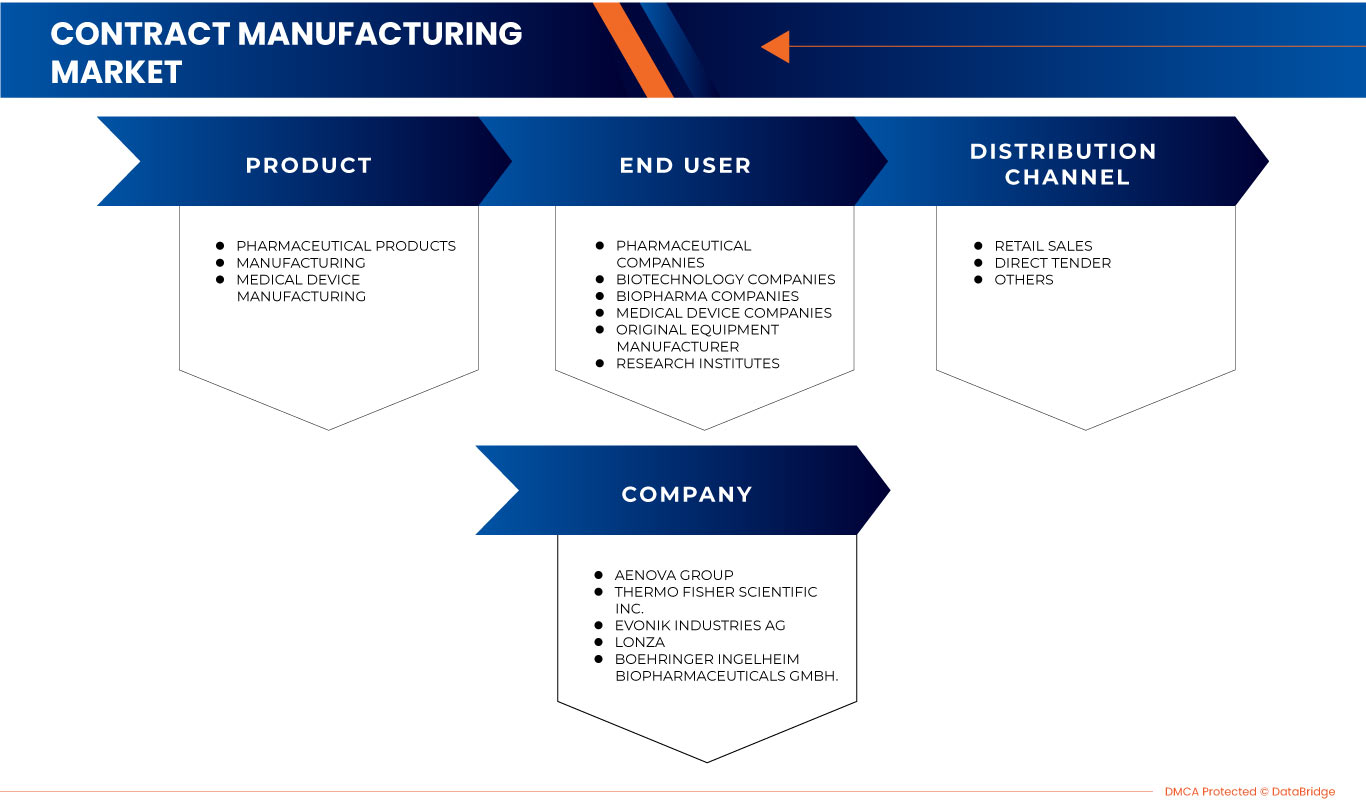
El mercado de fabricación por contrato de Oriente Medio y África se clasifica en tres segmentos notables según el producto, el usuario final y el canal de distribución. El crecimiento entre segmentos le ayuda a analizar nichos de crecimiento y estrategias para abordar el mercado y determinar sus áreas de aplicación principales y la diferencia en sus mercados objetivo.
Producto
- Fabricación de dispositivos médicos
- Fabricación de productos farmacéuticos
Sobre la base del producto, el mercado de fabricación por contrato de Medio Oriente y África está segmentado en fabricación de dispositivos médicos y fabricación de productos farmacéuticos.
Usuario final
- Compañías farmacéuticas
- Empresas de biotecnología
- Empresas biofarmacéuticas
- Empresas de dispositivos médicos
- Fabricante de equipos originales
- Institutos de investigación
Sobre la base del usuario final, el mercado de fabricación por contrato de Medio Oriente y África está segmentado en fabricantes de equipos originales, empresas de dispositivos médicos, empresas farmacéuticas, empresas de biotecnología, empresas biofarmacéuticas e institutos de investigación.
Canal de distribución
- Ventas al por menor
- Licitación directa
- Otros
Sobre la base del canal de distribución, el mercado de fabricación por contrato de Medio Oriente y África está segmentado en licitaciones directas, ventas minoristas y otros.
Análisis y perspectivas regionales del mercado de fabricación por contrato en Oriente Medio y África
Se analiza el mercado de fabricación por contrato de Medio Oriente y África, y se proporcionan información y tendencias sobre el tamaño del mercado por producto, usuario final y canal de distribución como se mencionó anteriormente.
Algunos de los países incluidos en el informe de fabricación por contrato son Arabia Saudita, Sudáfrica, Emiratos Árabes Unidos, Israel, Kuwait, Egipto y el resto de Medio Oriente y África.
Se espera que Sudáfrica domine debido al creciente avance tecnológico en las áreas en desarrollo.
La sección de países del informe también proporciona factores de impacto de mercado individuales y cambios en la regulación del mercado que afectan las tendencias actuales y futuras del mercado. Los puntos de datos como el análisis de la cadena de valor ascendente y descendente, las tendencias técnicas y el análisis de las cinco fuerzas de Porter, los estudios de casos son algunos de los indicadores utilizados para pronosticar el escenario del mercado para países individuales. Además, la presencia y disponibilidad de marcas de Oriente Medio y África y sus desafíos afrontados debido a la gran o escasa competencia de las marcas locales y nacionales, el impacto de los aranceles nacionales y las rutas comerciales se consideran al proporcionar un análisis de pronóstico de los datos del país.
Análisis del panorama competitivo y de la cuota de mercado de fabricación por contrato en Oriente Medio y África
El panorama competitivo del mercado de fabricación por contrato en Oriente Medio y África proporciona detalles por competidores. Los detalles incluidos son una descripción general de la empresa, las finanzas de la empresa, los ingresos generados, el potencial de mercado, la inversión en investigación y desarrollo, las nuevas iniciativas de mercado, la presencia en Oriente Medio y África, los sitios e instalaciones de producción, las capacidades de producción, las fortalezas y debilidades de la empresa, el lanzamiento de productos, la amplitud y la variedad de productos y el dominio de las aplicaciones. Los puntos de datos anteriores proporcionados solo están relacionados con el enfoque de las empresas en el mercado de fabricación por contrato en Oriente Medio y África.
Algunos actores en el mercado son Aenova Group, Thermo Fisher Scientific Inc., EVONIK INDUSTRIES AG, Lonza, Boehringer Ingelheim Biopharmaceuticals GmbH. y Catalent, Inc entre otros.
SKU-
Obtenga acceso en línea al informe sobre la primera nube de inteligencia de mercado del mundo
- Panel de análisis de datos interactivo
- Panel de análisis de empresas para oportunidades con alto potencial de crecimiento
- Acceso de analista de investigación para personalización y consultas
- Análisis de la competencia con panel interactivo
- Últimas noticias, actualizaciones y análisis de tendencias
- Aproveche el poder del análisis de referencia para un seguimiento integral de la competencia
Tabla de contenido
1 INTRODUCTION
1.1 OBJECTIVES OF THE STUDY
1.2 MARKET DEFINITION
1.3 OVERVIEW OF THE MIDDLE EAST & AFRICA CONTRACT MANUFACTURING MARKET
1.4 CURRENCY AND PRICING
1.5 LIMITATIONS
1.6 MARKETS COVERED
2 MARKET SEGMENTATION
2.1 MARKETS COVERED
2.2 GEOGRAPHICAL SCOPE
2.3 YEARS CONSIDERED FOR THE STUDY
2.4 DBMR TRIPOD DATA VALIDATION MODEL
2.5 PRIMARY INTERVIEWS WITH KEY OPINION LEADERS
2.6 MULTIVARIATE MODELLING
2.7 PRODUCT SEGMENT LIFELINE CURVE
2.8 MARKET END USER COVERAGE GRID
2.9 DBMR MARKET POSITION GRID
2.1 VENDOR SHARE ANALYSIS
2.11 SECONDARY SOURCES
2.12 ASSUMPTIONS
3 EXECUTIVE SUMMARY
4 PREMIUM INSIGHTS
4.1 PESTEL ANALYSIS
4.2 PORTER'S FIVE FORCES
4.3 STRATEGIC INITIATIVES:
5 REGULATORY FRAMEWORK
5.1 REGULATORY SCENARIO BY FDA
5.2 REGULATORY SCENARIO IN AUSTRALIA
5.3 REGULATORY SCENARIO IN EUROPE FOR MEDICINES
6 MARKET OVERVIEW
6.1 DRIVERS
6.1.1 COST-EFFECTIVENESS FOR THE MANUFACTURING COMPANIES
6.1.2 RISE OF TECHNOLOGICAL ADVANCEMENTS IN CONTRACT MANUFACTURING
6.1.3 MIDDLE EAST & AFRICA PRESENCE AND CONNECTED NETWORK
6.2 RESTRAINTS
6.2.1 STRINGENT REGULATIONS AMONG VARIOUS JURISDICTIONS
6.2.2 RISK OF CONFIDENTIAL INFORMATION
6.3 OPPORTUNITIES
6.3.1 PATENT EXPIRY AND INCREASING DEMAND FOR GENERIC DRUGS
6.3.2 GROWING EXPENSES ON THE DEVELOPMENT OF HEALTHCARE INFRASTRUCTURE
6.3.3 INCREASE IN NUMBER OF STRATEGIC INITIATIVES BY KEY MARKET PLAYERS
6.4 CHALLENGES
6.4.1 INTELLECTUAL PROPERTY RISKS
6.4.2 INCREASE IN NUMBER OF PHARMACEUTICAL COMPANIES TO SET UP THEIR MANUFACTURING SITES
7 MIDDLE EAST & AFRICA CONTRACT MANUFACTURING MARKET, BY PRODUCT
7.1 OVERVIEW
7.2 PHARMACEUTICAL PRODUCTS MANUFACTURING
7.2.1 TYPES OF PRODUCTS
7.2.1.1 TABLETS
7.2.1.2 CAPSULES
7.2.1.3 BIOLOGICS
7.2.1.4 SMALL MOLECULE
7.2.1.5 CELL & GENES MANUFACTURING
7.2.1.6 NUTRACEUTICALS
7.2.1.7 OTHERS
7.2.2 TYPE OF SERVICES
7.2.2.1 DRUG DEVELOPMENT SERVICES
7.2.2.2 TABLET MANUFACTURING SERVICES
7.2.2.3 BIOLOGICS API MANUFACTURING
7.2.2.4 BIOLOGICS FDF MANUFACTURING SERVICES
7.2.2.5 OTHERS
7.2.3 BY DOSAGE FORM
7.2.3.1 SOLID FORMULATIONS
7.2.3.2 LIQUID FORMULATIONS
7.2.3.2.1 INJECTABLE
7.2.3.2.2 SYRUPS
7.2.3.3 SEMI-SOLID FORMULATIONS
7.2.3.4 TOPICAL DRUG FORMULATIONS
7.2.3.5 OTHERS
7.3 MEDICAL DEVICE MANUFACTURING
7.3.1 TYPE OF DEVICES
7.3.1.1 SYRINGES AND NEEDLES
7.3.1.2 INFUSION DEVICES & ADMINISTRATION SETS
7.3.1.3 MEDICAL ACCESSORIES, COMPONENTS & CONSUMABLES
7.3.1.4 DISPOSABLES
7.3.1.5 IVD DEVICES
7.3.1.6 CARDIOVASCULAR DEVICES
7.3.1.7 DIABETES CARE DEVICES
7.3.1.8 GENERAL SURGERY DEVICES
7.3.1.9 ORTHOPEDIC DEVICES
7.3.1.10 RESPIRATORY DEVICES
7.3.1.11 OPHTHALMIC DEVICES
7.3.1.12 DENTAL DEVICES
7.3.1.13 GYNECOLOGY/UROLOGY DEVICES
7.3.1.14 LABORATORY EQUIPMENT
7.3.2 TYPE OF SERVICES
7.3.2.1 MEDICAL DEVICE DESIGN AND DEVELOPMENT
7.3.2.2 DEVICE ASSEMBLY
7.3.2.3 REGULATORY ASSISTANCE
7.3.2.4 PACKAGING & LABELLING
7.3.2.5 STERILIZATION SERVICES
7.3.2.6 TRAINING AND VALIDATION
7.3.2.7 QUALITY ASSURANCE
7.3.2.8 OTHERS
7.3.3 BY DEVICE CLASS
7.3.3.1 CLASS I MEDICAL DEVICES
7.3.3.2 CLASS IIA MEDICAL DEVICES
7.3.3.3 CLASS IIB MEDICAL DEVICES
7.3.3.4 CLASS III MEDICAL DEVICES
8 MIDDLE EAST & AFRICA CONTRACT MANUFACTURING MARKET, BY END USER
8.1 OVERVIEW
8.2 PHARMACEUTICAL COMPANIES
8.3 BIOTECHNOLOGY COMPANIES
8.4 BIOPHARMA COMPANIES
8.5 MEDICAL DEVICES COMPANIES
8.6 ORIGINAL EQUIPMENT MANUFACTURER
8.7 RESEARCH INSTITUTES
9 MIDDLE EAST & AFRICA CONTRACT MANUFACTURING MARKET, BY DISTRIBUTION CHANNEL
9.1 OVERVIEW
9.2 RETAIL SALES
9.3 DIRECT TENDER
9.4 OTHERS
10 MIDDLE EAST & AFRICA CONTRACT MANUFACTURING MARKET, BY REGION
10.1 MIDDLE EAST AND AFRICA
10.1.1 SOUTH AFRICA
10.1.2 SAUDI ARABIA
10.1.3 U.A.E.
10.1.4 EGYPT
10.1.5 ISRAEL
10.1.6 REST OF MIDDLE EAST AND AFRICA
11 MIDDLE EAST & AFRICA CONTRACT MANUFACTURING MARKET: COMPANY LANDSCAPE
11.1 COMPANY SHARE ANALYSIS: MIDDLE EAST & AFRICA
12 SWOT ANALYSIS
13 COMPANY PROFILE
13.1 AENOVA GROUP
13.1.1 COMPANY SNAPSHOT
13.1.2 COMPANY SHARE ANALYSIS
13.1.3 PRODUCT PORTFOLIO
13.1.4 RECENT DEVELOPMENTS
13.2 THERMO FISHER SCIENTIFIC INC.
13.2.1 COMPANY SNAPSHOT
13.2.2 REVENUE ANALYSIS
13.2.3 COMPANY SHARE ANALYSIS
13.2.4 PRODUCT PORTFOLIO
13.2.5 RECENT DEVELOPMENTS
13.3 EVONIK INDUSTRIES AG
13.3.1 COMPANY SNAPSHOT
13.3.2 REVENUE ANALYSIS
13.3.3 COMPANY SHARE ANALYSIS
13.3.4 PRODUCT PORTFOLIO
13.3.5 RECENT DEVELOPMENTS
13.4 LONZA
13.4.1 COMPANY SNAPSHOT
13.4.2 REVENUE ANALYSIS
13.4.3 COMPANY SHARE ANALYSIS
13.4.4 PRODUCT PORTFOLIO
13.4.5 RECENT DEVELOPMENTS
13.5 BOEHRINGER INGELHEIM INTERNATIONAL GMBH.
13.5.1 COMPANY SNAPSHOT
13.5.2 REVENUE ANALYSIS
13.5.3 COMPANY SHARE ANALYSIS
13.5.4 PRODUCT PORTFOLIO
13.5.5 RECENT DEVELOPMENTS
13.6 ABBVIE INC.
13.6.1 COMPANY SNAPSHOT
13.6.2 REVENUE ANALYSIS
13.6.3 PRODUCT PORTFOLIO
13.6.4 RECENT DEVELOPMENT
13.7 ALMAC GROUP
13.7.1 COMPANY SNAPSHOT
13.7.2 PRODUCT PORTFOLIO
13.7.3 RECENT DEVELOPMENTS
13.8 AVID BIOSERVICES, INC.
13.8.1 COMPANY SNAPSHOT
13.8.2 REVENUE ANALYSIS
13.8.3 PRODUCT PORTFOLIO
13.8.4 RECENT DEVELOPMENT
13.9 BAXTER
13.9.1 COMPANY SNAPSHOT
13.9.2 REVENUE ANALYSIS
13.9.3 PRODUCT PORTFOLIO
13.9.4 RECENT DEVELOPMENTS
13.1 CATALENT, INC
13.10.1 COMPANY SNAPSHOT
13.10.2 REVENUE ANALYSIS
13.10.3 PRODUCT PORTFOLIO
13.10.4 RECENT DEVELOPMENT
13.11 FAMAR HEALTH CARE SERVICES
13.11.1 COMPANY SNAPSHOT
13.11.2 PRODUCT PORTFOLIO
13.11.3 RECENT DEVELOPMENTS
13.12 JUBILANT PHARMA LIMITED
13.12.1 COMPANY SNAPSHOT
13.12.2 REVENUE ANALYSIS
13.12.3 PRODUCT PORTFOLIO
13.12.4 RECENT DEVELOPMENT
13.13 KIMBALL INTERNATIONAL
13.13.1 COMPANY SNAPSHOT
13.13.2 REVENUE ANALYSIS
13.13.3 PRODUCT PORTFOLIO
13.13.4 RECENT DEVELOPMENT
13.14 MERCK KGAA
13.14.1 COMPANY SNAPSHOT
13.14.2 REVENUE ANALYSIS
13.14.3 PRODUCT PORTFOLIO
13.14.4 RECENT DEVELOPMENTS
13.15 NIPR0
13.15.1 COMPANY SNAPSHOT
13.15.2 REVENUE ANALYSIS
13.15.3 PRODUCT PORTFOLIO
13.15.4 RECENT DEVELOPMENT
13.16 PFIZER INC
13.16.1 COMPANY SNAPSHOT
13.16.2 REVENUE ANALYSIS
13.16.3 PRODUCT PORTFOLIO
13.16.4 RECENT DEVELOPMENT
13.17 RECIPHARM AB.
13.17.1 COMPANY SNAPSHOT
13.17.2 REVENUE ANALYSIS
13.17.3 PRODUCT PORTFOLIO
13.17.4 RECENT DEVELOPMENT
13.18 SIEGFRIED HOLDING AG
13.18.1 COMPANY SNAPSHOT
13.18.2 REVENUE ANALYSIS
13.18.3 PRODUCT PORTFOLIO
13.18.4 RECENT DEVELOPMENTS
13.19 SUN PHARMACEUTICAL INDUSTRIES LTD
13.19.1 COMPANY SNAPSHOT
13.19.2 REVENUE ANALYSIS
13.19.3 PRODUCT PORTFOLIO
13.19.4 RECENT DEVELOPMENT
13.2 TE CONNECTIVITY
13.20.1 COMPANY SNAPSHOT
13.20.2 REVENUE ANALYSIS
13.20.3 PRODUCT PORTFOLIO
13.20.4 RECENT DEVELOPMENT
13.21 VETTER PHARMA-FERTIGUNG GMBH & CO. KG
13.21.1 COMPANY SNAPSHOT
13.21.2 PRODUCT PORTFOLIO
13.21.3 RECENT DEVELOPMENTS
14 QUESTIONNAIRE
15 RELATED REPORTS
Lista de Tablas
TABLE 1 MIDDLE EAST & AFRICA CONTRACT MANUFACTURING MARKET, BY PRODUCT, 2021-2030 (USD MILLION)
TABLE 2 MIDDLE EAST & AFRICA PHARMACEUTICAL PRODUCTS MANUFACTURING IN CONTRACT MANUFACTURING MARKET, BY REGION, 2021-2030 (USD MILLION)
TABLE 3 MIDDLE EAST & AFRICA PHARMACEUTICAL PRODUCTS MANUFACTURING IN CONTRACT MANUFACTURING MARKET, BY PRODUCT, 2021-2030 (USD MILLION)
TABLE 4 MIDDLE EAST & AFRICA TYPES OF PRODUCTS IN CONTRACT MANUFACTURING MARKET, BY PRODUCT, 2021-2030 (USD MILLION)
TABLE 5 MIDDLE EAST & AFRICA BY SERVICES IN CONTRACT MANUFACTURING MARKET, BY PRODUCT, 2021-2030 (USD MILLION)
TABLE 6 MIDDLE EAST & AFRICA BY DOSAGE FORM IN CONTRACT MANUFACTURING MARKET, BY PRODUCT, 2021-2030 (USD MILLION)
TABLE 7 MIDDLE EAST & AFRICA LIQUID FORMULATIONS IN CONTRACT MANUFACTURING MARKET, BY PRODUCT, 2021-2030 (USD MILLION)
TABLE 8 MIDDLE EAST & AFRICA MEDICAL DEVICE MANUFACTURING IN CONTRACT MANUFACTURING MARKET, BY REGION, 2021-2030 (USD MILLION)
TABLE 9 MIDDLE EAST & AFRICA CONSUMABLES AND ACCESSORIES IN CONTRACT MANUFACTURING MARKET, BY PRODUCT, 2021-2030 (USD MILLION)
TABLE 10 MIDDLE EAST & AFRICA TYPE OF DEVICES IN CONTRACT MANUFACTURING MARKET, BY PRODUCT, 2021-2030 (USD MILLION)
TABLE 11 MIDDLE EAST & AFRICA TYPE OF SERVICES IN CONTRACT MANUFACTURING MARKET, BY PRODUCT, 2021-2030 (USD MILLION)
TABLE 12 MIDDLE EAST & AFRICA BY DEVICE CLASS IN CONTRACT MANUFACTURING MARKET, BY PRODUCT, 2021-2030 (USD MILLION)
TABLE 13 MIDDLE EAST & AFRICA CONTRACT MANUFACTURING MARKET, BY END USER, 2021-2030 (USD MILLION)
TABLE 14 MIDDLE EAST & AFRICA PHARMACEUTICAL COMPANIES IN CONTRACT MANUFACTURING MARKET, BY REGION, 2021-2030 (USD MILLION)
TABLE 15 MIDDLE EAST & AFRICA BIOTECHNOLOGY COMPANIES IN CONTRACT MANUFACTURING MARKET, BY REGION, 2021-2030 (USD MILLION)
TABLE 16 MIDDLE EAST & AFRICA BIOPHARMA COMPANIES IN CONTRACT MANUFACTURING MARKET, BY REGION, 2021-2030 (USD MILLION)
TABLE 17 MIDDLE EAST & AFRICA AMBULATORY SURGICAL CENTERS IN CONTRACT MANUFACTURING MARKET, BY REGION, 2021-2030 (USD MILLION)
TABLE 18 MIDDLE EAST & AFRICA ORIGINAL EQUIPMENT MANUFACTURER IN CONTRACT MANUFACTURING MARKET, BY REGION, 2021-2030 (USD MILLION)
TABLE 19 MIDDLE EAST & AFRICA RESEARCH INSTITUTES IN CONTRACT MANUFACTURING MARKET, BY REGION, 2021-2030 (USD MILLION)
TABLE 20 MIDDLE EAST & AFRICA CONTRACT MANUFACTURING MARKET, BY DISTRIBUTION CHANNEL, 2021-2030 (USD MILLION)
TABLE 21 MIDDLE EAST & AFRICA RETAIL SALES IN CONTRACT MANUFACTURING MARKET, BY REGION, 2021-2030 (USD MILLION)
TABLE 22 MIDDLE EAST & AFRICA DIRECT TENDER IN CONTRACT MANUFACTURING MARKET, BY REGION, 2021-2030 (USD MILLION)
TABLE 23 MIDDLE EAST & AFRICA OTHERS IN CONTRACT MANUFACTURING MARKET, BY REGION, 2021-2030 (USD MILLION)
TABLE 24 MIDDLE EAST AND AFRICA CONTRACT MANUFACTURING MARKET, BY COUNTRY, 2021-2030 (USD MILLION)
TABLE 25 MIDDLE EAST AND AFRICA CONTRACT MANUFACTURING MARKET, BY PRODUCT, 2021-2030 (USD MILLION)
TABLE 26 MIDDLE EAST AND AFRICA PHARMACEUTICAL PRODUCTS MANUFACTURING IN CONTRACT MANUFACTURING MARKET, BY PRODUCT, 2021-2030 (USD MILLION)
TABLE 27 MIDDLE EAST AND AFRICA TYPES OF PRODUCT IN CONTRACT MANUFACTURING MARKET, BY PRODUCT, 2021-2030 (USD MILLION)
TABLE 28 MIDDLE EAST AND AFRICA TYPES OF PRODUCT IN CONTRACT MANUFACTURING MARKET, 2021-2030, 2021-2030 (UNIT)
TABLE 29 MIDDLE EAST AND AFRICA TYPES OF PRODUCT IN CONTRACT MANUFACTURING MARKET, BY PRODUCT, 2021-2030 (ASP
TABLE 30 MIDDLE EAST AND AFRICA TYPE OF SERVICES IN CONTRACT MANUFACTURING MARKET, BY PRODUCT, 2021-2030 (USD MILLION)
TABLE 31 MIDDLE EAST AND AFRICA BY DOSAGE FORM IN CONTRACT MANUFACTURING MARKET, BY PRODUCT, 2021-2030 (UNIT)
TABLE 32 MIDDLE EAST AND AFRICA LIQUID FORMULATIONS IN CONTRACT MANUFACTURING MARKET, BY PRODUCT, 2021-2030 (USD MILLION)
TABLE 33 MIDDLE EAST AND AFRICA MEDICAL DEVICES MANUFACTURING IN CONTRACT MANUFACTURING MARKET, BY PRODUCT, 2021-2030 (USD MILLION)
TABLE 34 MIDDLE EAST AND AFRICA TYPES OF DEVICES IN CONTRACT MANUFACTURING MARKET, BY PRODUCT, 2021-2030 (USD MILLION)
TABLE 35 MIDDLE EAST AND AFRICA TYPES OF DEVICES IN CONTRACT MANUFACTURING MARKET, BY PRODUCT, 2021-2030 (UNIT)
TABLE 36 MIDDLE EAST AND AFRICA TYPES OF DEVICES IN CONTRACT MANUFACTURING MARKET, BY PRODUCT, 2021-2030 (ASP)
TABLE 37 MIDDLE EAST AND AFRICA TYPE OF SERVICES IN CONTRACT MANUFACTURING MARKET, BY PRODUCT, 2021-2030 (USD MILLION)
TABLE 38 MIDDLE EAST AND AFRICA BY DEVICE CLASS IN CONTRACT MANUFACTURING MARKET, BY PRODUCT, 2021-2030 (USD MILLION)
TABLE 39 MIDDLE EAST AND AFRICA CONTRACT MANUFACTURING MARKET, BY END USER, 2021-2030 (USD MILLION)
TABLE 40 MIDDLE EAST AND AFRICA CONTRACT MANUFACTURING MARKET, BY DISTRIBUTION CHANNEL, 2021-2030 (USD MILLION)
TABLE 41 SOUTH AFRICA CONTRACT MANUFACTURING MARKET, BY PRODUCT, 2021-2030 (USD MILLION)
TABLE 42 SOUTH AFRICA PHARMACEUTICAL PRODUCTS MANUFACTURING IN CONTRACT MANUFACTURING MARKET, BY PRODUCT, 2021-2030 (USD MILLION)
TABLE 43 SOUTH AFRICA TYPES OF PRODUCT IN CONTRACT MANUFACTURING MARKET, BY PRODUCT, 2021-2030 (USD MILLION)
TABLE 44 SOUTH AFRICA TYPES OF PRODUCT IN CONTRACT MANUFACTURING MARKET, BY PRODUCT, 2021-2030 (UNIT)
TABLE 45 SOUTH AFRICA TYPES OF PRODUCT IN CONTRACT MANUFACTURING MARKET, BY PRODUCT, 2021-2030 (ASP)
TABLE 46 SOUTH AFRICA BY SERVICES IN CONTRACT MANUFACTURING MARKET, BY PRODUCT, 2021-2030 (USD MILLION)
TABLE 47 SOUTH AFRICA BY DOSAGE FORM IN CONTRACT MANUFACTURING MARKET, BY PRODUCT, 2021-2030 (USD MILLION)
TABLE 48 SOUTH AFRICA LIQUID FORMULATIONS IN CONTRACT MANUFACTURING MARKET, BY PRODUCT, 2021-2030 (USD MILLION)
TABLE 49 SOUTH AFRICA MEDICAL DEVICES MANUFACTURING IN CONTRACT MANUFACTURING MARKET, BY PRODUCT, 2021-2030 (USD MILLION)
TABLE 50 SOUTH AFRICA TYPES OF DEVICES IN CONTRACT MANUFACTURING MARKET, BY PRODUCT, 2021-2030 (USD MILLION)
TABLE 51 SOUTH AFRICA TYPES OF DEVICES IN CONTRACT MANUFACTURING MARKET, BY PRODUCT, 2021-2030 (UNIT)
TABLE 52 SOUTH AFRICA TYPES OF DEVICES IN CONTRACT MANUFACTURING MARKET, BY PRODUCT, 2021-2030 (ASP)
TABLE 53 SOUTH AFRICA TYPES OF SERVICES IN CONTRACT MANUFACTURING MARKET, BY PRODUCT, 2021-2030 (USD MILLION)
TABLE 54 SOUTH AFRICA BY DEVICE CLASS IN CONTRACT MANUFACTURING MARKET, BY PRODUCT, 2021-2030 (USD MILLION)
TABLE 55 SOUTH AFRICA CONTRACT MANUFACTURING MARKET, BY END USER, 2021-2030 (USD MILLION)
TABLE 56 SOUTH AFRICA CONTRACT MANUFACTURING MARKET, BY DISTRIBUTION CHANNEL, 2021-2030 (USD MILLION)
TABLE 57 SAUDI ARABIA CONTRACT MANUFACTURING MARKET, BY PRODUCT, 2021-2030 (USD MILLION)
TABLE 58 SAUDI ARABIA PHARMACEUTICAL PRODUCTS MANUFACTURING IN CONTRACT MANUFACTURING MARKET, BY PRODUCT, 2021-2030 (USD MILLION)
TABLE 59 SAUDI ARABIA TYPES OF PRODUCT IN CONTRACT MANUFACTURING MARKET, BY PRODUCT, 2021-2030 (USD MILLION)
TABLE 60 SAUDI ARABIA TYPES OF PRODUCT IN CONTRACT MANUFACTURING MARKET, BY PRODUCT, 2021-2030 (UNIT)
TABLE 61 SAUDI ARABIA TYPES OF PRODUCT IN CONTRACT MANUFACTURING MARKET, BY PRODUCT, 2021-2030 (ASP)
TABLE 62 SAUDI ARABIA BY SERVICES IN CONTRACT MANUFACTURING MARKET, BY PRODUCT, 2021-2030 (USD MILLION)
TABLE 63 SAUDI ARABIA BY DOSAGE FORM IN CONTRACT MANUFACTURING MARKET, BY PRODUCT, 2021-2030 (USD MILLION)
TABLE 64 SAUDI ARABIA LIQUID FORMULATIONS IN CONTRACT MANUFACTURING MARKET, BY PRODUCT, 2021-2030 (USD MILLION)
TABLE 65 SAUDI ARABIA MEDICAL DEVICES MANUFACTURING IN CONTRACT MANUFACTURING MARKET, BY PRODUCT, 2021-2030 (USD MILLION)
TABLE 66 SAUDI ARABIA TYPES OF DEVICES IN CONTRACT MANUFACTURING MARKET, BY PRODUCT, 2021-2030 (USD MILLION)
TABLE 67 SAUDI ARABIA TYPES OF DEVICES IN CONTRACT MANUFACTURING MARKET, BY PRODUCT, 2021-2030 (UNIT)
TABLE 68 SAUDI ARABIA TYPES OF DEVICES IN CONTRACT MANUFACTURING MARKET, BY PRODUCT, 2021-2030 (ASP)
TABLE 69 SAUDI ARABIA TYPES OF SERVICES IN CONTRACT MANUFACTURING MARKET, BY PRODUCT, 2021-2030 (USD MILLION)
TABLE 70 SAUDI ARABIA BY DEVICE CLASS IN CONTRACT MANUFACTURING MARKET, BY PRODUCT, 2021-2030 (USD MILLION)
TABLE 71 SAUDI ARABIA CONTRACT MANUFACTURING MARKET, BY END USER, 2021-2030 (USD MILLION)
TABLE 72 SAUDI ARABIA CONTRACT MANUFACTURING MARKET, BY DISTRIBUTION CHANNEL, 2021-2030 (USD MILLION)
TABLE 73 UA.E. CONTRACT MANUFACTURING MARKET, BY PRODUCT, 2021-2030 (USD MILLION)
TABLE 74 UA.E. PHARMACEUTICAL PRODUCTS MANUFACTURING IN CONTRACT MANUFACTURING MARKET, BY PRODUCT, 2021-2030 (USD MILLION)
TABLE 75 UA.E. TYPES OF PRODUCT IN CONTRACT MANUFACTURING MARKET, BY PRODUCT, 2021-2030 (USD MILLION)
TABLE 76 UA.E. TYPES OF PRODUCT IN CONTRACT MANUFACTURING MARKET, BY PRODUCT, 2021-2030 (UNIT)
TABLE 77 UA.E. TYPES OF PRODUCT IN CONTRACT MANUFACTURING MARKET, BY PRODUCT, 2021-2030 (ASP)
TABLE 78 UA.E. BY SERVICES IN CONTRACT MANUFACTURING MARKET, BY PRODUCT, 2021-2030 (USD MILLION)
TABLE 79 UA.E. BY DOSAGE FORM IN CONTRACT MANUFACTURING MARKET, BY PRODUCT, 2021-2030 (USD MILLION)
TABLE 80 UA.E. LIQUID FORMULATIONS IN CONTRACT MANUFACTURING MARKET, BY PRODUCT, 2021-2030 (USD MILLION)
TABLE 81 UA.E. MEDICAL DEVICES MANUFACTURING IN CONTRACT MANUFACTURING MARKET, BY PRODUCT, 2021-2030 (USD MILLION)
TABLE 82 UA.E. TYPES OF DEVICES IN CONTRACT MANUFACTURING MARKET, BY PRODUCT, 2021-2030 (USD MILLION)
TABLE 83 UA.E. TYPES OF DEVICES IN CONTRACT MANUFACTURING MARKET, BY PRODUCT, 2021-2030 (UNIT)
TABLE 84 UA.E. TYPES OF DEVICES IN CONTRACT MANUFACTURING MARKET, BY PRODUCT, 2021-2030 (ASP)
TABLE 85 UA.E. TYPES OF SERVICES IN CONTRACT MANUFACTURING MARKET, BY PRODUCT, 2021-2030 (USD MILLION)
TABLE 86 UA.E. BY DEVICE CLASS IN CONTRACT MANUFACTURING MARKET, BY PRODUCT, 2021-2030 (USD MILLION)
TABLE 87 UA.E. CONTRACT MANUFACTURING MARKET, BY END USER, 2021-2030 (USD MILLION)
TABLE 88 UA.E. CONTRACT MANUFACTURING MARKET, BY DISTRIBUTION CHANNEL, 2021-2030 (USD MILLION)
TABLE 89 EGYPT CONTRACT MANUFACTURING MARKET, BY PRODUCT, 2021-2030 (USD MILLION)
TABLE 90 EGYPT PHARMACEUTICAL PRODUCTS MANUFACTURING IN CONTRACT MANUFACTURING MARKET, BY PRODUCT, 2021-2030 (USD MILLION)
TABLE 91 EGYPT TYPES OF PRODUCT IN CONTRACT MANUFACTURING MARKET, BY PRODUCT, 2021-2030 (USD MILLION)
TABLE 92 EGYPT TYPES OF PRODUCT IN CONTRACT MANUFACTURING MARKET, BY PRODUCT, 2021-2030 (UNIT)
TABLE 93 EGYPT TYPES OF PRODUCT IN CONTRACT MANUFACTURING MARKET, BY PRODUCT, 2021-2030 (ASP)
TABLE 94 EGYPT BY SERVICES IN CONTRACT MANUFACTURING MARKET, BY PRODUCT, 2021-2030 (USD MILLION)
TABLE 95 EGYPT BY DOSAGE FORM IN CONTRACT MANUFACTURING MARKET, BY PRODUCT, 2021-2030 (USD MILLION)
TABLE 96 EGYPT LIQUID FORMULATIONS IN CONTRACT MANUFACTURING MARKET, BY PRODUCT, 2021-2030 (USD MILLION)
TABLE 97 EGYPT MEDICAL DEVICES MANUFACTURING IN CONTRACT MANUFACTURING MARKET, BY PRODUCT, 2021-2030 (USD MILLION)
TABLE 98 EGYPT TYPES OF DEVICES IN CONTRACT MANUFACTURING MARKET, BY PRODUCT, 2021-2030 (USD MILLION)
TABLE 99 EGYPT TYPES OF DEVICES IN CONTRACT MANUFACTURING MARKET, BY PRODUCT, 2021-2030 (UNIT)
TABLE 100 EGYPT TYPES OF DEVICES IN CONTRACT MANUFACTURING MARKET, BY PRODUCT, 2021-2030 (ASP)
TABLE 101 EGYPT TYPES OF SERVICES IN CONTRACT MANUFACTURING MARKET, BY PRODUCT, 2021-2030 (USD MILLION)
TABLE 102 EGYPT BY DEVICE CLASS IN CONTRACT MANUFACTURING MARKET, BY PRODUCT, 2021-2030 (USD MILLION)
TABLE 103 EGYPT CONTRACT MANUFACTURING MARKET, BY END USER, 2021-2030 (USD MILLION)
TABLE 104 EGYPT CONTRACT MANUFACTURING MARKET, BY DISTRIBUTION CHANNEL, 2021-2030 (USD MILLION)
TABLE 105 ISRAEL CONTRACT MANUFACTURING MARKET, BY PRODUCT, 2021-2030 (USD MILLION)
TABLE 106 ISRAEL PHARMACEUTICAL PRODUCTS MANUFACTURING IN CONTRACT MANUFACTURING MARKET, BY PRODUCT, 2021-2030 (USD MILLION)
TABLE 107 ISRAEL TYPES OF PRODUCT IN CONTRACT MANUFACTURING MARKET, BY PRODUCT, 2021-2030 (USD MILLION)
TABLE 108 ISRAEL TYPES OF PRODUCT IN CONTRACT MANUFACTURING MARKET, BY PRODUCT, 2021-2030 (UNIT)
TABLE 109 ISRAEL TYPES OF PRODUCT IN CONTRACT MANUFACTURING MARKET, BY PRODUCT, 2021-2030 (ASP)
TABLE 110 ISRAEL BY SERVICES IN CONTRACT MANUFACTURING MARKET, BY PRODUCT, 2021-2030 (USD MILLION)
TABLE 111 ISRAEL BY DOSAGE FORM IN CONTRACT MANUFACTURING MARKET, BY PRODUCT, 2021-2030 (USD MILLION)
TABLE 112 ISRAEL LIQUID FORMULATIONS IN CONTRACT MANUFACTURING MARKET, BY PRODUCT, 2021-2030 (USD MILLION)
TABLE 113 ISRAEL MEDICAL DEVICES MANUFACTURING IN CONTRACT MANUFACTURING MARKET, BY PRODUCT, 2021-2030 (USD MILLION)
TABLE 114 ISRAEL TYPES OF DEVICES IN CONTRACT MANUFACTURING MARKET, BY PRODUCT, 2021-2030 (USD MILLION)
TABLE 115 ISRAEL TYPES OF DEVICES IN CONTRACT MANUFACTURING MARKET, BY PRODUCT, 2021-2030 (UNIT)
TABLE 116 ISRAEL TYPES OF DEVICES IN CONTRACT MANUFACTURING MARKET, BY PRODUCT, 2021-2030 (ASP)
TABLE 117 ISRAEL TYPES OF SERVICES IN CONTRACT MANUFACTURING MARKET, BY PRODUCT, 2021-2030 (USD MILLION)
TABLE 118 ISRAEL BY DEVICE CLASS IN CONTRACT MANUFACTURING MARKET, BY PRODUCT, 2021-2030 (USD MILLION)
TABLE 119 ISRAEL CONTRACT MANUFACTURING MARKET, BY END USER, 2021-2030 (USD MILLION)
TABLE 120 ISRAEL CONTRACT MANUFACTURING MARKET, BY DISTRIBUTION CHANNEL, 2021-2030 (USD MILLION)
TABLE 121 REST OF MIDDLE EAST AND AFRICA CONTRACT MANUFACTURING MARKET, BY PRODUCT, 2021-2030 (USD MILLION)
Lista de figuras
FIGURE 1 MIDDLE EAST & AFRICA CONTRACT MANUFACTURING MARKET: SEGMENTATION
FIGURE 2 MIDDLE EAST & AFRICA CONTRACT MANUFACTURING MARKET: DATA TRIANGULATION
FIGURE 3 MIDDLE EAST & AFRICA CONTRACT MANUFACTURING MARKET: DROC ANALYSIS
FIGURE 4 MIDDLE EAST & AFRICA CONTRACT MANUFACTURING MARKET: MIDDLE EAST & AFRICA VS REGIONAL MARKET ANALYSIS
FIGURE 5 MIDDLE EAST & AFRICA CONTRACT MANUFACTURING MARKET: COMPANY RESEARCH ANALYSIS
FIGURE 6 MIDDLE EAST & AFRICA CONTRACT MANUFACTURING MARKET: INTERVIEW DEMOGRAPHICS
FIGURE 7 MIDDLE EAST & AFRICA CONTRACT MANUFACTURING MARKET: MARKET END USER COVERAGE GRID
FIGURE 8 MIDDLE EAST & AFRICA CONTRACT MANUFACTURING MARKET: DBMR MARKET POSITION GRID
FIGURE 9 MIDDLE EAST & AFRICA CONTRACT MANUFACTURING MARKET: VENDOR SHARE ANALYSIS
FIGURE 10 MIDDLE EAST & AFRICA CONTRACT MANUFACTURING MARKET: SEGMENTATION
FIGURE 11 RISING TECHNOLOGICAL ADVANCEMENTS AND COST-EFFECTIVENESS OF PHARMACEUTICAL AND MEDICAL PRODUCTS ARE EXPECTED TO DRIVE THE GROWTH OF THE MIDDLE EAST & AFRICA CONTRACT MANUFACTURING MARKET
FIGURE 12 THE PHARMACEUTICAL PRODUCTS MANUFACTURING SEGMENT IS EXPECTED TO ACCOUNT FOR THE LARGEST SHARE OF THE MIDDLE EAST & AFRICA CONTRACT MANUFACTURING MARKET IN 2023 & 2030
FIGURE 13 NORTH AMERICA IS EXPECTED TO DOMINATE THE MIDDLE EAST & AFRICA CONTRACT MANUFACTURING MARKET AND IS EXPECTED TO GROW WITH THE HIGHEST CAGR IN THE FORECAST PERIOD
FIGURE 14 NORTH AMERICA IS THE FASTEST-GROWING MARKET FOR CONTRACT MANUFACTURING MARKET MANUFACTURERS IN THE FORECAST PERIOD
FIGURE 15 DRIVERS, RESTRAINTS, OPPORTUNITIES, AND CHALLENGES OF THE MIDDLE EAST & AFRICA CONTRACT MANUFACTURING MARKET
FIGURE 16 MIDDLE EAST & AFRICA CONTRACT MANUFACTURING MARKET: BY PRODUCT, 2022
FIGURE 17 MIDDLE EAST & AFRICA CONTRACT MANUFACTURING MARKET: BY PRODUCT, 2023-2030 (USD MILLION)
FIGURE 18 MIDDLE EAST & AFRICA CONTRACT MANUFACTURING MARKET: BY PRODUCT, CAGR (2023-2030)
FIGURE 19 MIDDLE EAST & AFRICA CONTRACT MANUFACTURING MARKET: BY PRODUCT, LIFELINE CURVE
FIGURE 20 MIDDLE EAST & AFRICA CONTRACT MANUFACTURING MARKET: BY END USER, 2022
FIGURE 21 MIDDLE EAST & AFRICA CONTRACT MANUFACTURING MARKET: BY END USER, 2023-2030 (USD MILLION)
FIGURE 22 MIDDLE EAST & AFRICA CONTRACT MANUFACTURING MARKET: BY END USER, CAGR (2023-2030)
FIGURE 23 MIDDLE EAST & AFRICA CONTRACT MANUFACTURING MARKET: BY END USER, LIFELINE CURVE
FIGURE 24 MIDDLE EAST & AFRICA CONTRACT MANUFACTURING MARKET: BY DISTRIBUTION CHANNEL, 2022
FIGURE 25 MIDDLE EAST & AFRICA CONTRACT MANUFACTURING MARKET: BY DISTRIBUTION CHANNEL, 2023-2030 (USD MILLION)
FIGURE 26 MIDDLE EAST & AFRICA CONTRACT MANUFACTURING MARKET: BY DISTRIBUTION CHANNEL, CAGR (2023-2030)
FIGURE 27 MIDDLE EAST & AFRICA CONTRACT MANUFACTURING MARKET: BY DISTRIBUTION CHANNEL, LIFELINE CURVE
FIGURE 28 MIDDLE EAST AND AFRICA CONTRACT MANUFACTURING MARKET: SNAPSHOT (2022)
FIGURE 29 MIDDLE EAST AND AFRICA CONTRACT MANUFACTURING MARKET: BY COUNTRY (2022)
FIGURE 30 MIDDLE EAST AND AFRICA CONTRACT MANUFACTURING MARKET: BY COUNTRY (2023 & 2030)
FIGURE 31 MIDDLE EAST AND AFRICA CONTRACT MANUFACTURING MARKET: BY COUNTRY (2022 & 2030)
FIGURE 32 MIDDLE EAST AND AFRICA CONTRACT MANUFACTURING MARKET: BY PRODUCT (2023-2030)
FIGURE 33 MIDDLE EAST & AFRICA CONTRACT MANUFACTURING MARKET: COMPANY SHARE 2022 (%)

Metodología de investigación
La recopilación de datos y el análisis del año base se realizan utilizando módulos de recopilación de datos con muestras de gran tamaño. La etapa incluye la obtención de información de mercado o datos relacionados a través de varias fuentes y estrategias. Incluye el examen y la planificación de todos los datos adquiridos del pasado con antelación. Asimismo, abarca el examen de las inconsistencias de información observadas en diferentes fuentes de información. Los datos de mercado se analizan y estiman utilizando modelos estadísticos y coherentes de mercado. Además, el análisis de la participación de mercado y el análisis de tendencias clave son los principales factores de éxito en el informe de mercado. Para obtener más información, solicite una llamada de un analista o envíe su consulta.
La metodología de investigación clave utilizada por el equipo de investigación de DBMR es la triangulación de datos, que implica la extracción de datos, el análisis del impacto de las variables de datos en el mercado y la validación primaria (experto en la industria). Los modelos de datos incluyen cuadrícula de posicionamiento de proveedores, análisis de línea de tiempo de mercado, descripción general y guía del mercado, cuadrícula de posicionamiento de la empresa, análisis de patentes, análisis de precios, análisis de participación de mercado de la empresa, estándares de medición, análisis global versus regional y de participación de proveedores. Para obtener más información sobre la metodología de investigación, envíe una consulta para hablar con nuestros expertos de la industria.
Personalización disponible
Data Bridge Market Research es líder en investigación formativa avanzada. Nos enorgullecemos de brindar servicios a nuestros clientes existentes y nuevos con datos y análisis que coinciden y se adaptan a sus objetivos. El informe se puede personalizar para incluir análisis de tendencias de precios de marcas objetivo, comprensión del mercado de países adicionales (solicite la lista de países), datos de resultados de ensayos clínicos, revisión de literatura, análisis de mercado renovado y base de productos. El análisis de mercado de competidores objetivo se puede analizar desde análisis basados en tecnología hasta estrategias de cartera de mercado. Podemos agregar tantos competidores sobre los que necesite datos en el formato y estilo de datos que esté buscando. Nuestro equipo de analistas también puede proporcionarle datos en archivos de Excel sin procesar, tablas dinámicas (libro de datos) o puede ayudarlo a crear presentaciones a partir de los conjuntos de datos disponibles en el informe.

