
Global Virtual Infrastructure Manager Market
Tamaño del mercado en miles de millones de dólares
Tasa de crecimiento anual compuesta (CAGR) :
% 
 USD
3.40 Billion
USD
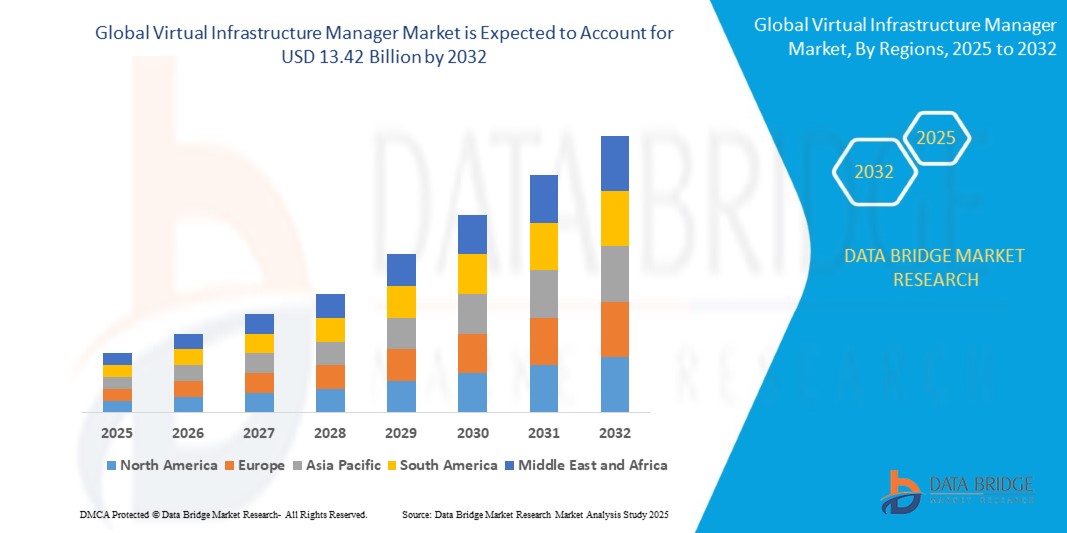
13.42 Billion
2023
2030
USD
3.40 Billion
USD
13.42 Billion
2023
2030
| 2024 –2030 | |
| USD 3.40 Billion | |
| USD 13.42 Billion | |
| % | |
|
Segmentación del mercado global de administradores de infraestructura virtual (VMI), por oferta (soluciones y servicios), desarrollo (IaaS y local), usuario final (TI y telecomunicaciones, BFSI, atención médica, fabricación, comercio minorista y otros): tendencias de la industria y pronóstico hasta 2032.
Tamaño del mercado de administradores de infraestructura virtual
- El tamaño del mercado global de administradores de infraestructura virtual se valoró en USD 3.40 mil millones en 2024 y se espera que alcance los USD 13.42 mil millones para 2032 , con una CAGR del 18,70% durante el período de pronóstico.
- El crecimiento del mercado está impulsado en gran medida por la creciente adopción de infraestructura nativa de la nube, la creciente demanda de gestión centralizada y automatizada del entorno virtual y el cambio creciente hacia la virtualización de funciones de red (NFV) y los centros de datos definidos por software (SDDC) en las empresas.
- La expansión de las iniciativas de transformación digital y el creciente énfasis en optimizar las cargas de trabajo de TI y reducir los gastos de capital (CapEx) están acelerando aún más la adopción de administradores de infraestructura virtual en diversas industrias.
Análisis del mercado de administradores de infraestructura virtual
- La demanda de administradores de infraestructura virtual se está acelerando a medida que las organizaciones priorizan la agilidad, la escalabilidad y la rentabilidad de TI en el manejo de entornos complejos híbridos y de múltiples nubes.
- La creciente implementación de infraestructura 5G y tecnologías de computación de borde está impulsando la necesidad de una orquestación dinámica y en tiempo real de recursos virtuales, donde los administradores de infraestructura virtual desempeñan un papel fundamental.
- América del Norte dominó el mercado de administradores de infraestructura virtual con la mayor participación en los ingresos del 37,82 % en 2024, impulsada por la alta adopción de servicios en la nube, la transformación digital generalizada en todas las industrias y la presencia de proveedores de tecnología clave.
- Se espera que la región Asia-Pacífico sea testigo de la mayor tasa de crecimiento en el mercado global de administradores de infraestructura virtual, impulsada por la creciente penetración de Internet, el rápido crecimiento de los sectores de comercio electrónico y telecomunicaciones, y las iniciativas gubernamentales que apoyan la transformación digital y el desarrollo de ciudades inteligentes en países como China, India y Japón.
- El segmento de soluciones dominó el mercado con la mayor cuota de ingresos, un 61,4 %, en 2024, impulsado por la creciente demanda de gestión centralizada de infraestructura y automatización en entornos virtuales y de nube. Las organizaciones están invirtiendo fuertemente en plataformas de gestión escalables e inteligentes para dar soporte a arquitecturas de TI híbridas y complejas. La rápida adopción de la virtualización en los centros de datos ha impulsado aún más la demanda de soluciones robustas que ofrezcan monitorización, orquestación y optimización del rendimiento en tiempo real.
Alcance del informe y segmentación del mercado de administradores de infraestructura virtual
|
Atributos |
Información clave del mercado de Virtual Infrastructure Manager |
|
Segmentos cubiertos |
|
|
Países cubiertos |
América del norte
Europa
Asia-Pacífico
Oriente Medio y África
Sudamerica
|
|
Actores clave del mercado |
|
|
Oportunidades de mercado |
|
|
Conjuntos de información de datos de valor añadido |
Además de los conocimientos sobre escenarios de mercado como el valor de mercado, la tasa de crecimiento, la segmentación, la cobertura geográfica y los principales actores, los informes de mercado seleccionados por Data Bridge Market Research también incluyen un análisis profundo de expertos, producción y capacidad por empresa representadas geográficamente, diseños de red de distribuidores y socios, análisis detallado y actualizado de tendencias de precios y análisis deficitario de la cadena de suministro y la demanda. |
Tendencias del mercado de administradores de infraestructura virtual
Mayor integración de la inteligencia artificial (IA) y el aprendizaje automático (ML) en la gestión de infraestructuras
- La IA y el aprendizaje automático se integran cada vez más en las plataformas de gestión de infraestructuras virtuales para automatizar tareas rutinarias, gestionar cargas de trabajo y reducir la dependencia humana en entornos de gran escala. Estas tecnologías ayudan a optimizar procesos complejos, mejorar los tiempos de respuesta y garantizar la coherencia en la gestión del rendimiento en grandes infraestructuras digitales.
- Estas tecnologías mejoran la confiabilidad del sistema mediante análisis en tiempo real, diagnósticos automatizados y detección de anomalías. Estas capacidades ayudan a las organizaciones a detectar y resolver problemas de forma proactiva, reduciendo significativamente el tiempo de inactividad de la infraestructura y mejorando la continuidad del servicio al usuario final.
- El balanceo de carga de trabajo impulsado por IA permite la asignación dinámica de recursos de computación, almacenamiento y red según la demanda cambiante en los ecosistemas de nube. Esto garantiza la rentabilidad, evita la infrautilización o sobrecarga de recursos y mejora la capacidad de respuesta del sistema para aplicaciones críticas.
- El mantenimiento predictivo impulsado por algoritmos de aprendizaje automático (ML) ayuda a las empresas a identificar cuellos de botella en el rendimiento, degradación del hardware y tendencias de fallos antes de que afecten a las operaciones. Este enfoque proactivo mejora la estabilidad de la infraestructura, reduce las reparaciones de emergencia y optimiza la planificación de la continuidad del negocio a largo plazo.
- Por ejemplo, la plataforma Turbonomic de IBM utiliza IA para analizar el rendimiento de las aplicaciones en tiempo real y gestionar automáticamente los recursos de infraestructura. Ayuda a las empresas a garantizar que las aplicaciones siempre reciban la capacidad de procesamiento y la memoria que necesitan, sin intervención manual ni sobreaprovisionamiento.
Dinámica del mercado de administradores de infraestructura virtual
Conductor
Creciente demanda de virtualización de funciones de red (NFV) y aplicaciones nativas de la nube
- El auge de la virtualización de funciones de red (NFV) está permitiendo que las redes de telecomunicaciones y empresariales cambien de funciones basadas en hardware a soluciones virtualizadas para una mayor flexibilidad. Al virtualizar servicios de red como el enrutamiento, la conmutación y la seguridad, las organizaciones reducen los costos operativos y mejoran la agilidad del servicio.
- Las aplicaciones nativas de la nube basadas en microservicios y contenedores requieren una orquestación y escalabilidad dinámicas en todas las plataformas de la nube. Los administradores de infraestructura virtual desempeñan un papel fundamental al automatizar la ubicación de los contenedores, gestionar la demanda de almacenamiento y equilibrar el consumo de recursos.
- La virtualización de funciones de red (NFV) permite desacoplar el hardware del software, acelerando la implementación de servicios y simplificando las actualizaciones de red sin necesidad de reconfiguraciones físicas. Esta transformación ayuda a los operadores de telecomunicaciones a responder con mayor rapidez a las demandas de los clientes, minimizando al mismo tiempo la inversión en hardware heredado.
- Los administradores de infraestructura virtual ayudan a reducir la complejidad operativa en entornos híbridos y multiinquilino al automatizar el aprovisionamiento y la monitorización de recursos. Proporcionan un control centralizado sobre las capas de infraestructura, mejorando la visibilidad y la gestión del rendimiento en sistemas distribuidos.
- Por ejemplo, la plataforma OpenStack de Red Hat habilita la infraestructura NFV mediante el uso de administradores de infraestructura virtual (VIM) para lograr alta disponibilidad y una orquestación eficiente. Esto ayuda a los operadores de telecomunicaciones a ofrecer servicios escalables y automatizados con mayor disponibilidad y optimización de recursos.
Restricción/Desafío
“Complejidad en la integración con la infraestructura heredada”
- Muchos sistemas heredados carecen de las API, el soporte de software o la compatibilidad necesarios para funcionar con los gestores de infraestructura virtual modernos. Esto conlleva plazos de integración más largos, mayores costes y mayores riesgos durante la migración de entornos tradicionales a la nube.
- La transición de centros de datos centrados en hardware a una infraestructura definida por software requiere una inversión importante en herramientas y capacitación. La interrupción durante la migración puede afectar temporalmente las operaciones críticas del negocio y reducir la productividad durante el período de adaptación.
- Un desafío clave es la escasez de profesionales capacitados tanto en tecnologías heredadas como en plataformas de virtualización modernas. Esta falta de talento aumenta la carga de trabajo de los departamentos de TI y ralentiza la adopción exitosa de herramientas de gestión de infraestructura virtual.
- Los sistemas heredados suelen operar con protocolos, formatos de archivo y configuraciones de seguridad obsoletos. Su integración con sistemas en la nube optimizados para IA puede exponer vulnerabilidades, aumentar la complejidad y requerir integraciones personalizadas.
- Por ejemplo, a los hospitales que operan sistemas de Historias Clínicas Electrónicas (HCE) heredados les resulta difícil adaptarse a las plataformas de infraestructura modernas debido a la incompatibilidad de datos y a problemas de cumplimiento normativo. Estas limitaciones retrasan las actualizaciones digitales, dificultan la adopción de la nube y frenan la innovación en entornos sanitarios críticos.
Alcance del mercado de los administradores de infraestructura virtual
El mercado está segmentado en función de la oferta, el desarrollo y el usuario final.
• Ofreciendo
En función de la oferta, el mercado de administradores de infraestructura virtual se segmenta en soluciones y servicios. El segmento de soluciones dominó el mercado con la mayor cuota de ingresos, un 61,4 %, en 2024, impulsado por la creciente demanda de gestión centralizada de infraestructura y automatización en entornos virtuales y de nube. Las organizaciones están invirtiendo fuertemente en plataformas de gestión escalables e inteligentes para dar soporte a arquitecturas de TI híbridas y complejas. La rápida adopción de la virtualización en los centros de datos ha impulsado aún más la demanda de soluciones robustas que ofrezcan monitorización, orquestación y optimización del rendimiento en tiempo real.
Se prevé que el segmento de servicios experimente el mayor crecimiento entre 2025 y 2032, impulsado por la creciente dependencia de los servicios gestionados y la integración de sistemas. A medida que las empresas se adentran en la transformación digital, la necesidad de servicios de consultoría, implementación y soporte continúa aumentando, especialmente entre las pequeñas y medianas empresas que carecen de experiencia interna en TI.
• Por Desarrollo
En función de su desarrollo, el mercado se segmenta en Infraestructura como Servicio (IaaS) y local. El segmento IaaS obtuvo la mayor cuota de mercado en 2024, impulsado por el auge de la computación en la nube y la creciente necesidad de soluciones de infraestructura escalables. IaaS ofrece flexibilidad, menor dependencia del hardware y modelos de implementación rentables, esenciales para las empresas que operan en ecosistemas digitales dinámicos.
Se prevé que el segmento local experimente el mayor crecimiento entre 2025 y 2032, impulsado por la demanda de sectores altamente regulados como la banca y la sanidad. Estos sectores prefieren la implementación local para mantener el control sobre los datos confidenciales y cumplir con estrictos estándares de gobernanza, especialmente en regiones con leyes rigurosas de residencia de datos.
• Por el usuario final
En función del usuario final, el mercado se segmenta en TI y telecomunicaciones, banca, servicios financieros y seguros (BFSI), salud, manufactura, comercio minorista, entre otros. El segmento de TI y telecomunicaciones dominó el mercado en 2024, en gran medida debido al aumento de la inversión en tecnologías nativas de la nube y la virtualización para la gestión de funciones de red. La dependencia de este sector de la disponibilidad continua y una infraestructura de alto rendimiento ha acelerado la adopción de gestores de infraestructura virtuales.
Se prevé que el sector sanitario experimente el mayor crecimiento entre 2025 y 2032, impulsado por la digitalización de los historiales clínicos, la expansión de la telemedicina y la necesidad de una infraestructura segura y ágil. Los gestores de infraestructura virtual ayudan a optimizar las operaciones, garantizar el cumplimiento de las normativas de privacidad de datos y respaldar soluciones escalables para el almacenamiento y procesamiento de datos sanitarios.
Análisis regional del mercado de administradores de infraestructura virtual
- América del Norte dominó el mercado de administradores de infraestructura virtual con la mayor participación en los ingresos del 37,82 % en 2024, impulsada por la alta adopción de servicios en la nube, la transformación digital generalizada en todas las industrias y la presencia de proveedores de tecnología clave.
- Las empresas de la región priorizan la escalabilidad de la infraestructura y las operaciones de TI fluidas, lo que hace que los administradores de infraestructura virtual sean fundamentales para mejorar la eficiencia, reducir los costos operativos y mejorar la seguridad de los datos.
- El sólido ecosistema tecnológico, combinado con la adopción temprana de modelos de infraestructura como servicio (IaaS), respalda el crecimiento del mercado en sectores como la banca, la atención médica y las telecomunicaciones.
Perspectivas del mercado de administradores de infraestructura virtual de EE. UU.
El mercado estadounidense de gestores de infraestructura virtual (VMI) capturó la mayor cuota de ingresos, con un 79%, en 2024 en Norteamérica, principalmente gracias a la rápida expansión de aplicaciones nativas de la nube y plataformas de virtualización. La creciente demanda de control centralizado, automatización y gestión eficiente de recursos está impulsando la implementación tanto en el sector privado como en el público. Además, la creciente necesidad de infraestructura de nube híbrida y modernización de centros de datos impulsa a las organizaciones a integrar gestores de infraestructura virtual avanzados. Los principales proveedores de servicios en la nube con sede en EE. UU. también contribuyen a la innovación y la disponibilidad de soluciones en el mercado.
Perspectivas del mercado de gestores de infraestructuras virtuales en Europa
Se prevé que el mercado europeo de gestores de infraestructura virtual registre su mayor crecimiento entre 2025 y 2032, impulsado por el auge de la digitalización empresarial y las estrictas leyes de protección de datos. El Reglamento General de Protección de Datos (RGPD) ha incrementado la demanda de soluciones de gestión de infraestructura seguras y compatibles. Países como Alemania, Francia y los Países Bajos están invirtiendo en tecnologías de virtualización avanzadas para optimizar la infraestructura de TI. La región también se beneficia de un sólido respaldo gubernamental para la adopción de la nube y estrategias de TI sostenibles.
Perspectivas del mercado de gestores de infraestructura virtual del Reino Unido
Se prevé que el mercado británico de gestores de infraestructura virtual registre su mayor crecimiento entre 2025 y 2032, impulsado por una economía digital en expansión y una mayor inversión en TI en los sectores bancario y financiero, minorista y sanitario. La demanda de plataformas de infraestructura virtual ágiles y escalables se ve impulsada por la necesidad de optimizar las operaciones y dar soporte a entornos de teletrabajo. La presencia de proveedores líderes de soluciones en la nube y un dinámico ecosistema de startups tecnológicas impulsa aún más el crecimiento del mercado en el país.
Perspectivas del mercado de gestores de infraestructura virtual de Alemania
Se prevé que el mercado alemán de gestores de infraestructura virtual registre el mayor crecimiento entre 2025 y 2032, gracias a su avanzado sector industrial y a su robusta infraestructura de TI. El compromiso del país con la Industria 4.0 y los conceptos de fábrica digital está impulsando la implementación de infraestructura virtualizada en la fabricación y la ingeniería. Las empresas alemanas también están invirtiendo en modelos locales e híbridos en la nube, lo que requiere herramientas eficientes de gestión de infraestructura que faciliten la escalabilidad, la integridad de los datos y la automatización operativa.
Perspectiva del mercado de administradores de infraestructura virtual de Asia-Pacífico
Se prevé que el mercado de gestores de infraestructura virtual de Asia-Pacífico experimente su mayor crecimiento entre 2025 y 2032, impulsado por el auge digital en economías emergentes como India, China y los países del Sudeste Asiático. La creciente adopción de la computación en la nube, la proliferación de centros de datos y las iniciativas gubernamentales que impulsan la transformación digital son importantes impulsores del crecimiento. A medida que más pequeñas y medianas empresas (pymes) se migran a la infraestructura en la nube, aumenta la demanda de gestores de infraestructura virtual flexibles y rentables.
Perspectivas del mercado de administradores de infraestructura virtual de Japón
Se prevé que el mercado japonés de gestores de infraestructura virtual (VMI) experimente su mayor crecimiento entre 2025 y 2032, impulsado por la transformación digital generalizada en los sectores sanitario, financiero y manufacturero. El fuerte enfoque de Japón en la innovación, la automatización y la resiliencia de las operaciones de TI está impulsando la integración de herramientas de virtualización avanzadas. Las empresas están aprovechando los VMI para aumentar el tiempo de actividad, optimizar el rendimiento y garantizar el cumplimiento normativo en diversas cargas de trabajo. La creciente popularidad de la contenedorización y la computación en el borde también está influyendo en la dinámica del mercado.
Análisis del mercado de China Virtual Infrastructure Manager
El mercado chino de gestores de infraestructura virtual (VMI) representó la mayor cuota de ingresos en Asia-Pacífico en 2024, impulsado por el auge de la generación de datos, el uso de la nube y el desarrollo de ciudades inteligentes. El enfoque del gobierno en la infraestructura digital, junto con la presencia de gigantes nacionales de la nube como Alibaba Cloud y Tencent Cloud, está acelerando la implementación de VMI. Estas herramientas se están adoptando ampliamente en los sectores del comercio electrónico, los servicios financieros y las telecomunicaciones para permitir la escalabilidad en tiempo real, la automatización y la eficiencia de los recursos.
Cuota de mercado de Virtual Infrastructure Manager
La industria de los administradores de infraestructura virtual está liderada principalmente por empresas bien establecidas, entre las que se incluyen:
- SolarWinds Worldwide, LLC (EE. UU.)
- Ciena Corporation (EE. UU.)
- Ribbon Communications Operating Company, Inc. (EE. UU.)
- Corsa Technology Inc. (Canadá)
- Telefonaktiebolaget LM Ericsson (Suecia)
- Broadcom (EE. UU.)
- Fujitsu (Japón)
- IBM Corporation (EE. UU.)
- Nokia (Finlandia)
- NetApp (EE. UU.)
- Enterprise Management Associates, Inc. (EE. UU.)
- Sistemas abiertos virtuales SAS (Francia)
- HashRoot Ltd. (India)
- Tecnología Netedge (India)
- Datanetiix Solutions Inc. (EE. UU.)
- Paessler AG (Alemania)
- Micropro (India)
- eG Innovations (EE. UU.)
- Zuci (Estados Unidos)
Últimos avances en el mercado global de administradores de infraestructura virtual
- En septiembre de 2023, Corsa Technology Inc. se asoció con Eventus Security, proveedor líder de servicios de seguridad gestionada de la India. Eventus amplió su cartera de servicios de seguridad gestionada gracias a esta colaboración al adoptar el servicio de firewall virtual alojado y gestionado de Corsa Security. Gracias a Corsa Security Orchestrator (CSO) y firewalls de software de los principales proveedores, Eventus logró una rápida prestación de servicios, ofreciendo a sus clientes una capacidad de firewall flexible y servicios de seguridad a medida para satisfacer sus necesidades específicas.
- En octubre de 2023, Ciena Corporation presentó sus innovadoras soluciones de banda ancha abierta y su experiencia en Network X 2023 durante el Broadband Forum (BBF) y la prueba de concepto de CloudCo. La demostración destacó las capacidades de Ciena de la puerta de enlace de red de banda ancha virtual (vBNG) y el borde de servicio seguro (SSE) dentro de un marco de borde de servicio de acceso seguro (SASE), que ofrece seguridad en el borde para hogares y pequeñas empresas. Los casos de uso presentados incluyeron internet seguro de alta velocidad como servicio superpuesto con filtrado de spam y protección contra DDoS. Esto beneficia a la empresa para ampliar su cartera de productos y soluciones y, por consiguiente, aumentar sus ingresos.
- En mayo de 2023, Telefonaktiebolaget LM Ericsson recibió el Premio a la Sostenibilidad de la Red Mundial FutureNet por su solución de Gestión Predictiva de la Energía Celular (PCEM). Reconocida por reducir el consumo energético sin comprometer la calidad del servicio, PCEM es un componente clave de la oferta de Operaciones de Infraestructura Energética de Ericsson. Esta aplicación multiproveedor y multitecnología optimiza el consumo energético a nivel celular, garantizando la calidad de la red y la experiencia del cliente. Esto beneficia a la empresa al impulsar su imagen en el sector de TI.
- En enero de 2023, Micropro resultó victoriosa en los Premios Digital India, un prestigioso galardón otorgado por el Ministerio de Electrónica y Tecnología de la Información del Gobierno de la India. El premio reconoce la excelencia en iniciativas de gobierno electrónico y destaca la destacada contribución de Micropro a la transformación digital de la India. Esto beneficia a la empresa y fortalece su imagen en la región.
- En agosto de 2022, SolarWinds Worldwide, LLC fue reconocida en los Informes Radar de GigaOm como Líder en Observabilidad de Redes y Nubes de 2022. Las soluciones de observabilidad híbrida y multicloud de la compañía fueron elogiadas por mejorar la visibilidad, la inteligencia y la productividad empresarial en los entornos de red distribuidos actuales. El reconocimiento de GigaOm posicionó a SolarWinds como Líder y Destacado en Observabilidad de Redes, así como Líder y Avanzado en Soluciones de Observabilidad de Nubes de 2022. Las evaluaciones se basaron en las capacidades técnicas, la hoja de ruta de productos, la innovación y la capacidad de ejecución. Esto beneficia a la compañía al acelerar sus esfuerzos de transformación digital y adoptar una postura proactiva de TI.
SKU-
Obtenga acceso en línea al informe sobre la primera nube de inteligencia de mercado del mundo

- Panel de análisis de datos interactivo
- Panel de análisis de empresas para oportunidades con alto potencial de crecimiento
- Acceso de analista de investigación para personalización y consultas
- Análisis de la competencia con panel interactivo
- Últimas noticias, actualizaciones y análisis de tendencias
- Aproveche el poder del análisis de referencia para un seguimiento integral de la competencia
Metodología de investigación
La recopilación de datos y el análisis del año base se realizan utilizando módulos de recopilación de datos con muestras de gran tamaño. La etapa incluye la obtención de información de mercado o datos relacionados a través de varias fuentes y estrategias. Incluye el examen y la planificación de todos los datos adquiridos del pasado con antelación. Asimismo, abarca el examen de las inconsistencias de información observadas en diferentes fuentes de información. Los datos de mercado se analizan y estiman utilizando modelos estadísticos y coherentes de mercado. Además, el análisis de la participación de mercado y el análisis de tendencias clave son los principales factores de éxito en el informe de mercado. Para obtener más información, solicite una llamada de un analista o envíe su consulta.
La metodología de investigación clave utilizada por el equipo de investigación de DBMR es la triangulación de datos, que implica la extracción de datos, el análisis del impacto de las variables de datos en el mercado y la validación primaria (experto en la industria). Los modelos de datos incluyen cuadrícula de posicionamiento de proveedores, análisis de línea de tiempo de mercado, descripción general y guía del mercado, cuadrícula de posicionamiento de la empresa, análisis de patentes, análisis de precios, análisis de participación de mercado de la empresa, estándares de medición, análisis global versus regional y de participación de proveedores. Para obtener más información sobre la metodología de investigación, envíe una consulta para hablar con nuestros expertos de la industria.
Personalización disponible
Data Bridge Market Research es líder en investigación formativa avanzada. Nos enorgullecemos de brindar servicios a nuestros clientes existentes y nuevos con datos y análisis que coinciden y se adaptan a sus objetivos. El informe se puede personalizar para incluir análisis de tendencias de precios de marcas objetivo, comprensión del mercado de países adicionales (solicite la lista de países), datos de resultados de ensayos clínicos, revisión de literatura, análisis de mercado renovado y base de productos. El análisis de mercado de competidores objetivo se puede analizar desde análisis basados en tecnología hasta estrategias de cartera de mercado. Podemos agregar tantos competidores sobre los que necesite datos en el formato y estilo de datos que esté buscando. Nuestro equipo de analistas también puede proporcionarle datos en archivos de Excel sin procesar, tablas dinámicas (libro de datos) o puede ayudarlo a crear presentaciones a partir de los conjuntos de datos disponibles en el informe.

