
Global Trauma Fixation Market
Tamaño del mercado en miles de millones de dólares
Tasa de crecimiento anual compuesta (CAGR) :
% 
 USD
12.57 Billion
USD
27.55 Billion
2024
2032
USD
12.57 Billion
USD
27.55 Billion
2024
2032
| 2025 –2032 | |
| USD 12.57 Billion | |
| USD 27.55 Billion | |
| % | |
|
Segmentación del mercado global de fijación de traumatismos por tipo de producto (dispositivos de fijación interna y externa), material (implante metálico [acero, titanio y otros], fibra de carbono [ termoplástica ], implantes híbridos, bioabsorbibles, injertos y ortobiología), aplicación (hombro y codo, mano y muñeca, pelvis, cadera y fémur, tibia, craneomaxilofacial, rodilla, pie y tobillo, columna vertebral y otros), usuario final (hospitales, centros de cirugía ambulatoria, centros de traumatología y otros), canal de distribución (licitación directa, venta minorista y venta en línea), tendencias de la industria y pronóstico hasta 2032.
Tamaño del mercado de fijación de traumas
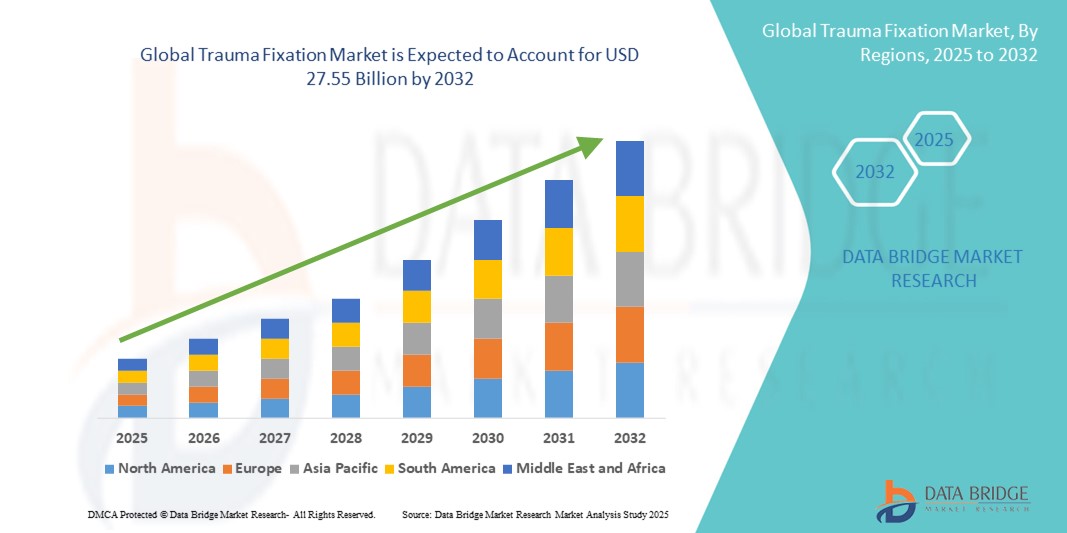
- El tamaño del mercado global de fijación de traumas se valoró en USD 12,57 mil millones en 2024 y se espera que alcance los USD 27,55 mil millones para 2032 , con una CAGR del 10,3% durante el período de pronóstico.
- El crecimiento del mercado se debe en gran medida a la creciente incidencia de traumatismos por accidentes de tráfico, caídas y lesiones deportivas, una tendencia intensificada por la urbanización, el aumento del uso de vehículos y el envejecimiento de la población. Estos factores impulsan la demanda de dispositivos eficaces de fijación de traumatismos que estabilicen las fracturas y faciliten la recuperación.
- Además, la innovación tecnológica juega un papel crucial: avances como las técnicas quirúrgicas mínimamente invasivas, los materiales bioabsorbibles en fijadores internos, los implantes personalizados impresos en 3D y los recubrimientos de dispositivos inteligentes están mejorando la eficacia del dispositivo, reduciendo el tiempo de recuperación y mejorando los resultados de los pacientes.
Análisis del mercado de fijación de traumatismos
- Los dispositivos de fijación para traumatismos, esenciales para estabilizar y sujetar los huesos fracturados durante el proceso de consolidación, son cada vez más cruciales en la atención ortopédica y traumatológica. Estos dispositivos se utilizan ampliamente tanto en hospitales como en centros de cirugía ambulatoria debido a su eficacia para mejorar la recuperación del paciente, reducir el riesgo de complicaciones y permitir una movilización temprana.
- La creciente demanda de soluciones de fijación de traumatismos se debe principalmente a la creciente incidencia de accidentes de tráfico, lesiones relacionadas con el deporte y caídas entre la población de edad avanzada, junto con los avances en técnicas quirúrgicas mínimamente invasivas y el desarrollo de materiales bioreabsorbibles.
- Norteamérica dominó el mercado de fijación de traumatismos con la mayor participación en los ingresos, un 39,8 % en 2024, gracias a una infraestructura sanitaria avanzada, un mayor gasto sanitario y una sólida presencia de fabricantes líderes de dispositivos médicos. EE. UU. lidera el crecimiento regional, impulsado por la alta adopción de sistemas de fijación innovadores, políticas de reembolso favorables y el aumento de casos de ortopedia geriátrica.
- Se proyecta que Asia-Pacífico sea la región de más rápido crecimiento en el mercado de fijación de traumatismos durante el período de pronóstico, con una CAGR del 7,9 %, debido al aumento de las inversiones en atención médica, la creciente conciencia sobre las opciones de tratamiento avanzadas y la expansión del acceso a la atención ortopédica en países como China, India y Japón.
- El segmento de dispositivos fijadores internos dominó el mercado de fijación de traumatismos con el 61,4 % de la participación en los ingresos del mercado en 2024, impulsado por su capacidad para proporcionar una fijación estable, permitir la movilización temprana y reducir los tiempos de recuperación de los pacientes con fracturas complejas.
Alcance del informe y segmentación del mercado de fijación de traumatismos
|
Atributos |
Perspectivas clave del mercado de la fijación del trauma |
|
Segmentos cubiertos |
|
|
Países cubiertos |
América del norte
Europa
Asia-Pacífico
Oriente Medio y África
Sudamerica
|
|
Actores clave del mercado |
|
|
Oportunidades de mercado |
|
|
Conjuntos de información de datos de valor añadido |
Además de los conocimientos sobre escenarios de mercado, como valor de mercado, tasa de crecimiento, segmentación, cobertura geográfica y actores principales, los informes de mercado seleccionados por Data Bridge Market Research también incluyen análisis en profundidad de expertos, análisis de precios, análisis de participación de marca, encuesta de consumidores, análisis demográfico, análisis de la cadena de suministro, análisis de la cadena de valor, descripción general de materias primas/consumibles, criterios de selección de proveedores, análisis PESTLE, análisis de Porter y marco regulatorio. |
Tendencias del mercado de la fijación de traumas
Aumento de las técnicas de fijación de traumas mínimamente invasivas y centradas en el paciente
- Una tendencia significativa y en auge en el mercado global de la fijación de traumatismos es la creciente adopción de procedimientos quirúrgicos mínimamente invasivos (CMI). Estos enfoques, como la fijación percutánea, el enclavado intramedular y los sistemas avanzados de placas, se están adoptando cada vez más porque reducen el traumatismo tisular, disminuyen el riesgo de infección y acortan significativamente los tiempos de recuperación del paciente, lo que permite un alta más rápida y mejores resultados clínicos.
- Por ejemplo, DePuy Synthes ofrece el sistema de placas periprotésicas VA LCP, diseñado para aplicaciones MIS, que minimiza la exposición quirúrgica a la vez que mantiene una fijación rígida para fracturas complejas. De igual manera, el clavo intertrocantérico TRIGEN INTERTAN de Smith+Nephew permite la estabilización de fracturas mediante incisiones más pequeñas, lo que resulta en una menor pérdida de sangre y una movilización más rápida.
- Los sistemas de fijación híbridos, que combinan elementos de fijación interna y externa, también están ganando terreno, ya que ofrecen estrategias de estabilización personalizadas para fracturas complejas. Por ejemplo, Galaxy Fixation Gemini® de Orthofix permite a los cirujanos cambiar de fijación externa a interna sin eliminar completamente la estabilización, lo que permite una adaptación a las necesidades específicas del paciente.
- Otro avance importante es el auge de los implantes específicos para cada paciente, producidos mediante imágenes de alta resolución y fabricación aditiva (impresión 3D). Por ejemplo, Materialise y Johnson & Johnson han colaborado para producir placas CMF personalizadas, adaptadas a la anatomía única de cada paciente, lo que mejora el ajuste del implante, el rendimiento biomecánico y la satisfacción del paciente.
- La adopción de biomateriales avanzados también está transformando el mercado. El titanio sigue siendo el estándar de oro en cuanto a resistencia y biocompatibilidad, mientras que los materiales bioabsorbibles como el PLA y el PGA están ganando popularidad, especialmente en casos pediátricos, eliminando la necesidad de una segunda cirugía para la extracción del implante. La espuma bioactiva Vitoss de Stryker es un ejemplo de biomaterial que promueve la regeneración ósea y es reabsorbible con el tiempo.
- El avance hacia dispositivos de fijación compatibles con centros de cirugía ambulatoria (CAA) también se está acelerando. Los productos diseñados para procedimientos ambulatorios, como el sistema de placa de bloqueo periarticular de Zimmer Biomet, favorecen una recuperación más rápida, reducen las estancias hospitalarias y el riesgo de infección, en consonancia con la creciente prioridad de los sistemas de salud en la rentabilidad y la comodidad del paciente.
Dinámica del mercado de la fijación de traumas
Conductor
Necesidad creciente debido a la creciente incidencia de lesiones ortopédicas y los avances en los procedimientos quirúrgicos
- La creciente prevalencia de lesiones ortopédicas, fracturas y traumatismos causados por accidentes de tráfico, incidentes deportivos y la degeneración ósea relacionada con la edad es un factor importante que impulsa la demanda mundial de dispositivos de fijación de traumatismos. Tanto en países desarrollados como en desarrollo se observa un aumento de casos que requieren intervención quirúrgica para la estabilización y alineación ósea.
- Por ejemplo, en abril de 2024, Onity, Inc. (Honeywell International, Inc.) introdujo avances en herramientas de planificación quirúrgica basadas en IoT, diseñadas para ayudar a los cirujanos ortopédicos a lograr una mayor precisión durante los procedimientos de fijación de traumatismos. Esta innovación refleja el creciente énfasis en la integración de tecnología avanzada en soluciones quirúrgicas, mejorando así la recuperación de los pacientes y la eficiencia operativa en hospitales y centros de traumatología.
- A medida que los profesionales de la salud buscan mejorar los tiempos de recuperación y reducir las complicaciones posquirúrgicas, los dispositivos de fijación de traumatismos (como placas, tornillos, varillas y fijadores externos) son cada vez más preferidos por su capacidad de proporcionar estabilidad ósea inmediata y facilitar la movilización temprana de los pacientes.
- Además, los continuos avances en cirugías ortopédicas mínimamente invasivas y el desarrollo de materiales de fijación biocompatibles hacen que las soluciones de fijación para traumatismos sean más eficaces y seguras. Estas innovaciones también contribuyen a reducir las estancias hospitalarias y a mejorar la calidad de vida de los pacientes.
- La creciente demanda de dispositivos de fijación personalizados, la disponibilidad de impresión 3D en la fabricación médica y un número cada vez mayor de unidades especializadas de atención de traumatismos ortopédicos están impulsando aún más la expansión del mercado de fijación de traumatismos tanto en clínicas residenciales como en entornos hospitalarios a gran escala.
Restricción/Desafío
Preocupaciones sobre los riesgos quirúrgicos y los altos costos iniciales
- A pesar del gran potencial de mercado, la adopción de la fijación de traumas enfrenta desafíos debido a riesgos quirúrgicos como infecciones, rechazo de implantes y la necesidad de cirugías de revisión. Estas complicaciones pueden afectar la confianza del paciente e influir en las recomendaciones de los cirujanos, especialmente en regiones con acceso limitado a cuidados postoperatorios avanzados.
- Por ejemplo, informes clínicos de alto perfil sobre complicaciones posquirúrgicas (como aflojamiento de implantes o fallas del hardware) han aumentado la conciencia sobre la importancia del control de calidad en la fabricación de fijación de traumatismos y la mejora de las habilidades quirúrgicas.
- Para abordar estos riesgos se requiere el uso de materiales biocompatibles de alta calidad, el cumplimiento de estrictos protocolos de esterilización y la capacitación continua de los cirujanos ortopédicos. Empresas como Stryker y Zimmer Biomet destacan sus sólidos esfuerzos en I+D para producir sistemas de fijación con mayor durabilidad, menor riesgo de infección y mayor compatibilidad con el paciente.
- Otra barrera importante es el costo inicial relativamente alto de los sistemas avanzados de fijación de traumatismos en comparación con los métodos tradicionales de reparación ortopédica. En regiones con precios sensibles, especialmente en países de ingresos bajos y medios, esto puede disuadir a hospitales y pacientes de adoptar soluciones de alta gama. Si bien los dispositivos de fijación básicos son cada vez más asequibles, los sistemas avanzados —integrados con herramientas de navegación o fabricados con aleaciones especializadas— siguen siendo caros.
- Para superar estos desafíos es necesario no solo hacer que los sistemas de fijación de traumas sean más rentables, sino también implementar políticas de salud pública que respalden la atención ortopédica subsidiada, ampliar la cobertura del seguro de salud y aumentar la conciencia de los pacientes sobre los beneficios a largo plazo de los dispositivos de fijación de traumas de alta calidad.
Alcance del mercado de la fijación de traumas
El mercado está segmentado según el tipo de producto, material, aplicación, usuario final y canal de distribución.
- Por tipo de producto
Según el tipo de producto, el mercado de fijación para traumatismos se segmenta en fijadores internos y externos. El segmento de fijadores internos representó el 61,4 % de los ingresos del mercado en 2024, gracias a su capacidad para proporcionar una fijación estable, facilitar la movilización temprana y reducir los tiempos de recuperación en pacientes con fracturas complejas. Dispositivos como placas, tornillos, varillas y clavos son ampliamente utilizados en cirugías ortopédicas, tanto electivas como de urgencia, gracias a sus resultados comprobados a largo plazo y su compatibilidad con técnicas mínimamente invasivas. Este segmento también se beneficia de la innovación continua en diseño, como placas con contornos anatómicos y sistemas de tornillos de bloqueo que mejoran la precisión quirúrgica.
Se prevé que el segmento de fijadores externos registre la tasa de crecimiento anual compuesta (TCAC) más rápida, del 7,9 %, entre 2025 y 2032, gracias a su versatilidad para el tratamiento de fracturas expuestas, deformidades óseas complejas y casos de traumatismos graves donde la fijación interna no es viable. La creciente demanda de fijadores externos modulares y ligeros, junto con su mayor adopción en entornos de bajos recursos gracias a su reutilización, está impulsando aún más la expansión del mercado.
- Por material
En función del material, el mercado de la fijación de traumatismos se segmenta en implantes metálicos (acero, titanio y otros), fibra de carbono (termoplástica), implantes híbridos, materiales bioabsorbibles, injertos y productos ortobiológicos. El segmento de implantes metálicos representó el 54,8 % de la cuota de mercado en 2024, con el titanio como material dominante gracias a su biocompatibilidad, resistencia a la corrosión y capacidad de integración con el tejido óseo. El acero inoxidable sigue siendo una opción rentable, especialmente en las economías emergentes, para aplicaciones de alta resistencia y carga.
Se proyecta que el segmento de fibra de carbono (termoplástica) crecerá a la tasa de crecimiento anual compuesta (TCAC) más alta, del 8,4 %, entre 2025 y 2032, impulsada por su radiotransparencia (que permite obtener imágenes nítidas sin interferencias) y su ligereza, que mejora la comodidad del paciente. El desarrollo de implantes híbridos que combinan materiales metálicos y compuestos, así como la creciente adopción de implantes bioabsorbibles que eliminan la necesidad de cirugía de extracción, está transformando el panorama de los materiales para la fijación de traumatismos. Los injertos y los productos ortobiológicos representan actualmente el 8,7 % del mercado y están ganando terreno gracias a su capacidad para estimular la consolidación ósea y mejorar los resultados de la recuperación.
- Por aplicación
Según su aplicación, el mercado de fijación de traumatismos se segmenta en hombro y codo, mano y muñeca, pelvis, cadera y fémur, tibia, craneomaxilofacial, rodilla, pie y tobillo, columna vertebral, entre otros. El segmento de cadera y fémur registró la mayor participación en los ingresos, con un 28,3 %, en 2024, impulsado por la alta incidencia de fracturas en la población de edad avanzada y el creciente número de procedimientos de reemplazo total y parcial de cadera en todo el mundo. Estas lesiones suelen requerir sistemas de fijación robustos para restaurar la movilidad y reducir el riesgo de complicaciones.
Se prevé que el segmento craneomaxilofacial registre la tasa de crecimiento anual compuesta (TCAC) más rápida, del 9,1 %, entre 2025 y 2032, impulsada por los avances en la tecnología de impresión 3D para implantes específicos para cada paciente y la creciente demanda de cirugías reconstructivas tras traumatismos o defectos congénitos. El aumento de las lesiones deportivas y los accidentes de tráfico también contribuye al aumento de la demanda en múltiples segmentos de aplicación, como la fijación de rodilla (6,3 % en 2024) y tobillo.
- Por el usuario final
Según el usuario final, el mercado de fijación de traumatismos se segmenta en hospitales, centros de cirugía ambulatoria, centros de traumatología y otros. El segmento de hospitales dominó el mercado en 2024 con una participación del 66,5 %, gracias a su infraestructura avanzada, cirujanos ortopédicos cualificados y su capacidad para gestionar casos de traumatismos complejos que requieren atención multidisciplinaria. Los hospitales también lideran la adopción de nuevas tecnologías quirúrgicas y sistemas de fijación de alta gama mediante colaboraciones con fabricantes de dispositivos médicos.
Se prevé que el segmento de centros de cirugía ambulatoria experimente la tasa de crecimiento anual compuesta (TCAC) más rápida, del 8,2 %, entre 2025 y 2032, impulsada por la transición hacia procedimientos ortopédicos ambulatorios, la rentabilidad y la reducción de los tiempos de espera de los pacientes. Los centros de traumatología representaron el 14,6 % del mercado en 2024 y siguen desempeñando un papel fundamental en la gestión de fracturas de emergencia, especialmente en regiones con altas tasas de accidentes.
- Por canal de distribución
Según el canal de distribución, el mercado de fijación de traumatismos se segmenta en licitación directa, venta minorista y venta en línea. El segmento de licitación directa representó el 72,8 % de los ingresos en 2024, gracias a las compras al por mayor por parte de hospitales e instituciones sanitarias públicas, lo que garantiza un suministro constante y ahorros de costos.
Se prevé que el segmento de ventas en línea registre la tasa de crecimiento anual compuesta (TCAC) más rápida, del 9,4 %, entre 2025 y 2032, gracias a la creciente aceptación de las plataformas digitales de compras, la mayor visibilidad de los productos y los precios competitivos. Los canales de venta minorista mantienen una cuota del 14,2 % en 2024 y siguen siendo importantes para las clínicas más pequeñas y las consultas privadas que buscan la disponibilidad inmediata de productos.
Análisis regional del mercado de fijación de traumatismos
- América del Norte dominó el mercado de fijación de traumas con la mayor participación en los ingresos del 39,8 % en 2024, impulsada por la creciente prevalencia de lesiones traumáticas, incluidas fracturas por accidentes vehiculares, traumas relacionados con el deporte e incidentes en el lugar de trabajo.
- La región se beneficia de una infraestructura sanitaria consolidada, una amplia disponibilidad de centros de atención traumatológica avanzados y un fuerte enfoque en la adopción de tecnologías de fijación quirúrgica de vanguardia. El elevado gasto sanitario, las políticas gubernamentales de reembolso favorables y la creciente concienciación de los pacientes sobre los procedimientos de fijación innovadores contribuyen en conjunto al liderazgo de Norteamérica en el mercado.
- Los consumidores de la región valoran enormemente los dispositivos avanzados de fijación de traumatismos, que ofrecen mejores resultados para los pacientes, como tiempos de curación más cortos, mayor estabilidad biomecánica y menor riesgo de infección. La creciente adopción de técnicas quirúrgicas mínimamente invasivas e implantes de bioingeniería impulsa aún más la demanda.
Perspectiva del mercado de la fijación del trauma en EE. UU.
El mercado estadounidense de fijación de traumatismos captó la mayor cuota de ingresos, con un 69%, en 2024 en Norteamérica, impulsado por la creciente incidencia de lesiones ortopédicas y fracturas debido a una población activa y al aumento de la población de edad avanzada propensa a la osteoporosis. Los profesionales sanitarios del país están adoptando cada vez más sistemas de fijación tecnológicamente sofisticados, como clavos intramedulares, placas bloqueadas y fijadores externos diseñados para el tratamiento de fracturas complejas. Las innovaciones en materiales para implantes, como las aleaciones de titanio y los polímeros bioabsorbibles, junto con las mejoras en los procedimientos quirúrgicos, están impulsando el crecimiento del mercado. Además, las continuas inversiones en investigación sobre traumatismos y los sólidos marcos de reembolso convierten a EE. UU. en un motor de crecimiento clave en este sector.
Perspectivas del mercado europeo de fijación de traumatismos
Se proyecta que el mercado europeo de fijación de traumatismos se expandirá a una tasa de crecimiento anual compuesta (TCAC) sustancial durante el período de pronóstico, impulsado principalmente por el envejecimiento de la población y el consiguiente aumento de las fracturas relacionadas con la osteoporosis. La creciente concienciación sobre la salud y las políticas favorables que fomentan la intervención quirúrgica temprana en casos de traumatismos están impulsando aún más la demanda. La región también observa un fuerte enfoque en el cumplimiento normativo y el control de calidad, garantizando la amplia disponibilidad de dispositivos de fijación de traumatismos seguros y eficaces. Además, los avances en sistemas de fijación híbridos e implantes específicos para cada paciente, diseñados mediante impresión 3D, están cobrando impulso. La urbanización y el aumento de los accidentes de tráfico también contribuyen al aumento de los casos de traumatismos, especialmente en países como Francia, Italia y España.
Perspectivas del mercado de fijación de traumas en el Reino Unido
Se prevé que el mercado británico de fijación de traumatismos crezca a una tasa de crecimiento anual compuesta (TCAC) notable durante el período de pronóstico, impulsado por el aumento del número de fracturas por caídas, especialmente entre la población de edad avanzada. Las iniciativas del Servicio Nacional de Salud (NHS) para mejorar las vías de atención a los traumatismos y reducir los tiempos de espera quirúrgicos han impulsado la adopción de tecnologías de fijación avanzadas. Además, la creciente preferencia por la cirugía mínimamente invasiva en el tratamiento de traumatismos para reducir las estancias hospitalarias y las complicaciones postoperatorias está fomentando el uso de implantes y dispositivos de fijación modernos. El aumento de las inversiones en infraestructura sanitaria y la formación de cirujanos ortopédicos también contribuye a la expansión del mercado.
Análisis del mercado de fijación de traumatismos en Alemania
Se espera que el mercado alemán de fijación de traumas se expanda a una tasa de crecimiento anual compuesta (TCAC) considerable durante el período de pronóstico, impulsado por una mayor concienciación sobre la atención avanzada a los traumas y la creciente demanda de materiales de fijación de alta calidad y respetuosos con el medio ambiente, como el titanio y los bioabsorbibles. La sólida base de fabricación de dispositivos médicos de Alemania y su énfasis en la innovación le otorgan una ventaja competitiva. Además, la sólida infraestructura sanitaria del país y el apoyo gubernamental a las soluciones de salud digital permiten una adopción más rápida de las nuevas tecnologías de fijación de traumas. El aumento de las lesiones deportivas y los accidentes de tráfico incrementa aún más la demanda de dispositivos de fijación fiables y versátiles.
Perspectiva del mercado de fijación de traumas en Asia-Pacífico
Se prevé que el mercado de fijación de traumatismos en Asia-Pacífico crezca a la tasa de crecimiento anual compuesta (TCAC) más rápida, del 7,9 %, durante el período de pronóstico de 2025 a 2032, impulsado por la rápida urbanización, la industrialización y el aumento de los accidentes de tráfico en países como China, India y Japón. El aumento de la renta disponible, la mejora del acceso a la atención médica y las crecientes iniciativas gubernamentales destinadas a fortalecer la infraestructura para la atención de traumatismos son importantes catalizadores del crecimiento. La región está experimentando un aumento repentino de la demanda de dispositivos de fijación de traumatismos asequibles y tecnológicamente avanzados, respaldados por centros de fabricación locales. Además, la creciente concienciación sobre la salud ortopédica y los procedimientos quirúrgicos mínimamente invasivos está impulsando el crecimiento del mercado. La creciente población geriátrica, con mayor susceptibilidad a las fracturas, también contribuye significativamente al auge del mercado.
Perspectivas del mercado de fijación de traumas en Japón
El mercado japonés de fijación de traumatismos está cobrando impulso debido al rápido envejecimiento de la población, lo que se traduce en una mayor incidencia de fracturas por fragilidad y casos de traumatismos relacionados. El énfasis del sistema sanitario en la intervención temprana, los planes de tratamiento específicos para cada paciente y las técnicas de fijación mínimamente invasivas impulsa la demanda de dispositivos avanzados de fijación de traumatismos. El consolidado ecosistema de investigación médica de Japón impulsa la innovación continua en el diseño de implantes y procedimientos quirúrgicos. Además, la integración tecnológica, como la mejora de la imagenología y la cirugía asistida por robot, mejora la precisión quirúrgica y los resultados para los pacientes, impulsando el crecimiento del mercado.
Análisis del mercado de fijación de traumatismos en China
El mercado chino de fijación de traumatismos representó la mayor cuota de mercado en ingresos en Asia Pacífico en 2024, debido a la rápida urbanización, la creciente incidencia de traumatismos por accidentes de tráfico y lesiones laborales, y la expansión de la infraestructura sanitaria. El creciente apoyo gubernamental, mediante reformas sanitarias y una mayor penetración de los seguros médicos, está haciendo que los dispositivos avanzados de fijación de traumatismos sean más accesibles para la población en general. La presencia de importantes fabricantes nacionales de dispositivos médicos que ofrecen soluciones de fijación rentables, sumada a la creciente concienciación de los pacientes, impulsa la rápida expansión del mercado. Además, se espera que el creciente enfoque de China en iniciativas de hospitales inteligentes y la adopción de técnicas de fijación mínimamente invasivas impulsen aún más el mercado en los próximos años.
Cuota de mercado de la fijación de traumas
La industria de fijación de traumas está liderada principalmente por empresas bien establecidas, entre las que se incluyen:
- Grupo Weigao (China)
- Orthofix Medical Inc. (EE. UU.)
- Corporación CONMED (EE. UU.)
- Wright Medical Group NV (Países Bajos)
- OsteoMed (EE. UU.)
- Invibio Ltd. (Reino Unido)
- Medtronic (Irlanda)
- Smith + Nephew (Reino Unido)
- Zimmer Biomet (EE. UU.)
- B. Braun SE (Alemania)
- Stryker (EE. UU.)
- Implantate AG (Alemania)
- Johnson & Johnson y sus filiales (EE. UU.)
- Inion OY (Finlandia)
- Arthrex Inc. (EE. UU.)
- Jeil Medical Corporation (Corea del Sur)
- Bioretec Ltd. (Finlandia)
Últimos avances en el mercado mundial de fijación de traumatismos
- En septiembre de 2023, Orthofix Medical anunció el lanzamiento comercial completo en EE. UU. de su sistema Galaxy Fixation Gemini, una plataforma modular de fijación externa disponible en kits de procedimientos estériles listos para usar, diseñados para una aplicación rápida en entornos de traumatología aguda. La compañía destacó que el formato del kit estéril (incluido el kit para tobillo con pinzas específicas) reduce el tiempo de preparación del quirófano, evita demoras en la esterilización de las bandejas y facilita su uso en salas de traumatología o unidades de cuidados intensivos. Estas ventajas pueden mejorar significativamente el flujo de trabajo y los costos en la atención de fracturas de alta gravedad.
- En enero de 2025 (acuerdo anunciado) y finalizado en abril de 2025, Zimmer Biomet anunció y posteriormente cerró la adquisición de Paragon 28, empresa especializada en dispositivos para pie, tobillo y traumatología, en una transacción valorada en aproximadamente 1100 millones de dólares. Zimmer Biomet declaró que el acuerdo amplía sus capacidades en fracturas y traumatología, pie y tobillo, aporta carteras de implantes y canales de distribución complementarios, y apoya el crecimiento en los centros de cirugía ambulatoria (ASC) y en los mercados internacionales. Esta operación estratégica de fusiones y adquisiciones está transformando la dinámica competitiva en el sector de la fijación de traumatología.
- En octubre de 2024, Johnson & Johnson MedTech (DePuy Synthes / J&J) lanzó el sistema de placas VOLT, una familia de implantes de placas de nueva generación para fragmentos pequeños y mini, aprobados para uso clínico, cuyo objetivo es mejorar la flexibilidad y la estabilidad de la fijación en los tipos de fracturas más comunes. J&J posicionó VOLT como una cartera de placas moderna y modular para aplicaciones en muñeca y húmero proximal, y anunció que la plataforma se implementaría en anatomías y mercados específicos entre 2024 y 2025, lo que indica una renovada inversión de los grandes fabricantes de equipos originales (OEM) en la innovación de placas para la atención de traumatismos.
- En agosto de 2024, DePuy Synthes (Johnson & Johnson) presentó el sistema de placas anatómicas TriLEAP para extremidades inferiores, una completa gama de placas de titanio de perfil bajo diseñada específicamente para cirujanos de pie y tobillo y casos de traumatología. El sistema TriLEAP ofrece implantes e instrumentación específicos para cada procedimiento, adaptados a las necesidades de reconstrucción y fijación de fracturas en las extremidades inferiores, lo que ilustra la tendencia actual de los fabricantes de equipos originales (OEM) de ofrecer soluciones de placas anatómicamente contorneadas y centradas en el procedimiento a los cirujanos de traumatología.
SKU-
Obtenga acceso en línea al informe sobre la primera nube de inteligencia de mercado del mundo

- Panel de análisis de datos interactivo
- Panel de análisis de empresas para oportunidades con alto potencial de crecimiento
- Acceso de analista de investigación para personalización y consultas
- Análisis de la competencia con panel interactivo
- Últimas noticias, actualizaciones y análisis de tendencias
- Aproveche el poder del análisis de referencia para un seguimiento integral de la competencia
Metodología de investigación
La recopilación de datos y el análisis del año base se realizan utilizando módulos de recopilación de datos con muestras de gran tamaño. La etapa incluye la obtención de información de mercado o datos relacionados a través de varias fuentes y estrategias. Incluye el examen y la planificación de todos los datos adquiridos del pasado con antelación. Asimismo, abarca el examen de las inconsistencias de información observadas en diferentes fuentes de información. Los datos de mercado se analizan y estiman utilizando modelos estadísticos y coherentes de mercado. Además, el análisis de la participación de mercado y el análisis de tendencias clave son los principales factores de éxito en el informe de mercado. Para obtener más información, solicite una llamada de un analista o envíe su consulta.
La metodología de investigación clave utilizada por el equipo de investigación de DBMR es la triangulación de datos, que implica la extracción de datos, el análisis del impacto de las variables de datos en el mercado y la validación primaria (experto en la industria). Los modelos de datos incluyen cuadrícula de posicionamiento de proveedores, análisis de línea de tiempo de mercado, descripción general y guía del mercado, cuadrícula de posicionamiento de la empresa, análisis de patentes, análisis de precios, análisis de participación de mercado de la empresa, estándares de medición, análisis global versus regional y de participación de proveedores. Para obtener más información sobre la metodología de investigación, envíe una consulta para hablar con nuestros expertos de la industria.
Personalización disponible
Data Bridge Market Research es líder en investigación formativa avanzada. Nos enorgullecemos de brindar servicios a nuestros clientes existentes y nuevos con datos y análisis que coinciden y se adaptan a sus objetivos. El informe se puede personalizar para incluir análisis de tendencias de precios de marcas objetivo, comprensión del mercado de países adicionales (solicite la lista de países), datos de resultados de ensayos clínicos, revisión de literatura, análisis de mercado renovado y base de productos. El análisis de mercado de competidores objetivo se puede analizar desde análisis basados en tecnología hasta estrategias de cartera de mercado. Podemos agregar tantos competidores sobre los que necesite datos en el formato y estilo de datos que esté buscando. Nuestro equipo de analistas también puede proporcionarle datos en archivos de Excel sin procesar, tablas dinámicas (libro de datos) o puede ayudarlo a crear presentaciones a partir de los conjuntos de datos disponibles en el informe.

