
Mercado global de vectorización de par, por componente (hardware y servicios), tecnología (sistema de vectorización de par activo (ATVS) y sistema de vectorización de par pasivo (PTVS)), tipo de accionamiento del embrague (eléctrico e hidráulico), tipo de rueda motriz (tracción trasera (RWD), tracción delantera (FWD) y tracción total/tracción en las cuatro ruedas (AWD/4WD)), tipo de vehículo (automóviles de pasajeros, vehículos comerciales y vehículos todoterreno), tipo de propulsión (vehículo diésel/gasolina/GNC y eléctrico) Tendencias de la industria y pronóstico hasta 2029

Análisis y tamaño del mercado
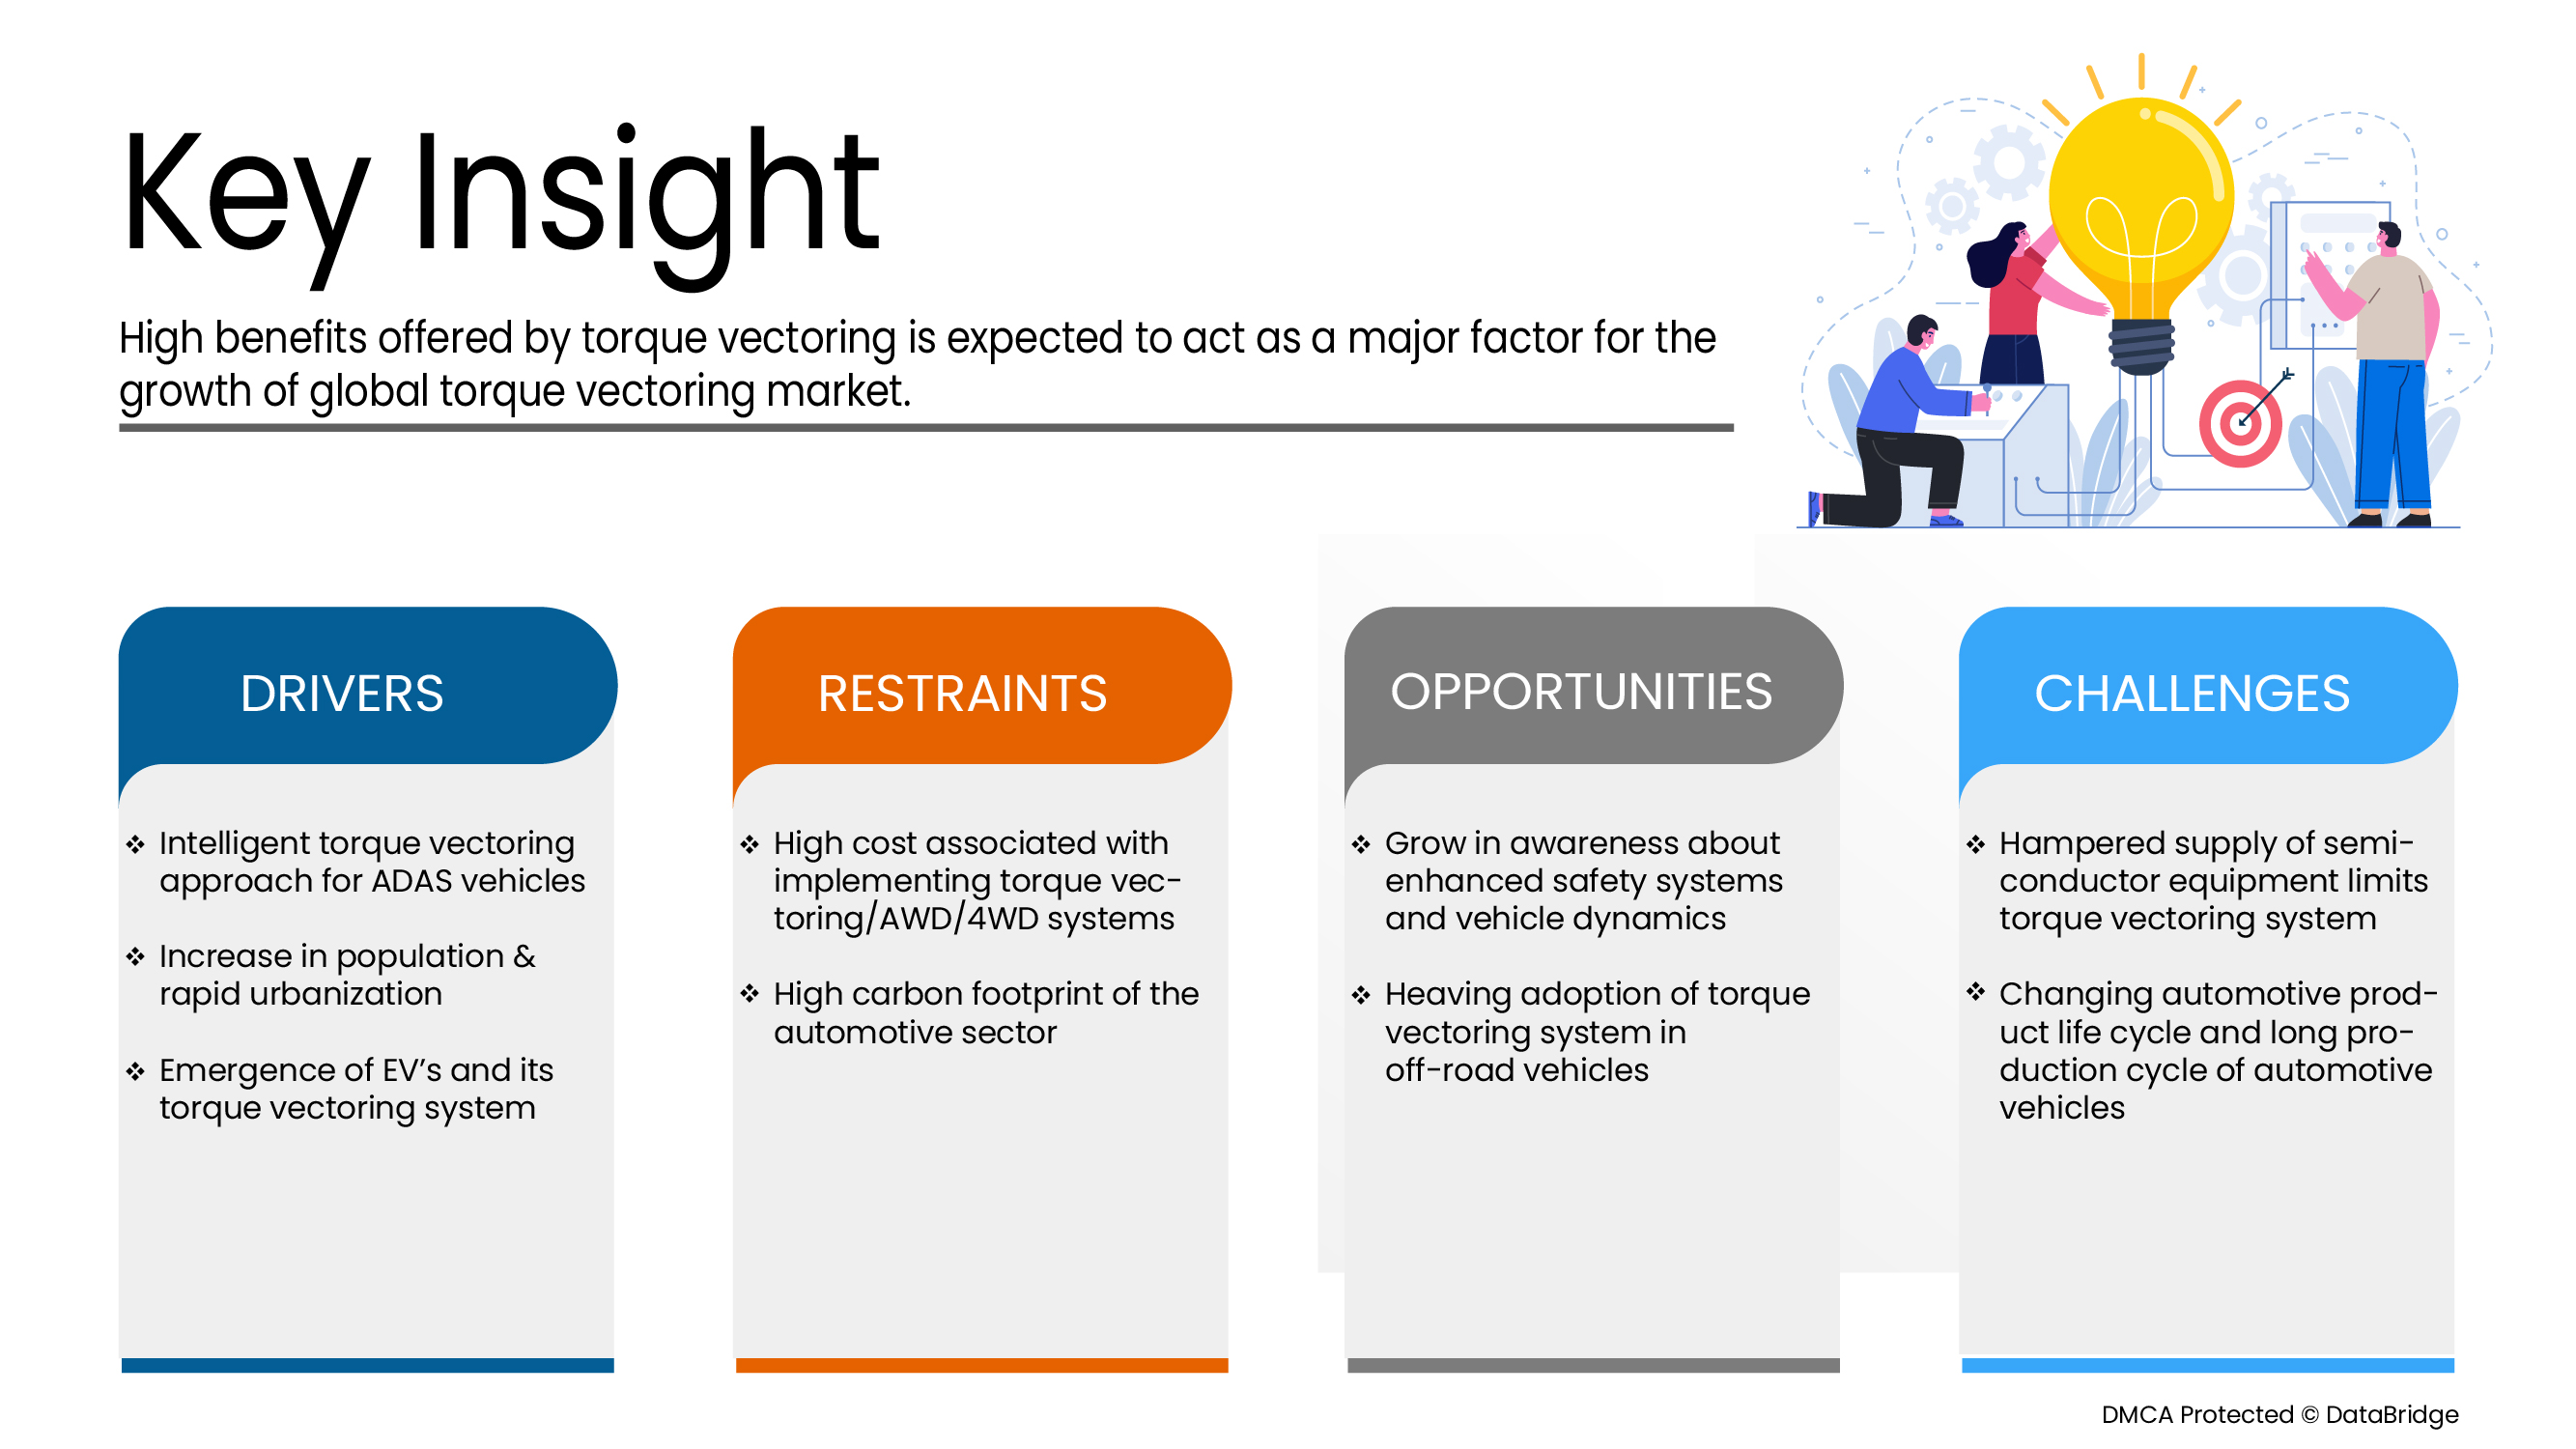
Los fabricantes de la industria automotriz están continuamente tratando de encontrar formas de aumentar la precisión del trabajo, mejorar los servicios y trabajar con la creciente tecnología. La implementación de sistemas de vectorización de par en los vehículos puede proporcionar características de seguridad mejoradas y un mejor rendimiento del automóvil, lo que permite a los consumidores disfrutar de las comodidades de los automóviles. El mercado de sistemas de vectorización de par está creciendo debido al avance en factores tecnológicos como el enfoque de vectorización de par inteligente para vehículos ADAS, la aparición de vehículos eléctricos y su sistema de vectorización de par y el aumento de la población y la rápida urbanización que impulsa la adopción de estas tecnologías.
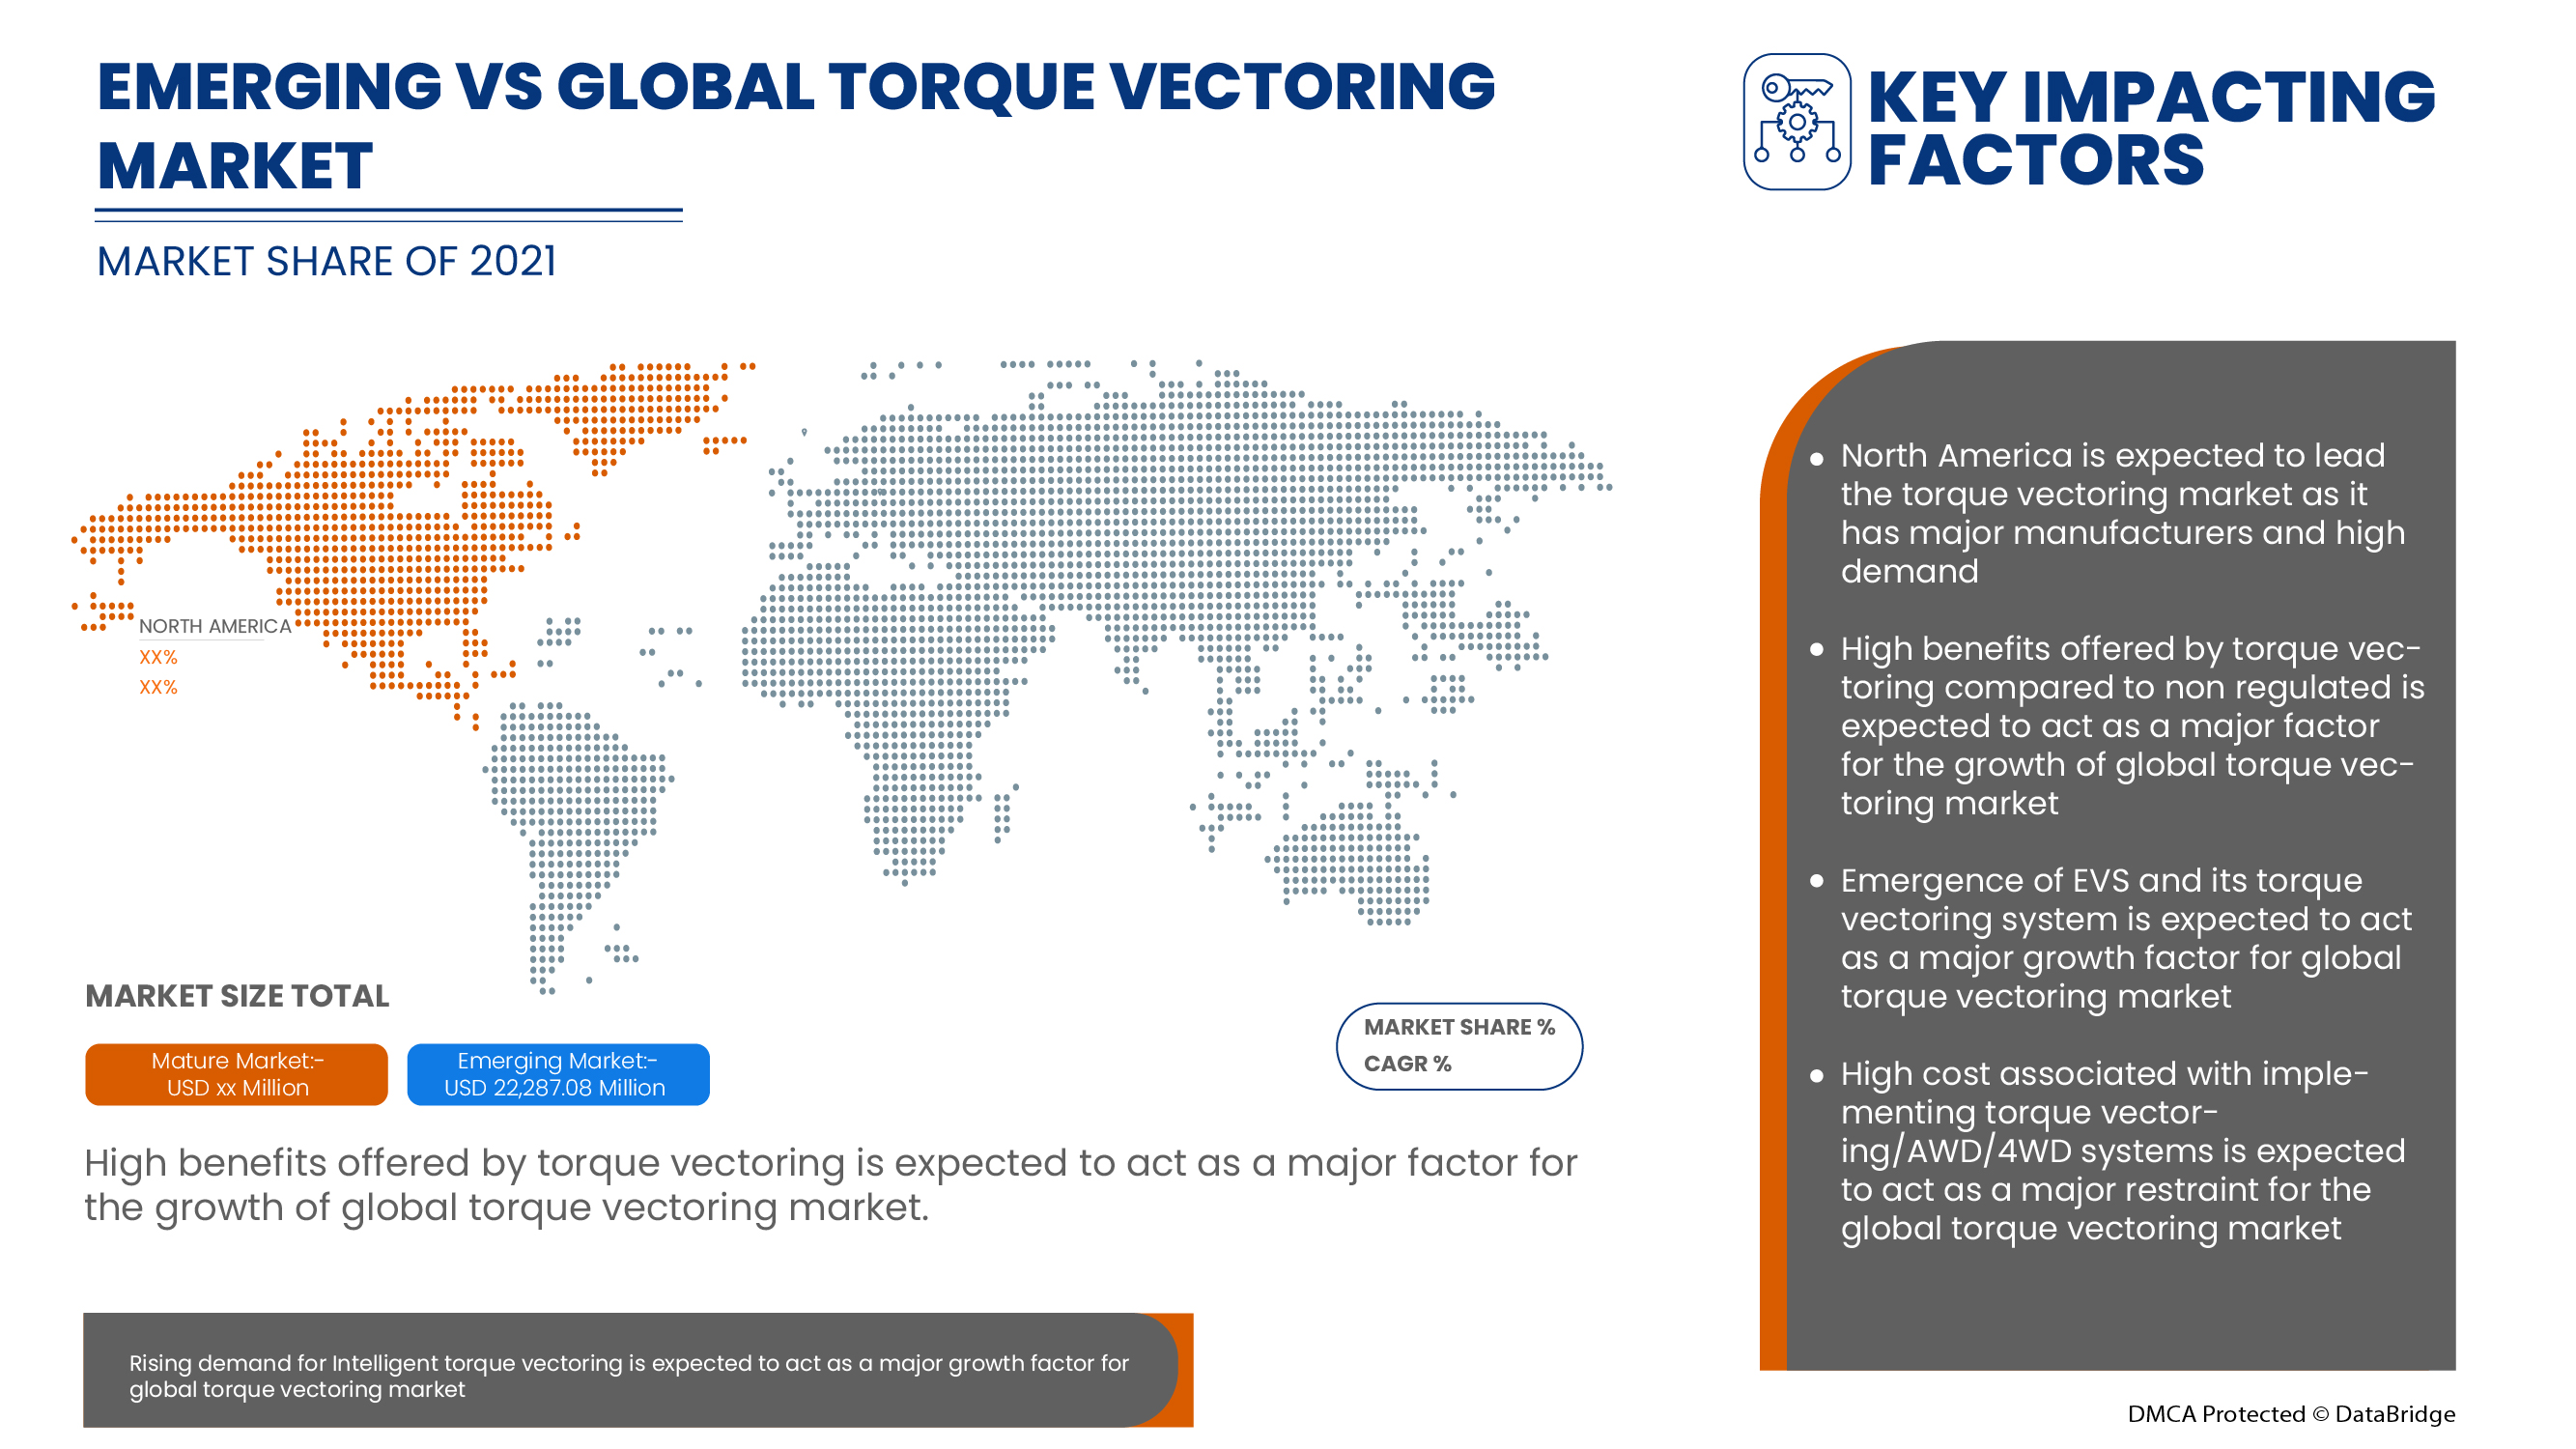
Se espera que la adopción masiva del sistema de vectorización de par en vehículos todoterreno, el enfoque de vectorización de par inteligente para vehículos ADAS y el aumento de la demanda de vehículos de lujo y de alto rendimiento en las industrias automotrices impulsen el crecimiento del mercado. Se espera que el alto costo asociado con la implementación de sistemas de vectorización de par/AWD/4WD restrinja el mercado global de vectorización de par.
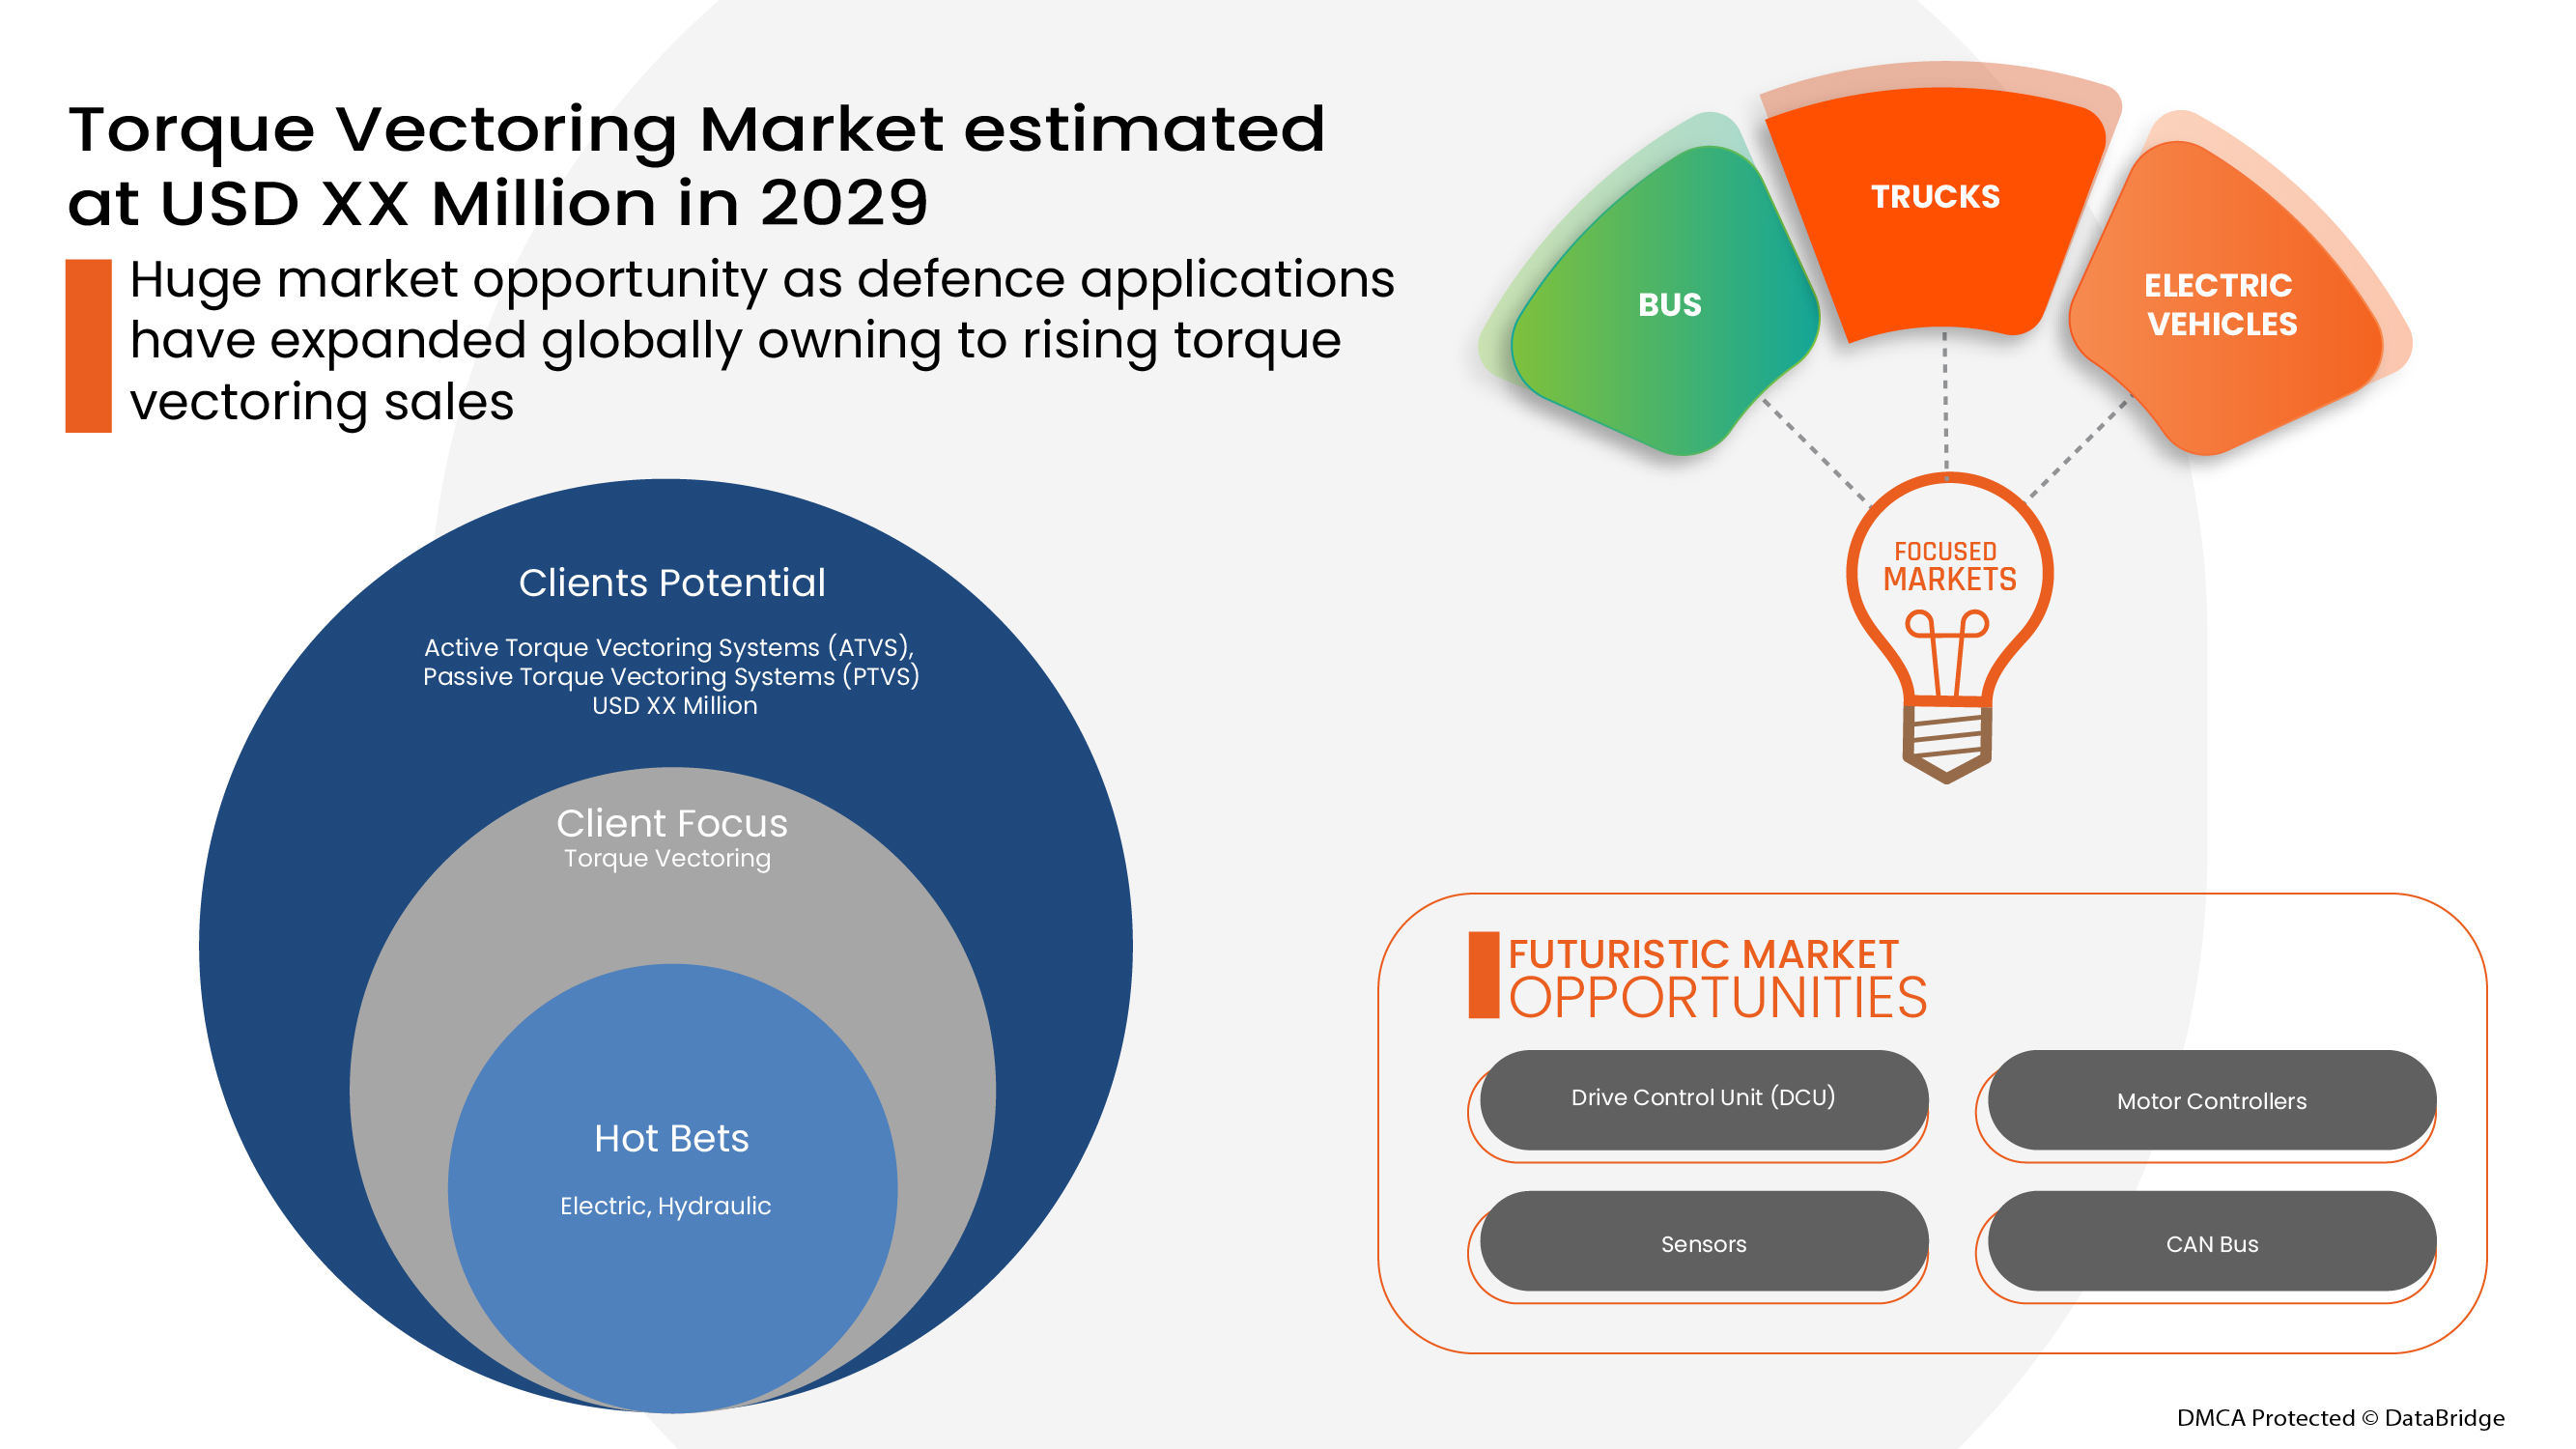
Data Bridge Market Research analiza que se espera que el mercado de vectorización de par alcance un valor de USD 22.287,08 millones para 2029. El "hardware" representa el segmento de componentes de productos más grande en el mercado de vectorización de par debido a la creciente demanda de componentes de hardware que son un componente esencial que se utiliza en los sistemas de vectorización de par. Estos componentes se utilizan para garantizar la seguridad y proporcionar una estabilidad decente para el vehículo. El informe de mercado de vectorización de par también cubre el análisis de precios, el análisis de patentes y los avances tecnológicos en profundidad.
|
Métrica del informe |
Detalles |
|
Período de pronóstico |
2022 a 2029 |
|
Año base |
2021 |
|
Año histórico |
2020 |
|
Unidades cuantitativas |
Ingresos en millones de USD |
|
Segmentos cubiertos |
Por componente (hardware y servicios), tecnología (sistema de vectorización de par activo (ATVS) y sistema de vectorización de par pasivo (PTVS)), tipo de accionamiento del embrague (eléctrico e hidráulico), tipo de rueda motriz (tracción trasera (RWD), tracción delantera (FWD) y tracción total/tracción en las cuatro ruedas (AWD/4WD)), tipo de vehículo (automóviles de pasajeros, vehículos comerciales y vehículos todoterreno), tipo de propulsión (vehículo diésel/gasolina/GNC y eléctrico) |
|
Países cubiertos |
EE. UU., Canadá y México en América del Norte, Alemania, España, Francia, Rusia, Turquía, República Checa, Reino Unido, Italia, Polonia, Rumania, Hungría, Bélgica, Suecia, Países Bajos, Finlandia, Bielorrusia, Suiza y el resto de Europa, China, Japón, India, Corea del Sur, Singapur, Malasia, Australia y Nueva Zelanda, Tailandia, Indonesia, Filipinas, Taiwán, Vietnam y el resto de Asia-Pacífico, Arabia Saudita, Emiratos Árabes Unidos, Sudáfrica, Egipto, Israel, Kuwait y el resto de Medio Oriente y África (MEA) como parte de Medio Oriente y África (MEA), Brasil, Argentina, Colombia, Chile, Ecuador, Perú, Paraguay, Costa Rica y el resto de Sudamérica como parte de Sudamérica. |
|
Actores del mercado cubiertos |
Entre otras se encuentran: BorgWarner Inc., Eaton, American Axle & Manufacturing, Inc., Dana Limited, JTEKT Corporation, Magna International Inc., Robert Bosch GmbH, UNIVANCE CORPORATION, Protean, Hewland Engineering Ltd, Continental AG, Modelon, GKN Automotive Limited, Drako Motors, Inc., Prodrive Holdings Limited, MITSUBISHI MOTORS CORPORATION, Haldex, Schaeffler AG, THE TIMKEN COMPANY, Linamar Corporation, Ricardo, ZF Friedrichshafen AG. |
Definición de mercado
Las soluciones de vectorización de par son los sistemas más importantes y cruciales que garantizan la seguridad y ayudan a mejorar el rendimiento del automóvil. Estos sistemas básicamente proporcionan o distribuyen el par entre las ruedas, lo que permite que el vehículo gire de manera efectiva en una curva. La vectorización de par es un enfoque holístico y predictivo de la dinámica del vehículo que utiliza una combinación de hardware y sistemas electrónicos. Proporciona la distribución más adecuada del par a una rueda en cualquier punto en función de las intenciones del conductor y las condiciones de conducción. Básicamente, existen dos tipos de soluciones de vectorización de par que se utilizan de manera destacada: una es la vectorización de par basada en los frenos y la otra es la vectorización de par basada en la electricidad.
Dinámica del mercado de vectorización de par
En esta sección se aborda la comprensión de los factores impulsores, las oportunidades, las limitaciones y los desafíos del mercado. Todo esto se analiza en detalle a continuación:
Conductores
- Aumento de la población y rápida urbanización
Durante más de una década, la industrialización y la urbanización han desempeñado un papel importante en el surgimiento y el crecimiento de la industria automotriz. El aumento de la población mundial y el desplazamiento de la mayoría de la población hacia áreas urbanas en busca de mejores oportunidades y mejores niveles de vida desempeñan un papel vital en la configuración del sector de la industria automotriz.
Esta creciente tendencia de los sistemas de vectorización de par en las áreas urbanizadas impulsa el crecimiento del mercado, ya que todos los consumidores están optando por vehículos de seguridad avanzados con sistemas de vectorización de par avanzados que garanticen la máxima seguridad y eficiencia. Por lo tanto, la rápida urbanización, la población, la aparición de tecnologías de movilidad como servicio (MaaS) y el cambio en el patrón de comportamiento del consumidor están obligando a los principales actores a desarrollar vehículos con sistemas avanzados de vectorización de par para que el consumidor gane mercado, lo que lleva al crecimiento del mercado global de vectorización de par en todas las regiones del mundo.
- Aparición de los vehículos eléctricos y su sistema de vectorización del par
La industria automotriz ha mostrado un enorme crecimiento debido a la creciente demanda de vehículos eléctricos de lujo. Los vehículos totalmente eléctricos (VE) son llamados vehículos eléctricos de batería que utilizan una batería para almacenar la energía eléctrica que alimenta los vehículos. Algunos de los factores que impulsan las ventas de vehículos eléctricos incluyen estrictas regulaciones gubernamentales sobre las emisiones de los vehículos y la creciente demanda de vehículos de bajo consumo de combustible, alto rendimiento y bajas emisiones. Esto se suma a la adopción de vehículos eléctricos como vehículos totalmente eléctricos como de cero emisiones, lo que minimiza eficazmente las emisiones de carbono.
Los fabricantes de vehículos totalmente eléctricos están integrando sistemas innovadores, como los sistemas de vectorización del par, que hacen que los vehículos sean más eficientes en el consumo de combustible y aumentan la seguridad de los vehículos. Además, el aumento de la demanda de vehículos de bajas emisiones está impulsando su adopción. Por lo tanto, también se espera que la demanda de vehículos eléctricos impulse la demanda de sus sistemas de vectorización del par y su mercado.
- Enfoque de vectorización de par inteligente para vehículos ADAS
Los sistemas avanzados de asistencia al conductor (ADAS) son sistemas electrónicos implantados en los automóviles para ayudar a la conducción de vehículos o coches autónomos. Este sistema utiliza sensores como radares y cámaras para el análisis y toma medidas automáticas en función del entorno del vehículo. Este sistema implementado en automóviles permite mejorar los sistemas de seguridad en cuanto a la conducción mediante la evitación de colisiones, la adopción de control de crucero, antibloqueo de frenos, automatización de la iluminación, mitigación de colisiones con peatones (PCAM) y muchos otros.
La adopción de tecnologías ADAS en la industria automotriz está directamente relacionada con el crecimiento del mercado de vectorización de par. Los consumidores preferirán la seguridad y las funciones avanzadas, como las capacidades de conducción autónoma y las funciones de seguridad avanzadas. Esto impulsa la adopción de sistemas de vectorización de par y el crecimiento del mercado en todas las regiones del mundo.
Oportunidad
- Adopción masiva de sistemas de vectorización de par en vehículos todoterreno
Un vehículo todoterreno (OHV) o vehículo todo terreno está diseñado específicamente para su uso fuera de carretera en terrenos difíciles. Estos vehículos están desarrollados específicamente para consumidores que prefieren vehículos todoterreno por su accesibilidad en su zona de residencia o con fines recreativos. Algunos de estos vehículos pueden circular por la carretera, pero la mayoría de los consumidores utilizan los OHV para recrear lugares a los que los vehículos normales no pueden acceder.
Con el aumento de la adopción por parte de los consumidores de vehículos todoterreno (OHV) o vehículos todo terreno debido al aumento de las actividades recreativas y de turismo, el avance en la tecnología de vehículos todo terreno y el aumento del uso de vehículos todo terreno en operaciones y actividades militares, esta adopción masiva de vehículos todo terreno (OHV) o vehículos todo terreno por parte de los consumidores impulsará el crecimiento de las tecnologías de sistemas de vectorización de par, ya que es un componente esencial y ofrecerá una oportunidad lucrativa para su crecimiento en el mercado global de vectorización de par.
Desafío/Restricción
- El suministro limitado de equipos semiconductores limita el sistema de vectorización de par
Puede haber varias razones para la oferta limitada de sistemas de vectorización de par, ya que estos utilizan los sistemas de control y dispositivos electrónicos más avanzados. Actualmente, la principal razón para la oferta limitada de sistemas de vectorización de par en los vehículos se debe a la crisis en la industria de semiconductores, ya que hay una escasez aguda de chips y dispositivos para automóviles, lo que está afectando a la industria automotriz.
Esta oferta limitada de vehículos debido a la escasez de chips semiconductores y controladores se correlaciona directamente con las ventas y la disponibilidad de nuevos sistemas de vectorización de par. Además, también afecta el trabajo de mantenimiento y reparación de los vehículos antiguos. Por lo tanto, el suministro obstaculizado de equipos semiconductores, como los controladores de chips, limita la fabricación de sistemas de vectorización de par, lo que puede plantear desafíos para el crecimiento del mercado global de vectorización de par en toda la región.
Impacto posterior al COVID-19 en el mercado de vectorización de par
La COVID-19 ha tenido un gran impacto en el mercado de vectorización de par, ya que casi todos los países han optado por cerrar todas las instalaciones de producción, excepto las que se dedican a la producción de bienes esenciales. El gobierno ha tomado algunas medidas estrictas, como el cierre de la producción y la venta de bienes no esenciales, el bloqueo del comercio internacional y muchas más para evitar la propagación de la COVID-19. Las únicas empresas que se enfrentan a esta situación de pandemia son los servicios esenciales a los que se les permite abrir y ejecutar los procesos.
Debido al brote de la pandemia causada por el virus, muchos sectores pequeños cerraron y, por otro lado, algunos sectores decidieron despedir a algunos de sus empleados, lo que resultó en un gran desempleo. La vectorización del par también se utiliza en las industrias automotrices. Debido al brote de una pandemia, la demanda de dichos productos ha disminuido en cierta medida, especialmente en el sector médico, la atención médica, el farmacéutico, los alimentos, el comercio electrónico y varios otros sectores. Pero la demanda inesperada, junto con las capacidades de producción limitadas y las interrupciones de la cadena de suministro, sigue causando dificultades en todas estas industrias.
Los fabricantes están tomando diversas decisiones estratégicas para recuperarse tras la COVID-19. Las empresas están llevando a cabo múltiples actividades de investigación y desarrollo para mejorar la tecnología involucrada en la vectorización del par. Con esto, las empresas traerán al mercado controladores avanzados y precisos. Además, el uso de la vectorización del par por parte de las autoridades gubernamentales en vehículos pesados ha impulsado el crecimiento del mercado.
Acontecimientos recientes
- En mayo de 2022, Eaton anunció que la empresa había participado en la Conferencia de materiales e industria de Goldman Sachs. Esto ayudará a la empresa a mostrarse en una gran plataforma y atraer clientes ofreciendo mejores productos y servicios de gestión energética y acelerando el crecimiento de los ingresos.
- En marzo de 2022, American Axle & Manufacturing, Inc. anunció que General Motors había reconocido a la empresa como ganadora del premio Overdrive por sostenibilidad, innovación, relaciones, costo total de la empresa, excelencia en el lanzamiento y seguridad. Este reconocimiento ayudará a la empresa a aprovechar la oportunidad de asociarse o colaborar con otras empresas y organizaciones, lo que crea un valor de marca para la empresa en el mercado.
Alcance del mercado global de vectorización de par
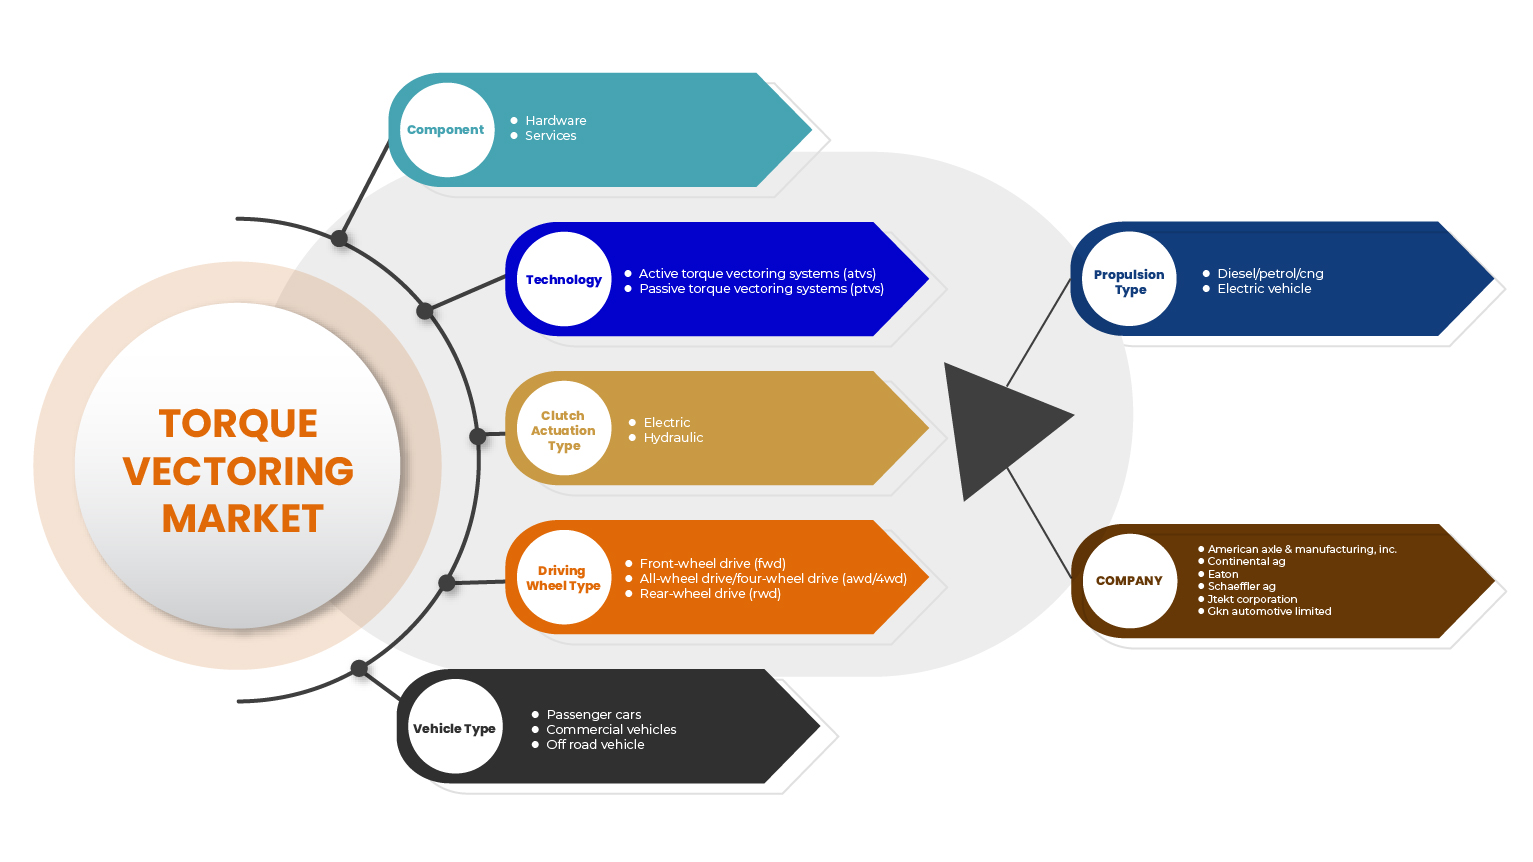
El mercado de vectorización de par está segmentado en función de los componentes, la tecnología, el tipo de accionamiento del embrague, el tipo de rueda motriz, el tipo de vehículo y el tipo de propulsión. El crecimiento entre estos segmentos le ayudará a analizar los segmentos de crecimiento reducido de las industrias y brindará a los usuarios una valiosa descripción general del mercado y conocimientos del mercado para ayudarlos a tomar decisiones estratégicas para identificar las principales aplicaciones del mercado.
Componente
- Hardware
- Servicios
Sobre la base del componente, el mercado global de vectorización de par se ha segmentado en hardware y servicios.
Tecnología
- Sistema de distribución de par activo (ATVS)
- Sistema de vectorización de par pasivo (PTVS)
Sobre la base de la tecnología, el mercado global de vectorización de par se ha segmentado en sistema de vectorización de par activo (ATVS) y sistema de vectorización de par pasivo (PTVS).
Tipo de accionamiento del embrague
- Eléctrico
- Hidráulico
Sobre la base del tipo de actuación del embrague, el mercado global de vectorización de par se ha segmentado en eléctrico e hidráulico.
Tipo de rueda motriz
- Tracción trasera (RWD)
- Tracción delantera (FWD)
- Tracción en las cuatro ruedas/Tracción en las cuatro ruedas (AWD/4WD)
Sobre la base del tipo de rueda motriz, el mercado global de vectorización de par se ha segmentado en tracción trasera (RWD), tracción delantera (FWD) y tracción total/tracción en las cuatro ruedas (AWD/4WD).
Tipo de vehículo
- Automóviles de pasajeros
- Vehículos comerciales
- Vehículo todoterreno
Sobre la base del tipo de vehículo, el mercado global de vectorización de par se ha segmentado en automóviles de pasajeros, vehículos comerciales y vehículos todoterreno.
Tipo de propulsión
- Diésel/Gasolina/GNC
- Vehículo eléctrico
Sobre la base del tipo de propulsión, el mercado global de vectorización de par se ha segmentado en vehículos diésel/gasolina/GNC y eléctricos.
Análisis y perspectivas regionales del mercado de vectorización de par
Se analiza el mercado de vectorización de par y se proporcionan información y tendencias del tamaño del mercado por componente, tecnología, tipo de actuación del embrague, tipo de rueda motriz, tipo de vehículo y tipo de propulsión como se menciona anteriormente.
Los países cubiertos en el informe de mercado de vectorización de par son EE. UU., Canadá y México en América del Norte, Alemania, España, Francia, Rusia, Turquía, República Checa, Reino Unido, Italia, Polonia, Rumania, Hungría, Bélgica, Suecia, Países Bajos, Finlandia, Bielorrusia, Suiza y el resto de Europa, China, Japón, India, Corea del Sur, Singapur, Malasia, Australia y Nueva Zelanda, Tailandia, Indonesia, Filipinas, Taiwán, Vietnam y el resto de Asia-Pacífico, Arabia Saudita, Emiratos Árabes Unidos, Sudáfrica, Egipto, Israel, Kuwait y el resto de Medio Oriente y África (MEA) como parte de Medio Oriente y África (MEA), Brasil, Argentina, Colombia, Chile, Ecuador, Perú, Paraguay, Costa Rica y el resto de Sudamérica como parte de Sudamérica.
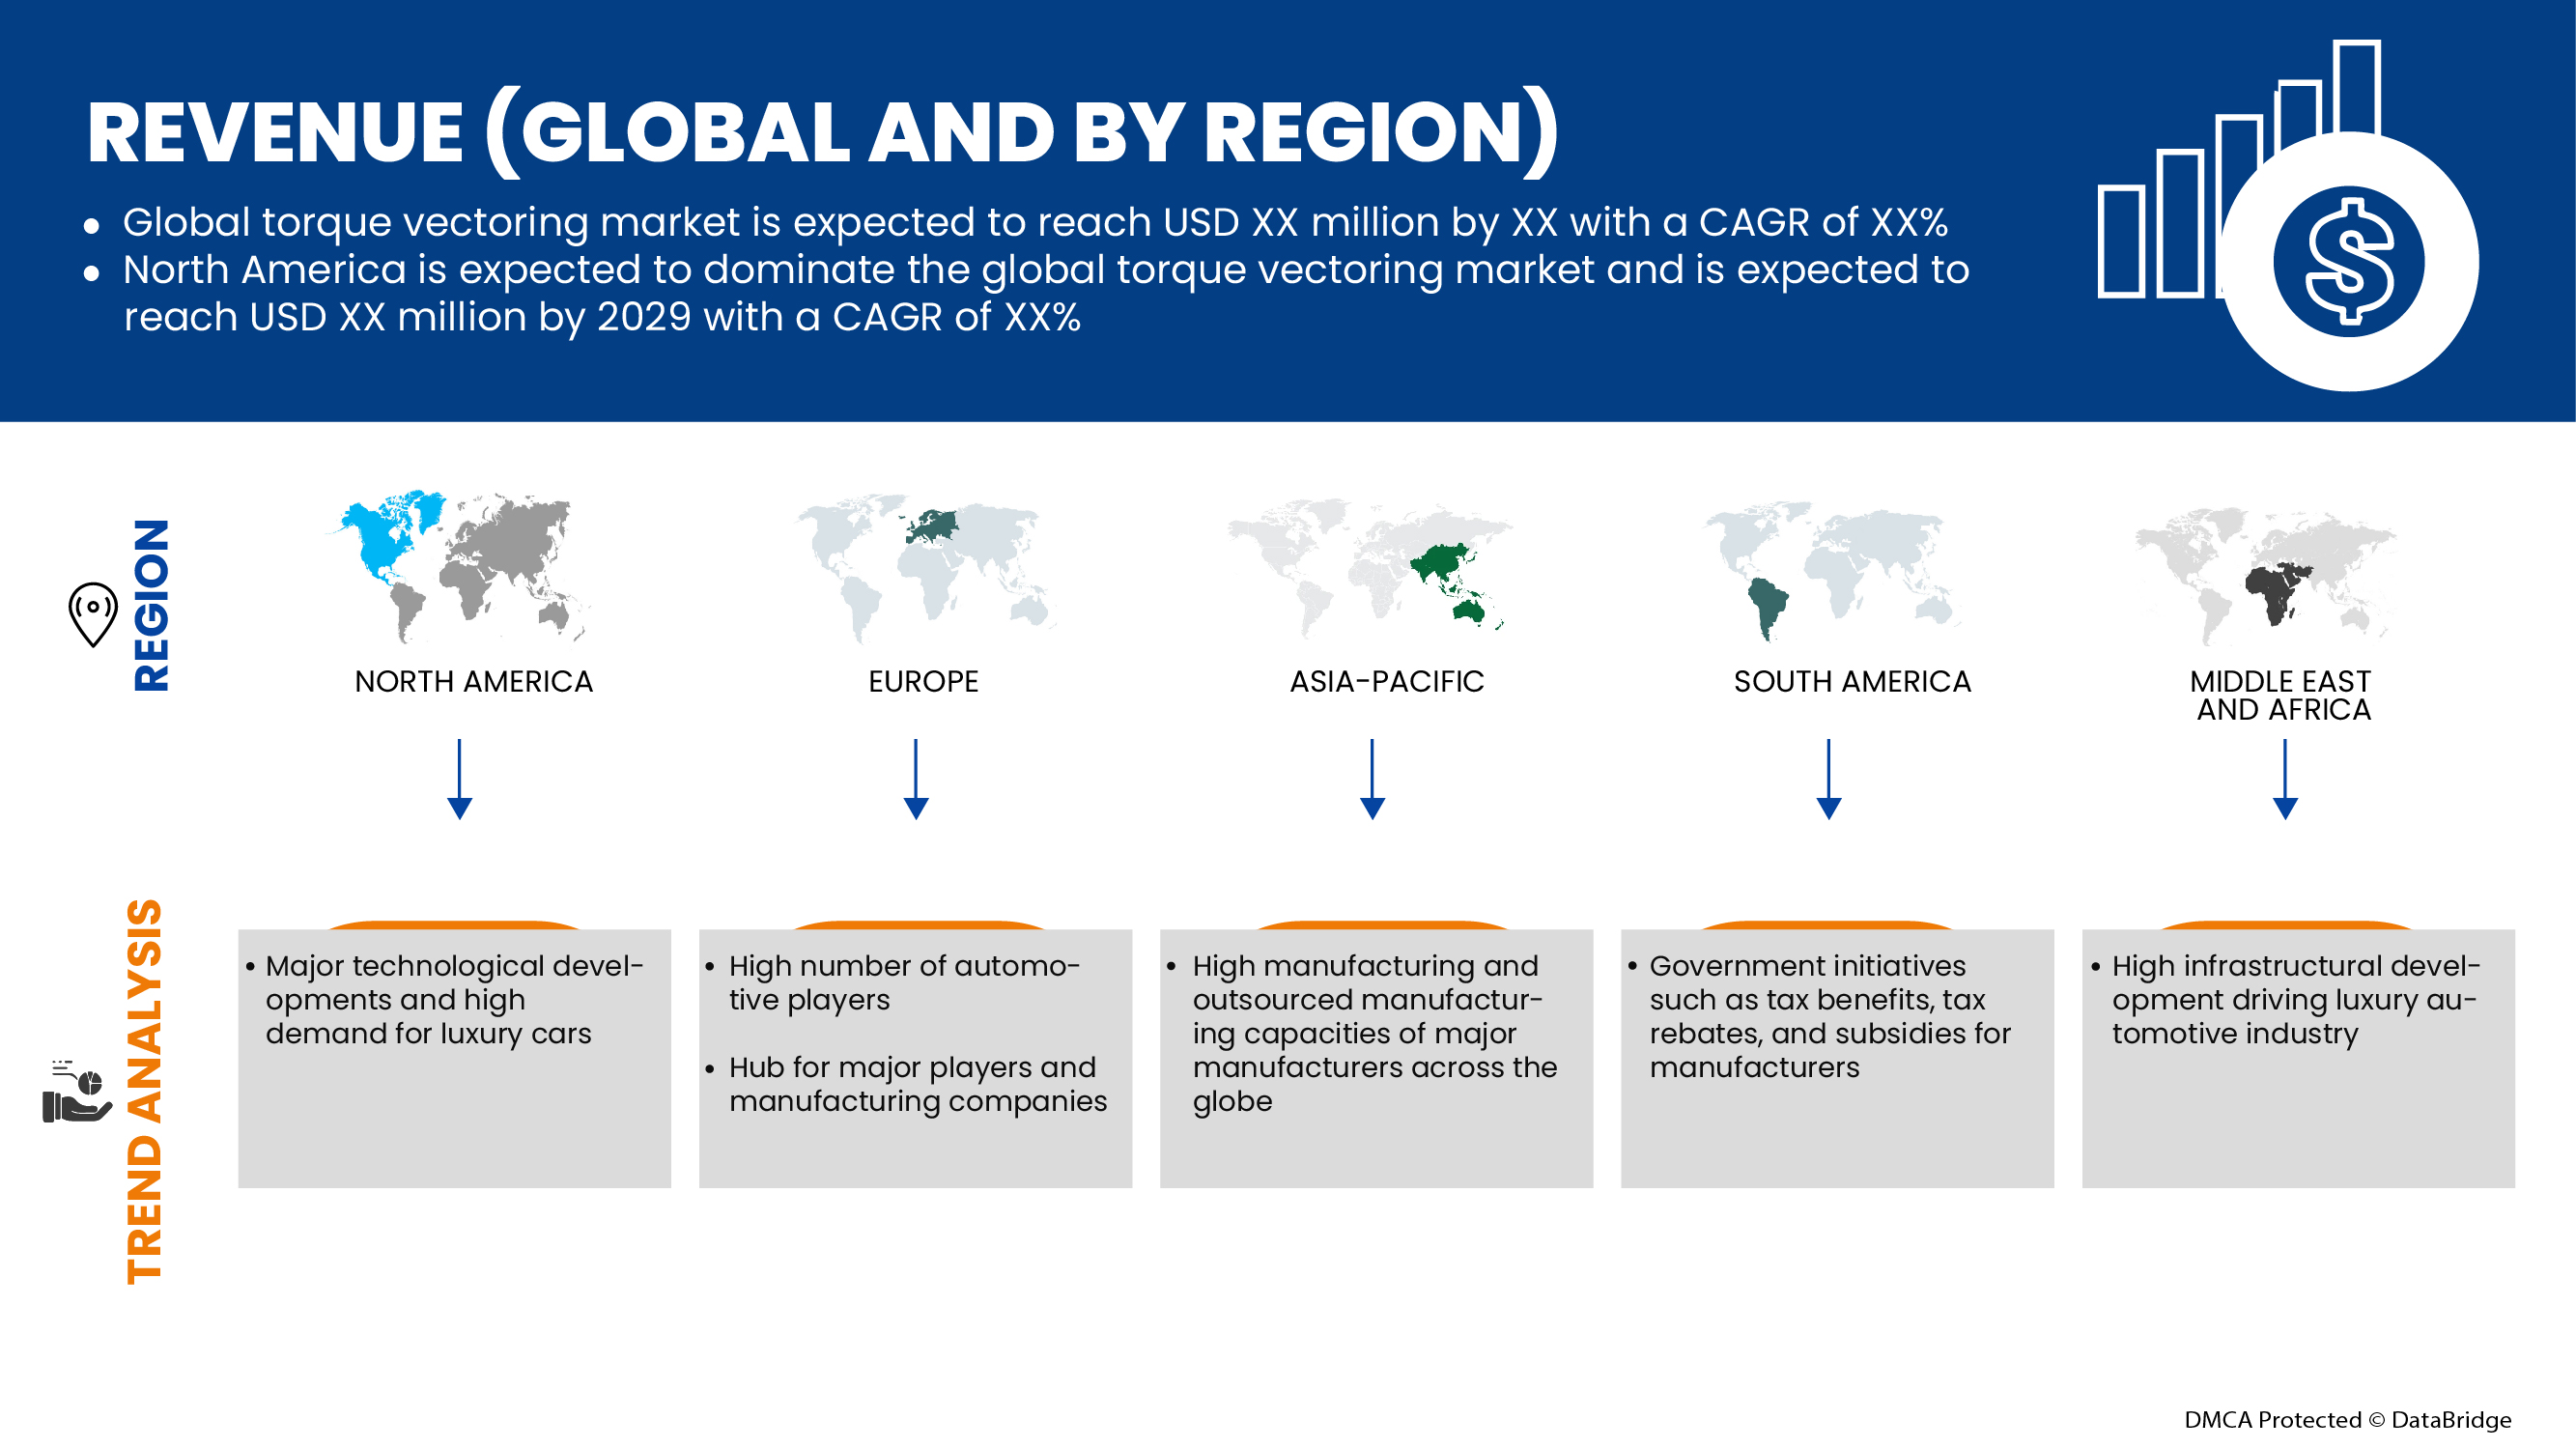
América del Norte domina el mercado de vectorización de par. Se espera que el mercado de vectorización de par de Asia-Pacífico sea el de más rápido crecimiento del mundo. El creciente desarrollo de infraestructura, comercial e industrial en países emergentes como EE. UU., Canadá y México se atribuye al dominio del mercado. EE. UU. domina la región de América del Norte debido a factores como la creciente demanda de un enfoque de vectorización de par inteligente para vehículos ADAS. Alemania domina el mercado de vectorización de par de Europa, debido al aumento de las inversiones para el crecimiento de la vectorización de par. China domina el mercado de vectorización de par de Asia-Pacífico. Se proyecta que la demanda en esta región esté impulsada por el aumento de la demanda de vectorización de par por parte de las empresas automotrices.
La sección de países del informe también proporciona factores de impacto de mercado individuales y cambios en la regulación del mercado que afectan las tendencias actuales y futuras del mercado. Puntos de datos como análisis de la cadena de valor aguas arriba y aguas abajo, tendencias técnicas y análisis de las cinco fuerzas de Porter, estudios de casos son algunos de los indicadores utilizados para pronosticar el escenario del mercado para países individuales. Además, la presencia y disponibilidad de marcas globales y sus desafíos enfrentados debido a la competencia grande o escasa de las marcas locales y nacionales, el impacto de los aranceles nacionales y las rutas comerciales se consideran al proporcionar un análisis de pronóstico de los datos del país.
Análisis del panorama competitivo y de la cuota de mercado de Torque Vectoring
El panorama competitivo del mercado de vectorización de par proporciona detalles por competidor. Los detalles incluidos son una descripción general de la empresa, las finanzas de la empresa, los ingresos generados, el potencial de mercado, la inversión en investigación y desarrollo, las nuevas iniciativas de mercado, la presencia global, los sitios e instalaciones de producción, las capacidades de producción, las fortalezas y debilidades de la empresa, el lanzamiento de productos, la amplitud y variedad de productos, el dominio de las aplicaciones. Los puntos de datos anteriores proporcionados solo están relacionados con el enfoque de las empresas en relación con el mercado de vectorización de par.
Algunos de los principales actores que operan en el mercado de vectorización de par son BorgWarner Inc., Eaton, American Axle & Manufacturing, Inc., Dana Limited, JTEKT Corporation, Magna International Inc., Robert Bosch GmbH, UNIVANCE CORPORATION, Protean, Hewland Engineering Ltd, Continental AG, Modelon, GKN Automotive Limited, Drako Motors, Inc., Prodrive Holdings Limited, MITSUBISHI MOTORS CORPORATION, Haldex, Schaeffler AG, THE TIMKEN COMPANY, Linamar Corporation, Ricardo, ZF Friedrichshafen AG, entre otros.
SKU-
Obtenga acceso en línea al informe sobre la primera nube de inteligencia de mercado del mundo

- Panel de análisis de datos interactivo
- Panel de análisis de empresas para oportunidades con alto potencial de crecimiento
- Acceso de analista de investigación para personalización y consultas
- Análisis de la competencia con panel interactivo
- Últimas noticias, actualizaciones y análisis de tendencias
- Aproveche el poder del análisis de referencia para un seguimiento integral de la competencia
Tabla de contenido
1 INTRODUCTION
1.1 OBJECTIVES OF THE STUDY
1.2 MARKET DEFINITION
1.3 OVERVIEW OF GLOBAL TORQUE VECTORING MARKET
1.4 CURRENCY AND PRICING
1.5 LIMITATIONS
1.6 MARKETS COVERED
2 MARKET SEGMENTATION
2.1 MARKETS COVERED
2.2 GEOGRAPHICAL SCOPE
2.3 YEARS CONSIDERED FOR THE STUDY
2.4 DBMR TRIPOD DATA VALIDATION MODEL
2.5 PRIMARY INTERVIEWS WITH KEY OPINION LEADERS
2.6 DBMRMARKET POSITION GRID
2.7 VENDOR SHARE ANALYSIS
2.8 MULTIVARIATE MODELING
2.9 COMPONENT TIMELINE CURVE
2.1 SECONDARY SOURCES
2.11 ASSUMPTIONS
3 EXECUTIVE SUMMARY
4 PREMIUM INSIGHTS
4.1 PORTER FIVE FORCES ANALYSIS
4.2 REGULATORY FRAMEWORK
5 MARKET OVERVIEW
5.1 DRIVERS
5.1.1 INCREASE IN POPULATION & RAPID URBANIZATION
5.1.2 EMERGENCE OF EVS & AND ITS TORQUE VECTORING SYSTEM
5.1.3 INTELLIGENT TORQUE VECTORING APPROACH FOR ADAS VEHICLES
5.1.4 UPSURGE IN DEMAND FOR LUXURY AND PERFORMANCE VEHICLES
5.2 RESTRAINTS
5.2.1 HIGH COST ASSOCIATED WITH IMPLEMENTING TORQUE VECTORING/AWD/4WD SYSTEMS
5.2.2 HIGH CARBON FOOTPRINT OF THE AUTOMOTIVE SECTOR
5.3 OPPORTUNITIES
5.3.1 HEAVING ADOPTION OF TORQUE VECTORING SYSTEM IN OFF-ROAD VEHICLES
5.3.2 GROWING AWARENESS ABOUT ENHANCED SAFETY AND VEHICLE DYNAMICS
5.4 CHALLENGES
5.4.1 HAMPERED SUPPLY OF SEMICONDUCTOR EQUIPMENT LIMITS TORQUE VECTORING SYSTEM
5.4.2 CHANGING AUTOMOTIVE PRODUCT LIFE CYCLE AND LONG PRODUCTION CYCLE OF AUTOMOTIVE VEHICLES
6 GLOBAL TORQUE VECTORING MARKET, BY COMPONENT
6.1 OVERVIEW
6.2 HARDWARE
6.2.1 DRIVE CONTROL UNIT (DCU)
6.2.2 MOTOR CONTROLLERS
6.2.3 SENSORS
6.2.4 MOTOR
6.2.5 CAN BUS
6.2.6 OTHERS
6.3 SERVICES
7 GLOBAL TORQUE VECTORING MARKET, BY TECHNOLOGY
7.1 OVERVIEW
7.2 ACTIVE TORQUE VECTORING SYSTEMS (ATVS)
7.3 PASSIVE TORQUE VECTORING SYSTEMS (PTVS)
8 GLOBAL TORQUE VECTORING MARKET, BY CLUTCH ACTUATION TYPE
8.1 OVERVIEW
8.2 ELECTRIC
8.3 HYDRAULIC
9 GLOBAL TORQUE VECTORING MARKET, BY DRIVING WHEEL TYPE
9.1 OVERVIEW
9.2 FRONT-WHEEL DRIVE (FWD)
9.3 ALL-WHEEL DRIVE/FOUR-WHEEL DRIVE (AWD/4WD)
9.4 REAR-WHEEL DRIVE (RWD)
10 GLOBAL TORQUE VECTORING MARKET, BY VEHICLE TYPE
10.1 OVERVIEW
10.2 PASSENGER CARS
10.2.1 BY TYPE
10.2.1.1 SEDAN
10.2.1.2 HATCHBACK
10.2.1.3 CROSSOVERS
10.2.1.4 SUV
10.2.1.5 OTHERS
10.2.2 BY TECHNOLOGY
10.2.2.1 ACTIVE TORQUE VECTORING SYSTEMS (ATVS)
10.2.2.2 PASSIVE TORQUE VECTORING SYSTEMS (PTVS)
10.3 COMMERCIAL VEHICLES
10.3.1 BY TYPE
10.3.1.1 LIGHT COMMERCIAL VEHICLE
10.3.1.2 HEAVY COMMERCIAL VEHICLE
10.3.1.2.1 BUS
10.3.1.2.2 TRUCKS
10.3.2 BY TECHNOLOGY
10.3.2.1 ACTIVE TORQUE VECTORING SYSTEMS (ATVS)
10.3.2.2 PASSIVE TORQUE VECTORING SYSTEMS (PTVS)
10.4 OFF ROAD VEHICLE
10.4.1 BY TECHNOLOGY
10.4.1.1 ACTIVE TORQUE VECTORING SYSTEMS (ATVS)
10.4.1.2 PASSIVE TORQUE VECTORING SYSTEMS (PTVS)
11 GLOBAL TORQUE VECTORING MARKET, BY PROPULSION TYPE
11.1 OVERVIEW
11.2 DIESEL/PETROL/CNG
11.3 ELECTRIC VEHICLE
11.3.1 BATTERY ELECTRIC VEHICLE (BEV)
11.3.2 HYBRID ELECTRIC VEHICLE (HEV)
12 GLOBAL TORQUE VECTORING MARKET, BY REGION
12.1 OVERVIEW
12.2 NORTH AMERICA
12.2.1 U.S. (LEFT HAND DRIVE)
12.2.2 CANADA LEFT HAND DRIVE)
12.2.3 MEXICO (LEFT HAND DRIVE)
12.3 EUROPE
12.3.1 GERMANY (LEFT HAND DRIVE)
12.3.2 SPAIN (LEFT HAND DRIVE)
12.3.3 FRANCE (LEFT HAND DRIVE)
12.3.4 RUSSIA (LEFT HAND DRIVE)
12.3.5 TURKEY (LEFT HAND DRIVE)
12.3.6 CZECH REPUBLIC (LEFT HAND DRIVE)
12.3.7 U.K. (RIGHT HAND DRIVE)
12.3.8 ITALY (LEFT HAND DRIVE)
12.3.9 POLAND (LEFT HAND DRIVE)
12.3.10 ROMANIA (LEFT HAND DRIVE)
12.3.11 HUNGARY (LEFT HAND DRIVE)
12.3.12 BELGIUM (LEFT HAND DRIVE)
12.3.13 SWEDEN (LEFT HAND DRIVE)
12.3.14 NETHERLANDS (LEFT HAND DRIVE)
12.3.15 FINLAND (LEFT HAND DRIVE)
12.3.16 BELARUS (LEFT HAND DRIVE)
12.3.17 SWITZERLAND (LEFT HAND DRIVE)
12.3.18 REST OF EUROPE
12.4 ASIA-PACIFIC
12.4.1 CHINA (LEFT HAND DRIVE)
12.4.2 JAPAN (RIGHT HAND DRIVE)
12.4.3 SOUTH KOREA (LEFT HAND DRIVE)
12.4.4 AUSTRALIA AND NEW ZEALAND (RIGHT HAND DRIVE)
12.4.5 INDIA (RIGHT HAND DRIVE)
12.4.6 SINGAPORE (RIGHT HAND DRIVE)
12.4.7 MALAYSIA (RIGHT HAND DRIVE)
12.4.8 THAILAND (RIGHT HAND DRIVE)
12.4.9 INDONESIA (RIGHT HAND DRIVE)
12.4.10 TAIWAN (LEFT HAND DRIVE)
12.4.11 VIETNAM (LEFT HAND DRIVE)
12.4.12 PHILIPPINES (LEFT HAND DRIVE)
12.4.13 REST OF ASIA-PACIFIC
12.5 SOUTH AMERICA
12.5.1 BRAZIL (LEFT HAND DRIVE)
12.5.2 ARGENTINA (LEFT HAND DRIVE)
12.5.3 COLOMBIA (LEFT HAND DRIVE)
12.5.4 CHILE (LEFT HAND DRIVE)
12.5.5 ECUADOR (LEFT HAND DRIVE)
12.5.6 PERU (LEFT HAND DRIVE)
12.5.7 PARAGUAY (LEFT HAND DRIVE)
12.5.8 COSTA RICA (LEFT HAND DRIVE)
12.5.9 REST OF SOUTH AMERICA
12.6 MIDDLE EAST AND AFRICA
12.6.1 SAUDI ARABIA (LEFT HAND DRIVE)
12.6.2 U.A.E. (LEFT HAND DRIVE)
12.6.3 SOUTH AFRICA (RIGHT HAND DRIVE)
12.6.4 EGYPT (LEFT HAND DRIVE)
12.6.5 ISRAEL (LEFT HAND DRIVE)
12.6.6 KUWAIT (LEFT HAND DRIVE)
12.6.7 REST OF MIDDLE EAST AND AFRICA
13 GLOBAL TORQUE VECTORING MARKET, COMPANY LANDSCAPE
13.1 COMPANY SHARE ANALYSIS: GLOBAL
13.2 COMPANY SHARE ANALYSIS: NORTH AMERICA
13.3 COMPANY SHARE ANALYSIS: EUROPE
13.4 COMPANY SHARE ANALYSIS: ASIA PACIFIC
14 SWOT ANALYSIS
15 COMPANY PROFILE
15.1 AMERICAN AXLE & MANUFACTURING, INC.
15.1.1 COMPANY SNAPSHOT
15.1.2 REVENUE ANALYSIS
15.1.3 COMPANY PROFILE
15.1.4 PRODUCT PORTFOLIO
15.1.5 RECENT DEVELOPMENTS
15.2 CONTINENTAL AG
15.2.1 COMPANY SNAPSHOT
15.2.2 REVENUE ANALYSIS
15.2.3 COMPANY SHARE ANALYSIS
15.2.4 PRODUCT PORTFOLIO
15.2.5 RECENT DEVELOPMENT
15.3 EATON
15.3.1 COMPANY SNAPSHOT
15.3.2 REVENUE ANALYSIS
15.3.3 COMPANY SHARE ANALYSIS
15.3.4 PRODUCT PORTFOLIO
15.3.5 RECENT DEVELOPMENTS
15.4 SCHAEFFLER AG
15.4.1 COMPANY SNAPSHOT
15.4.2 REVENUE ANALYSIS
15.4.3 COMPANY SHARE ANALYSIS
15.4.4 PRODUCT PORTFOLIO
15.4.5 RECENT DEVELOPMENTS
15.5 JTEKT CORPORATION
15.5.1 COMPANY SNAPSHOT
15.5.2 REVENUE ANALYSIS
15.5.3 COMPANY SHARE ANALYSIS
15.5.4 PRODUCT PORTFOLIO
15.5.5 RECENT DEVELOPMENTS
15.6 BORGWARNER INC.
15.6.1 COMPANY SNAPSHOT
15.6.2 REVENUE ANALYSIS
15.6.3 PRODUCT PORTFOLIO
15.6.4 RECENT DEVELOPMENTS
15.7 DANA LIMITED
15.7.1 COMPANY SNAPSHOT
15.7.2 REVENUE ANALYSIS
15.7.3 PRODUCT PORTFOLIO
15.7.4 RECENT DEVELOPMENTS
15.8 DRAKO MOTORS, INC.
15.8.1 COMPANY SNAPSHOT
15.8.2 PRODUCTS PORTFOLIO
15.8.3 RECENT DEVELOPMENT
15.9 GKN AUTOMOTIVE LIMITED
15.9.1 COMPANY SNAPSHOT
15.9.2 REVENUE ANALYSIS
15.9.3 PRODUCTS PORTFOLIO
15.9.4 RECENT DEVELOPMENTS
15.1 HALDEX
15.10.1 COMPANY SNPASHOT
15.10.2 REVENUE ANALYSIS
15.10.3 PRODUCT PORTFOLIO
15.10.4 RECENT DEVELOPMENT
15.11 HEWLAND ENGINEERING LTD
15.11.1 COMPANY SNAPSHOT
15.11.2 PRODUCT PORTFOLIO
15.11.3 RECENT DEVELOPMENTS
15.12 LINAMAR CORPORATION
15.12.1 COMPANY SNAPSHOT
15.12.2 REVENUE ANALYSIS
15.12.3 PRODUCT PORTFOLIO
15.12.4 RECENT DEVELOPMENTS
15.13 MAGNA INTERNATIONAL INC.
15.13.1 COMPANY SNAPSHOT
15.13.2 REVENUE ANALYSIS
15.13.3 PRODUCT PORTFOLIO
15.13.4 RECENT DEVELOPMENTS
15.14 MITSUBISHI MOTORS CORPORATION
15.14.1 COMPANY SNAPSHOT
15.14.2 REVENUE ANALYSIS
15.14.3 PRODUCTS PORTFOLIO
15.14.4 RECENT DEVELOPMENT
15.15 MODELON
15.15.1 COMPANY SNAPSHOT
15.15.2 REVENUE ANALYSIS
15.15.3 PRODUCT PORTFOLIO
15.15.4 RECENT DEVELOPMENT
15.16 PRODRIVE HOLDINGS LIMITED
15.16.1 COMPANY SNAPSHOT
15.16.2 PRODUCTS PORTFOLIO
15.16.3 RECENT DEVELOPMENT
15.17 PROTEAN
15.17.1 COMPANY SNAPSHOT
15.17.2 PRODUCT PORTFOLIO
15.17.3 RECENT DEVELOPMENTS
15.18 RICARDO
15.18.1 COMPANY SNAPSHOT
15.18.2 REVENUE ANALYSIS
15.18.3 PRODUCT PORTFOLIO
15.18.4 RECENT DEVELOPMENTS
15.19 ROBERT BOSCH GMBH
15.19.1 COMPANY SNAPSHOT
15.19.2 REVENUE ANALYSIS
15.19.3 PRODUCT PORTFOLIO
15.19.4 RECENT DEVELOPMENT
15.2 THE TIMKEN COMPANY
15.20.1 COMPANY SNAPSHOT
15.20.2 PRODUCT PORTFOLIO
15.20.3 RECENT DEVELOPMENT
15.21 UNIVANCE CORPORATION
15.21.1 COMPANY SNAPSHOT
15.21.2 PRODUCT PORTFOLIO
15.21.3 RECENT DEVELOPMENT
15.22 ZF FRIEDRICHSHAFEN AG
15.22.1 COMPANY SNAPSHOT
15.22.2 SOLUTION PORTFOLIO
15.22.3 RECENT DEVELOPMENTS
16 QUESTIONNAIRE
17 RELATED REPORTS
Lista de Tablas
TABLE 1 PERFORMANCE TABLE
TABLE 2 CARBON EMISSION LEVEL OF VARIOUS TYPES OF CARS & SUVS
TABLE 3 GLOBAL TORQUE VECTORING MARKET, BY COMPONENT, 2020-2029 (USD MILLION)
TABLE 4 GLOBAL HARDWARE IN TORQUE VECTORING MARKET, BY REGION, 2020-2029 (USD MILLION)
TABLE 5 GLOBAL HARDWARE IN TORQUE VECTORING MARKET, BY TYPE, 2020-2029 (USD MILLION)
TABLE 6 GLOBAL SERVICES IN TORQUE VECTORING MARKET, BY REGION, 2020-2029 (USD MILLION)
TABLE 7 GLOBAL TORQUE VECTORING MARKET, BY TECHNOLOGY, 2020-2029 (USD MILLION)
TABLE 8 GLOBAL ACTIVE TORQUE VECTORING SYSTEMS (ATVS) IN TORQUE VECTORING MARKET, BY REGION, 2020-2029 (USD MILLION)
TABLE 9 GLOBAL PASSIVE TORQUE VECTORING SYSTEMS (PTVS) IN TORQUE VECTORING MARKET, BY REGION, 2020-2029 (USD MILLION)
TABLE 10 GLOBAL TORQUE VECTORING MARKET, BY CLUTCH ACTUATION TYPE, 2020-2029 (USD MILLION)
TABLE 11 GLOBAL ELECTRIC IN TORQUE VECTORING MARKET, BY REGION, 2020-2029 (USD MILLION)
TABLE 12 GLOBAL HYDRAULIC IN TORQUE VECTORING MARKET, BY REGION, 2020-2029 (USD MILLION)
TABLE 13 GLOBAL TORQUE VECTORING MARKET, BY DRIVING WHEEL TYPE, 2020-2029 (USD MILLION)
TABLE 14 GLOBAL FRONT-WHEEL DRIVE (FWD) IN TORQUE VECTORING MARKET, BY REGION, 2020-2029 (USD MILLION)
TABLE 15 GLOBAL ALL-WHEEL DRIVE/FOUR-WHEEL DRIVE (AWD/4WD) IN TORQUE VECTORING MARKET, BY REGION, 2020-2029 (USD MILLION)
TABLE 16 GLOBAL REAR-WHEEL DRIVE (RWD) IN TORQUE VECTORING MARKET, BY REGION, 2020-2029 (USD MILLION)
TABLE 17 GLOBAL TORQUE VECTORING MARKET, BY VEHICLE TYPE, 2020-2029 (USD MILLION)
TABLE 18 GLOBAL PASSENGER CARS IN TORQUE VECTORING MARKET, BY REGION, 2020-2029 (USD MILLION)
TABLE 19 GLOBAL PASSENGER CARS IN TORQUE VECTORING MARKET, BY TYPE, 2020-2029 (USD MILLION)
TABLE 20 GLOBAL PASSENGER CARS IN TORQUE VECTORING MARKET, BY TECHNOLOGY, 2020-2029 (USD MILLION)
TABLE 21 GLOBAL COMMERCIAL VEHICLES IN TORQUE VECTORING MARKET, BY REGION, 2020-2029 (USD MILLION)
TABLE 22 GLOBAL COMMERCIAL VEHICLE IN TORQUE VECTORING MARKET, BY TYPE, 2020-2029 (USD MILLION)
TABLE 23 GLOBAL HEAVY COMMERCIAL VEHICLE IN TORQUE VECTORING MARKET, BY TYPE, 2020-2029 (USD MILLION)
TABLE 24 GLOBAL COMMERCIAL VEHICLE IN TORQUE VECTORING MARKET, BY TECHNOLOGY, 2020-2029 (USD MILLION)
TABLE 25 GLOBAL OFF ROAD VEHICLE IN TORQUE VECTORING MARKET, BY REGION, 2020-2029 (USD MILLION)
TABLE 26 GLOBAL OFF ROAD VEHICLE IN TORQUE VECTORING MARKET, BY TECHNOLOGY, 2020-2029 (USD MILLION)
TABLE 27 GLOBAL TORQUE VECTORING MARKET, BY PROPULSION TYPE, 2020-2029 (USD MILLION)
TABLE 28 GLOBAL DIESEL/PETROL/CNG IN TORQUE VECTORING MARKET, BY REGION, 2020-2029 (USD MILLION)
TABLE 29 GLOBAL ELECTRIC VEHICLE IN TORQUE VECTORING MARKET, BY REGION, 2020-2029 (USD MILLION)
TABLE 30 GLOBAL ELECTRIC VEHICLE IN TORQUE VECTORING MARKET, BY TYPE, 2020-2029 (USD MILLION)
TABLE 31 GLOBAL TORQUE VECTORING MARKET, BY REGION, 2020-2029 (USD MILLION)
TABLE 32 NORTH AMERICA TORQUE VECTORING MARKET, BY COUNTRY, 2020-2029 (USD MILLION)
TABLE 33 NORTH AMERICA TORQUE VECTORING MARKET, BY COMPONENT, 2020-2029 (USD MILLION)
TABLE 34 NORTH AMERICA HARDWARE IN TORQUE VECTORING MARKET, BY TYPE, 2020-2029 (USD MILLION)
TABLE 35 NORTH AMERICA TORQUE VECTORING MARKET, BY TECHNOLOGY, 2020-2029 (USD MILLION)
TABLE 36 NORTH AMERICA TORQUE VECTORING MARKET, BY CLUTCH ACTUATION TYPE, 2020-2029 (USD MILLION)
TABLE 37 NORTH AMERICA TORQUE VECTORING MARKET, BY DRIVING WHEEL TYPE, 2020-2029 (USD MILLION)
TABLE 38 NORTH AMERICA TORQUE VECTORING MARKET, BY VEHICLE TYPE, 2020-2029 (USD MILLION)
TABLE 39 NORTH AMERICA PASSENGER CARS IN TORQUE VECTORING MARKET, BY TYPE, 2020-2029 (USD MILLION)
TABLE 40 NORTH AMERICA PASSENGER CARS IN TORQUE VECTORING MARKET, BY TECHNOLOGY, 2020-2029 (USD MILLION)
TABLE 41 NORTH AMERICA COMMERCIAL VEHICLE IN TORQUE VECTORING MARKET, BY TYPE, 2020-2029 (USD MILLION)
TABLE 42 NORTH AMERICA HEAVY COMMERCIAL VEHICLE IN TORQUE VECTORING MARKET, BY TYPE, 2020-2029 (USD MILLION)
TABLE 43 NORTH AMERICA COMMERCIAL VEHICLE IN TORQUE VECTORING MARKET, BY TECHNOLOGY, 2020-2029 (USD MILLION)
TABLE 44 NORTH AMERICA OFF ROAD VEHICLE IN TORQUE VECTORING MARKET, BY TECHNOLOGY, 2020-2029 (USD MILLION)
TABLE 45 NORTH AMERICA TORQUE VECTORING MARKET, BY PROPULSION TYPE, 2020-2029 (USD MILLION)
TABLE 46 NORTH AMERICA ELECTRIC VEHICLE IN TORQUE VECTORING MARKET, BY TECHNOLOGY, 2020-2029 (USD MILLION)
TABLE 47 U.S. (LEFT HAND DRIVE) TORQUE VECTORING MARKET, BY COMPONENT, 2020-2029 (USD MILLION)
TABLE 48 U.S. (LEFT HAND DRIVE) HARDWARE IN TORQUE VECTORING MARKET, BY TYPE, 2020-2029 (USD MILLION)
TABLE 49 U.S. (LEFT HAND DRIVE) TORQUE VECTORING MARKET, BY TECHNOLOGY, 2020-2029 (USD MILLION)
TABLE 50 U.S. (LEFT HAND DRIVE) TORQUE VECTORING MARKET, BY CLUTCH ACTUATION TYPE, 2020-2029 (USD MILLION)
TABLE 51 U.S. (LEFT HAND DRIVE) TORQUE VECTORING MARKET, BY DRIVING WHEEL TYPE, 2020-2029 (USD MILLION)
TABLE 52 U.S. (LEFT HAND DRIVE) TORQUE VECTORING MARKET, BY VEHICLE TYPE, 2020-2029 (USD MILLION)
TABLE 53 U.S. (LEFT HAND DRIVE) PASSENGER CARS IN TORQUE VECTORING MARKET, BY TYPE, 2020-2029 (USD MILLION)
TABLE 54 U.S. (LEFT HAND DRIVE) PASSENGER CARS IN TORQUE VECTORING MARKET, BY TECHNOLOGY, 2020-2029 (USD MILLION)
TABLE 55 U.S. (LEFT HAND DRIVE) COMMERCIAL VEHICLE IN TORQUE VECTORING MARKET, BY TYPE, 2020-2029 (USD MILLION)
TABLE 56 U.S. (LEFT HAND DRIVE) HEAVY COMMERCIAL VEHICLE IN TORQUE VECTORING MARKET, BY TYPE, 2020-2029 (USD MILLION)
TABLE 57 U.S. (LEFT HAND DRIVE) COMMERCIAL VEHICLE IN TORQUE VECTORING MARKET, BY TECHNOLOGY, 2020-2029 (USD MILLION)
TABLE 58 U.S. (LEFT HAND DRIVE) OFF ROAD VEHICLE IN TORQUE VECTORING MARKET, BY TECHNOLOGY, 2020-2029 (USD MILLION)
TABLE 59 U.S. (LEFT HAND DRIVE) TORQUE VECTORING MARKET, BY PROPULSION TYPE, 2020-2029 (USD MILLION)
TABLE 60 U.S. (LEFT HAND DRIVE) ELECTRIC VEHICLE IN TORQUE VECTORING MARKET, BY TECHNOLOGY, 2020-2029 (USD MILLION)
TABLE 61 CANADA (LEFT HAND DRIVE) TORQUE VECTORING MARKET, BY COMPONENT, 2020-2029 (USD MILLION)
TABLE 62 CANADA (LEFT HAND DRIVE) HARDWARE IN TORQUE VECTORING MARKET, BY TYPE, 2020-2029 (USD MILLION)
TABLE 63 CANADA (LEFT HAND DRIVE) TORQUE VECTORING MARKET, BY TECHNOLOGY, 2020-2029 (USD MILLION)
TABLE 64 CANADA (LEFT HAND DRIVE) TORQUE VECTORING MARKET, BY CLUTCH ACTUATION TYPE, 2020-2029 (USD MILLION)
TABLE 65 CANADA (LEFT HAND DRIVE) TORQUE VECTORING MARKET, BY DRIVING WHEEL TYPE, 2020-2029 (USD MILLION)
TABLE 66 CANADA (LEFT HAND DRIVE) TORQUE VECTORING MARKET, BY VEHICLE TYPE, 2020-2029 (USD MILLION)
TABLE 67 CANADA (LEFT HAND DRIVE) PASSENGER CARS IN TORQUE VECTORING MARKET, BY TYPE, 2020-2029 (USD MILLION)
TABLE 68 CANADA (LEFT HAND DRIVE) PASSENGER CARS IN TORQUE VECTORING MARKET, BY TECHNOLOGY, 2020-2029 (USD MILLION)
TABLE 69 CANADA (LEFT HAND DRIVE) COMMERCIAL VEHICLE IN TORQUE VECTORING MARKET, BY TYPE, 2020-2029 (USD MILLION)
TABLE 70 CANADA (LEFT HAND DRIVE) HEAVY COMMERCIAL VEHICLE IN TORQUE VECTORING MARKET, BY TYPE, 2020-2029 (USD MILLION)
TABLE 71 CANADA (LEFT HAND DRIVE) COMMERCIAL VEHICLE IN TORQUE VECTORING MARKET, BY TECHNOLOGY, 2020-2029 (USD MILLION)
TABLE 72 CANADA (LEFT HAND DRIVE) OFF ROAD VEHICLE IN TORQUE VECTORING MARKET, BY TECHNOLOGY, 2020-2029 (USD MILLION)
TABLE 73 CANADA (LEFT HAND DRIVE) TORQUE VECTORING MARKET, BY PROPULSION TYPE, 2020-2029 (USD MILLION)
TABLE 74 CANADA (LEFT HAND DRIVE) ELECTRIC VEHICLE IN TORQUE VECTORING MARKET, BY TECHNOLOGY, 2020-2029 (USD MILLION)
TABLE 75 MEXICO (LEFT HAND DRIVE) TORQUE VECTORING MARKET, BY COMPONENT, 2020-2029 (USD MILLION)
TABLE 76 MEXICO (LEFT HAND DRIVE) HARDWARE IN TORQUE VECTORING MARKET, BY TYPE, 2020-2029 (USD MILLION)
TABLE 77 MEXICO (LEFT HAND DRIVE) TORQUE VECTORING MARKET, BY TECHNOLOGY, 2020-2029 (USD MILLION)
TABLE 78 MEXICO (LEFT HAND DRIVE) TORQUE VECTORING MARKET, BY CLUTCH ACTUATION TYPE, 2020-2029 (USD MILLION)
TABLE 79 MEXICO (LEFT HAND DRIVE) TORQUE VECTORING MARKET, BY DRIVING WHEEL TYPE, 2020-2029 (USD MILLION)
TABLE 80 MEXICO (LEFT HAND DRIVE) TORQUE VECTORING MARKET, BY VEHICLE TYPE, 2020-2029 (USD MILLION)
TABLE 81 MEXICO (LEFT HAND DRIVE) PASSENGER CARS IN TORQUE VECTORING MARKET, BY TYPE, 2020-2029 (USD MILLION)
TABLE 82 MEXICO (LEFT HAND DRIVE) PASSENGER CARS IN TORQUE VECTORING MARKET, BY TECHNOLOGY, 2020-2029 (USD MILLION)
TABLE 83 MEXICO (LEFT HAND DRIVE) COMMERCIAL VEHICLE IN TORQUE VECTORING MARKET, BY TYPE, 2020-2029 (USD MILLION)
TABLE 84 MEXICO (LEFT HAND DRIVE) HEAVY COMMERCIAL VEHICLE IN TORQUE VECTORING MARKET, BY TYPE, 2020-2029 (USD MILLION)
TABLE 85 MEXICO (LEFT HAND DRIVE) COMMERCIAL VEHICLE IN TORQUE VECTORING MARKET, BY TECHNOLOGY, 2020-2029 (USD MILLION)
TABLE 86 MEXICO (LEFT HAND DRIVE) OFF ROAD VEHICLE IN TORQUE VECTORING MARKET, BY TECHNOLOGY, 2020-2029 (USD MILLION)
TABLE 87 MEXICO (LEFT HAND DRIVE) TORQUE VECTORING MARKET, BY PROPULSION TYPE, 2020-2029 (USD MILLION)
TABLE 88 MEXICO (LEFT HAND DRIVE) ELECTRIC VEHICLE IN TORQUE VECTORING MARKET, BY TECHNOLOGY, 2020-2029 (USD MILLION)
TABLE 89 EUROPE TORQUE VECTORING MARKET, BY COUNTRY, 2020-2029 (USD MILLION)
TABLE 90 EUROPE (LEFT HAND DRIVE) TORQUE VECTORING MARKET, BY COUNTRY, 2020-2029 (USD MILLION)
TABLE 91 EUROPE (RIGHT HAND DRIVE) TORQUE VECTORING MARKET, BY COUNTRY, 2020-2029 (USD MILLION)
TABLE 92 EUROPE TORQUE VECTORING MARKET, BY COMPONENT, 2020-2029 (USD MILLION)
TABLE 93 EUROPE HARDWARE IN TORQUE VECTORING MARKET, BY TYPE, 2020-2029 (USD MILLION)
TABLE 94 EUROPE TORQUE VECTORING MARKET, BY TECHNOLOGY, 2020-2029 (USD MILLION)
TABLE 95 EUROPE TORQUE VECTORING MARKET, BY CLUTCH ACTUATION TYPE, 2020-2029 (USD MILLION)
TABLE 96 EUROPE TORQUE VECTORING MARKET, BY DRIVING WHEEL TYPE, 2020-2029 (USD MILLION)
TABLE 97 EUROPE TORQUE VECTORING MARKET, BY VEHICLE TYPE, 2020-2029 (USD MILLION)
TABLE 98 EUROPE PASSENGER CARS IN TORQUE VECTORING MARKET, BY TYPE, 2020-2029 (USD MILLION)
TABLE 99 EUROPE PASSENGER CARS IN TORQUE VECTORING MARKET, BY TECHNOLOGY, 2020-2029 (USD MILLION)
TABLE 100 EUROPE COMMERCIAL VEHICLE IN TORQUE VECTORING MARKET, BY TYPE, 2020-2029 (USD MILLION)
TABLE 101 EUROPE HEAVY COMMERCIAL VEHICLE IN TORQUE VECTORING MARKET, BY TYPE, 2020-2029 (USD MILLION)
TABLE 102 EUROPE COMMERCIAL VEHICLE IN TORQUE VECTORING MARKET, BY TECHNOLOGY, 2020-2029 (USD MILLION)
TABLE 103 EUROPE OFF ROAD VEHICLE IN TORQUE VECTORING MARKET, BY TECHNOLOGY, 2020-2029 (USD MILLION)
TABLE 104 EUROPE TORQUE VECTORING MARKET, BY PROPULSION TYPE, 2020-2029 (USD MILLION)
TABLE 105 EUROPE ELECTRIC VEHICLE IN TORQUE VECTORING MARKET, BY TECHNOLOGY, 2020-2029 (USD MILLION)
TABLE 106 GERMANY (LEFT HAND DRIVE) TORQUE VECTORING MARKET, BY COMPONENT, 2020-2029 (USD MILLION)
TABLE 107 GERMANY (LEFT HAND DRIVE) HARDWARE IN TORQUE VECTORING MARKET, BY TYPE, 2020-2029 (USD MILLION)
TABLE 108 GERMANY (LEFT HAND DRIVE) TORQUE VECTORING MARKET, BY TECHNOLOGY, 2020-2029 (USD MILLION)
TABLE 109 GERMANY (LEFT HAND DRIVE) TORQUE VECTORING MARKET, BY CLUTCH ACTUATION TYPE, 2020-2029 (USD MILLION)
TABLE 110 GERMANY (LEFT HAND DRIVE) TORQUE VECTORING MARKET, BY DRIVING WHEEL TYPE, 2020-2029 (USD MILLION)
TABLE 111 GERMANY (LEFT HAND DRIVE) TORQUE VECTORING MARKET, BY VEHICLE TYPE, 2020-2029 (USD MILLION)
TABLE 112 GERMANY (LEFT HAND DRIVE) PASSENGER CARS IN TORQUE VECTORING MARKET, BY TYPE, 2020-2029 (USD MILLION)
TABLE 113 GERMANY (LEFT HAND DRIVE) PASSENGER CARS IN TORQUE VECTORING MARKET, BY TECHNOLOGY, 2020-2029 (USD MILLION)
TABLE 114 GERMANY (LEFT HAND DRIVE) COMMERCIAL VEHICLE IN TORQUE VECTORING MARKET, BY TYPE, 2020-2029 (USD MILLION)
TABLE 115 GERMANY (LEFT HAND DRIVE) HEAVY COMMERCIAL VEHICLE IN TORQUE VECTORING MARKET, BY TYPE, 2020-2029 (USD MILLION)
TABLE 116 GERMANY (LEFT HAND DRIVE) COMMERCIAL VEHICLE IN TORQUE VECTORING MARKET, BY TECHNOLOGY, 2020-2029 (USD MILLION)
TABLE 117 GERMANY (LEFT HAND DRIVE) OFF ROAD VEHICLE IN TORQUE VECTORING MARKET, BY TECHNOLOGY, 2020-2029 (USD MILLION)
TABLE 118 GERMANY (LEFT HAND DRIVE) TORQUE VECTORING MARKET, BY PROPULSION TYPE, 2020-2029 (USD MILLION)
TABLE 119 GERMANY (LEFT HAND DRIVE) ELECTRIC VEHICLE IN TORQUE VECTORING MARKET, BY TECHNOLOGY, 2020-2029 (USD MILLION)
TABLE 120 SPAIN (LEFT HAND DRIVE) TORQUE VECTORING MARKET, BY COMPONENT, 2020-2029 (USD MILLION)
TABLE 121 SPAIN (LEFT HAND DRIVE) HARDWARE IN TORQUE VECTORING MARKET, BY TYPE, 2020-2029 (USD MILLION)
TABLE 122 SPAIN (LEFT HAND DRIVE) TORQUE VECTORING MARKET, BY TECHNOLOGY, 2020-2029 (USD MILLION)
TABLE 123 SPAIN (LEFT HAND DRIVE) TORQUE VECTORING MARKET, BY CLUTCH ACTUATION TYPE, 2020-2029 (USD MILLION)
TABLE 124 SPAIN (LEFT HAND DRIVE) TORQUE VECTORING MARKET, BY DRIVING WHEEL TYPE, 2020-2029 (USD MILLION)
TABLE 125 SPAIN (LEFT HAND DRIVE) TORQUE VECTORING MARKET, BY VEHICLE TYPE, 2020-2029 (USD MILLION)
TABLE 126 SPAIN (LEFT HAND DRIVE) PASSENGER CARS IN TORQUE VECTORING MARKET, BY TYPE, 2020-2029 (USD MILLION)
TABLE 127 SPAIN (LEFT HAND DRIVE) PASSENGER CARS IN TORQUE VECTORING MARKET, BY TECHNOLOGY, 2020-2029 (USD MILLION)
TABLE 128 SPAIN (LEFT HAND DRIVE) COMMERCIAL VEHICLE IN TORQUE VECTORING MARKET, BY TYPE, 2020-2029 (USD MILLION)
TABLE 129 SPAIN (LEFT HAND DRIVE) HEAVY COMMERCIAL VEHICLE IN TORQUE VECTORING MARKET, BY TYPE, 2020-2029 (USD MILLION)
TABLE 130 SPAIN (LEFT HAND DRIVE) COMMERCIAL VEHICLE IN TORQUE VECTORING MARKET, BY TECHNOLOGY, 2020-2029 (USD MILLION)
TABLE 131 SPAIN (LEFT HAND DRIVE) OFF ROAD VEHICLE IN TORQUE VECTORING MARKET, BY TECHNOLOGY, 2020-2029 (USD MILLION)
TABLE 132 SPAIN (LEFT HAND DRIVE) TORQUE VECTORING MARKET, BY PROPULSION TYPE, 2020-2029 (USD MILLION)
TABLE 133 SPAIN (LEFT HAND DRIVE) ELECTRIC VEHICLE IN TORQUE VECTORING MARKET, BY TECHNOLOGY, 2020-2029 (USD MILLION)
TABLE 134 FRANCE (LEFT HAND DRIVE) TORQUE VECTORING MARKET, BY COMPONENT, 2020-2029 (USD MILLION)
TABLE 135 FRANCE (LEFT HAND DRIVE) HARDWARE IN TORQUE VECTORING MARKET, BY TYPE, 2020-2029 (USD MILLION)
TABLE 136 FRANCE (LEFT HAND DRIVE) TORQUE VECTORING MARKET, BY TECHNOLOGY, 2020-2029 (USD MILLION)
TABLE 137 FRANCE (LEFT HAND DRIVE) TORQUE VECTORING MARKET, BY CLUTCH ACTUATION TYPE, 2020-2029 (USD MILLION)
TABLE 138 FRANCE (LEFT HAND DRIVE) TORQUE VECTORING MARKET, BY DRIVING WHEEL TYPE, 2020-2029 (USD MILLION)
TABLE 139 FRANCE (LEFT HAND DRIVE) TORQUE VECTORING MARKET, BY VEHICLE TYPE, 2020-2029 (USD MILLION)
TABLE 140 FRANCE (LEFT HAND DRIVE) PASSENGER CARS IN TORQUE VECTORING MARKET, BY TYPE, 2020-2029 (USD MILLION)
TABLE 141 FRANCE (LEFT HAND DRIVE) PASSENGER CARS IN TORQUE VECTORING MARKET, BY TECHNOLOGY, 2020-2029 (USD MILLION)
TABLE 142 FRANCE (LEFT HAND DRIVE) COMMERCIAL VEHICLE IN TORQUE VECTORING MARKET, BY TYPE, 2020-2029 (USD MILLION)
TABLE 143 FRANCE (LEFT HAND DRIVE) HEAVY COMMERCIAL VEHICLE IN TORQUE VECTORING MARKET, BY TYPE, 2020-2029 (USD MILLION)
TABLE 144 FRANCE (LEFT HAND DRIVE) COMMERCIAL VEHICLE IN TORQUE VECTORING MARKET, BY TECHNOLOGY, 2020-2029 (USD MILLION)
TABLE 145 FRANCE (LEFT HAND DRIVE) OFF ROAD VEHICLE IN TORQUE VECTORING MARKET, BY TECHNOLOGY, 2020-2029 (USD MILLION)
TABLE 146 FRANCE (LEFT HAND DRIVE) TORQUE VECTORING MARKET, BY PROPULSION TYPE, 2020-2029 (USD MILLION)
TABLE 147 FRANCE (LEFT HAND DRIVE) ELECTRIC VEHICLE IN TORQUE VECTORING MARKET, BY TECHNOLOGY, 2020-2029 (USD MILLION)
TABLE 148 RUSSIA (LEFT HAND DRIVE) TORQUE VECTORING MARKET, BY COMPONENT, 2020-2029 (USD MILLION)
TABLE 149 RUSSIA (LEFT HAND DRIVE) HARDWARE IN TORQUE VECTORING MARKET, BY TYPE, 2020-2029 (USD MILLION)
TABLE 150 RUSSIA (LEFT HAND DRIVE) TORQUE VECTORING MARKET, BY TECHNOLOGY, 2020-2029 (USD MILLION)
TABLE 151 RUSSIA (LEFT HAND DRIVE) TORQUE VECTORING MARKET, BY CLUTCH ACTUATION TYPE, 2020-2029 (USD MILLION)
TABLE 152 RUSSIA (LEFT HAND DRIVE) TORQUE VECTORING MARKET, BY DRIVING WHEEL TYPE, 2020-2029 (USD MILLION)
TABLE 153 RUSSIA (LEFT HAND DRIVE) TORQUE VECTORING MARKET, BY VEHICLE TYPE, 2020-2029 (USD MILLION)
TABLE 154 RUSSIA (LEFT HAND DRIVE) PASSENGER CARS IN TORQUE VECTORING MARKET, BY TYPE, 2020-2029 (USD MILLION)
TABLE 155 RUSSIA (LEFT HAND DRIVE) PASSENGER CARS IN TORQUE VECTORING MARKET, BY TECHNOLOGY, 2020-2029 (USD MILLION)
TABLE 156 RUSSIA (LEFT HAND DRIVE) COMMERCIAL VEHICLE IN TORQUE VECTORING MARKET, BY TYPE, 2020-2029 (USD MILLION)
TABLE 157 RUSSIA (LEFT HAND DRIVE) HEAVY COMMERCIAL VEHICLE IN TORQUE VECTORING MARKET, BY TYPE, 2020-2029 (USD MILLION)
TABLE 158 RUSSIA (LEFT HAND DRIVE) COMMERCIAL VEHICLE IN TORQUE VECTORING MARKET, BY TECHNOLOGY, 2020-2029 (USD MILLION)
TABLE 159 RUSSIA (LEFT HAND DRIVE) OFF ROAD VEHICLE IN TORQUE VECTORING MARKET, BY TECHNOLOGY, 2020-2029 (USD MILLION)
TABLE 160 RUSSIA (LEFT HAND DRIVE) TORQUE VECTORING MARKET, BY PROPULSION TYPE, 2020-2029 (USD MILLION)
TABLE 161 RUSSIA (LEFT HAND DRIVE) ELECTRIC VEHICLE IN TORQUE VECTORING MARKET, BY TECHNOLOGY, 2020-2029 (USD MILLION)
TABLE 162 TURKEY (LEFT HAND DRIVE) TORQUE VECTORING MARKET, BY COMPONENT, 2020-2029 (USD MILLION)
TABLE 163 TURKEY (LEFT HAND DRIVE) HARDWARE IN TORQUE VECTORING MARKET, BY TYPE, 2020-2029 (USD MILLION)
TABLE 164 TURKEY (LEFT HAND DRIVE) TORQUE VECTORING MARKET, BY TECHNOLOGY, 2020-2029 (USD MILLION)
TABLE 165 TURKEY (LEFT HAND DRIVE) TORQUE VECTORING MARKET, BY CLUTCH ACTUATION TYPE, 2020-2029 (USD MILLION)
TABLE 166 TURKEY (LEFT HAND DRIVE) TORQUE VECTORING MARKET, BY DRIVING WHEEL TYPE, 2020-2029 (USD MILLION)
TABLE 167 TURKEY (LEFT HAND DRIVE) TORQUE VECTORING MARKET, BY VEHICLE TYPE, 2020-2029 (USD MILLION)
TABLE 168 TURKEY (LEFT HAND DRIVE) PASSENGER CARS IN TORQUE VECTORING MARKET, BY TYPE, 2020-2029 (USD MILLION)
TABLE 169 TURKEY (LEFT HAND DRIVE) PASSENGER CARS IN TORQUE VECTORING MARKET, BY TECHNOLOGY, 2020-2029 (USD MILLION)
TABLE 170 TURKEY (LEFT HAND DRIVE) COMMERCIAL VEHICLE IN TORQUE VECTORING MARKET, BY TYPE, 2020-2029 (USD MILLION)
TABLE 171 TURKEY (LEFT HAND DRIVE) HEAVY COMMERCIAL VEHICLE IN TORQUE VECTORING MARKET, BY TYPE, 2020-2029 (USD MILLION)
TABLE 172 TURKEY (LEFT HAND DRIVE) COMMERCIAL VEHICLE IN TORQUE VECTORING MARKET, BY TECHNOLOGY, 2020-2029 (USD MILLION)
TABLE 173 TURKEY (LEFT HAND DRIVE) OFF ROAD VEHICLE IN TORQUE VECTORING MARKET, BY TECHNOLOGY, 2020-2029 (USD MILLION)
TABLE 174 TURKEY (LEFT HAND DRIVE) TORQUE VECTORING MARKET, BY PROPULSION TYPE, 2020-2029 (USD MILLION)
TABLE 175 TURKEY (LEFT HAND DRIVE) ELECTRIC VEHICLE IN TORQUE VECTORING MARKET, BY TECHNOLOGY, 2020-2029 (USD MILLION)
TABLE 176 CZECH REPUBLIC (LEFT HAND DRIVE) TORQUE VECTORING MARKET, BY COMPONENT, 2020-2029 (USD MILLION)
TABLE 177 CZECH REPUBLIC (LEFT HAND DRIVE) HARDWARE IN TORQUE VECTORING MARKET, BY TYPE, 2020-2029 (USD MILLION)
TABLE 178 CZECH REPUBLIC (LEFT HAND DRIVE) TORQUE VECTORING MARKET, BY TECHNOLOGY, 2020-2029 (USD MILLION)
TABLE 179 CZECH REPUBLIC (LEFT HAND DRIVE) TORQUE VECTORING MARKET, BY CLUTCH ACTUATION TYPE, 2020-2029 (USD MILLION)
TABLE 180 CZECH REPUBLIC (LEFT HAND DRIVE) TORQUE VECTORING MARKET, BY DRIVING WHEEL TYPE, 2020-2029 (USD MILLION)
TABLE 181 CZECH REPUBLIC (LEFT HAND DRIVE) TORQUE VECTORING MARKET, BY VEHICLE TYPE, 2020-2029 (USD MILLION)
TABLE 182 CZECH REPUBLIC (LEFT HAND DRIVE) PASSENGER CARS IN TORQUE VECTORING MARKET, BY TYPE, 2020-2029 (USD MILLION)
TABLE 183 CZECH REPUBLIC (LEFT HAND DRIVE) PASSENGER CARS IN TORQUE VECTORING MARKET, BY TECHNOLOGY, 2020-2029 (USD MILLION)
TABLE 184 CZECH REPUBLIC (LEFT HAND DRIVE) COMMERCIAL VEHICLE IN TORQUE VECTORING MARKET, BY TYPE, 2020-2029 (USD MILLION)
TABLE 185 CZECH REPUBLIC (LEFT HAND DRIVE) HEAVY COMMERCIAL VEHICLE IN TORQUE VECTORING MARKET, BY TYPE, 2020-2029 (USD MILLION)
TABLE 186 CZECH REPUBLIC (LEFT HAND DRIVE) COMMERCIAL VEHICLE IN TORQUE VECTORING MARKET, BY TECHNOLOGY, 2020-2029 (USD MILLION)
TABLE 187 CZECH REPUBLIC (LEFT HAND DRIVE) OFF ROAD VEHICLE IN TORQUE VECTORING MARKET, BY TECHNOLOGY, 2020-2029 (USD MILLION)
TABLE 188 CZECH REPUBLIC (LEFT HAND DRIVE) TORQUE VECTORING MARKET, BY PROPULSION TYPE, 2020-2029 (USD MILLION)
TABLE 189 CZECH REPUBLIC (LEFT HAND DRIVE) ELECTRIC VEHICLE IN TORQUE VECTORING MARKET, BY TECHNOLOGY, 2020-2029 (USD MILLION)
TABLE 190 U.K. (RIGHT HAND DRIVE) TORQUE VECTORING MARKET, BY COMPONENT, 2020-2029 (USD MILLION)
TABLE 191 U.K. (RIGHT HAND DRIVE) HARDWARE IN TORQUE VECTORING MARKET, BY TYPE, 2020-2029 (USD MILLION)
TABLE 192 U.K. (RIGHT HAND DRIVE) TORQUE VECTORING MARKET, BY TECHNOLOGY, 2020-2029 (USD MILLION)
TABLE 193 U.K. (RIGHT HAND DRIVE) TORQUE VECTORING MARKET, BY CLUTCH ACTUATION TYPE, 2020-2029 (USD MILLION)
TABLE 194 U.K. (RIGHT HAND DRIVE) TORQUE VECTORING MARKET, BY DRIVING WHEEL TYPE, 2020-2029 (USD MILLION)
TABLE 195 U.K. (RIGHT HAND DRIVE) TORQUE VECTORING MARKET, BY VEHICLE TYPE, 2020-2029 (USD MILLION)
TABLE 196 U.K. (RIGHT HAND DRIVE) PASSENGER CARS IN TORQUE VECTORING MARKET, BY TYPE, 2020-2029 (USD MILLION)
TABLE 197 U.K. (RIGHT HAND DRIVE) PASSENGER CARS IN TORQUE VECTORING MARKET, BY TECHNOLOGY, 2020-2029 (USD MILLION)
TABLE 198 U.K. (RIGHT HAND DRIVE) COMMERCIAL VEHICLE IN TORQUE VECTORING MARKET, BY TYPE, 2020-2029 (USD MILLION)
TABLE 199 U.K. (RIGHT HAND DRIVE) HEAVY COMMERCIAL VEHICLE IN TORQUE VECTORING MARKET, BY TYPE, 2020-2029 (USD MILLION)
TABLE 200 U.K. (RIGHT HAND DRIVE) COMMERCIAL VEHICLE IN TORQUE VECTORING MARKET, BY TECHNOLOGY, 2020-2029 (USD MILLION)
TABLE 201 U.K. (RIGHT HAND DRIVE) OFF ROAD VEHICLE IN TORQUE VECTORING MARKET, BY TECHNOLOGY, 2020-2029 (USD MILLION)
TABLE 202 U.K. (RIGHT HAND DRIVE) TORQUE VECTORING MARKET, BY PROPULSION TYPE, 2020-2029 (USD MILLION)
TABLE 203 U.K. (RIGHT HAND DRIVE) ELECTRIC VEHICLE IN TORQUE VECTORING MARKET, BY TECHNOLOGY, 2020-2029 (USD MILLION)
TABLE 204 ITALY (LEFT HAND DRIVE) TORQUE VECTORING MARKET, BY COMPONENT, 2020-2029 (USD MILLION)
TABLE 205 ITALY (LEFT HAND DRIVE) HARDWARE IN TORQUE VECTORING MARKET, BY TYPE, 2020-2029 (USD MILLION)
TABLE 206 ITALY (LEFT HAND DRIVE) TORQUE VECTORING MARKET, BY TECHNOLOGY, 2020-2029 (USD MILLION)
TABLE 207 ITALY (LEFT HAND DRIVE) TORQUE VECTORING MARKET, BY CLUTCH ACTUATION TYPE, 2020-2029 (USD MILLION)
TABLE 208 ITALY (LEFT HAND DRIVE) TORQUE VECTORING MARKET, BY DRIVING WHEEL TYPE, 2020-2029 (USD MILLION)
TABLE 209 ITALY (LEFT HAND DRIVE) TORQUE VECTORING MARKET, BY VEHICLE TYPE, 2020-2029 (USD MILLION)
TABLE 210 ITALY (LEFT HAND DRIVE) PASSENGER CARS IN TORQUE VECTORING MARKET, BY TYPE, 2020-2029 (USD MILLION)
TABLE 211 ITALY (LEFT HAND DRIVE) PASSENGER CARS IN TORQUE VECTORING MARKET, BY TECHNOLOGY, 2020-2029 (USD MILLION)
TABLE 212 ITALY (LEFT HAND DRIVE) COMMERCIAL VEHICLE IN TORQUE VECTORING MARKET, BY TYPE, 2020-2029 (USD MILLION)
TABLE 213 ITALY (LEFT HAND DRIVE) HEAVY COMMERCIAL VEHICLE IN TORQUE VECTORING MARKET, BY TYPE, 2020-2029 (USD MILLION)
TABLE 214 ITALY (LEFT HAND DRIVE) COMMERCIAL VEHICLE IN TORQUE VECTORING MARKET, BY TECHNOLOGY, 2020-2029 (USD MILLION)
TABLE 215 ITALY (LEFT HAND DRIVE) OFF ROAD VEHICLE IN TORQUE VECTORING MARKET, BY TECHNOLOGY, 2020-2029 (USD MILLION)
TABLE 216 ITALY (LEFT HAND DRIVE) TORQUE VECTORING MARKET, BY PROPULSION TYPE, 2020-2029 (USD MILLION)
TABLE 217 ITALY (LEFT HAND DRIVE) ELECTRIC VEHICLE IN TORQUE VECTORING MARKET, BY TECHNOLOGY, 2020-2029 (USD MILLION)
TABLE 218 POLAND (LEFT HAND DRIVE) TORQUE VECTORING MARKET, BY COMPONENT, 2020-2029 (USD MILLION)
TABLE 219 POLAND (LEFT HAND DRIVE) HARDWARE IN TORQUE VECTORING MARKET, BY TYPE, 2020-2029 (USD MILLION)
TABLE 220 POLAND (LEFT HAND DRIVE) TORQUE VECTORING MARKET, BY TECHNOLOGY, 2020-2029 (USD MILLION)
TABLE 221 POLAND (LEFT HAND DRIVE) TORQUE VECTORING MARKET, BY CLUTCH ACTUATION TYPE, 2020-2029 (USD MILLION)
TABLE 222 POLAND (LEFT HAND DRIVE) TORQUE VECTORING MARKET, BY DRIVING WHEEL TYPE, 2020-2029 (USD MILLION)
TABLE 223 POLAND (LEFT HAND DRIVE) TORQUE VECTORING MARKET, BY VEHICLE TYPE, 2020-2029 (USD MILLION)
TABLE 224 POLAND (LEFT HAND DRIVE) PASSENGER CARS IN TORQUE VECTORING MARKET, BY TYPE, 2020-2029 (USD MILLION)
TABLE 225 POLAND (LEFT HAND DRIVE) PASSENGER CARS IN TORQUE VECTORING MARKET, BY TECHNOLOGY, 2020-2029 (USD MILLION)
TABLE 226 POLAND (LEFT HAND DRIVE) COMMERCIAL VEHICLE IN TORQUE VECTORING MARKET, BY TYPE, 2020-2029 (USD MILLION)
TABLE 227 POLAND (LEFT HAND DRIVE) HEAVY COMMERCIAL VEHICLE IN TORQUE VECTORING MARKET, BY TYPE, 2020-2029 (USD MILLION)
TABLE 228 POLAND (LEFT HAND DRIVE) COMMERCIAL VEHICLE IN TORQUE VECTORING MARKET, BY TECHNOLOGY, 2020-2029 (USD MILLION)
TABLE 229 POLAND (LEFT HAND DRIVE) OFF ROAD VEHICLE IN TORQUE VECTORING MARKET, BY TECHNOLOGY, 2020-2029 (USD MILLION)
TABLE 230 POLAND (LEFT HAND DRIVE) TORQUE VECTORING MARKET, BY PROPULSION TYPE, 2020-2029 (USD MILLION)
TABLE 231 POLAND (LEFT HAND DRIVE) ELECTRIC VEHICLE IN TORQUE VECTORING MARKET, BY TECHNOLOGY, 2020-2029 (USD MILLION)
TABLE 232 ROMANIA (LEFT HAND DRIVE) TORQUE VECTORING MARKET, BY COMPONENT, 2020-2029 (USD MILLION)
TABLE 233 ROMANIA (LEFT HAND DRIVE) HARDWARE IN TORQUE VECTORING MARKET, BY TYPE, 2020-2029 (USD MILLION)
TABLE 234 ROMANIA (LEFT HAND DRIVE) TORQUE VECTORING MARKET, BY TECHNOLOGY, 2020-2029 (USD MILLION)
TABLE 235 ROMANIA (LEFT HAND DRIVE) TORQUE VECTORING MARKET, BY CLUTCH ACTUATION TYPE, 2020-2029 (USD MILLION)
TABLE 236 ROMANIA (LEFT HAND DRIVE) TORQUE VECTORING MARKET, BY DRIVING WHEEL TYPE, 2020-2029 (USD MILLION)
TABLE 237 ROMANIA (LEFT HAND DRIVE) TORQUE VECTORING MARKET, BY VEHICLE TYPE, 2020-2029 (USD MILLION)
TABLE 238 ROMANIA (LEFT HAND DRIVE) PASSENGER CARS IN TORQUE VECTORING MARKET, BY TYPE, 2020-2029 (USD MILLION)
TABLE 239 ROMANIA (LEFT HAND DRIVE) PASSENGER CARS IN TORQUE VECTORING MARKET, BY TECHNOLOGY, 2020-2029 (USD MILLION)
TABLE 240 ROMANIA (LEFT HAND DRIVE) COMMERCIAL VEHICLE IN TORQUE VECTORING MARKET, BY TYPE, 2020-2029 (USD MILLION)
TABLE 241 ROMANIA (LEFT HAND DRIVE) HEAVY COMMERCIAL VEHICLE IN TORQUE VECTORING MARKET, BY TYPE, 2020-2029 (USD MILLION)
TABLE 242 ROMANIA (LEFT HAND DRIVE) COMMERCIAL VEHICLE IN TORQUE VECTORING MARKET, BY TECHNOLOGY, 2020-2029 (USD MILLION)
TABLE 243 ROMANIA (LEFT HAND DRIVE) OFF ROAD VEHICLE IN TORQUE VECTORING MARKET, BY TECHNOLOGY, 2020-2029 (USD MILLION)
TABLE 244 ROMANIA (LEFT HAND DRIVE) TORQUE VECTORING MARKET, BY PROPULSION TYPE, 2020-2029 (USD MILLION)
TABLE 245 ROMANIA (LEFT HAND DRIVE) ELECTRIC VEHICLE IN TORQUE VECTORING MARKET, BY TECHNOLOGY, 2020-2029 (USD MILLION)
TABLE 246 HUNGARY (LEFT HAND DRIVE) TORQUE VECTORING MARKET, BY COMPONENT, 2020-2029 (USD MILLION)
TABLE 247 HUNGARY (LEFT HAND DRIVE) HARDWARE IN TORQUE VECTORING MARKET, BY TYPE, 2020-2029 (USD MILLION)
TABLE 248 HUNGARY (LEFT HAND DRIVE) TORQUE VECTORING MARKET, BY TECHNOLOGY, 2020-2029 (USD MILLION)
TABLE 249 HUNGARY (LEFT HAND DRIVE) TORQUE VECTORING MARKET, BY CLUTCH ACTUATION TYPE, 2020-2029 (USD MILLION)
TABLE 250 HUNGARY (LEFT HAND DRIVE) TORQUE VECTORING MARKET, BY DRIVING WHEEL TYPE, 2020-2029 (USD MILLION)
TABLE 251 HUNGARY (LEFT HAND DRIVE) TORQUE VECTORING MARKET, BY VEHICLE TYPE, 2020-2029 (USD MILLION)
TABLE 252 HUNGARY (LEFT HAND DRIVE) PASSENGER CARS IN TORQUE VECTORING MARKET, BY TYPE, 2020-2029 (USD MILLION)
TABLE 253 HUNGARY (LEFT HAND DRIVE) PASSENGER CARS IN TORQUE VECTORING MARKET, BY TECHNOLOGY, 2020-2029 (USD MILLION)
TABLE 254 HUNGARY (LEFT HAND DRIVE) COMMERCIAL VEHICLE IN TORQUE VECTORING MARKET, BY TYPE, 2020-2029 (USD MILLION)
TABLE 255 HUNGARY (LEFT HAND DRIVE) HEAVY COMMERCIAL VEHICLE IN TORQUE VECTORING MARKET, BY TYPE, 2020-2029 (USD MILLION)
TABLE 256 HUNGARY (LEFT HAND DRIVE) COMMERCIAL VEHICLE IN TORQUE VECTORING MARKET, BY TECHNOLOGY, 2020-2029 (USD MILLION)
TABLE 257 HUNGARY (LEFT HAND DRIVE) OFF ROAD VEHICLE IN TORQUE VECTORING MARKET, BY TECHNOLOGY, 2020-2029 (USD MILLION)
TABLE 258 HUNGARY (LEFT HAND DRIVE) TORQUE VECTORING MARKET, BY PROPULSION TYPE, 2020-2029 (USD MILLION)
TABLE 259 HUNGARY (LEFT HAND DRIVE) ELECTRIC VEHICLE IN TORQUE VECTORING MARKET, BY TECHNOLOGY, 2020-2029 (USD MILLION)
TABLE 260 BELGIUM (LEFT HAND DRIVE) TORQUE VECTORING MARKET, BY COMPONENT, 2020-2029 (USD MILLION)
TABLE 261 BELGIUM (LEFT HAND DRIVE) HARDWARE IN TORQUE VECTORING MARKET, BY TYPE, 2020-2029 (USD MILLION)
TABLE 262 BELGIUM (LEFT HAND DRIVE) TORQUE VECTORING MARKET, BY TECHNOLOGY, 2020-2029 (USD MILLION)
TABLE 263 BELGIUM (LEFT HAND DRIVE) TORQUE VECTORING MARKET, BY CLUTCH ACTUATION TYPE, 2020-2029 (USD MILLION)
TABLE 264 BELGIUM (LEFT HAND DRIVE) TORQUE VECTORING MARKET, BY DRIVING WHEEL TYPE, 2020-2029 (USD MILLION)
TABLE 265 BELGIUM (LEFT HAND DRIVE) TORQUE VECTORING MARKET, BY VEHICLE TYPE, 2020-2029 (USD MILLION)
TABLE 266 BELGIUM (LEFT HAND DRIVE) PASSENGER CARS IN TORQUE VECTORING MARKET, BY TYPE, 2020-2029 (USD MILLION)
TABLE 267 BELGIUM (LEFT HAND DRIVE) PASSENGER CARS IN TORQUE VECTORING MARKET, BY TECHNOLOGY, 2020-2029 (USD MILLION)
TABLE 268 BELGIUM (LEFT HAND DRIVE) COMMERCIAL VEHICLE IN TORQUE VECTORING MARKET, BY TYPE, 2020-2029 (USD MILLION)
TABLE 269 BELGIUM (LEFT HAND DRIVE) HEAVY COMMERCIAL VEHICLE IN TORQUE VECTORING MARKET, BY TYPE, 2020-2029 (USD MILLION)
TABLE 270 BELGIUM (LEFT HAND DRIVE) COMMERCIAL VEHICLE IN TORQUE VECTORING MARKET, BY TECHNOLOGY, 2020-2029 (USD MILLION)
TABLE 271 BELGIUM (LEFT HAND DRIVE) OFF ROAD VEHICLE IN TORQUE VECTORING MARKET, BY TECHNOLOGY, 2020-2029 (USD MILLION)
TABLE 272 BELGIUM (LEFT HAND DRIVE) TORQUE VECTORING MARKET, BY PROPULSION TYPE, 2020-2029 (USD MILLION)
TABLE 273 BELGIUM (LEFT HAND DRIVE) ELECTRIC VEHICLE IN TORQUE VECTORING MARKET, BY TECHNOLOGY, 2020-2029 (USD MILLION)
TABLE 274 SWEDEN (LEFT HAND DRIVE) TORQUE VECTORING MARKET, BY COMPONENT, 2020-2029 (USD MILLION)
TABLE 275 SWEDEN (LEFT HAND DRIVE) HARDWARE IN TORQUE VECTORING MARKET, BY TYPE, 2020-2029 (USD MILLION)
TABLE 276 SWEDEN (LEFT HAND DRIVE) TORQUE VECTORING MARKET, BY TECHNOLOGY, 2020-2029 (USD MILLION)
TABLE 277 SWEDEN (LEFT HAND DRIVE) TORQUE VECTORING MARKET, BY CLUTCH ACTUATION TYPE, 2020-2029 (USD MILLION)
TABLE 278 SWEDEN (LEFT HAND DRIVE) TORQUE VECTORING MARKET, BY DRIVING WHEEL TYPE, 2020-2029 (USD MILLION)
TABLE 279 SWEDEN (LEFT HAND DRIVE) TORQUE VECTORING MARKET, BY VEHICLE TYPE, 2020-2029 (USD MILLION)
TABLE 280 SWEDEN (LEFT HAND DRIVE) PASSENGER CARS IN TORQUE VECTORING MARKET, BY TYPE, 2020-2029 (USD MILLION)
TABLE 281 SWEDEN (LEFT HAND DRIVE) PASSENGER CARS IN TORQUE VECTORING MARKET, BY TECHNOLOGY, 2020-2029 (USD MILLION)
TABLE 282 SWEDEN (LEFT HAND DRIVE) COMMERCIAL VEHICLE IN TORQUE VECTORING MARKET, BY TYPE, 2020-2029 (USD MILLION)
TABLE 283 SWEDEN (LEFT HAND DRIVE) HEAVY COMMERCIAL VEHICLE IN TORQUE VECTORING MARKET, BY TYPE, 2020-2029 (USD MILLION)
TABLE 284 SWEDEN (LEFT HAND DRIVE) COMMERCIAL VEHICLE IN TORQUE VECTORING MARKET, BY TECHNOLOGY, 2020-2029 (USD MILLION)
TABLE 285 SWEDEN (LEFT HAND DRIVE) OFF ROAD VEHICLE IN TORQUE VECTORING MARKET, BY TECHNOLOGY, 2020-2029 (USD MILLION)
TABLE 286 SWEDEN (LEFT HAND DRIVE) TORQUE VECTORING MARKET, BY PROPULSION TYPE, 2020-2029 (USD MILLION)
TABLE 287 SWEDEN (LEFT HAND DRIVE) ELECTRIC VEHICLE IN TORQUE VECTORING MARKET, BY TECHNOLOGY, 2020-2029 (USD MILLION)
TABLE 288 NETHERLANDS (LEFT HAND DRIVE) TORQUE VECTORING MARKET, BY COMPONENT, 2020-2029 (USD MILLION)
TABLE 289 NETHERLANDS (LEFT HAND DRIVE) HARDWARE IN TORQUE VECTORING MARKET, BY TYPE, 2020-2029 (USD MILLION)
TABLE 290 NETHERLANDS (LEFT HAND DRIVE) TORQUE VECTORING MARKET, BY TECHNOLOGY, 2020-2029 (USD MILLION)
TABLE 291 NETHERLANDS (LEFT HAND DRIVE) TORQUE VECTORING MARKET, BY CLUTCH ACTUATION TYPE, 2020-2029 (USD MILLION)
TABLE 292 NETHERLANDS (LEFT HAND DRIVE) TORQUE VECTORING MARKET, BY DRIVING WHEEL TYPE, 2020-2029 (USD MILLION)
TABLE 293 NETHERLANDS (LEFT HAND DRIVE) TORQUE VECTORING MARKET, BY VEHICLE TYPE, 2020-2029 (USD MILLION)
TABLE 294 NETHERLANDS (LEFT HAND DRIVE) PASSENGER CARS IN TORQUE VECTORING MARKET, BY TYPE, 2020-2029 (USD MILLION)
TABLE 295 NETHERLANDS (LEFT HAND DRIVE) PASSENGER CARS IN TORQUE VECTORING MARKET, BY TECHNOLOGY, 2020-2029 (USD MILLION)
TABLE 296 NETHERLANDS (LEFT HAND DRIVE) COMMERCIAL VEHICLE IN TORQUE VECTORING MARKET, BY TYPE, 2020-2029 (USD MILLION)
TABLE 297 NETHERLANDS (LEFT HAND DRIVE) HEAVY COMMERCIAL VEHICLE IN TORQUE VECTORING MARKET, BY TYPE, 2020-2029 (USD MILLION)
TABLE 298 NETHERLANDS (LEFT HAND DRIVE) COMMERCIAL VEHICLE IN TORQUE VECTORING MARKET, BY TECHNOLOGY, 2020-2029 (USD MILLION)
TABLE 299 NETHERLANDS (LEFT HAND DRIVE) OFF ROAD VEHICLE IN TORQUE VECTORING MARKET, BY TECHNOLOGY, 2020-2029 (USD MILLION)
TABLE 300 NETHERLANDS (LEFT HAND DRIVE) TORQUE VECTORING MARKET, BY PROPULSION TYPE, 2020-2029 (USD MILLION)
TABLE 301 NETHERLANDS (LEFT HAND DRIVE) ELECTRIC VEHICLE IN TORQUE VECTORING MARKET, BY TECHNOLOGY, 2020-2029 (USD MILLION)
TABLE 302 FINLAND (LEFT HAND DRIVE) TORQUE VECTORING MARKET, BY COMPONENT, 2020-2029 (USD MILLION)
TABLE 303 FINLAND (LEFT HAND DRIVE) HARDWARE IN TORQUE VECTORING MARKET, BY TYPE, 2020-2029 (USD MILLION)
TABLE 304 FINLAND (LEFT HAND DRIVE) TORQUE VECTORING MARKET, BY TECHNOLOGY, 2020-2029 (USD MILLION)
TABLE 305 FINLAND (LEFT HAND DRIVE) TORQUE VECTORING MARKET, BY CLUTCH ACTUATION TYPE, 2020-2029 (USD MILLION)
TABLE 306 FINLAND (LEFT HAND DRIVE) TORQUE VECTORING MARKET, BY DRIVING WHEEL TYPE, 2020-2029 (USD MILLION)
TABLE 307 FINLAND (LEFT HAND DRIVE) TORQUE VECTORING MARKET, BY VEHICLE TYPE, 2020-2029 (USD MILLION)
TABLE 308 FINLAND (LEFT HAND DRIVE) PASSENGER CARS IN TORQUE VECTORING MARKET, BY TYPE, 2020-2029 (USD MILLION)
TABLE 309 FINLAND (LEFT HAND DRIVE) PASSENGER CARS IN TORQUE VECTORING MARKET, BY TECHNOLOGY, 2020-2029 (USD MILLION)
TABLE 310 FINLAND (LEFT HAND DRIVE) COMMERCIAL VEHICLE IN TORQUE VECTORING MARKET, BY TYPE, 2020-2029 (USD MILLION)
TABLE 311 FINLAND (LEFT HAND DRIVE) HEAVY COMMERCIAL VEHICLE IN TORQUE VECTORING MARKET, BY TYPE, 2020-2029 (USD MILLION)
TABLE 312 FINLAND (LEFT HAND DRIVE) COMMERCIAL VEHICLE IN TORQUE VECTORING MARKET, BY TECHNOLOGY, 2020-2029 (USD MILLION)
TABLE 313 FINLAND (LEFT HAND DRIVE) OFF ROAD VEHICLE IN TORQUE VECTORING MARKET, BY TECHNOLOGY, 2020-2029 (USD MILLION)
TABLE 314 FINLAND (LEFT HAND DRIVE) TORQUE VECTORING MARKET, BY PROPULSION TYPE, 2020-2029 (USD MILLION)
TABLE 315 FINLAND (LEFT HAND DRIVE) ELECTRIC VEHICLE IN TORQUE VECTORING MARKET, BY TECHNOLOGY, 2020-2029 (USD MILLION)
TABLE 316 BELARUS (LEFT HAND DRIVE) TORQUE VECTORING MARKET, BY COMPONENT, 2020-2029 (USD MILLION)
TABLE 317 BELARUS (LEFT HAND DRIVE) HARDWARE IN TORQUE VECTORING MARKET, BY TYPE, 2020-2029 (USD MILLION)
TABLE 318 BELARUS (LEFT HAND DRIVE) TORQUE VECTORING MARKET, BY TECHNOLOGY, 2020-2029 (USD MILLION)
TABLE 319 BELARUS (LEFT HAND DRIVE) TORQUE VECTORING MARKET, BY CLUTCH ACTUATION TYPE, 2020-2029 (USD MILLION)
TABLE 320 BELARUS (LEFT HAND DRIVE) TORQUE VECTORING MARKET, BY DRIVING WHEEL TYPE, 2020-2029 (USD MILLION)
TABLE 321 BELARUS (LEFT HAND DRIVE) TORQUE VECTORING MARKET, BY VEHICLE TYPE, 2020-2029 (USD MILLION)
TABLE 322 BELARUS (LEFT HAND DRIVE) PASSENGER CARS IN TORQUE VECTORING MARKET, BY TYPE, 2020-2029 (USD MILLION)
TABLE 323 BELARUS (LEFT HAND DRIVE) PASSENGER CARS IN TORQUE VECTORING MARKET, BY TECHNOLOGY, 2020-2029 (USD MILLION)
TABLE 324 BELARUS (LEFT HAND DRIVE) COMMERCIAL VEHICLE IN TORQUE VECTORING MARKET, BY TYPE, 2020-2029 (USD MILLION)
TABLE 325 BELARUS (LEFT HAND DRIVE) HEAVY COMMERCIAL VEHICLE IN TORQUE VECTORING MARKET, BY TYPE, 2020-2029 (USD MILLION)
TABLE 326 BELARUS (LEFT HAND DRIVE) COMMERCIAL VEHICLE IN TORQUE VECTORING MARKET, BY TECHNOLOGY, 2020-2029 (USD MILLION)
TABLE 327 BELARUS (LEFT HAND DRIVE) OFF ROAD VEHICLE IN TORQUE VECTORING MARKET, BY TECHNOLOGY, 2020-2029 (USD MILLION)
TABLE 328 BELARUS (LEFT HAND DRIVE) TORQUE VECTORING MARKET, BY PROPULSION TYPE, 2020-2029 (USD MILLION)
TABLE 329 BELARUS (LEFT HAND DRIVE) ELECTRIC VEHICLE IN TORQUE VECTORING MARKET, BY TECHNOLOGY, 2020-2029 (USD MILLION)
TABLE 330 SWITZERLAND (LEFT HAND DRIVE) TORQUE VECTORING MARKET, BY COMPONENT, 2020-2029 (USD MILLION)
TABLE 331 SWITZERLAND (LEFT HAND DRIVE) HARDWARE IN TORQUE VECTORING MARKET, BY TYPE, 2020-2029 (USD MILLION)
TABLE 332 SWITZERLAND (LEFT HAND DRIVE) TORQUE VECTORING MARKET, BY TECHNOLOGY, 2020-2029 (USD MILLION)
TABLE 333 SWITZERLAND (LEFT HAND DRIVE) TORQUE VECTORING MARKET, BY CLUTCH ACTUATION TYPE, 2020-2029 (USD MILLION)
TABLE 334 SWITZERLAND (LEFT HAND DRIVE) TORQUE VECTORING MARKET, BY DRIVING WHEEL TYPE, 2020-2029 (USD MILLION)
TABLE 335 SWITZERLAND (LEFT HAND DRIVE) TORQUE VECTORING MARKET, BY VEHICLE TYPE, 2020-2029 (USD MILLION)
TABLE 336 SWITZERLAND (LEFT HAND DRIVE) PASSENGER CARS IN TORQUE VECTORING MARKET, BY TYPE, 2020-2029 (USD MILLION)
TABLE 337 SWITZERLAND (LEFT HAND DRIVE) PASSENGER CARS IN TORQUE VECTORING MARKET, BY TECHNOLOGY, 2020-2029 (USD MILLION)
TABLE 338 SWITZERLAND (LEFT HAND DRIVE) COMMERCIAL VEHICLE IN TORQUE VECTORING MARKET, BY TYPE, 2020-2029 (USD MILLION)
TABLE 339 SWITZERLAND (LEFT HAND DRIVE) HEAVY COMMERCIAL VEHICLE IN TORQUE VECTORING MARKET, BY TYPE, 2020-2029 (USD MILLION)
TABLE 340 SWITZERLAND (LEFT HAND DRIVE) COMMERCIAL VEHICLE IN TORQUE VECTORING MARKET, BY TECHNOLOGY, 2020-2029 (USD MILLION)
TABLE 341 SWITZERLAND (LEFT HAND DRIVE) OFF ROAD VEHICLE IN TORQUE VECTORING MARKET, BY TECHNOLOGY, 2020-2029 (USD MILLION)
TABLE 342 SWITZERLAND (LEFT HAND DRIVE) TORQUE VECTORING MARKET, BY PROPULSION TYPE, 2020-2029 (USD MILLION)
TABLE 343 SWITZERLAND (LEFT HAND DRIVE) ELECTRIC VEHICLE IN TORQUE VECTORING MARKET, BY TECHNOLOGY, 2020-2029 (USD MILLION)
TABLE 344 REST OF EUROPE TORQUE VECTORING MARKET, BY COMPONENT, 2020-2029 (USD MILLION)
TABLE 345 ASIA-PACIFIC TORQUE VECTORING MARKET, BY COUNTRY, 2020-2029 (USD MILLION)
TABLE 346 ASIA-PACIFIC (LEFT HAND DRIVE) TORQUE VECTORING MARKET, BY COUNTRY, 2020-2029 (USD MILLION)
TABLE 347 ASIA-PACIFIC (RIGHT HAND DRIVE) TORQUE VECTORING MARKET, BY COUNTRY, 2020-2029 (USD MILLION)
TABLE 348 ASIA-PACIFIC TORQUE VECTORING MARKET, BY COMPONENT, 2020-2029 (USD MILLION)
TABLE 349 ASIA-PACIFIC HARDWARE IN TORQUE VECTORING MARKET, BY TYPE, 2020-2029 (USD MILLION)
TABLE 350 ASIA-PACIFIC TORQUE VECTORING MARKET, BY TECHNOLOGY, 2020-2029 (USD MILLION)
TABLE 351 ASIA-PACIFIC TORQUE VECTORING MARKET, BY CLUTCH ACTUATION TYPE, 2020-2029 (USD MILLION)
TABLE 352 ASIA-PACIFIC TORQUE VECTORING MARKET, BY DRIVING WHEEL TYPE, 2020-2029 (USD MILLION)
TABLE 353 ASIA-PACIFIC TORQUE VECTORING MARKET, BY VEHICLE TYPE, 2020-2029 (USD MILLION)
TABLE 354 ASIA-PACIFIC PASSENGER CARS IN TORQUE VECTORING MARKET, BY TYPE, 2020-2029 (USD MILLION)
TABLE 355 ASIA-PACIFIC PASSENGER CARS IN TORQUE VECTORING MARKET, BY TECHNOLOGY, 2020-2029 (USD MILLION)
TABLE 356 ASIA-PACIFIC COMMERCIAL VEHICLE IN TORQUE VECTORING MARKET, BY TYPE, 2020-2029 (USD MILLION)
TABLE 357 ASIA-PACIFIC HEAVY COMMERCIAL VEHICLE IN TORQUE VECTORING MARKET, BY TYPE, 2020-2029 (USD MILLION)
TABLE 358 ASIA-PACIFIC COMMERCIAL VEHICLE IN TORQUE VECTORING MARKET, BY TECHNOLOGY, 2020-2029 (USD MILLION)
TABLE 359 ASIA-PACIFIC OFF ROAD VEHICLE IN TORQUE VECTORING MARKET, BY TECHNOLOGY, 2020-2029 (USD MILLION)
TABLE 360 ASIA-PACIFIC TORQUE VECTORING MARKET, BY PROPULSION TYPE, 2020-2029 (USD MILLION)
TABLE 361 ASIA-PACIFIC ELECTRIC VEHICLE IN TORQUE VECTORING MARKET, BY TECHNOLOGY, 2020-2029 (USD MILLION)
TABLE 362 CHINA (LEFT HAND DRIVE) TORQUE VECTORING MARKET, BY COMPONENT, 2020-2029 (USD MILLION)
TABLE 363 CHINA (LEFT HAND DRIVE) HARDWARE IN TORQUE VECTORING MARKET, BY TYPE, 2020-2029 (USD MILLION)
TABLE 364 CHINA (LEFT HAND DRIVE) TORQUE VECTORING MARKET, BY TECHNOLOGY, 2020-2029 (USD MILLION)
TABLE 365 CHINA (LEFT HAND DRIVE) TORQUE VECTORING MARKET, BY CLUTCH ACTUATION TYPE, 2020-2029 (USD MILLION)
TABLE 366 CHINA (LEFT HAND DRIVE) TORQUE VECTORING MARKET, BY DRIVING WHEEL TYPE, 2020-2029 (USD MILLION)
TABLE 367 CHINA (LEFT HAND DRIVE) TORQUE VECTORING MARKET, BY VEHICLE TYPE, 2020-2029 (USD MILLION)
TABLE 368 CHINA (LEFT HAND DRIVE) PASSENGER CARS IN TORQUE VECTORING MARKET, BY TYPE, 2020-2029 (USD MILLION)
TABLE 369 CHINA (LEFT HAND DRIVE) PASSENGER CARS IN TORQUE VECTORING MARKET, BY TECHNOLOGY, 2020-2029 (USD MILLION)
TABLE 370 CHINA (LEFT HAND DRIVE) COMMERCIAL VEHICLE IN TORQUE VECTORING MARKET, BY TYPE, 2020-2029 (USD MILLION)
TABLE 371 CHINA (LEFT HAND DRIVE) HEAVY COMMERCIAL VEHICLE IN TORQUE VECTORING MARKET, BY TYPE, 2020-2029 (USD MILLION)
TABLE 372 CHINA (LEFT HAND DRIVE) COMMERCIAL VEHICLE IN TORQUE VECTORING MARKET, BY TECHNOLOGY, 2020-2029 (USD MILLION)
TABLE 373 CHINA (LEFT HAND DRIVE) OFF ROAD VEHICLE IN TORQUE VECTORING MARKET, BY TECHNOLOGY, 2020-2029 (USD MILLION)
TABLE 374 CHINA (LEFT HAND DRIVE) TORQUE VECTORING MARKET, BY PROPULSION TYPE, 2020-2029 (USD MILLION)
TABLE 375 CHINA (LEFT HAND DRIVE) ELECTRIC VEHICLE IN TORQUE VECTORING MARKET, BY TECHNOLOGY, 2020-2029 (USD MILLION)
TABLE 376 JAPAN (RIGHT HAND DRIVE) TORQUE VECTORING MARKET, BY COMPONENT, 2020-2029 (USD MILLION)
TABLE 377 JAPAN (RIGHT HAND DRIVE) HARDWARE IN TORQUE VECTORING MARKET, BY TYPE, 2020-2029 (USD MILLION)
TABLE 378 JAPAN (RIGHT HAND DRIVE) TORQUE VECTORING MARKET, BY TECHNOLOGY, 2020-2029 (USD MILLION)
TABLE 379 JAPAN (RIGHT HAND DRIVE) TORQUE VECTORING MARKET, BY CLUTCH ACTUATION TYPE, 2020-2029 (USD MILLION)
TABLE 380 JAPAN (RIGHT HAND DRIVE) TORQUE VECTORING MARKET, BY DRIVING WHEEL TYPE, 2020-2029 (USD MILLION)
TABLE 381 JAPAN (RIGHT HAND DRIVE) TORQUE VECTORING MARKET, BY VEHICLE TYPE, 2020-2029 (USD MILLION)
TABLE 382 JAPAN (RIGHT HAND DRIVE) PASSENGER CARS IN TORQUE VECTORING MARKET, BY TYPE, 2020-2029 (USD MILLION)
TABLE 383 JAPAN (RIGHT HAND DRIVE) PASSENGER CARS IN TORQUE VECTORING MARKET, BY TECHNOLOGY, 2020-2029 (USD MILLION)
TABLE 384 JAPAN (RIGHT HAND DRIVE) COMMERCIAL VEHICLE IN TORQUE VECTORING MARKET, BY TYPE, 2020-2029 (USD MILLION)
TABLE 385 JAPAN (RIGHT HAND DRIVE) HEAVY COMMERCIAL VEHICLE IN TORQUE VECTORING MARKET, BY TYPE, 2020-2029 (USD MILLION)
TABLE 386 JAPAN (RIGHT HAND DRIVE) COMMERCIAL VEHICLE IN TORQUE VECTORING MARKET, BY TECHNOLOGY, 2020-2029 (USD MILLION)
TABLE 387 JAPAN (RIGHT HAND DRIVE) OFF ROAD VEHICLE IN TORQUE VECTORING MARKET, BY TECHNOLOGY, 2020-2029 (USD MILLION)
TABLE 388 JAPAN (RIGHT HAND DRIVE) TORQUE VECTORING MARKET, BY PROPULSION TYPE, 2020-2029 (USD MILLION)
TABLE 389 JAPAN (RIGHT HAND DRIVE) ELECTRIC VEHICLE IN TORQUE VECTORING MARKET, BY TECHNOLOGY, 2020-2029 (USD MILLION)
TABLE 390 SOUTH KOREA (LEFT HAND DRIVE) TORQUE VECTORING MARKET, BY COMPONENT, 2020-2029 (USD MILLION)
TABLE 391 SOUTH KOREA (LEFT HAND DRIVE) HARDWARE IN TORQUE VECTORING MARKET, BY TYPE, 2020-2029 (USD MILLION)
TABLE 392 SOUTH KOREA (LEFT HAND DRIVE) TORQUE VECTORING MARKET, BY TECHNOLOGY, 2020-2029 (USD MILLION)
TABLE 393 SOUTH KOREA (LEFT HAND DRIVE) TORQUE VECTORING MARKET, BY CLUTCH ACTUATION TYPE, 2020-2029 (USD MILLION)
TABLE 394 SOUTH KOREA (LEFT HAND DRIVE) TORQUE VECTORING MARKET, BY DRIVING WHEEL TYPE, 2020-2029 (USD MILLION)
TABLE 395 SOUTH KOREA (LEFT HAND DRIVE) TORQUE VECTORING MARKET, BY VEHICLE TYPE, 2020-2029 (USD MILLION)
TABLE 396 SOUTH KOREA (LEFT HAND DRIVE) PASSENGER CARS IN TORQUE VECTORING MARKET, BY TYPE, 2020-2029 (USD MILLION)
TABLE 397 SOUTH KOREA (LEFT HAND DRIVE) PASSENGER CARS IN TORQUE VECTORING MARKET, BY TECHNOLOGY, 2020-2029 (USD MILLION)
TABLE 398 SOUTH KOREA (LEFT HAND DRIVE) COMMERCIAL VEHICLE IN TORQUE VECTORING MARKET, BY TYPE, 2020-2029 (USD MILLION)
TABLE 399 SOUTH KOREA (LEFT HAND DRIVE) HEAVY COMMERCIAL VEHICLE IN TORQUE VECTORING MARKET, BY TYPE, 2020-2029 (USD MILLION)
TABLE 400 SOUTH KOREA (LEFT HAND DRIVE) COMMERCIAL VEHICLE IN TORQUE VECTORING MARKET, BY TECHNOLOGY, 2020-2029 (USD MILLION)
TABLE 401 SOUTH KOREA (LEFT HAND DRIVE) OFF ROAD VEHICLE IN TORQUE VECTORING MARKET, BY TECHNOLOGY, 2020-2029 (USD MILLION)
TABLE 402 SOUTH KOREA (LEFT HAND DRIVE) TORQUE VECTORING MARKET, BY PROPULSION TYPE, 2020-2029 (USD MILLION)
TABLE 403 SOUTH KOREA (LEFT HAND DRIVE) ELECTRIC VEHICLE IN TORQUE VECTORING MARKET, BY TECHNOLOGY, 2020-2029 (USD MILLION)
TABLE 404 AUSTRALIA AND NEW ZEALAND (RIGHT HAND DRIVE) TORQUE VECTORING MARKET, BY COMPONENT, 2020-2029 (USD MILLION)
TABLE 405 AUSTRALIA AND NEW ZEALAND (RIGHT HAND DRIVE) HARDWARE IN TORQUE VECTORING MARKET, BY TYPE, 2020-2029 (USD MILLION)
TABLE 406 AUSTRALIA AND NEW ZEALAND (RIGHT HAND DRIVE) TORQUE VECTORING MARKET, BY TECHNOLOGY, 2020-2029 (USD MILLION)
TABLE 407 AUSTRALIA AND NEW ZEALAND (RIGHT HAND DRIVE) TORQUE VECTORING MARKET, BY CLUTCH ACTUATION TYPE, 2020-2029 (USD MILLION)
TABLE 408 AUSTRALIA AND NEW ZEALAND (RIGHT HAND DRIVE) TORQUE VECTORING MARKET, BY DRIVING WHEEL TYPE, 2020-2029 (USD MILLION)
TABLE 409 AUSTRALIA AND NEW ZEALAND (RIGHT HAND DRIVE) TORQUE VECTORING MARKET, BY VEHICLE TYPE, 2020-2029 (USD MILLION)
TABLE 410 AUSTRALIA AND NEW ZEALAND (RIGHT HAND DRIVE) PASSENGER CARS IN TORQUE VECTORING MARKET, BY TYPE, 2020-2029 (USD MILLION)
TABLE 411 AUSTRALIA AND NEW ZEALAND (RIGHT HAND DRIVE) PASSENGER CARS IN TORQUE VECTORING MARKET, BY TECHNOLOGY, 2020-2029 (USD MILLION)
TABLE 412 AUSTRALIA AND NEW ZEALAND (RIGHT HAND DRIVE) COMMERCIAL VEHICLE IN TORQUE VECTORING MARKET, BY TYPE, 2020-2029 (USD MILLION)
TABLE 413 AUSTRALIA AND NEW ZEALAND (RIGHT HAND DRIVE) HEAVY COMMERCIAL VEHICLE IN TORQUE VECTORING MARKET, BY TYPE, 2020-2029 (USD MILLION)
TABLE 414 AUSTRALIA AND NEW ZEALAND (RIGHT HAND DRIVE) COMMERCIAL VEHICLE IN TORQUE VECTORING MARKET, BY TECHNOLOGY, 2020-2029 (USD MILLION)
TABLE 415 AUSTRALIA AND NEW ZEALAND (RIGHT HAND DRIVE) OFF ROAD VEHICLE IN TORQUE VECTORING MARKET, BY TECHNOLOGY, 2020-2029 (USD MILLION)
TABLE 416 AUSTRALIA AND NEW ZEALAND (RIGHT HAND DRIVE) TORQUE VECTORING MARKET, BY PROPULSION TYPE, 2020-2029 (USD MILLION)
TABLE 417 AUSTRALIA AND NEW ZEALAND (RIGHT HAND DRIVE) ELECTRIC VEHICLE IN TORQUE VECTORING MARKET, BY TECHNOLOGY, 2020-2029 (USD MILLION)
TABLE 418 INDIA (RIGHT HAND DRIVE) TORQUE VECTORING MARKET, BY COMPONENT, 2020-2029 (USD MILLION)
TABLE 419 INDIA (RIGHT HAND DRIVE) HARDWARE IN TORQUE VECTORING MARKET, BY TYPE, 2020-2029 (USD MILLION)
TABLE 420 INDIA (RIGHT HAND DRIVE) TORQUE VECTORING MARKET, BY TECHNOLOGY, 2020-2029 (USD MILLION)
TABLE 421 INDIA (RIGHT HAND DRIVE) TORQUE VECTORING MARKET, BY CLUTCH ACTUATION TYPE, 2020-2029 (USD MILLION)
TABLE 422 INDIA (RIGHT HAND DRIVE) TORQUE VECTORING MARKET, BY DRIVING WHEEL TYPE, 2020-2029 (USD MILLION)
TABLE 423 INDIA (RIGHT HAND DRIVE) TORQUE VECTORING MARKET, BY VEHICLE TYPE, 2020-2029 (USD MILLION)
TABLE 424 INDIA (RIGHT HAND DRIVE) PASSENGER CARS IN TORQUE VECTORING MARKET, BY TYPE, 2020-2029 (USD MILLION)
TABLE 425 INDIA (RIGHT HAND DRIVE) PASSENGER CARS IN TORQUE VECTORING MARKET, BY TECHNOLOGY, 2020-2029 (USD MILLION)
TABLE 426 INDIA (RIGHT HAND DRIVE) COMMERCIAL VEHICLE IN TORQUE VECTORING MARKET, BY TYPE, 2020-2029 (USD MILLION)
TABLE 427 INDIA (RIGHT HAND DRIVE) HEAVY COMMERCIAL VEHICLE IN TORQUE VECTORING MARKET, BY TYPE, 2020-2029 (USD MILLION)
TABLE 428 INDIA (RIGHT HAND DRIVE) COMMERCIAL VEHICLE IN TORQUE VECTORING MARKET, BY TECHNOLOGY, 2020-2029 (USD MILLION)
TABLE 429 INDIA (RIGHT HAND DRIVE) OFF ROAD VEHICLE IN TORQUE VECTORING MARKET, BY TECHNOLOGY, 2020-2029 (USD MILLION)
TABLE 430 INDIA (RIGHT HAND DRIVE) TORQUE VECTORING MARKET, BY PROPULSION TYPE, 2020-2029 (USD MILLION)
TABLE 431 INDIA (RIGHT HAND DRIVE) ELECTRIC VEHICLE IN TORQUE VECTORING MARKET, BY TECHNOLOGY, 2020-2029 (USD MILLION)
TABLE 432 SINGAPORE (RIGHT HAND DRIVE) TORQUE VECTORING MARKET, BY COMPONENT, 2020-2029 (USD MILLION)
TABLE 433 SINGAPORE (RIGHT HAND DRIVE) HARDWARE IN TORQUE VECTORING MARKET, BY TYPE, 2020-2029 (USD MILLION)
TABLE 434 SINGAPORE (RIGHT HAND DRIVE) TORQUE VECTORING MARKET, BY TECHNOLOGY, 2020-2029 (USD MILLION)
TABLE 435 SINGAPORE (RIGHT HAND DRIVE) TORQUE VECTORING MARKET, BY CLUTCH ACTUATION TYPE, 2020-2029 (USD MILLION)
TABLE 436 SINGAPORE (RIGHT HAND DRIVE) TORQUE VECTORING MARKET, BY DRIVING WHEEL TYPE, 2020-2029 (USD MILLION)
TABLE 437 SINGAPORE (RIGHT HAND DRIVE) TORQUE VECTORING MARKET, BY VEHICLE TYPE, 2020-2029 (USD MILLION)
TABLE 438 SINGAPORE (RIGHT HAND DRIVE) PASSENGER CARS IN TORQUE VECTORING MARKET, BY TYPE, 2020-2029 (USD MILLION)
TABLE 439 SINGAPORE (RIGHT HAND DRIVE) PASSENGER CARS IN TORQUE VECTORING MARKET, BY TECHNOLOGY, 2020-2029 (USD MILLION)
TABLE 440 SINGAPORE (RIGHT HAND DRIVE) COMMERCIAL VEHICLE IN TORQUE VECTORING MARKET, BY TYPE, 2020-2029 (USD MILLION)
TABLE 441 SINGAPORE (RIGHT HAND DRIVE) HEAVY COMMERCIAL VEHICLE IN TORQUE VECTORING MARKET, BY TYPE, 2020-2029 (USD MILLION)
TABLE 442 SINGAPORE (RIGHT HAND DRIVE) COMMERCIAL VEHICLE IN TORQUE VECTORING MARKET, BY TECHNOLOGY, 2020-2029 (USD MILLION)
TABLE 443 SINGAPORE (RIGHT HAND DRIVE) OFF ROAD VEHICLE IN TORQUE VECTORING MARKET, BY TECHNOLOGY, 2020-2029 (USD MILLION)
TABLE 444 SINGAPORE (RIGHT HAND DRIVE) TORQUE VECTORING MARKET, BY PROPULSION TYPE, 2020-2029 (USD MILLION)
TABLE 445 SINGAPORE (RIGHT HAND DRIVE) ELECTRIC VEHICLE IN TORQUE VECTORING MARKET, BY TECHNOLOGY, 2020-2029 (USD MILLION)
TABLE 446 MALAYSIA (RIGHT HAND DRIVE) TORQUE VECTORING MARKET, BY COMPONENT, 2020-2029 (USD MILLION)
TABLE 447 MALAYSIA (RIGHT HAND DRIVE) HARDWARE IN TORQUE VECTORING MARKET, BY TYPE, 2020-2029 (USD MILLION)
TABLE 448 MALAYSIA (RIGHT HAND DRIVE) TORQUE VECTORING MARKET, BY TECHNOLOGY, 2020-2029 (USD MILLION)
TABLE 449 MALAYSIA (RIGHT HAND DRIVE) TORQUE VECTORING MARKET, BY CLUTCH ACTUATION TYPE, 2020-2029 (USD MILLION)
TABLE 450 MALAYSIA (RIGHT HAND DRIVE) TORQUE VECTORING MARKET, BY DRIVING WHEEL TYPE, 2020-2029 (USD MILLION)
TABLE 451 MALAYSIA (RIGHT HAND DRIVE) TORQUE VECTORING MARKET, BY VEHICLE TYPE, 2020-2029 (USD MILLION)
TABLE 452 MALAYSIA (RIGHT HAND DRIVE) PASSENGER CARS IN TORQUE VECTORING MARKET, BY TYPE, 2020-2029 (USD MILLION)
TABLE 453 MALAYSIA (RIGHT HAND DRIVE) PASSENGER CARS IN TORQUE VECTORING MARKET, BY TECHNOLOGY, 2020-2029 (USD MILLION)
TABLE 454 MALAYSIA (RIGHT HAND DRIVE) COMMERCIAL VEHICLE IN TORQUE VECTORING MARKET, BY TYPE, 2020-2029 (USD MILLION)
TABLE 455 MALAYSIA (RIGHT HAND DRIVE) HEAVY COMMERCIAL VEHICLE IN TORQUE VECTORING MARKET, BY TYPE, 2020-2029 (USD MILLION)
TABLE 456 MALAYSIA (RIGHT HAND DRIVE) COMMERCIAL VEHICLE IN TORQUE VECTORING MARKET, BY TECHNOLOGY, 2020-2029 (USD MILLION)
TABLE 457 MALAYSIA (RIGHT HAND DRIVE) OFF ROAD VEHICLE IN TORQUE VECTORING MARKET, BY TECHNOLOGY, 2020-2029 (USD MILLION)
TABLE 458 MALAYSIA (RIGHT HAND DRIVE) TORQUE VECTORING MARKET, BY PROPULSION TYPE, 2020-2029 (USD MILLION)
TABLE 459 MALAYSIA (RIGHT HAND DRIVE) ELECTRIC VEHICLE IN TORQUE VECTORING MARKET, BY TECHNOLOGY, 2020-2029 (USD MILLION)
TABLE 460 THAILAND (RIGHT HAND DRIVE) TORQUE VECTORING MARKET, BY COMPONENT, 2020-2029 (USD MILLION)
TABLE 461 THAILAND (RIGHT HAND DRIVE) HARDWARE IN TORQUE VECTORING MARKET, BY TYPE, 2020-2029 (USD MILLION)
TABLE 462 THAILAND (RIGHT HAND DRIVE) TORQUE VECTORING MARKET, BY TECHNOLOGY, 2020-2029 (USD MILLION)
TABLE 463 THAILAND (RIGHT HAND DRIVE) TORQUE VECTORING MARKET, BY CLUTCH ACTUATION TYPE, 2020-2029 (USD MILLION)
TABLE 464 THAILAND (RIGHT HAND DRIVE) TORQUE VECTORING MARKET, BY DRIVING WHEEL TYPE, 2020-2029 (USD MILLION)
TABLE 465 THAILAND (RIGHT HAND DRIVE) TORQUE VECTORING MARKET, BY VEHICLE TYPE, 2020-2029 (USD MILLION)
TABLE 466 THAILAND (RIGHT HAND DRIVE) PASSENGER CARS IN TORQUE VECTORING MARKET, BY TYPE, 2020-2029 (USD MILLION)
TABLE 467 THAILAND (RIGHT HAND DRIVE) PASSENGER CARS IN TORQUE VECTORING MARKET, BY TECHNOLOGY, 2020-2029 (USD MILLION)
TABLE 468 THAILAND (RIGHT HAND DRIVE) COMMERCIAL VEHICLE IN TORQUE VECTORING MARKET, BY TYPE, 2020-2029 (USD MILLION)
TABLE 469 THAILAND (RIGHT HAND DRIVE) HEAVY COMMERCIAL VEHICLE IN TORQUE VECTORING MARKET, BY TYPE, 2020-2029 (USD MILLION)
TABLE 470 THAILAND (RIGHT HAND DRIVE) COMMERCIAL VEHICLE IN TORQUE VECTORING MARKET, BY TECHNOLOGY, 2020-2029 (USD MILLION)
TABLE 471 THAILAND (RIGHT HAND DRIVE) OFF ROAD VEHICLE IN TORQUE VECTORING MARKET, BY TECHNOLOGY, 2020-2029 (USD MILLION)
TABLE 472 THAILAND (RIGHT HAND DRIVE) TORQUE VECTORING MARKET, BY PROPULSION TYPE, 2020-2029 (USD MILLION)
TABLE 473 THAILAND (RIGHT HAND DRIVE) ELECTRIC VEHICLE IN TORQUE VECTORING MARKET, BY TECHNOLOGY, 2020-2029 (USD MILLION)
TABLE 474 INDONESIA (RIGHT HAND DRIVE) TORQUE VECTORING MARKET, BY COMPONENT, 2020-2029 (USD MILLION)
TABLE 475 INDONESIA (RIGHT HAND DRIVE) HARDWARE IN TORQUE VECTORING MARKET, BY TYPE, 2020-2029 (USD MILLION)
TABLE 476 INDONESIA (RIGHT HAND DRIVE) TORQUE VECTORING MARKET, BY TECHNOLOGY, 2020-2029 (USD MILLION)
TABLE 477 INDONESIA (RIGHT HAND DRIVE) TORQUE VECTORING MARKET, BY CLUTCH ACTUATION TYPE, 2020-2029 (USD MILLION)
TABLE 478 INDONESIA (RIGHT HAND DRIVE) TORQUE VECTORING MARKET, BY DRIVING WHEEL TYPE, 2020-2029 (USD MILLION)
TABLE 479 INDONESIA (RIGHT HAND DRIVE) TORQUE VECTORING MARKET, BY VEHICLE TYPE, 2020-2029 (USD MILLION)
TABLE 480 INDONESIA (RIGHT HAND DRIVE) PASSENGER CARS IN TORQUE VECTORING MARKET, BY TYPE, 2020-2029 (USD MILLION)
TABLE 481 INDONESIA (RIGHT HAND DRIVE) PASSENGER CARS IN TORQUE VECTORING MARKET, BY TECHNOLOGY, 2020-2029 (USD MILLION)
TABLE 482 INDONESIA (RIGHT HAND DRIVE) COMMERCIAL VEHICLE IN TORQUE VECTORING MARKET, BY TYPE, 2020-2029 (USD MILLION)
TABLE 483 INDONESIA (RIGHT HAND DRIVE) HEAVY COMMERCIAL VEHICLE IN TORQUE VECTORING MARKET, BY TYPE, 2020-2029 (USD MILLION)
TABLE 484 INDONESIA (RIGHT HAND DRIVE) COMMERCIAL VEHICLE IN TORQUE VECTORING MARKET, BY TECHNOLOGY, 2020-2029 (USD MILLION)
TABLE 485 INDONESIA (RIGHT HAND DRIVE) OFF ROAD VEHICLE IN TORQUE VECTORING MARKET, BY TECHNOLOGY, 2020-2029 (USD MILLION)
TABLE 486 INDONESIA (RIGHT HAND DRIVE) TORQUE VECTORING MARKET, BY PROPULSION TYPE, 2020-2029 (USD MILLION)
TABLE 487 INDONESIA (RIGHT HAND DRIVE) ELECTRIC VEHICLE IN TORQUE VECTORING MARKET, BY TECHNOLOGY, 2020-2029 (USD MILLION)
TABLE 488 TAIWAN (LEFT HAND DRIVE) TORQUE VECTORING MARKET, BY COMPONENT, 2020-2029 (USD MILLION)
TABLE 489 TAIWAN (LEFT HAND DRIVE) HARDWARE IN TORQUE VECTORING MARKET, BY TYPE, 2020-2029 (USD MILLION)
TABLE 490 TAIWAN (LEFT HAND DRIVE) TORQUE VECTORING MARKET, BY TECHNOLOGY, 2020-2029 (USD MILLION)
TABLE 491 TAIWAN (LEFT HAND DRIVE) TORQUE VECTORING MARKET, BY CLUTCH ACTUATION TYPE, 2020-2029 (USD MILLION)
TABLE 492 TAIWAN (LEFT HAND DRIVE) TORQUE VECTORING MARKET, BY DRIVING WHEEL TYPE, 2020-2029 (USD MILLION)
TABLE 493 TAIWAN (LEFT HAND DRIVE) TORQUE VECTORING MARKET, BY VEHICLE TYPE, 2020-2029 (USD MILLION)
TABLE 494 TAIWAN (LEFT HAND DRIVE) PASSENGER CARS IN TORQUE VECTORING MARKET, BY TYPE, 2020-2029 (USD MILLION)
TABLE 495 TAIWAN (LEFT HAND DRIVE) PASSENGER CARS IN TORQUE VECTORING MARKET, BY TECHNOLOGY, 2020-2029 (USD MILLION)
TABLE 496 TAIWAN (LEFT HAND DRIVE) COMMERCIAL VEHICLE IN TORQUE VECTORING MARKET, BY TYPE, 2020-2029 (USD MILLION)
TABLE 497 TAIWAN (LEFT HAND DRIVE) HEAVY COMMERCIAL VEHICLE IN TORQUE VECTORING MARKET, BY TYPE, 2020-2029 (USD MILLION)
TABLE 498 TAIWAN (LEFT HAND DRIVE) COMMERCIAL VEHICLE IN TORQUE VECTORING MARKET, BY TECHNOLOGY, 2020-2029 (USD MILLION)
TABLE 499 TAIWAN (LEFT HAND DRIVE) OFF ROAD VEHICLE IN TORQUE VECTORING MARKET, BY TECHNOLOGY, 2020-2029 (USD MILLION)
TABLE 500 TAIWAN (LEFT HAND DRIVE) TORQUE VECTORING MARKET, BY PROPULSION TYPE, 2020-2029 (USD MILLION)
TABLE 501 TAIWAN (LEFT HAND DRIVE) ELECTRIC VEHICLE IN TORQUE VECTORING MARKET, BY TECHNOLOGY, 2020-2029 (USD MILLION)
TABLE 502 VIETNAM (LEFT HAND DRIVE) TORQUE VECTORING MARKET, BY COMPONENT, 2020-2029 (USD MILLION)
TABLE 503 VIETNAM (LEFT HAND DRIVE) HARDWARE IN TORQUE VECTORING MARKET, BY TYPE, 2020-2029 (USD MILLION)
TABLE 504 VIETNAM (LEFT HAND DRIVE) TORQUE VECTORING MARKET, BY TECHNOLOGY, 2020-2029 (USD MILLION)
TABLE 505 VIETNAM (LEFT HAND DRIVE) TORQUE VECTORING MARKET, BY CLUTCH ACTUATION TYPE, 2020-2029 (USD MILLION)
TABLE 506 VIETNAM (LEFT HAND DRIVE) TORQUE VECTORING MARKET, BY DRIVING WHEEL TYPE, 2020-2029 (USD MILLION)
TABLE 507 VIETNAM (LEFT HAND DRIVE) TORQUE VECTORING MARKET, BY VEHICLE TYPE, 2020-2029 (USD MILLION)
TABLE 508 VIETNAM (LEFT HAND DRIVE) PASSENGER CARS IN TORQUE VECTORING MARKET, BY TYPE, 2020-2029 (USD MILLION)
TABLE 509 VIETNAM (LEFT HAND DRIVE) PASSENGER CARS IN TORQUE VECTORING MARKET, BY TECHNOLOGY, 2020-2029 (USD MILLION)
TABLE 510 VIETNAM (LEFT HAND DRIVE) COMMERCIAL VEHICLE IN TORQUE VECTORING MARKET, BY TYPE, 2020-2029 (USD MILLION)
TABLE 511 VIETNAM (LEFT HAND DRIVE) HEAVY COMMERCIAL VEHICLE IN TORQUE VECTORING MARKET, BY TYPE, 2020-2029 (USD MILLION)
TABLE 512 VIETNAM (LEFT HAND DRIVE) COMMERCIAL VEHICLE IN TORQUE VECTORING MARKET, BY TECHNOLOGY, 2020-2029 (USD MILLION)
TABLE 513 VIETNAM (LEFT HAND DRIVE) OFF ROAD VEHICLE IN TORQUE VECTORING MARKET, BY TECHNOLOGY, 2020-2029 (USD MILLION)
TABLE 514 VIETNAM (LEFT HAND DRIVE) TORQUE VECTORING MARKET, BY PROPULSION TYPE, 2020-2029 (USD MILLION)
TABLE 515 VIETNAM (LEFT HAND DRIVE) ELECTRIC VEHICLE IN TORQUE VECTORING MARKET, BY TECHNOLOGY, 2020-2029 (USD MILLION)
TABLE 516 PHILIPPINES (LEFT HAND DRIVE) TORQUE VECTORING MARKET, BY COMPONENT, 2020-2029 (USD MILLION)
TABLE 517 PHILIPPINES (LEFT HAND DRIVE) HARDWARE IN TORQUE VECTORING MARKET, BY TYPE, 2020-2029 (USD MILLION)
TABLE 518 PHILIPPINES (LEFT HAND DRIVE) TORQUE VECTORING MARKET, BY TECHNOLOGY, 2020-2029 (USD MILLION)
TABLE 519 PHILIPPINES (LEFT HAND DRIVE) TORQUE VECTORING MARKET, BY CLUTCH ACTUATION TYPE, 2020-2029 (USD MILLION)
TABLE 520 PHILIPPINES (LEFT HAND DRIVE) TORQUE VECTORING MARKET, BY DRIVING WHEEL TYPE, 2020-2029 (USD MILLION)
TABLE 521 PHILIPPINES (LEFT HAND DRIVE) TORQUE VECTORING MARKET, BY VEHICLE TYPE, 2020-2029 (USD MILLION)
TABLE 522 PHILIPPINES (LEFT HAND DRIVE) PASSENGER CARS IN TORQUE VECTORING MARKET, BY TYPE, 2020-2029 (USD MILLION)
TABLE 523 PHILIPPINES (LEFT HAND DRIVE) PASSENGER CARS IN TORQUE VECTORING MARKET, BY TECHNOLOGY, 2020-2029 (USD MILLION)
TABLE 524 PHILIPPINES (LEFT HAND DRIVE) COMMERCIAL VEHICLE IN TORQUE VECTORING MARKET, BY TYPE, 2020-2029 (USD MILLION)
TABLE 525 PHILIPPINES (LEFT HAND DRIVE) HEAVY COMMERCIAL VEHICLE IN TORQUE VECTORING MARKET, BY TYPE, 2020-2029 (USD MILLION)
TABLE 526 PHILIPPINES (LEFT HAND DRIVE) COMMERCIAL VEHICLE IN TORQUE VECTORING MARKET, BY TECHNOLOGY, 2020-2029 (USD MILLION)
TABLE 527 PHILIPPINES (LEFT HAND DRIVE) OFF ROAD VEHICLE IN TORQUE VECTORING MARKET, BY TECHNOLOGY, 2020-2029 (USD MILLION)
TABLE 528 PHILIPPINES (LEFT HAND DRIVE) TORQUE VECTORING MARKET, BY PROPULSION TYPE, 2020-2029 (USD MILLION)
TABLE 529 PHILIPPINES (LEFT HAND DRIVE) ELECTRIC VEHICLE IN TORQUE VECTORING MARKET, BY TECHNOLOGY, 2020-2029 (USD MILLION)
TABLE 530 REST OF ASIA-PACIFIC TORQUE VECTORING MARKET, BY COMPONENT, 2020-2029 (USD MILLION)
TABLE 531 SOUTH AMERICA TORQUE VECTORING MARKET, BY COUNTRY, 2020-2029 (USD MILLION)
TABLE 532 SOUTH AMERICA TORQUE VECTORING MARKET, BY COMPONENT, 2020-2029 (USD MILLION)
TABLE 533 SOUTH AMERICA HARDWARE IN TORQUE VECTORING MARKET, BY TYPE, 2020-2029 (USD MILLION)
TABLE 534 SOUTH AMERICA TORQUE VECTORING MARKET, BY TECHNOLOGY, 2020-2029 (USD MILLION)
TABLE 535 SOUTH AMERICA TORQUE VECTORING MARKET, BY CLUTCH ACTUATION TYPE, 2020-2029 (USD MILLION)
TABLE 536 SOUTH AMERICA TORQUE VECTORING MARKET, BY DRIVING WHEEL TYPE, 2020-2029 (USD MILLION)
TABLE 537 SOUTH AMERICA TORQUE VECTORING MARKET, BY VEHICLE TYPE, 2020-2029 (USD MILLION)
TABLE 538 SOUTH AMERICA PASSENGER CARS IN TORQUE VECTORING MARKET, BY TYPE, 2020-2029 (USD MILLION)
TABLE 539 SOUTH AMERICA PASSENGER CARS IN TORQUE VECTORING MARKET, BY TECHNOLOGY, 2020-2029 (USD MILLION)
TABLE 540 SOUTH AMERICA COMMERCIAL VEHICLE IN TORQUE VECTORING MARKET, BY TYPE, 2020-2029 (USD MILLION)
TABLE 541 SOUTH AMERICA HEAVY COMMERCIAL VEHICLE IN TORQUE VECTORING MARKET, BY TYPE, 2020-2029 (USD MILLION)
TABLE 542 SOUTH AMERICA COMMERCIAL VEHICLE IN TORQUE VECTORING MARKET, BY TECHNOLOGY, 2020-2029 (USD MILLION)
TABLE 543 SOUTH AMERICA OFF ROAD VEHICLE IN TORQUE VECTORING MARKET, BY TECHNOLOGY, 2020-2029 (USD MILLION)
TABLE 544 SOUTH AMERICA TORQUE VECTORING MARKET, BY PROPULSION TYPE, 2020-2029 (USD MILLION)
TABLE 545 SOUTH AMERICA ELECTRIC VEHICLE IN TORQUE VECTORING MARKET, BY TYPE, 2020-2029 (USD MILLION)
TABLE 546 BRAZIL (LEFT HAND DRIVE) TORQUE VECTORING MARKET, BY COMPONENT, 2020-2029 (USD MILLION)
TABLE 547 BRAZIL (LEFT HAND DRIVE) HARDWARE IN TORQUE VECTORING MARKET, BY TYPE, 2020-2029 (USD MILLION)
TABLE 548 BRAZIL (LEFT HAND DRIVE) TORQUE VECTORING MARKET, BY TECHNOLOGY, 2020-2029 (USD MILLION)
TABLE 549 BRAZIL (LEFT HAND DRIVE) TORQUE VECTORING MARKET, BY CLUTCH ACTUATION TYPE, 2020-2029 (USD MILLION)
TABLE 550 BRAZIL (LEFT HAND DRIVE) TORQUE VECTORING MARKET, BY DRIVING WHEEL TYPE, 2020-2029 (USD MILLION)
TABLE 551 BRAZIL (LEFT HAND DRIVE) TORQUE VECTORING MARKET, BY VEHICLE TYPE, 2020-2029 (USD MILLION)
TABLE 552 BRAZIL (LEFT HAND DRIVE) PASSENGER CARS IN TORQUE VECTORING MARKET, BY TYPE, 2020-2029 (USD MILLION)
TABLE 553 BRAZIL (LEFT HAND DRIVE) PASSENGER CARS IN TORQUE VECTORING MARKET, BY TECHNOLOGY, 2020-2029 (USD MILLION)
TABLE 554 BRAZIL (LEFT HAND DRIVE) COMMERCIAL VEHICLE IN TORQUE VECTORING MARKET, BY TYPE, 2020-2029 (USD MILLION)
TABLE 555 BRAZIL (LEFT HAND DRIVE) HEAVY COMMERCIAL VEHICLE IN TORQUE VECTORING MARKET, BY TYPE, 2020-2029 (USD MILLION)
TABLE 556 BRAZIL (LEFT HAND DRIVE) COMMERCIAL VEHICLE IN TORQUE VECTORING MARKET, BY TECHNOLOGY, 2020-2029 (USD MILLION)
TABLE 557 BRAZIL (LEFT HAND DRIVE) OFF ROAD VEHICLE IN TORQUE VECTORING MARKET, BY TECHNOLOGY, 2020-2029 (USD MILLION)
TABLE 558 BRAZIL (LEFT HAND DRIVE) TORQUE VECTORING MARKET, BY PROPULSION TYPE, 2020-2029 (USD MILLION)
TABLE 559 BRAZIL (LEFT HAND DRIVE) ELECTRIC VEHICLE IN TORQUE VECTORING MARKET, BY TYPE, 2020-2029 (USD MILLION)
TABLE 560 ARGENTINA (LEFT HAND DRIVE) TORQUE VECTORING MARKET, BY COMPONENT, 2020-2029 (USD MILLION)
TABLE 561 ARGENTINA (LEFT HAND DRIVE) HARDWARE IN TORQUE VECTORING MARKET, BY TYPE, 2020-2029 (USD MILLION)
TABLE 562 ARGENTINA (LEFT HAND DRIVE) TORQUE VECTORING MARKET, BY TECHNOLOGY, 2020-2029 (USD MILLION)
TABLE 563 ARGENTINA (LEFT HAND DRIVE) TORQUE VECTORING MARKET, BY CLUTCH ACTUATION TYPE, 2020-2029 (USD MILLION)
TABLE 564 ARGENTINA (LEFT HAND DRIVE) TORQUE VECTORING MARKET, BY DRIVING WHEEL TYPE, 2020-2029 (USD MILLION)
TABLE 565 ARGENTINA (LEFT HAND DRIVE) TORQUE VECTORING MARKET, BY VEHICLE TYPE, 2020-2029 (USD MILLION)
TABLE 566 ARGENTINA (LEFT HAND DRIVE) PASSENGER CARS IN TORQUE VECTORING MARKET, BY TYPE, 2020-2029 (USD MILLION)
TABLE 567 ARGENTINA (LEFT HAND DRIVE) PASSENGER CARS IN TORQUE VECTORING MARKET, BY TECHNOLOGY, 2020-2029 (USD MILLION)
TABLE 568 ARGENTINA (LEFT HAND DRIVE) COMMERCIAL VEHICLE IN TORQUE VECTORING MARKET, BY TYPE, 2020-2029 (USD MILLION)
TABLE 569 ARGENTINA (LEFT HAND DRIVE) HEAVY COMMERCIAL VEHICLE IN TORQUE VECTORING MARKET, BY TYPE, 2020-2029 (USD MILLION)
TABLE 570 ARGENTINA (LEFT HAND DRIVE) COMMERCIAL VEHICLE IN TORQUE VECTORING MARKET, BY TECHNOLOGY, 2020-2029 (USD MILLION)
TABLE 571 ARGENTINA (LEFT HAND DRIVE) OFF ROAD VEHICLE IN TORQUE VECTORING MARKET, BY TECHNOLOGY, 2020-2029 (USD MILLION)
TABLE 572 ARGENTINA (LEFT HAND DRIVE) TORQUE VECTORING MARKET, BY PROPULSION TYPE, 2020-2029 (USD MILLION)
TABLE 573 ARGENTINA (LEFT HAND DRIVE) ELECTRIC VEHICLE IN TORQUE VECTORING MARKET, BY TYPE, 2020-2029 (USD MILLION)
TABLE 574 COLOMBIA (LEFT HAND DRIVE) TORQUE VECTORING MARKET, BY COMPONENT, 2020-2029 (USD MILLION)
TABLE 575 COLOMBIA (LEFT HAND DRIVE) HARDWARE IN TORQUE VECTORING MARKET, BY TYPE, 2020-2029 (USD MILLION)
TABLE 576 COLOMBIA (LEFT HAND DRIVE) TORQUE VECTORING MARKET, BY TECHNOLOGY, 2020-2029 (USD MILLION)
TABLE 577 COLOMBIA (LEFT HAND DRIVE) TORQUE VECTORING MARKET, BY CLUTCH ACTUATION TYPE, 2020-2029 (USD MILLION)
TABLE 578 COLOMBIA (LEFT HAND DRIVE) TORQUE VECTORING MARKET, BY DRIVING WHEEL TYPE, 2020-2029 (USD MILLION)
TABLE 579 COLOMBIA (LEFT HAND DRIVE) TORQUE VECTORING MARKET, BY VEHICLE TYPE, 2020-2029 (USD MILLION)
TABLE 580 COLOMBIA (LEFT HAND DRIVE) PASSENGER CARS IN TORQUE VECTORING MARKET, BY TYPE, 2020-2029 (USD MILLION)
TABLE 581 COLOMBIA (LEFT HAND DRIVE) PASSENGER CARS IN TORQUE VECTORING MARKET, BY TECHNOLOGY, 2020-2029 (USD MILLION)
TABLE 582 COLOMBIA (LEFT HAND DRIVE) COMMERCIAL VEHICLE IN TORQUE VECTORING MARKET, BY TYPE, 2020-2029 (USD MILLION)
TABLE 583 COLOMBIA (LEFT HAND DRIVE) HEAVY COMMERCIAL VEHICLE IN TORQUE VECTORING MARKET, BY TYPE, 2020-2029 (USD MILLION)
TABLE 584 COLOMBIA (LEFT HAND DRIVE) COMMERCIAL VEHICLE IN TORQUE VECTORING MARKET, BY TECHNOLOGY, 2020-2029 (USD MILLION)
TABLE 585 COLOMBIA (LEFT HAND DRIVE) OFF ROAD VEHICLE IN TORQUE VECTORING MARKET, BY TECHNOLOGY, 2020-2029 (USD MILLION)
TABLE 586 COLOMBIA (LEFT HAND DRIVE) TORQUE VECTORING MARKET, BY PROPULSION TYPE, 2020-2029 (USD MILLION)
TABLE 587 COLOMBIA (LEFT HAND DRIVE) ELECTRIC VEHICLE IN TORQUE VECTORING MARKET, BY TYPE, 2020-2029 (USD MILLION)
TABLE 588 CHILE (LEFT HAND DRIVE) TORQUE VECTORING MARKET, BY COMPONENT, 2020-2029 (USD MILLION)
TABLE 589 CHILE (LEFT HAND DRIVE) HARDWARE IN TORQUE VECTORING MARKET, BY TYPE, 2020-2029 (USD MILLION)
TABLE 590 CHILE (LEFT HAND DRIVE) TORQUE VECTORING MARKET, BY TECHNOLOGY, 2020-2029 (USD MILLION)
TABLE 591 CHILE (LEFT HAND DRIVE) TORQUE VECTORING MARKET, BY CLUTCH ACTUATION TYPE, 2020-2029 (USD MILLION)
TABLE 592 CHILE (LEFT HAND DRIVE) TORQUE VECTORING MARKET, BY DRIVING WHEEL TYPE, 2020-2029 (USD MILLION)
TABLE 593 CHILE (LEFT HAND DRIVE) TORQUE VECTORING MARKET, BY VEHICLE TYPE, 2020-2029 (USD MILLION)
TABLE 594 CHILE (LEFT HAND DRIVE) PASSENGER CARS IN TORQUE VECTORING MARKET, BY TYPE, 2020-2029 (USD MILLION)
TABLE 595 CHILE (LEFT HAND DRIVE) PASSENGER CARS IN TORQUE VECTORING MARKET, BY TECHNOLOGY, 2020-2029 (USD MILLION)
TABLE 596 CHILE (LEFT HAND DRIVE) COMMERCIAL VEHICLE IN TORQUE VECTORING MARKET, BY TYPE, 2020-2029 (USD MILLION)
TABLE 597 CHILE (LEFT HAND DRIVE) HEAVY COMMERCIAL VEHICLE IN TORQUE VECTORING MARKET, BY TYPE, 2020-2029 (USD MILLION)
TABLE 598 CHILE (LEFT HAND DRIVE) COMMERCIAL VEHICLE IN TORQUE VECTORING MARKET, BY TECHNOLOGY, 2020-2029 (USD MILLION)
TABLE 599 CHILE (LEFT HAND DRIVE) OFF ROAD VEHICLE IN TORQUE VECTORING MARKET, BY TECHNOLOGY, 2020-2029 (USD MILLION)
TABLE 600 CHILE (LEFT HAND DRIVE) TORQUE VECTORING MARKET, BY PROPULSION TYPE, 2020-2029 (USD MILLION)
TABLE 601 CHILE (LEFT HAND DRIVE) ELECTRIC VEHICLE IN TORQUE VECTORING MARKET, BY TYPE, 2020-2029 (USD MILLION)
TABLE 602 ECUADOR (LEFT HAND DRIVE) TORQUE VECTORING MARKET, BY COMPONENT, 2020-2029 (USD MILLION)
TABLE 603 ECUADOR (LEFT HAND DRIVE) HARDWARE IN TORQUE VECTORING MARKET, BY TYPE, 2020-2029 (USD MILLION)
TABLE 604 ECUADOR (LEFT HAND DRIVE) TORQUE VECTORING MARKET, BY TECHNOLOGY, 2020-2029 (USD MILLION)
TABLE 605 ECUADOR (LEFT HAND DRIVE) TORQUE VECTORING MARKET, BY CLUTCH ACTUATION TYPE, 2020-2029 (USD MILLION)
TABLE 606 ECUADOR (LEFT HAND DRIVE) TORQUE VECTORING MARKET, BY DRIVING WHEEL TYPE, 2020-2029 (USD MILLION)
TABLE 607 ECUADOR (LEFT HAND DRIVE) TORQUE VECTORING MARKET, BY VEHICLE TYPE, 2020-2029 (USD MILLION)
TABLE 608 ECUADOR (LEFT HAND DRIVE) PASSENGER CARS IN TORQUE VECTORING MARKET, BY TYPE, 2020-2029 (USD MILLION)
TABLE 609 ECUADOR (LEFT HAND DRIVE) PASSENGER CARS IN TORQUE VECTORING MARKET, BY TECHNOLOGY, 2020-2029 (USD MILLION)
TABLE 610 ECUADOR (LEFT HAND DRIVE) COMMERCIAL VEHICLE IN TORQUE VECTORING MARKET, BY TYPE, 2020-2029 (USD MILLION)
TABLE 611 ECUADOR (LEFT HAND DRIVE) HEAVY COMMERCIAL VEHICLE IN TORQUE VECTORING MARKET, BY TYPE, 2020-2029 (USD MILLION)
TABLE 612 ECUADOR (LEFT HAND DRIVE) COMMERCIAL VEHICLE IN TORQUE VECTORING MARKET, BY TECHNOLOGY, 2020-2029 (USD MILLION)
TABLE 613 ECUADOR (LEFT HAND DRIVE) OFF ROAD VEHICLE IN TORQUE VECTORING MARKET, BY TECHNOLOGY, 2020-2029 (USD MILLION)
TABLE 614 ECUADOR (LEFT HAND DRIVE) TORQUE VECTORING MARKET, BY PROPULSION TYPE, 2020-2029 (USD MILLION)
TABLE 615 ECUADOR (LEFT HAND DRIVE) ELECTRIC VEHICLE IN TORQUE VECTORING MARKET, BY TYPE, 2020-2029 (USD MILLION)
TABLE 616 PERU (LEFT HAND DRIVE) TORQUE VECTORING MARKET, BY COMPONENT, 2020-2029 (USD MILLION)
TABLE 617 PERU (LEFT HAND DRIVE) HARDWARE IN TORQUE VECTORING MARKET, BY TYPE, 2020-2029 (USD MILLION)
TABLE 618 PERU (LEFT HAND DRIVE) TORQUE VECTORING MARKET, BY TECHNOLOGY, 2020-2029 (USD MILLION)
TABLE 619 PERU (LEFT HAND DRIVE) TORQUE VECTORING MARKET, BY CLUTCH ACTUATION TYPE, 2020-2029 (USD MILLION)
TABLE 620 PERU (LEFT HAND DRIVE) TORQUE VECTORING MARKET, BY DRIVING WHEEL TYPE, 2020-2029 (USD MILLION)
TABLE 621 PERU (LEFT HAND DRIVE) TORQUE VECTORING MARKET, BY VEHICLE TYPE, 2020-2029 (USD MILLION)
TABLE 622 PERU (LEFT HAND DRIVE) PASSENGER CARS IN TORQUE VECTORING MARKET, BY TYPE, 2020-2029 (USD MILLION)
TABLE 623 PERU (LEFT HAND DRIVE) PASSENGER CARS IN TORQUE VECTORING MARKET, BY TECHNOLOGY, 2020-2029 (USD MILLION)
TABLE 624 PERU (LEFT HAND DRIVE) COMMERCIAL VEHICLE IN TORQUE VECTORING MARKET, BY TYPE, 2020-2029 (USD MILLION)
TABLE 625 PERU (LEFT HAND DRIVE) HEAVY COMMERCIAL VEHICLE IN TORQUE VECTORING MARKET, BY TYPE, 2020-2029 (USD MILLION)
TABLE 626 PERU (LEFT HAND DRIVE) COMMERCIAL VEHICLE IN TORQUE VECTORING MARKET, BY TECHNOLOGY, 2020-2029 (USD MILLION)
TABLE 627 PERU (LEFT HAND DRIVE) OFF ROAD VEHICLE IN TORQUE VECTORING MARKET, BY TECHNOLOGY, 2020-2029 (USD MILLION)
TABLE 628 PERU (LEFT HAND DRIVE) TORQUE VECTORING MARKET, BY PROPULSION TYPE, 2020-2029 (USD MILLION)
TABLE 629 PERU (LEFT HAND DRIVE) ELECTRIC VEHICLE IN TORQUE VECTORING MARKET, BY TYPE, 2020-2029 (USD MILLION)
TABLE 630 PARAGUAY (LEFT HAND DRIVE) TORQUE VECTORING MARKET, BY COMPONENT, 2020-2029 (USD MILLION)
TABLE 631 PARAGUAY (LEFT HAND DRIVE) HARDWARE IN TORQUE VECTORING MARKET, BY TYPE, 2020-2029 (USD MILLION)
TABLE 632 PARAGUAY (LEFT HAND DRIVE) TORQUE VECTORING MARKET, BY TECHNOLOGY, 2020-2029 (USD MILLION)
TABLE 633 PARAGUAY (LEFT HAND DRIVE) TORQUE VECTORING MARKET, BY CLUTCH ACTUATION TYPE, 2020-2029 (USD MILLION)
TABLE 634 PARAGUAY (LEFT HAND DRIVE) TORQUE VECTORING MARKET, BY DRIVING WHEEL TYPE, 2020-2029 (USD MILLION)
TABLE 635 PARAGUAY (LEFT HAND DRIVE) TORQUE VECTORING MARKET, BY VEHICLE TYPE, 2020-2029 (USD MILLION)
TABLE 636 PARAGUAY (LEFT HAND DRIVE) PASSENGER CARS IN TORQUE VECTORING MARKET, BY TYPE, 2020-2029 (USD MILLION)
TABLE 637 PARAGUAY (LEFT HAND DRIVE) PASSENGER CARS IN TORQUE VECTORING MARKET, BY TECHNOLOGY, 2020-2029 (USD MILLION)
TABLE 638 PARAGUAY (LEFT HAND DRIVE) COMMERCIAL VEHICLE IN TORQUE VECTORING MARKET, BY TYPE, 2020-2029 (USD MILLION)
TABLE 639 PARAGUAY (LEFT HAND DRIVE) HEAVY COMMERCIAL VEHICLE IN TORQUE VECTORING MARKET, BY TYPE, 2020-2029 (USD MILLION)
TABLE 640 PARAGUAY (LEFT HAND DRIVE) COMMERCIAL VEHICLE IN TORQUE VECTORING MARKET, BY TECHNOLOGY, 2020-2029 (USD MILLION)
TABLE 641 PARAGUAY (LEFT HAND DRIVE) OFF ROAD VEHICLE IN TORQUE VECTORING MARKET, BY TECHNOLOGY, 2020-2029 (USD MILLION)
TABLE 642 PARAGUAY (LEFT HAND DRIVE) TORQUE VECTORING MARKET, BY PROPULSION TYPE, 2020-2029 (USD MILLION)
TABLE 643 PARAGUAY (LEFT HAND DRIVE) ELECTRIC VEHICLE IN TORQUE VECTORING MARKET, BY TYPE, 2020-2029 (USD MILLION)
TABLE 644 COSTA RICA (LEFT HAND DRIVE) TORQUE VECTORING MARKET, BY COMPONENT, 2020-2029 (USD MILLION)
TABLE 645 COSTA RICA (LEFT HAND DRIVE) HARDWARE IN TORQUE VECTORING MARKET, BY TYPE, 2020-2029 (USD MILLION)
TABLE 646 COSTA RICA (LEFT HAND DRIVE) TORQUE VECTORING MARKET, BY TECHNOLOGY, 2020-2029 (USD MILLION)
TABLE 647 COSTA RICA (LEFT HAND DRIVE) TORQUE VECTORING MARKET, BY CLUTCH ACTUATION TYPE, 2020-2029 (USD MILLION)
TABLE 648 COSTA RICA (LEFT HAND DRIVE) TORQUE VECTORING MARKET, BY DRIVING WHEEL TYPE, 2020-2029 (USD MILLION)
TABLE 649 COSTA RICA (LEFT HAND DRIVE) TORQUE VECTORING MARKET, BY VEHICLE TYPE, 2020-2029 (USD MILLION)
TABLE 650 COSTA RICA (LEFT HAND DRIVE) PASSENGER CARS IN TORQUE VECTORING MARKET, BY TYPE, 2020-2029 (USD MILLION)
TABLE 651 COSTA RICA (LEFT HAND DRIVE) PASSENGER CARS IN TORQUE VECTORING MARKET, BY TECHNOLOGY, 2020-2029 (USD MILLION)
TABLE 652 COSTA RICA (LEFT HAND DRIVE) COMMERCIAL VEHICLE IN TORQUE VECTORING MARKET, BY TYPE, 2020-2029 (USD MILLION)
TABLE 653 COSTA RICA (LEFT HAND DRIVE) HEAVY COMMERCIAL VEHICLE IN TORQUE VECTORING MARKET, BY TYPE, 2020-2029 (USD MILLION)
TABLE 654 COSTA RICA (LEFT HAND DRIVE) COMMERCIAL VEHICLE IN TORQUE VECTORING MARKET, BY TECHNOLOGY, 2020-2029 (USD MILLION)
TABLE 655 COSTA RICA (LEFT HAND DRIVE) OFF ROAD VEHICLE IN TORQUE VECTORING MARKET, BY TECHNOLOGY, 2020-2029 (USD MILLION)
TABLE 656 COSTA RICA (LEFT HAND DRIVE) TORQUE VECTORING MARKET, BY PROPULSION TYPE, 2020-2029 (USD MILLION)
TABLE 657 COSTA RICA (LEFT HAND DRIVE) ELECTRIC VEHICLE IN TORQUE VECTORING MARKET, BY TYPE, 2020-2029 (USD MILLION)
TABLE 658 REST OF SOUTH AMERICA TORQUE VECTORING MARKET, BY COMPONENT, 2020-2029 (USD MILLION)
TABLE 659 MIDDLE EAST AND AFRICA TORQUE VECTORING MARKET, BY COUNTRY, 2020-2029 (USD MILLION)
TABLE 660 MIDDLE EAST AND AFRICA (LEFT HAND DRIVE) TORQUE VECTORING MARKET, BY COUNTRY, 2020-2029 (USD MILLION)
TABLE 661 MIDDLE EAST AND AFRICA (RIGHT HAND DRIVE) TORQUE VECTORING MARKET, BY COUNTRY, 2020-2029 (USD MILLION)
TABLE 662 MIDDLE EAST AND AFRICA TORQUE VECTORING MARKET, BY COMPONENT, 2020-2029 (USD MILLION)
TABLE 663 MIDDLE EAST AND AFRICA HARDWARE IN TORQUE VECTORING MARKET, BY TYPE, 2020-2029 (USD MILLION)
TABLE 664 MIDDLE EAST AND AFRICA TORQUE VECTORING MARKET, BY TECHNOLOGY, 2020-2029 (USD MILLION)
TABLE 665 MIDDLE EAST AND AFRICA TORQUE VECTORING MARKET, BY CLUTCH ACTUATION TYPE, 2020-2029 (USD MILLION)
TABLE 666 MIDDLE EAST AND AFRICA TORQUE VECTORING MARKET, BY DRIVING WHEEL TYPE, 2020-2029 (USD MILLION)
TABLE 667 MIDDLE EAST AND AFRICA TORQUE VECTORING MARKET, BY VEHICLE TYPE, 2020-2029 (USD MILLION)
TABLE 668 MIDDLE EAST AND AFRICA PASSENGER CARS IN TORQUE VECTORING MARKET, BY TYPE, 2020-2029 (USD MILLION)
TABLE 669 MIDDLE EAST AND AFRICA PASSENGER CARS IN TORQUE VECTORING MARKET, BY TECHNOLOGY, 2020-2029 (USD MILLION)
TABLE 670 MIDDLE EAST AND AFRICA COMMERCIAL VEHICLE IN TORQUE VECTORING MARKET, BY TYPE, 2020-2029 (USD MILLION)
TABLE 671 MIDDLE EAST AND AFRICA HEAVY COMMERCIAL VEHICLE IN TORQUE VECTORING MARKET, BY TYPE, 2020-2029 (USD MILLION)
TABLE 672 MIDDLE EAST AND AFRICA COMMERCIAL VEHICLE IN TORQUE VECTORING MARKET, BY TECHNOLOGY, 2020-2029 (USD MILLION)
TABLE 673 MIDDLE EAST AND AFRICA OFF ROAD VEHICLE IN TORQUE VECTORING MARKET, BY TECHNOLOGY, 2020-2029 (USD MILLION)
TABLE 674 MIDDLE EAST AND AFRICA TORQUE VECTORING MARKET, BY PROPULSION TYPE, 2020-2029 (USD MILLION)
TABLE 675 MIDDLE EAST AND AFRICA ELECTRIC VEHICLE IN TORQUE VECTORING MARKET, BY TECHNOLOGY, 2020-2029 (USD MILLION)
TABLE 676 SAUDI ARABIA (LEFT HAND DRIVE) TORQUE VECTORING MARKET, BY COMPONENT, 2020-2029 (USD MILLION)
TABLE 677 SAUDI ARABIA (LEFT HAND DRIVE) HARDWARE IN TORQUE VECTORING MARKET, BY TYPE, 2020-2029 (USD MILLION)
TABLE 678 SAUDI ARABIA (LEFT HAND DRIVE) TORQUE VECTORING MARKET, BY TECHNOLOGY, 2020-2029 (USD MILLION)
TABLE 679 SAUDI ARABIA (LEFT HAND DRIVE) TORQUE VECTORING MARKET, BY CLUTCH ACTUATION TYPE, 2020-2029 (USD MILLION)
TABLE 680 SAUDI ARABIA (LEFT HAND DRIVE) TORQUE VECTORING MARKET, BY DRIVING WHEEL TYPE, 2020-2029 (USD MILLION)
TABLE 681 SAUDI ARABIA (LEFT HAND DRIVE) TORQUE VECTORING MARKET, BY VEHICLE TYPE, 2020-2029 (USD MILLION)
TABLE 682 SAUDI ARABIA (LEFT HAND DRIVE) PASSENGER CARS IN TORQUE VECTORING MARKET, BY TYPE, 2020-2029 (USD MILLION)
TABLE 683 SAUDI ARABIA (LEFT HAND DRIVE) PASSENGER CARS IN TORQUE VECTORING MARKET, BY TECHNOLOGY, 2020-2029 (USD MILLION)
TABLE 684 SAUDI ARABIA (LEFT HAND DRIVE) COMMERCIAL VEHICLE IN TORQUE VECTORING MARKET, BY TYPE, 2020-2029 (USD MILLION)
TABLE 685 SAUDI ARABIA (LEFT HAND DRIVE) HEAVY COMMERCIAL VEHICLE IN TORQUE VECTORING MARKET, BY TYPE, 2020-2029 (USD MILLION)
TABLE 686 SAUDI ARABIA (LEFT HAND DRIVE) COMMERCIAL VEHICLE IN TORQUE VECTORING MARKET, BY TECHNOLOGY, 2020-2029 (USD MILLION)
TABLE 687 SAUDI ARABIA (LEFT HAND DRIVE) OFF ROAD VEHICLE IN TORQUE VECTORING MARKET, BY TECHNOLOGY, 2020-2029 (USD MILLION)
TABLE 688 SAUDI ARABIA (LEFT HAND DRIVE) TORQUE VECTORING MARKET, BY PROPULSION TYPE, 2020-2029 (USD MILLION)
TABLE 689 SAUDI ARABIA (LEFT HAND DRIVE) ELECTRIC VEHICLE IN TORQUE VECTORING MARKET, BY TECHNOLOGY, 2020-2029 (USD MILLION)
TABLE 690 U.A.E. (LEFT HAND DRIVE) TORQUE VECTORING MARKET, BY COMPONENT, 2020-2029 (USD MILLION)
TABLE 691 U.A.E. (LEFT HAND DRIVE) HARDWARE IN TORQUE VECTORING MARKET, BY TYPE, 2020-2029 (USD MILLION)
TABLE 692 U.A.E. (LEFT HAND DRIVE) TORQUE VECTORING MARKET, BY TECHNOLOGY, 2020-2029 (USD MILLION)
TABLE 693 U.A.E. (LEFT HAND DRIVE) TORQUE VECTORING MARKET, BY CLUTCH ACTUATION TYPE, 2020-2029 (USD MILLION)
TABLE 694 U.A.E. (LEFT HAND DRIVE) TORQUE VECTORING MARKET, BY DRIVING WHEEL TYPE, 2020-2029 (USD MILLION)
TABLE 695 U.A.E. (LEFT HAND DRIVE) TORQUE VECTORING MARKET, BY VEHICLE TYPE, 2020-2029 (USD MILLION)
TABLE 696 U.A.E. (LEFT HAND DRIVE) PASSENGER CARS IN TORQUE VECTORING MARKET, BY TYPE, 2020-2029 (USD MILLION)
TABLE 697 U.A.E. (LEFT HAND DRIVE) PASSENGER CARS IN TORQUE VECTORING MARKET, BY TECHNOLOGY, 2020-2029 (USD MILLION)
TABLE 698 U.A.E. (LEFT HAND DRIVE) COMMERCIAL VEHICLE IN TORQUE VECTORING MARKET, BY TYPE, 2020-2029 (USD MILLION)
TABLE 699 U.A.E. (LEFT HAND DRIVE) HEAVY COMMERCIAL VEHICLE IN TORQUE VECTORING MARKET, BY TYPE, 2020-2029 (USD MILLION)
TABLE 700 U.A.E. (LEFT HAND DRIVE) COMMERCIAL VEHICLE IN TORQUE VECTORING MARKET, BY TECHNOLOGY, 2020-2029 (USD MILLION)
TABLE 701 U.A.E. (LEFT HAND DRIVE) OFF ROAD VEHICLE IN TORQUE VECTORING MARKET, BY TECHNOLOGY, 2020-2029 (USD MILLION)
TABLE 702 U.A.E. (LEFT HAND DRIVE) TORQUE VECTORING MARKET, BY PROPULSION TYPE, 2020-2029 (USD MILLION)
TABLE 703 U.A.E. (LEFT HAND DRIVE) ELECTRIC VEHICLE IN TORQUE VECTORING MARKET, BY TECHNOLOGY, 2020-2029 (USD MILLION)
TABLE 704 SOUTH AFRICA (RIGHT HAND DRIVE) TORQUE VECTORING MARKET, BY COMPONENT, 2020-2029 (USD MILLION)
TABLE 705 SOUTH AFRICA (RIGHT HAND DRIVE) HARDWARE IN TORQUE VECTORING MARKET, BY TYPE, 2020-2029 (USD MILLION)
TABLE 706 SOUTH AFRICA (RIGHT HAND DRIVE) TORQUE VECTORING MARKET, BY TECHNOLOGY, 2020-2029 (USD MILLION)
TABLE 707 SOUTH AFRICA (RIGHT HAND DRIVE) TORQUE VECTORING MARKET, BY CLUTCH ACTUATION TYPE, 2020-2029 (USD MILLION)
TABLE 708 SOUTH AFRICA (RIGHT HAND DRIVE) TORQUE VECTORING MARKET, BY DRIVING WHEEL TYPE, 2020-2029 (USD MILLION)
TABLE 709 SOUTH AFRICA (RIGHT HAND DRIVE) TORQUE VECTORING MARKET, BY VEHICLE TYPE, 2020-2029 (USD MILLION)
TABLE 710 SOUTH AFRICA (RIGHT HAND DRIVE) PASSENGER CARS IN TORQUE VECTORING MARKET, BY TYPE, 2020-2029 (USD MILLION)
TABLE 711 SOUTH AFRICA (RIGHT HAND DRIVE) PASSENGER CARS IN TORQUE VECTORING MARKET, BY TECHNOLOGY, 2020-2029 (USD MILLION)
TABLE 712 SOUTH AFRICA (RIGHT HAND DRIVE) COMMERCIAL VEHICLE IN TORQUE VECTORING MARKET, BY TYPE, 2020-2029 (USD MILLION)
TABLE 713 SOUTH AFRICA (RIGHT HAND DRIVE) HEAVY COMMERCIAL VEHICLE IN TORQUE VECTORING MARKET, BY TYPE, 2020-2029 (USD MILLION)
TABLE 714 SOUTH AFRICA (RIGHT HAND DRIVE) COMMERCIAL VEHICLE IN TORQUE VECTORING MARKET, BY TECHNOLOGY, 2020-2029 (USD MILLION)
TABLE 715 SOUTH AFRICA (RIGHT HAND DRIVE) OFF ROAD VEHICLE IN TORQUE VECTORING MARKET, BY TECHNOLOGY, 2020-2029 (USD MILLION)
TABLE 716 SOUTH AFRICA (RIGHT HAND DRIVE) TORQUE VECTORING MARKET, BY PROPULSION TYPE, 2020-2029 (USD MILLION)
TABLE 717 SOUTH AFRICA (RIGHT HAND DRIVE) ELECTRIC VEHICLE IN TORQUE VECTORING MARKET, BY TECHNOLOGY, 2020-2029 (USD MILLION)
TABLE 718 EGYPT (LEFT HAND DRIVE) TORQUE VECTORING MARKET, BY COMPONENT, 2020-2029 (USD MILLION)
TABLE 719 EGYPT (LEFT HAND DRIVE) HARDWARE IN TORQUE VECTORING MARKET, BY TYPE, 2020-2029 (USD MILLION)
TABLE 720 EGYPT (LEFT HAND DRIVE) TORQUE VECTORING MARKET, BY TECHNOLOGY, 2020-2029 (USD MILLION)
TABLE 721 EGYPT (LEFT HAND DRIVE) TORQUE VECTORING MARKET, BY CLUTCH ACTUATION TYPE, 2020-2029 (USD MILLION)
TABLE 722 EGYPT (LEFT HAND DRIVE) TORQUE VECTORING MARKET, BY DRIVING WHEEL TYPE, 2020-2029 (USD MILLION)
TABLE 723 EGYPT (LEFT HAND DRIVE) TORQUE VECTORING MARKET, BY VEHICLE TYPE, 2020-2029 (USD MILLION)
TABLE 724 EGYPT (LEFT HAND DRIVE) PASSENGER CARS IN TORQUE VECTORING MARKET, BY TYPE, 2020-2029 (USD MILLION)
TABLE 725 EGYPT (LEFT HAND DRIVE) PASSENGER CARS IN TORQUE VECTORING MARKET, BY TECHNOLOGY, 2020-2029 (USD MILLION)
TABLE 726 EGYPT (LEFT HAND DRIVE) COMMERCIAL VEHICLE IN TORQUE VECTORING MARKET, BY TYPE, 2020-2029 (USD MILLION)
TABLE 727 EGYPT (LEFT HAND DRIVE) HEAVY COMMERCIAL VEHICLE IN TORQUE VECTORING MARKET, BY TYPE, 2020-2029 (USD MILLION)
TABLE 728 EGYPT (LEFT HAND DRIVE) COMMERCIAL VEHICLE IN TORQUE VECTORING MARKET, BY TECHNOLOGY, 2020-2029 (USD MILLION)
TABLE 729 EGYPT (LEFT HAND DRIVE) OFF ROAD VEHICLE IN TORQUE VECTORING MARKET, BY TECHNOLOGY, 2020-2029 (USD MILLION)
TABLE 730 EGYPT (LEFT HAND DRIVE) TORQUE VECTORING MARKET, BY PROPULSION TYPE, 2020-2029 (USD MILLION)
TABLE 731 EGYPT (LEFT HAND DRIVE) ELECTRIC VEHICLE IN TORQUE VECTORING MARKET, BY TECHNOLOGY, 2020-2029 (USD MILLION)
TABLE 732 ISRAEL (LEFT HAND DRIVE) TORQUE VECTORING MARKET, BY COMPONENT, 2020-2029 (USD MILLION)
TABLE 733 ISRAEL (LEFT HAND DRIVE) HARDWARE IN TORQUE VECTORING MARKET, BY TYPE, 2020-2029 (USD MILLION)
TABLE 734 ISRAEL (LEFT HAND DRIVE) TORQUE VECTORING MARKET, BY TECHNOLOGY, 2020-2029 (USD MILLION)
TABLE 735 ISRAEL (LEFT HAND DRIVE) TORQUE VECTORING MARKET, BY CLUTCH ACTUATION TYPE, 2020-2029 (USD MILLION)
TABLE 736 ISRAEL (LEFT HAND DRIVE) TORQUE VECTORING MARKET, BY DRIVING WHEEL TYPE, 2020-2029 (USD MILLION)
TABLE 737 ISRAEL (LEFT HAND DRIVE) TORQUE VECTORING MARKET, BY VEHICLE TYPE, 2020-2029 (USD MILLION)
TABLE 738 ISRAEL (LEFT HAND DRIVE) PASSENGER CARS IN TORQUE VECTORING MARKET, BY TYPE, 2020-2029 (USD MILLION)
TABLE 739 ISRAEL (LEFT HAND DRIVE) PASSENGER CARS IN TORQUE VECTORING MARKET, BY TECHNOLOGY, 2020-2029 (USD MILLION)
TABLE 740 ISRAEL (LEFT HAND DRIVE) COMMERCIAL VEHICLE IN TORQUE VECTORING MARKET, BY TYPE, 2020-2029 (USD MILLION)
TABLE 741 ISRAEL (LEFT HAND DRIVE) HEAVY COMMERCIAL VEHICLE IN TORQUE VECTORING MARKET, BY TYPE, 2020-2029 (USD MILLION)
TABLE 742 ISRAEL (LEFT HAND DRIVE) COMMERCIAL VEHICLE IN TORQUE VECTORING MARKET, BY TECHNOLOGY, 2020-2029 (USD MILLION)
TABLE 743 ISRAEL (LEFT HAND DRIVE) OFF ROAD VEHICLE IN TORQUE VECTORING MARKET, BY TECHNOLOGY, 2020-2029 (USD MILLION)
TABLE 744 ISRAEL (LEFT HAND DRIVE) TORQUE VECTORING MARKET, BY PROPULSION TYPE, 2020-2029 (USD MILLION)
TABLE 745 ISRAEL (LEFT HAND DRIVE) ELECTRIC VEHICLE IN TORQUE VECTORING MARKET, BY TECHNOLOGY, 2020-2029 (USD MILLION)
TABLE 746 KUWAIT (LEFT HAND DRIVE) TORQUE VECTORING MARKET, BY COMPONENT, 2020-2029 (USD MILLION)
TABLE 747 KUWAIT (LEFT HAND DRIVE) HARDWARE IN TORQUE VECTORING MARKET, BY TYPE, 2020-2029 (USD MILLION)
TABLE 748 KUWAIT (LEFT HAND DRIVE) TORQUE VECTORING MARKET, BY TECHNOLOGY, 2020-2029 (USD MILLION)
TABLE 749 KUWAIT (LEFT HAND DRIVE) TORQUE VECTORING MARKET, BY CLUTCH ACTUATION TYPE, 2020-2029 (USD MILLION)
TABLE 750 KUWAIT (LEFT HAND DRIVE) TORQUE VECTORING MARKET, BY DRIVING WHEEL TYPE, 2020-2029 (USD MILLION)
TABLE 751 KUWAIT (LEFT HAND DRIVE) TORQUE VECTORING MARKET, BY VEHICLE TYPE, 2020-2029 (USD MILLION)
TABLE 752 KUWAIT (LEFT HAND DRIVE) PASSENGER CARS IN TORQUE VECTORING MARKET, BY TYPE, 2020-2029 (USD MILLION)
TABLE 753 KUWAIT (LEFT HAND DRIVE) PASSENGER CARS IN TORQUE VECTORING MARKET, BY TECHNOLOGY, 2020-2029 (USD MILLION)
TABLE 754 KUWAIT (LEFT HAND DRIVE) COMMERCIAL VEHICLE IN TORQUE VECTORING MARKET, BY TYPE, 2020-2029 (USD MILLION)
TABLE 755 KUWAIT (LEFT HAND DRIVE) HEAVY COMMERCIAL VEHICLE IN TORQUE VECTORING MARKET, BY TYPE, 2020-2029 (USD MILLION)
TABLE 756 KUWAIT (LEFT HAND DRIVE) COMMERCIAL VEHICLE IN TORQUE VECTORING MARKET, BY TECHNOLOGY, 2020-2029 (USD MILLION)
TABLE 757 KUWAIT (LEFT HAND DRIVE) OFF ROAD VEHICLE IN TORQUE VECTORING MARKET, BY TECHNOLOGY, 2020-2029 (USD MILLION)
TABLE 758 KUWAIT (LEFT HAND DRIVE) TORQUE VECTORING MARKET, BY PROPULSION TYPE, 2020-2029 (USD MILLION)
TABLE 759 KUWAIT (LEFT HAND DRIVE) ELECTRIC VEHICLE IN TORQUE VECTORING MARKET, BY TECHNOLOGY, 2020-2029 (USD MILLION)
TABLE 760 REST OF MIDDLE EAST AND AFRICA TORQUE VECTORING MARKET, BY COMPONENT, 2020-2029 (USD MILLION)
Lista de figuras
FIGURE 1 GLOBAL TORQUE VECTORING MARKET: SEGMENTATION
FIGURE 2 GLOBAL TORQUE VECTORING MARKET: DATA TRIANGULATION
FIGURE 3 GLOBAL TORQUE VECTORING MARKET: DROC ANALYSIS
FIGURE 4 GLOBAL TORQUE VECTORING MARKET: GLOBAL VS REGIONAL ANALYSIS
FIGURE 5 GLOBAL TORQUE VECTORING MARKET: COMPANY RESEARCH ANALYSIS
FIGURE 6 GLOBAL TORQUE VECTORING MARKET: INTERVIEW DEMOGRAPHICS
FIGURE 7 GLOBAL TORQUE VECTORING MARKET: DBMRMARKET POSITION GRID
FIGURE 8 GLOBAL TORQUE VECTORING MARKET: VENDOR SHARE ANALYSIS
FIGURE 9 GLOBAL TORQUE VECTORING MARKET: SEGMENTATION
FIGURE 10 INTELLIGENT TORQUE VECTORING APPROACH FOR ADAS VEHICLES IS EXPECTED TO DRIVE GLOBAL TORQUE VECTORING MARKET IN THE FORECAST PERIOD OF 2022 TO 2029
FIGURE 11 HARDWARE SEGMENT IS EXPECTED TO ACCOUNT FOR THE LARGEST SHARE OF GLOBAL TORQUE VECTORING MARKET IN 2022 & 2029
FIGURE 12 NORTH AMERICA IS EXPECTED TO DOMINATE AND ASIA-PACIFIC IS THE FASTEST GROWING REGION IN THE GLOBAL TORQUE VECTORING MARKET IN THE FORECAST PERIOD OF 2022 TO 2029
FIGURE 13 ASIA-PACIFIC IS THE FASTEST GROWING MARKET FOR TORQUE VECTORING MANUFACTURERS IN THE FORECAST PERIOD OF 2022 TO 2029
FIGURE 14 DRIVERS, RESTRAINTS, OPPORTUNITIES, AND CHALLENGES OF THE GLOBAL TORQUE VECTORING MARKET
FIGURE 15 PERCENTAGE OF URABANIZATION ACROSS THE GLOBE
FIGURE 16 AVAILABILITY OF ADAS TECHNOLOGY IN NEW VEHICLE MODELS
FIGURE 17 ROAD TRANSPORT EMISSIONS
FIGURE 18 GLOBAL TORQUE VECTORING MARKET: BY COMPONENT, 2021
FIGURE 19 GLOBAL TORQUE VECTORING MARKET: BY TECHNOLOGY, 2021
FIGURE 20 GLOBAL TORQUE VECTORING MARKET: BY CLUTCH ACTUATION TYPE, 2021
FIGURE 21 GLOBAL TORQUE VECTORING MARKET: BY DRIVING WHEEL TYPE, 2021
FIGURE 22 GLOBAL TORQUE VECTORING MARKET: BY VEHICLE TYPE, 2021
FIGURE 23 GLOBAL TORQUE VECTORING MARKET: BY PROPULSION TYPE, 2021
FIGURE 24 GLOBAL TORQUE VECTORING MARKET : SNAPSHOT (2021)
FIGURE 25 GLOBAL TORQUE VECTORING MARKET : BY COUNTRY (2021)
FIGURE 26 GLOBAL TORQUE VECTORING MARKET : BY COUNTRY (2022 & 2029)
FIGURE 27 GLOBAL TORQUE VECTORING MARKET: BY COUNTRY (2021 & 2029)
FIGURE 28 GLOBAL TORQUE VECTORING MARKET : BY COMPONENT (2022-2029)
FIGURE 29 NORTH AMERICA TORQUE VECTORING MARKET: SNAPSHOT (2021)
FIGURE 30 NORTH AMERICA TORQUE VECTORING MARKET: BY COUNTRY (2021)
FIGURE 31 NORTH AMERICA TORQUE VECTORING MARKET: BY COUNTRY (2022 & 2029)
FIGURE 32 NORTH AMERICA TORQUE VECTORING MARKET: BY COUNTRY (2021 & 2029)
FIGURE 33 NORTH AMERICA TORQUE VECTORING MARKET: BY COMPONENT (2022-2029)
FIGURE 34 EUROPE TORQUE VECTORING MARKET: SNAPSHOT (2021)
FIGURE 35 EUROPE TORQUE VECTORING MARKET: BY COUNTRY (2021)
FIGURE 36 EUROPE TORQUE VECTORING MARKET: BY COUNTRY (2022 & 2029)
FIGURE 37 EUROPE TORQUE VECTORING MARKET: BY COUNTRY (2021 & 2029)
FIGURE 38 EUROPE TORQUE VECTORING MARKET: BY COMPONENT (2022-2029)
FIGURE 39 ASIA-PACIFIC TORQUE VECTORING MARKET: SNAPSHOT (2021)
FIGURE 40 ASIA-PACIFIC TORQUE VECTORING MARKET: BY COUNTRY (2021)
FIGURE 41 ASIA-PACIFIC TORQUE VECTORING MARKET: BY COUNTRY (2022 & 2029)
FIGURE 42 ASIA-PACIFIC TORQUE VECTORING MARKET: BY COUNTRY (2021 & 2029)
FIGURE 43 ASIA-PACIFIC TORQUE VECTORING MARKET: BY COMPONENT (2022-2029)
FIGURE 44 SOUTH AMERICA TORQUE VECTORING MARKET : SNAPSHOT (2021)
FIGURE 45 SOUTH AMERICA TORQUE VECTORING MARKET: BY COUNTRY (2021)
FIGURE 46 SOUTH AMERICA TORQUE VECTORING MARKET: BY COUNTRY (2022 & 2029)
FIGURE 47 SOUTH AMERICA TORQUE VECTORING MARKET: BY COUNTRY (2021 & 2029)
FIGURE 48 SOUTH AMERICA TORQUE VECTORING MARKET : BY COMPONENT (2022-2029)
FIGURE 49 MIDDLE EAST AND AFRICA TORQUE VECTORING MARKET: SNAPSHOT (2021)
FIGURE 50 MIDDLE EAST AND AFRICA TORQUE VECTORING MARKET: BY COUNTRY (2021)
FIGURE 51 MIDDLE EAST AND AFRICA TORQUE VECTORING MARKET: BY COUNTRY (2022 & 2029)
FIGURE 52 MIDDLE EAST AND AFRICA TORQUE VECTORING MARKET: BY COUNTRY (2021 & 2029)
FIGURE 53 MIDDLE EAST AND AFRICA TORQUE VECTORING MARKET: BY COMPONENT (2022-2029)
FIGURE 54 GLOBAL TORQUE VECTORING MARKET: COMPANY SHARE 2021 (%)
FIGURE 55 NORTH AMERICA TORQUE VECTORING MARKET: COMPANY SHARE 2021 (%)
FIGURE 56 EUROPE TORQUE VECTORING MARKET: COMPANY SHARE 2021 (%)
FIGURE 57 ASIA-PACIFIC TORQUE VECTORING MARKET: COMPANY SHARE 2021 (%)
Metodología de investigación
La recopilación de datos y el análisis del año base se realizan utilizando módulos de recopilación de datos con muestras de gran tamaño. La etapa incluye la obtención de información de mercado o datos relacionados a través de varias fuentes y estrategias. Incluye el examen y la planificación de todos los datos adquiridos del pasado con antelación. Asimismo, abarca el examen de las inconsistencias de información observadas en diferentes fuentes de información. Los datos de mercado se analizan y estiman utilizando modelos estadísticos y coherentes de mercado. Además, el análisis de la participación de mercado y el análisis de tendencias clave son los principales factores de éxito en el informe de mercado. Para obtener más información, solicite una llamada de un analista o envíe su consulta.
La metodología de investigación clave utilizada por el equipo de investigación de DBMR es la triangulación de datos, que implica la extracción de datos, el análisis del impacto de las variables de datos en el mercado y la validación primaria (experto en la industria). Los modelos de datos incluyen cuadrícula de posicionamiento de proveedores, análisis de línea de tiempo de mercado, descripción general y guía del mercado, cuadrícula de posicionamiento de la empresa, análisis de patentes, análisis de precios, análisis de participación de mercado de la empresa, estándares de medición, análisis global versus regional y de participación de proveedores. Para obtener más información sobre la metodología de investigación, envíe una consulta para hablar con nuestros expertos de la industria.
Personalización disponible
Data Bridge Market Research es líder en investigación formativa avanzada. Nos enorgullecemos de brindar servicios a nuestros clientes existentes y nuevos con datos y análisis que coinciden y se adaptan a sus objetivos. El informe se puede personalizar para incluir análisis de tendencias de precios de marcas objetivo, comprensión del mercado de países adicionales (solicite la lista de países), datos de resultados de ensayos clínicos, revisión de literatura, análisis de mercado renovado y base de productos. El análisis de mercado de competidores objetivo se puede analizar desde análisis basados en tecnología hasta estrategias de cartera de mercado. Podemos agregar tantos competidores sobre los que necesite datos en el formato y estilo de datos que esté buscando. Nuestro equipo de analistas también puede proporcionarle datos en archivos de Excel sin procesar, tablas dinámicas (libro de datos) o puede ayudarlo a crear presentaciones a partir de los conjuntos de datos disponibles en el informe.

