

Global Tackifier Market
Tamaño del mercado en miles de millones de dólares
Tasa de crecimiento anual compuesta (CAGR) :
% 
 USD
4,083,989.40 Thousand
USD
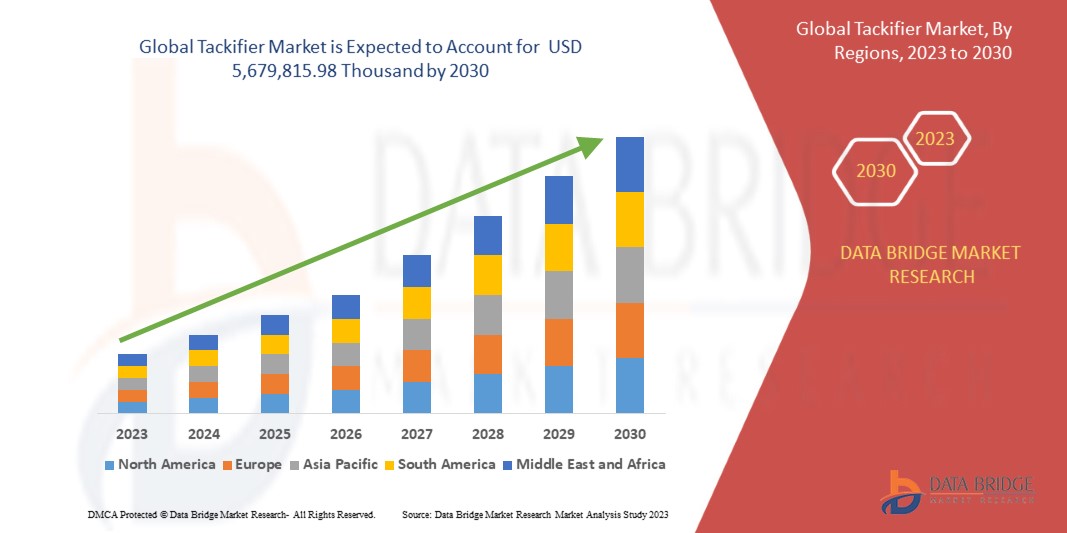
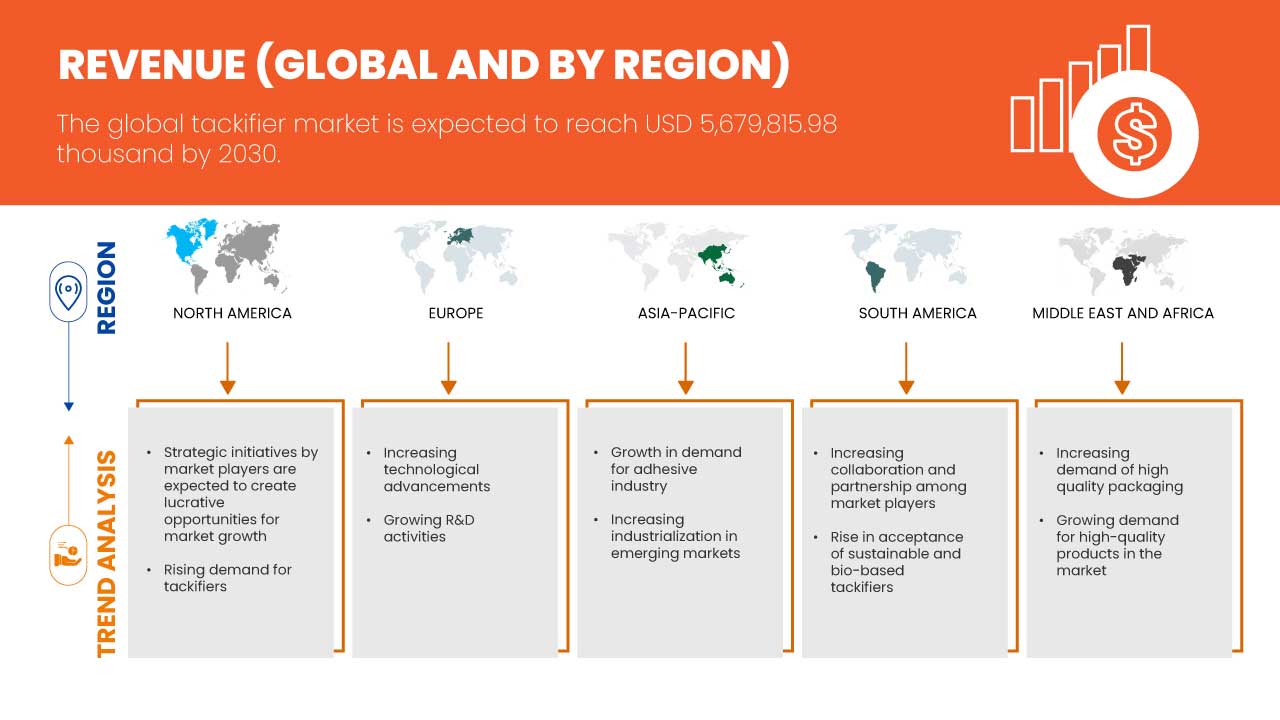
5,679,815.98 Thousand
2021
2029
USD
4,083,989.40 Thousand
USD
5,679,815.98 Thousand
2021
2029
| 2022 –2029 | |
| USD 4,083,989.40 Thousand | |
| USD 5,679,815.98 Thousand | |
| % | |
|
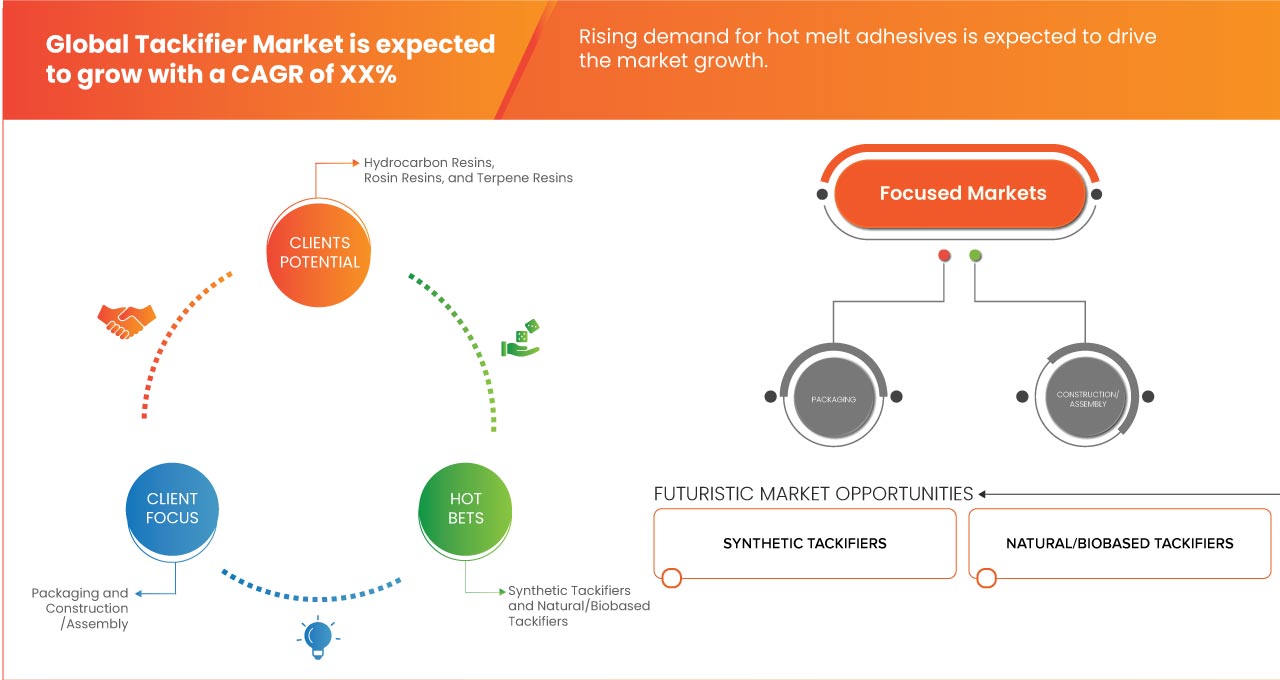
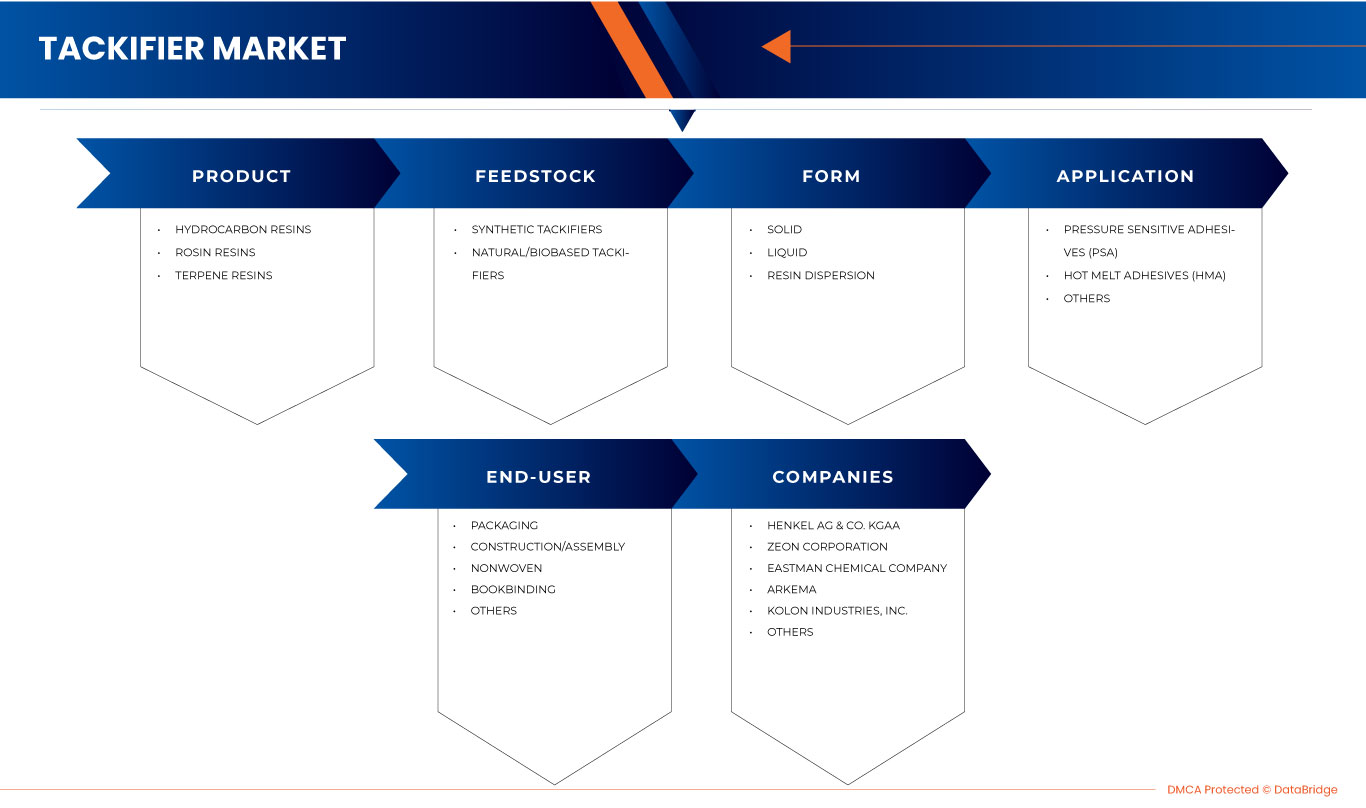
Mercado global de agentes de pegajosidad, por producto (resinas de hidrocarburos, resinas de colofonia y resinas de terpeno), materia prima (agentes de pegajosidad sintéticos, agentes de pegajosidad naturales/de base biológica), forma (sólido, líquido y dispersión de resina), aplicación ( adhesivos sensibles a la presión (PSA) , adhesivos termofusibles (HMA) y otros), usuario final (embalaje, construcción/montaje, no tejidos, encuadernación y otros): tendencias de la industria y pronóstico hasta 2030.
Análisis y perspectivas del mercado de adhesivos
El mercado mundial de adhesivos está preparado para un crecimiento sólido impulsado por la creciente industria de los adhesivos, en particular en las economías emergentes, así como por la creciente demanda de soluciones adhesivas respetuosas con el medio ambiente. Los principales factores restrictivos incluyen la volatilidad de los precios de las materias primas y los desafíos regulatorios asociados con ciertos tipos de adhesivos. No obstante, la creciente conciencia de la sostenibilidad y los esfuerzos de investigación y desarrollo en curso presentan vías prometedoras para la innovación en adhesivos, que atienden a diversas aplicaciones industriales. Además, la competencia dentro del mercado requiere un posicionamiento estratégico y una diferenciación de productos entre los fabricantes para mantener una ventaja competitiva. En resumen, el mercado de adhesivos exhibe un fuerte potencial de crecimiento con oportunidades para avances ecológicos, aunque con ciertos desafíos que requieren estrategias prudentes.
Data Bridge Market Research analiza que se espera que el mercado global de adhesivos alcance los USD 5.679.815,98 mil para 2030 desde USD 4.083.989,40 mil en 2022, creciendo con una CAGR sustancial del 4,5% en el período de pronóstico de 2023 a 2030.
|
Métrica del informe |
Detalles |
|
Período de pronóstico |
2023 a 2030 |
|
Año base |
2022 |
|
Años históricos |
2021 (Personalizable para 2015-2020) |
|
Unidades cuantitativas |
Ingresos en miles de USD y volumen en toneladas |
|
Segmentos cubiertos |
Producto (resinas de hidrocarburos, resinas de colofonia y resinas de terpeno), materia prima (agentes de pegajosidad sintéticos, agentes de pegajosidad naturales o de origen biológico), forma (sólido, líquido y dispersión de resina), aplicación (adhesivos sensibles a la presión [PSA], adhesivos termofusibles [HMA] y otros), usuario final (embalaje, construcción/montaje, telas no tejidas, encuadernación y otros) |
|
Países cubiertos |
EE. UU., Canadá, México, Alemania, Francia, Reino Unido, Rusia, Italia, España, Países Bajos, Polonia, Suiza, Bélgica, Suecia, Turquía, Dinamarca, Noruega, Finlandia, Resto de Europa, China, Japón, India, Corea del Sur, Australia, Nueva Zelanda, Singapur, Taiwán, Tailandia, Indonesia, Malasia, Filipinas, Vietnam, Resto de Asia-Pacífico, Brasil, Argentina, Resto de Sudamérica, Arabia Saudita, Emiratos Árabes Unidos, Israel, Sudáfrica, Egipto, Kuwait, Qatar, Omán, Baréin y Resto de Medio Oriente y África |
|
Actores del mercado cubiertos |
Henkel AG & Co. KGa, ZEON CORPORATION, Eastman Chemical Company, Arkema, Kolon Industries, Inc., HB Fuller Company, BASF SE, Exxon Mobil Corporation, SI Group, Inc., KRATON CORPORATION, Cray Valley, Arakawa Chemical Industries, Ltd., YASUHARA CHEMICAL CO., LTD., Lawter, Harima Chemicals Group, Inc., Lesco Chemical Limited, TECKREZ, INC., Henan Anglxxon Chemical Co., Ltd. y Robert Kraemer GmbH & Co. KG |
Definición de mercado
Los agentes de pegajosidad son aditivos que mejoran la adherencia de los materiales adhesivos, facilitando la adhesión a diferentes superficies y sustratos. Este mercado abarca una amplia gama de sectores, incluidos, entre otros, el embalaje, la automoción, la construcción, la carpintería y la fabricación, donde los agentes de pegajosidad son fundamentales para garantizar el rendimiento, la durabilidad y la funcionalidad de los productos adhesivos. El mercado global de agentes de pegajosidad se refiere a la industria colectiva que abarca la producción, distribución y utilización de agentes o sustancias de pegajosidad diseñados para mejorar las propiedades adhesivas de diversos materiales, incluidos adhesivos, selladores, revestimientos y cintas.
Dinámica del mercado mundial de adhesivos
En esta sección se aborda la comprensión de los factores impulsores, las ventajas, las oportunidades, las limitaciones y los desafíos del mercado. Todo esto se analiza en detalle a continuación:
Conductores
Aumento del uso de adhesivos en diferentes industrias de usuarios finales
El uso de agentes de pegajosidad ha experimentado un notable auge, impulsado principalmente por las crecientes necesidades de diversas industrias de usuarios finales (embalaje, automoción, electrónica y construcción). Este aumento es particularmente evidente en sectores clave como el embalaje, la automoción, la construcción y la electrónica, cada uno de los cuales desempeña un papel fundamental en el impulso del crecimiento de los agentes de pegajosidad en el mercado.
Demanda creciente de adhesivos termofusibles
Los adhesivos termofusibles ofrecen un método de unión rápido y fiable que no solo mejora la eficiencia de la producción, sino que también contribuye a la sostenibilidad medioambiental. Además, la versatilidad de los adhesivos termofusibles los hace adecuados para una amplia gama de aplicaciones, lo que aumenta aún más su demanda. Industrias como la del embalaje, la automoción, la construcción y la electrónica han adoptado cada vez más los adhesivos termofusibles debido a su capacidad para mejorar el rendimiento del producto, reducir los residuos y bajar los costes de producción.
Restricción
- Fluctuación en el precio de las materias primas
Los adhesivos, un elemento clave en las formulaciones de adhesivos, enfrentan un desafío significativo en forma de fluctuaciones en los precios de las materias primas. Los adhesivos son componentes críticos en los adhesivos que proporcionan la pegajosidad y la adhesión necesarias para diversas industrias. Sin embargo, la volatilidad en los precios de las materias primas clave para la producción de adhesivos impone restricciones al crecimiento de la industria.
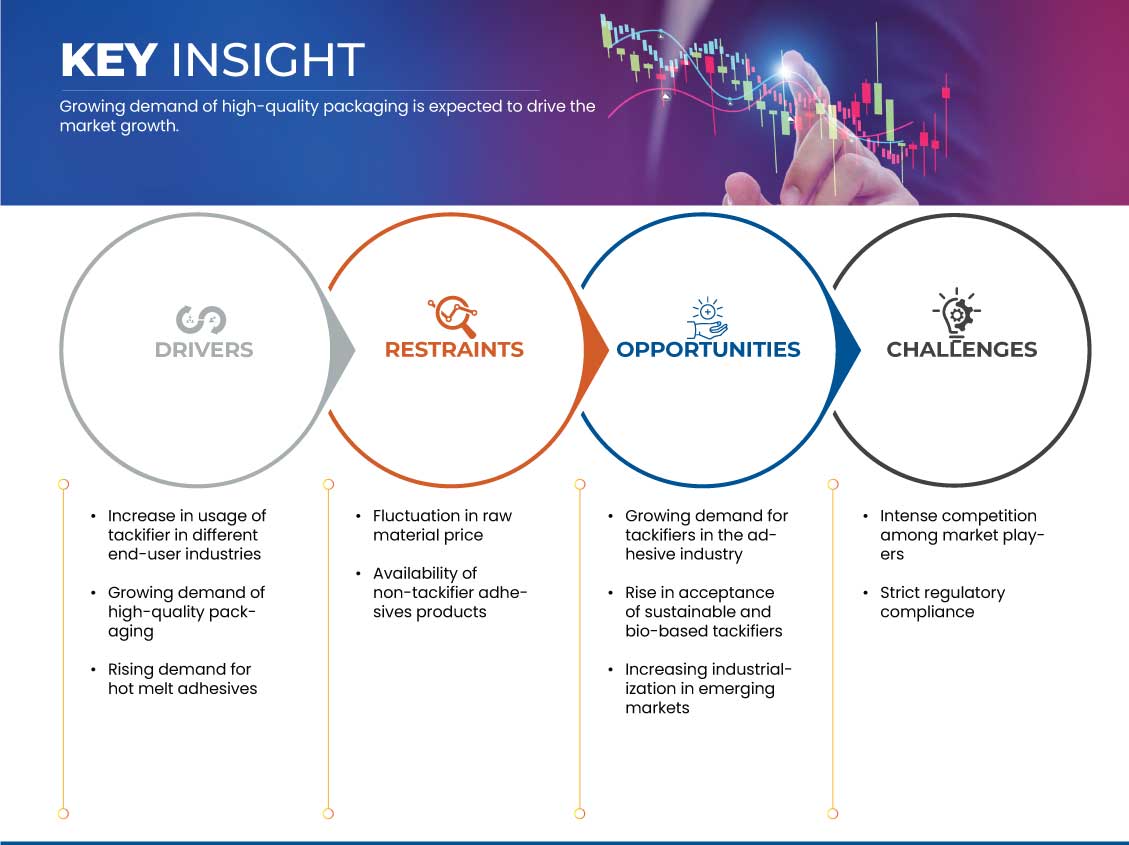
Oportunidad
- Demanda creciente de agentes de pegajosidad en la industria de los adhesivos
La creciente demanda de agentes de pegajosidad en la industria de los adhesivos representa una oportunidad importante tanto para los fabricantes como para los inversores. Los agentes de pegajosidad son componentes esenciales de los adhesivos, ya que mejoran el rendimiento del adhesivo al mejorar la adherencia, la resistencia al desprendimiento y las capacidades generales de adhesión. Con una gama de aplicaciones en constante expansión en diversas industrias, incluidas la automotriz, la construcción, el embalaje y la atención médica, la industria de los adhesivos está preparada para un crecimiento sustancial.
Desafío
- Intensa competencia entre los actores del mercado
En el dinámico entorno empresarial actual, la competencia es una característica definitoria de casi todas las industrias. Sin embargo, el nivel de competencia se ha intensificado significativamente en los últimos años en varios sectores, lo que plantea un desafío formidable para los actores del mercado en todo el mundo. Este fenómeno de creciente competencia intensa es un desafío multifacético que exige atención, adaptación estratégica y enfoques innovadores para prosperar en el mercado.
Acontecimientos recientes
- En abril de 2023, Cray Valley de TotalEnergies completó la venta de tres líneas de productos (Wingtack, PolyBD y Dymalink) a Pacific Avenue Capital Partners. La adquisición abarca cuatro plantas de producción en EE. UU., la filial de Cray Valley en Italia y la cartera de clientes asociada. Esta operación se alinea con las decisiones estratégicas de TotalEnergies de optimizar su cartera de negocios. Esto ayuda a la empresa a centrarse en sus negocios globales de resinas monoméricas puras y C4 especiales que TotalEnergies seguirá desarrollando.
- En marzo de 2022, Eastman Chemical Company finalizó con éxito la venta de su negocio de resinas adhesivas a Synthomer plc. Este movimiento estratégico implicó la transferencia de varias líneas de productos, como resinas de hidrocarburos, resinas monoméricas puras, polímeros de poliolefina, colofonias, dispersiones y resinas oleoquímicas y basadas en ácidos grasos, todas ellas anteriormente pertenecientes al segmento de Aditivos y Productos Funcionales de Eastman.
- En marzo de 2020, Harima Chemicals Group anunció una asociación con Takasago International Corporation. En esta colaboración, TAKASAGO adquirió todas las acciones (ratio accionario: 2,3 %) que anteriormente tenía Mitsubishi Corporation en la filial de Harima, LAWTER BV (Países Bajos). Esta operación estableció a HARIMA y TAKASAGO como propietarios exclusivos de la participación en la filial. Esta colaboración ayudó a la empresa en la fabricación de trementina.
Alcance del mercado mundial de adhesivos
El mercado global de adhesivos está segmentado en cinco segmentos notables según el producto, la materia prima, la forma, la aplicación y el usuario final. El crecimiento entre segmentos le ayuda a analizar nichos de crecimiento y estrategias para abordar el mercado y determinar sus áreas de aplicación principales y la diferencia en sus mercados objetivo.
Producto
- Resinas de hidrocarburos
- Resinas de colofonia
- Resinas terpénicas
Sobre la base del producto, el mercado global de agentes pegajosos está segmentado en resinas de hidrocarburos, resinas de colofonia y resinas terpénicas.
Materia prima
- Agentes de pegajosidad sintéticos
- Adhesivos naturales/de origen biológico
Sobre la base de la materia prima, el mercado global de adhesivos se segmenta en adhesivos sintéticos y adhesivos naturales/de base biológica.
Forma
- Sólido
- Líquido
- Dispersión de resina
Sobre la base de la forma, el mercado global de agentes de pegajosidad se segmenta en sólidos, líquidos y dispersiones de resina.
Solicitud
- Adhesivos sensibles a la presión (PSA)
- Adhesivos termofusibles (HMA)
- Otros
Sobre la base de la aplicación, el mercado global de adhesivos está segmentado en adhesivos sensibles a la presión (PSA), adhesivos termofusibles (HMA) y otros.
Usuario final
- Embalaje
- Construcción/Montaje
- No tejido
- Encuadernación
- Otros
Sobre la base del usuario final, el mercado global de agentes adhesivos se segmenta en embalaje, encuadernación, no tejidos, construcción/ensamblaje y otros.
Análisis y perspectivas de la región del mercado mundial de adhesivos
Se analiza el mercado global de adhesivos y se proporciona información sobre el tamaño del mercado por país, producto, materia prima, forma, aplicación y usuario final.
Los países cubiertos en el informe de mercado global de adhesivos son EE. UU., Canadá, México, Alemania, Francia, Reino Unido, Rusia, Italia, España, Países Bajos, Polonia, Suiza, Bélgica, Suecia, Turquía, Dinamarca, Noruega, Finlandia, Resto de Europa, China, Japón, India, Corea del Sur, Australia, Nueva Zelanda, Singapur, Taiwán, Tailandia, Indonesia, Malasia, Filipinas, Vietnam, Resto de Asia-Pacífico, Brasil, Argentina, Resto de Sudamérica, Arabia Saudita, Emiratos Árabes Unidos, Israel, Sudáfrica, Egipto, Kuwait, Qatar, Omán, Bahréin y Resto de Medio Oriente y África.
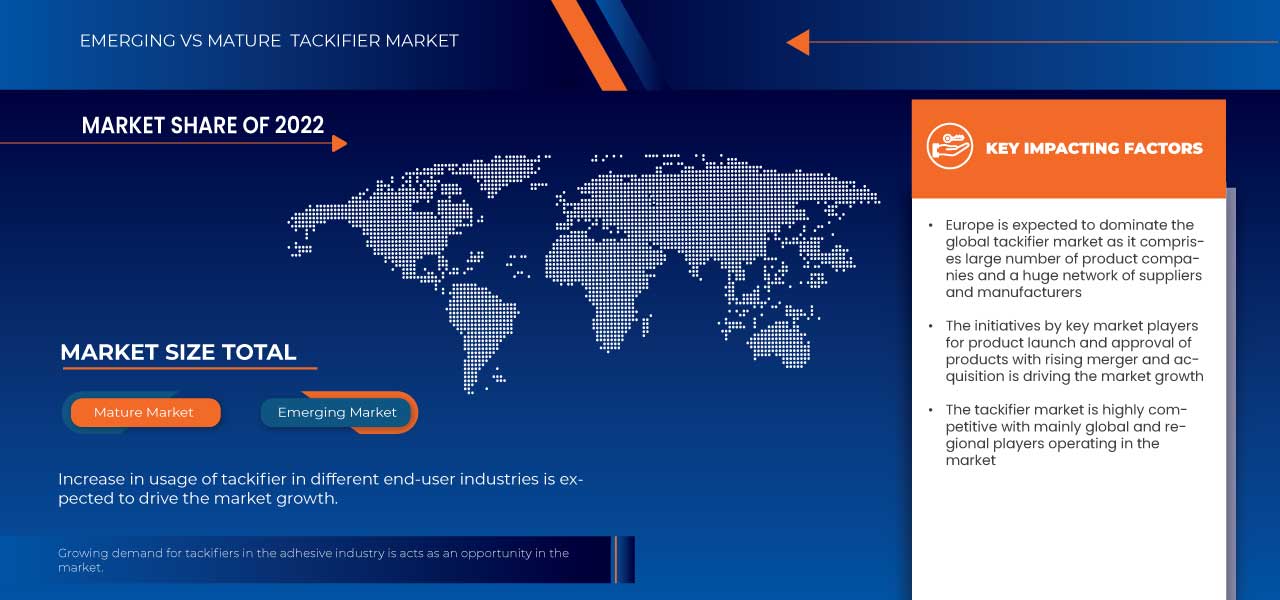
Se espera que Europa domine el mercado mundial de adhesivos debido a varios factores clave, que incluyen tecnología avanzada, infraestructura sólida y un fuerte compromiso con la sostenibilidad. Se espera que el Reino Unido domine el mercado europeo de adhesivos, ya que existe un aumento en la combinación de experiencia tecnológica, innovación sostenible y una red de distribución eficiente. Se espera que la región de Asia y el Pacífico crezca en el mercado mundial de adhesivos debido a la presencia de sectores industriales prósperos, una población en aumento y un énfasis cada vez mayor en las prácticas sostenibles. China, en particular, desempeña un papel fundamental en la configuración de la dinámica del mercado de adhesivos dentro de la región de Asia y el Pacífico. América del Norte se destaca como la segunda región de más rápido crecimiento en el mercado mundial de adhesivos, exhibiendo una expansión notable impulsada por varios factores, que incluyen una creciente industrialización, avances tecnológicos y un énfasis creciente en soluciones adhesivas sostenibles. Estados Unidos desempeña un papel fundamental, con su sólido sector manufacturero, tecnologías adhesivas innovadoras y un fuerte compromiso con los productos respetuosos con el medio ambiente.
La sección de países del informe también proporciona factores individuales que impactan en el mercado y cambios en la regulación en el mercado a nivel nacional que afectan las tendencias actuales y futuras del mercado. Los puntos de datos como nuevas ventas, ventas de reemplazo, demografía del país, leyes regulatorias y aranceles de importación y exportación son algunos de los principales indicadores utilizados para pronosticar el escenario del mercado para países individuales. Además, la presencia y disponibilidad de marcas globales y sus desafíos enfrentados debido a la competencia grande o escasa de las marcas locales y nacionales, y el impacto de los canales de venta se consideran al proporcionar un análisis de pronóstico de los datos del país.
Análisis del panorama competitivo y de la cuota de mercado global de adhesivos
El panorama competitivo del mercado global de adhesivos proporciona detalles de los competidores. Los detalles incluidos son una descripción general de la empresa, las finanzas de la empresa, los ingresos generados, el potencial de mercado, la inversión en I+D, las nuevas iniciativas de mercado, los sitios e instalaciones de producción, las fortalezas y debilidades de la empresa, el lanzamiento de productos, las aprobaciones de productos, la amplitud y la extensión de los productos, el dominio de las aplicaciones y la curva de vida útil del tipo de producto. Los puntos de datos proporcionados anteriormente solo están relacionados con el enfoque de la empresa en el mercado.
Algunos de los principales actores del mercado que operan en el mercado global de adhesivos son Henkel AG & Co. KGaA, ZEON CORPORATION, Eastman Chemical Company, Arkema, Kolon Industries, Inc., HB Fuller Company, BASF SE, Exxon Mobil Corporation, SI Group, Inc., KRATON CORPORATION, Cray Valley, Arakawa Chemical Industries, Ltd., YASUHARA CHEMICAL CO., LTD., Lawter, A Harima Chemicals, Inc. Company, Lesco Chemical Limited, TECKREZ, INC., Henan Anglxxon Chemical Co., Ltd. y Robert Kraemer GmbH & Co. KG, entre otros.
SKU-
Obtenga acceso en línea al informe sobre la primera nube de inteligencia de mercado del mundo

- Panel de análisis de datos interactivo
- Panel de análisis de empresas para oportunidades con alto potencial de crecimiento
- Acceso de analista de investigación para personalización y consultas
- Análisis de la competencia con panel interactivo
- Últimas noticias, actualizaciones y análisis de tendencias
- Aproveche el poder del análisis de referencia para un seguimiento integral de la competencia
Tabla de contenido
1 INTRODUCTION
1.1 OBJECTIVES OF THE STUDY
1.2 MARKET DEFINITION
1.3 OVERVIEW OF THE GLOBAL TACKIFIER MARKET
1.4 CURRENCY AND PRICING
1.5 LIMITATIONS
1.6 MARKETS COVERED
2 MARKET SEGMENTATION
2.1 MARKETS COVERED
2.2 YEARS CONSIDERED FOR THE STUDY
2.3 GEOGRAPHIC SCOPE
2.4 DBMR TRIPOD DATA VALIDATION MODEL
2.5 PRIMARY INTERVIEWS WITH KEY OPINION LEADERS
2.6 DBMR MARKET POSITION GRID
2.7 MARKET APPLICATION COVERAGE GRID
2.8 MULTIVARIATE MODELLING
2.9 PRODUCT CURVE
2.1 SECONDARY SOURCES
2.11 ASSUMPTIONS
3 EXECUTIVE SUMMARY
4 PREMIUM INSIGHTS
4.1 PRODUCTION VOLUME ESTIMATES BY TACKIFIER TYPE AND COUNTRY
5 MARKET OVERVIEW
5.1 DRIVERS
5.1.1 INCREASE IN THE USAGE OF TACKIFIER IN DIFFERENT END-USER INDUSTRIES
5.1.2 GROWING DEMAND FOR HIGH-QUALITY PACKAGING
5.1.3 RISING DEMAND FOR HOT MELT ADHESIVES
5.2 RESTRAINTS
5.2.1 FLUCTUATION IN RAW MATERIAL PRICE
5.2.2 AVAILABILITY OF NON-TACKIFIER ADHESIVES PRODUCTS
5.3 OPPORTUNITIES
5.3.1 GROWING DEMAND FOR TACKIFIERS IN THE ADHESIVE INDUSTRY
5.3.2 RISE IN ACCEPTANCE OF SUSTAINABLE AND BIO-BASED TACKIFIERS
5.3.3 INCREASING INDUSTRIALIZATION IN EMERGING MARKETS
5.4 CHALLENGES
5.4.1 INTENSE COMPETITION AMONG MARKET PLAYERS
5.4.2 STRICT REGULATORY COMPLIANCE
6 GLOBAL TACKIFIER MARKET, BY PRODUCT
6.1 OVERVIEW
6.2 HYDROCARBON RESINS
6.3 ROSIN RESINS
6.4 TERPENE RESINS
7 GLOBAL TACKIFIER MARKET, BY FEEDSTOCK
7.1 OVERVIEW
7.2 SYNTHETIC TACKIFIERS
7.3 NATURAL/BIOBASED TACKIFIERS
8 GLOBAL TACKIFIER MARKET, BY FORM
8.1 OVERVIEW
8.2 SOLID
8.3 LIQUID
8.4 RESIN DISPERSION
9 GLOBAL TACKIFIER MARKET, BY APPLICATION
9.1 OVERVIEW
9.2 PRESSURE SENSITIVE ADHESIVES (PSA)
9.3 HOT MELT ADHESIVES (HMA)
9.4 OTHERS
10 GLOBAL TACKIFIER MARKET, BY END-USER
10.1 OVERVIEW
10.2 PACKAGING
10.2.1 BY TYPE
10.2.1.1 FOOD AND BEVERAGES
10.2.1.2 CONSUMER GOODS
10.2.1.3 PHARMACEUTICAL AND COSMETICS
10.2.1.4 MEDICAL
10.2.1.5 INDUSTRIAL PACKAGING
10.2.1.6 AUTOMOTIVE
10.2.1.7 OTHERS
10.2.2 BY PRODUCT
10.2.2.1 HYDROCARBON RESINS
10.2.2.2 ROSIN RESINS
10.2.2.3 TERPENE RESINS
10.3 CONSTRUCTION/ASSEMBLY
10.3.1 BY TYPE
10.3.1.1 INDUSTRIAL
10.3.1.2 COMMERCIAL
10.3.1.3 RESIDENTIAL
10.3.2 BY PRODUCT
10.3.2.1 HYDROCARBON RESINS
10.3.2.2 ROSIN RESINS
10.3.2.3 TERPENE RESINS
10.4 NONWOVEN
10.4.1 BY PRODUCT
10.4.1.1 HYDROCARBON RESINS
10.4.1.2 ROSIN RESINS
10.4.1.3 TERPENE RESINS
10.5 BOOKBINDING
10.5.1 BY PRODUCT
10.5.1.1 HYDROCARBON RESINS
10.5.1.2 ROSIN RESINS
10.5.1.3 TERPENE RESINS
10.6 OTHERS
10.6.1 BY PRODUCT
10.6.1.1 HYDROCARBON RESINS
10.6.1.2 ROSIN RESINS
10.6.1.3 TERPENE RESINS
11 GLOBAL TACKIFIER MARKET, BY REGION
11.1 OVERVIEW
11.2 EUROPE
11.2.1 U.K.
11.2.2 GERMANY
11.2.3 FRANCE
11.2.4 SPAIN
11.2.5 ITALY
11.2.6 RUSSIA
11.2.7 NETHERLANDS
11.2.8 SWITZERLAND
11.2.9 DENMARK
11.2.10 SWEDEN
11.2.11 POLAND
11.2.12 BELGIUM
11.2.13 TURKEY
11.2.14 NORWAY
11.2.15 FINLAND
11.2.16 REST OF EUROPE
11.3 NORTH AMERICA
11.3.1 U.S.
11.3.2 CANADA
11.3.3 MEXICO
11.4 SOUTH AMERICA
11.4.1 BRAZIL
11.4.2 ARGENTINA
11.4.3 REST OF SOUTH AMERICA
11.5 MIDDLE EAST AND AFRICA
11.5.1 SOUTH AFRICA
11.5.2 SAUDI ARABIA
11.5.3 U.A.E.
11.5.4 EGYPT
11.5.5 ISRAEL
11.5.6 QATAR
11.5.7 KUWAIT
11.5.8 OMAN
11.5.9 BAHRAIN
11.5.10 REST OF MIDDLE EAST AND AFRICA
11.6 ASIA-PACIFIC
11.6.1 CHINA
11.6.2 JAPAN
11.6.3 SOUTH KOREA
11.6.4 INDIA
11.6.5 AUSTRALIA
11.6.6 SINGAPORE
11.6.7 THAILAND
11.6.8 MALAYSIA
11.6.9 INDONESIA
11.6.10 TAIWAN
11.6.11 NEW ZEALAND
11.6.12 PHILIPPINES
11.6.13 VIETNAM
11.6.14 REST OF ASIA-PACIFIC
12 GLOBAL TACKIFIER MARKET, COMPANY LANDSCAPE
12.1 COMPANY SHARE ANALYSIS: GLOBAL
13 EUROPE TACKIFIER MARKET, COMPANY LANDSCAPE
13.1 COMPANY SHARE ANALYSIS: EUROPE
14 ASIA-PACIFIC TACKIFIER MARKET, COMPANY LANDSCAPE
14.1 COMPANY SHARE ANALYSIS: ASIA-PACIFIC
15 NORTH AMERICA TACKIFIER MARKET, COMPANY
15.1 COMPANY SHARE ANALYSIS: NORTH AMERICA
16 SWOT ANALYSIS
17 COMPANY PROFILES
17.1 HENKEL AG & CO. KGAA
17.1.1 COMPANY SNAPSHOT
17.1.2 REVENUE ANALYSIS
17.1.3 COMPANY SHARE ANALYSIS
17.1.4 PRODUCT PORTFOLIO
17.1.5 RECENT DEVELOPMENT
17.2 ZEON CORPORATION
17.2.1 COMPANY SNAPSHOT
17.2.2 REVENUE ANALYSIS
17.2.3 COMPANY SHARE ANALYSIS
17.2.4 PRODUCT PORTFOLIO
17.2.5 RECENT DEVELOPMENTS
17.3 EASTMAN CHEMICAL COMPANY
17.3.1 COMPANY SNAPSHOT
17.3.2 REVENUE ANALYSIS
17.3.3 COMPANY SHARE ANALYSIS
17.3.4 PRODUCT PORTFOLIO
17.3.5 RECENT DEVELOPMENTS
17.4 ARKEMA
17.4.1 COMPANY SNAPSHOT
17.4.2 REVENUE ANALYSIS
17.4.3 COMPANY SHARE ANALYSIS
17.4.4 PRODUCT PORTFOLIO
17.4.5 RECENT DEVELOPMENTS
17.5 KOLON INDUSTRIES, INC
17.5.1 COMPANY SNAPSHOT
17.5.2 REVENUE ANALYSIS
17.5.3 COMPANY SHARE ANALYSIS
17.5.4 SOLUTION PORTFOLIO
17.5.5 RECENT DEVELOPMENTS
17.6 ARAKAWA CHEMICAL INDUSTRIES, LTD.
17.6.1 COMPANY SNAPSHOT
17.6.2 REVENUE ANALYSIS
17.6.3 PRODUCT PORTFOLIO
17.6.4 RECENT DEVELOPMENT
17.7 BASF SE
17.7.1 COMPANY SNAPSHOT
17.7.2 REVENUE ANALYSIS
17.7.3 PRODUCT PORTFOLIO
17.7.4 RECENT DEVELOPMENTS
17.8 CRAY VALLEY
17.8.1 COMPANY SNAPSHOT
17.8.2 SOLUTION PORTFOLIO
17.8.3 RECENT DEVELOPMENTS
17.9 EXXON MOBIL CORPORATION
17.9.1 COMPANY SNAPSHOT
17.9.2 REVENUE ANALYSIS
17.9.3 SOLUTION PORTFOLIO
17.9.4 RECENT DEVELOPMENT
17.1 HARIMA CHEMICALS GROUP, INC.
17.10.1 COMPANY SNAPSHOT
17.10.2 REVENUE ANALYSIS
17.10.3 SOLUTION PORTFOLIO
17.10.4 RECENT DEVELOPMENT
17.11 H.B. FULLER COMPANY
17.11.1 COMPANY SNAPSHOT
17.11.2 REVENUE ANALYSIS
17.11.3 SOLUTION PORTFOLIO
17.11.4 RECENT DEVELOPMENTS
17.12 HENAN ANGLXXON CHEMICAL CO.,LTD.
17.12.1 COMPANY SNAPSHOT
17.12.2 PRODUCT PORTFOLIO
17.12.3 RECENT DEVELOPMENT
17.13 KRATON CORPORATION
17.13.1 COMPANY SNAPSHOT
17.13.2 SOLUTION PORTFOLIO
17.13.3 RECENT DEVELOPMENTS
17.14 LESCO CHEMICAL LIMITED
17.14.1 COMPANY SNAPSHOT
17.14.2 PRODUCT PORTFOLIO
17.14.3 RECENT DEVELOPMENTS
17.15 ROBERT KRAEMER GMBH & CO. KG
17.15.1 COMPANY SNAPSHOT
17.15.2 PRODUCT PORTFOLIO
17.15.3 RECENT DEVELOPMENTS
17.16 SI GROUP, INC.
17.16.1 COMPANY SNAPSHOT
17.16.2 SOLUTION PORTFOLIO
17.16.3 RECENT DEVELOPMENTS
17.17 TECKREZ, INC.
17.17.1 COMPANY SNAPSHOT
17.17.2 PRODUCT PORTFOLIO
17.17.3 RECENT DEVELOPMENT
17.18 YASUHARA CHEMICAL CO., LTD
17.18.1 COMPANY SNAPSHOT
17.18.2 REVENUE ANALYSIS
17.18.3 PRODUCT PORTFOLIO
17.18.4 RECENT DEVELOPMENTS
18 QUESTIONNAIRE
19 RELATED REPORTS
Lista de Tablas
TABLE 1 GLOBAL TACKIFIER MARKET, BY PRODUCT, 2014-2030 (USD THOUSAND)
TABLE 2 GLOBAL HYDROCARBON RESINS IN TACKIFIER MARKET, BY REGION, 2014-2030 (USD THOUSAND)
TABLE 3 GLOBAL ROSIN RESINS IN TACKIFIER MARKET, BY REGION, 2014-2030 (USD THOUSAND)
TABLE 4 GLOBAL TERPENE RESINS IN TACKIFIER MARKET, BY REGION, 2014-2030 (USD THOUSAND)
TABLE 5 GLOBAL TACKIFIER MARKET, BY FEEDSTOCK, 2014-2030 (USD THOUSAND)
TABLE 6 GLOBAL SYNTHETIC TACKIFIERS IN TACKIFIER MARKET, BY REGION, 2014-2030 (USD THOUSAND)
TABLE 7 GLOBAL NATURAL/BIOBASED TACKIFIERS IN TACKIFIER MARKET, BY REGION, 2014-2030 (USD THOUSAND)
TABLE 8 GLOBAL TACKIFIER MARKET, BY FORM, 2014-2030 (USD THOUSAND)
TABLE 9 GLOBAL SOLID IN TACKIFIER MARKET, BY REGION, 2014-2030 (USD THOUSAND)
TABLE 10 GLOBAL LIQUID IN TACKIFIER MARKET, BY REGION, 2014-2030 (USD THOUSAND)
TABLE 11 GLOBAL RESIN DISPERSION IN TACKIFIER MARKET, BY REGION, 2014-2030 (USD THOUSAND)
TABLE 12 GLOBAL TACKIFIER MARKET, BY APPLICATION, 2014-2030 (USD THOUSAND)
TABLE 13 GLOBAL PRESSURE SENSITIVE ADHESIVES (PSA) IN TACKIFIER MARKET, BY REGION, 2014-2030 (USD THOUSAND)
TABLE 14 GLOBAL HOT MELT ADHESIVES (HMA) IN TACKIFIER MARKET, BY REGION, 2014-2030 (USD THOUSAND)
TABLE 15 GLOBAL OTHERS IN TACKIFIER MARKET, BY REGION, 2014-2030 (USD THOUSAND)
TABLE 16 GLOBAL TACKIFIER MARKET, BY END-USER, 2014-2030 (USD THOUSAND)
TABLE 17 GLOBAL PACKAGING IN TACKIFIER MARKET, BY REGION, 2014-2030 (USD THOUSAND)
TABLE 18 GLOBAL PACKAGING IN TACKIFIER MARKET, BY TYPE, 2014-2030 (USD THOUSAND)
TABLE 19 GLOBAL PACKAGING IN TACKIFIER MARKET, BY PRODUCT, 2014-2030 (USD THOUSAND)
TABLE 20 GLOBAL CONSTRUCTION/ASSEMBLY IN TACKIFIER MARKET, BY REGION, 2014-2030 (USD THOUSAND)
TABLE 21 GLOBAL CONSTRUCTION/ASSEMBLY IN TACKIFIER MARKET, BY TYPE, 2014-2030 (USD THOUSAND)
TABLE 22 GLOBAL CONSTRUCTION/ASSEMBLY IN TACKIFIER MARKET, BY PRODUCT, 2014-2030 (USD THOUSAND)
TABLE 23 GLOBAL NONWOVEN IN TACKIFIER MARKET, BY REGION, 2014-2030 (USD THOUSAND)
TABLE 24 GLOBAL NONWOVEN IN TACKIFIER MARKET, BY PRODUCT, 2014-2030 (USD THOUSAND)
TABLE 25 GLOBAL BOOKBINDING IN TACKIFIER MARKET, BY REGION, 2014-2030 (USD THOUSAND)
TABLE 26 GLOBAL BOOKBINDING IN TACKIFIER MARKET, BY PRODUCT, 2014-2030 (USD THOUSAND)
TABLE 27 GLOBAL OTHERS IN TACKIFIER MARKET, BY REGION, 2014-2030 (USD THOUSAND)
TABLE 28 GLOBAL OTHERS IN TACKIFIER MARKET, BY PRODUCT, 2014-2030 (USD THOUSAND)
TABLE 29 GLOBAL TACKIFIER MARKET, BY REGION, 2014-2030 (USD THOUSAND)
TABLE 30 EUROPE TACKIFIER MARKET, BY COUNTRY, 2014-2030 (USD THOUSAND)
TABLE 31 EUROPE TACKIFIER MARKET, BY PRODUCT, 2014-2030 (USD THOUSAND)
TABLE 32 EUROPE TACKIFIER MARKET, BY FEEDSTOCK, 2014-2030 (USD THOUSAND)
TABLE 33 EUROPE TACKIFIER MARKET, BY FORM, 2014-2030 (USD THOUSAND)
TABLE 34 EUROPE TACKIFIER MARKET, BY APPLICATION, 2014-2030 (USD THOUSAND)
TABLE 35 EUROPE TACKIFIER MARKET, BY END-USER, 2014-2030 (USD THOUSAND)
TABLE 36 EUROPE PACKAGING IN TACKIFIER MARKET, BY TYPE, 2014-2030 (USD THOUSAND)
TABLE 37 EUROPE PACKAGING IN TACKIFIER MARKET, BY PRODUCT, 2014-2030 (USD THOUSAND)
TABLE 38 EUROPE CONSTRUCTION/ASSEMBLY IN TACKIFIER MARKET, BY TYPE, 2014-2030 (USD THOUSAND)
TABLE 39 EUROPE CONSTRUCTION/ASSEMBLY IN TACKIFIER MARKET, BY PRODUCT, 2014-2030 (USD THOUSAND)
TABLE 40 EUROPE NONWOVEN IN TACKIFIER MARKET, BY PRODUCT, 2014-2030 (USD THOUSAND)
TABLE 41 EUROPE BOOKBINDING IN TACKIFIER MARKET, BY PRODUCT, 2014-2030 (USD THOUSAND)
TABLE 42 EUROPE OTHERS IN TACKIFIER MARKET, BY PRODUCT, 2014-2030 (USD THOUSAND)
TABLE 43 U.K. TACKIFIER MARKET, BY PRODUCT, 2014-2030 (USD THOUSAND)
TABLE 44 U.K. TACKIFIER MARKET, BY FEEDSTOCK, 2014-2030 (USD THOUSAND)
TABLE 45 U.K. TACKIFIER MARKET, BY FORM, 2014-2030 (USD THOUSAND)
TABLE 46 U.K. TACKIFIER MARKET, BY APPLICATION, 2014-2030 (USD THOUSAND)
TABLE 47 U.K. TACKIFIER MARKET, BY END-USER, 2014-2030 (USD THOUSAND)
TABLE 48 U.K. PACKAGING IN TACKIFIER MARKET, BY TYPE, 2014-2030 (USD THOUSAND)
TABLE 49 U.K. PACKAGING IN TACKIFIER MARKET, BY PRODUCT, 2014-2030 (USD THOUSAND)
TABLE 50 U.K. CONSTRUCTION/ASSEMBLY IN TACKIFIER MARKET, BY TYPE, 2014-2030 (USD THOUSAND)
TABLE 51 U.K. CONSTRUCTION/ASSEMBLY IN TACKIFIER MARKET, BY PRODUCT, 2014-2030 (USD THOUSAND)
TABLE 52 U.K. NONWOVEN IN TACKIFIER MARKET, BY PRODUCT, 2014-2030 (USD THOUSAND)
TABLE 53 U.K. BOOKBINDING IN TACKIFIER MARKET, BY PRODUCT, 2014-2030 (USD THOUSAND)
TABLE 54 U.K. OTHERS IN TACKIFIER MARKET, BY PRODUCT, 2014-2030 (USD THOUSAND)
TABLE 55 GERMANY TACKIFIER MARKET, BY PRODUCT, 2014-2030 (USD THOUSAND)
TABLE 56 GERMANY TACKIFIER MARKET, BY FEEDSTOCK, 2014-2030 (USD THOUSAND)
TABLE 57 GERMANY TACKIFIER MARKET, BY FORM, 2014-2030 (USD THOUSAND)
TABLE 58 GERMANY TACKIFIER MARKET, BY APPLICATION, 2014-2030 (USD THOUSAND)
TABLE 59 GERMANY TACKIFIER MARKET, BY END-USER, 2014-2030 (USD THOUSAND)
TABLE 60 GERMANY PACKAGING IN TACKIFIER MARKET, BY TYPE, 2014-2030 (USD THOUSAND)
TABLE 61 GERMANY PACKAGING IN TACKIFIER MARKET, BY PRODUCT, 2014-2030 (USD THOUSAND)
TABLE 62 GERMANY CONSTRUCTION/ASSEMBLY IN TACKIFIER MARKET, BY TYPE, 2014-2030 (USD THOUSAND)
TABLE 63 GERMANY CONSTRUCTION/ASSEMBLY IN TACKIFIER MARKET, BY PRODUCT, 2014-2030 (USD THOUSAND)
TABLE 64 GERMANY NONWOVEN IN TACKIFIER MARKET, BY PRODUCT, 2014-2030 (USD THOUSAND)
TABLE 65 GERMANY BOOKBINDING IN TACKIFIER MARKET, BY PRODUCT, 2014-2030 (USD THOUSAND)
TABLE 66 GERMANY OTHERS IN TACKIFIER MARKET, BY PRODUCT, 2014-2030 (USD THOUSAND)
TABLE 67 FRANCE TACKIFIER MARKET, BY PRODUCT, 2014-2030 (USD THOUSAND)
TABLE 68 FRANCE TACKIFIER MARKET, BY FEEDSTOCK, 2014-2030 (USD THOUSAND)
TABLE 69 FRANCE TACKIFIER MARKET, BY FORM, 2014-2030 (USD THOUSAND)
TABLE 70 FRANCE TACKIFIER MARKET, BY APPLICATION, 2014-2030 (USD THOUSAND)
TABLE 71 FRANCE TACKIFIER MARKET, BY END-USER, 2014-2030 (USD THOUSAND)
TABLE 72 FRANCE PACKAGING IN TACKIFIER MARKET, BY TYPE, 2014-2030 (USD THOUSAND)
TABLE 73 FRANCE PACKAGING IN TACKIFIER MARKET, BY PRODUCT, 2014-2030 (USD THOUSAND)
TABLE 74 FRANCE CONSTRUCTION/ASSEMBLY IN TACKIFIER MARKET, BY TYPE, 2014-2030 (USD THOUSAND)
TABLE 75 FRANCE CONSTRUCTION/ASSEMBLY IN TACKIFIER MARKET, BY PRODUCT, 2014-2030 (USD THOUSAND)
TABLE 76 FRANCE NONWOVEN IN TACKIFIER MARKET, BY PRODUCT, 2014-2030 (USD THOUSAND)
TABLE 77 FRANCE BOOKBINDING IN TACKIFIER MARKET, BY PRODUCT, 2014-2030 (USD THOUSAND)
TABLE 78 FRANCE OTHERS IN TACKIFIER MARKET, BY PRODUCT, 2014-2030 (USD THOUSAND)
TABLE 79 SPAIN TACKIFIER MARKET, BY PRODUCT, 2014-2030 (USD THOUSAND)
TABLE 80 SPAIN TACKIFIER MARKET, BY FEEDSTOCK, 2014-2030 (USD THOUSAND)
TABLE 81 SPAIN TACKIFIER MARKET, BY FORM, 2014-2030 (USD THOUSAND)
TABLE 82 SPAIN TACKIFIER MARKET, BY APPLICATION, 2014-2030 (USD THOUSAND)
TABLE 83 SPAIN TACKIFIER MARKET, BY END-USER, 2014-2030 (USD THOUSAND)
TABLE 84 SPAIN PACKAGING IN TACKIFIER MARKET, BY TYPE, 2014-2030 (USD THOUSAND)
TABLE 85 SPAIN PACKAGING IN TACKIFIER MARKET, BY PRODUCT, 2014-2030 (USD THOUSAND)
TABLE 86 SPAIN CONSTRUCTION/ASSEMBLY IN TACKIFIER MARKET, BY TYPE, 2014-2030 (USD THOUSAND)
TABLE 87 SPAIN CONSTRUCTION/ASSEMBLY IN TACKIFIER MARKET, BY PRODUCT, 2014-2030 (USD THOUSAND)
TABLE 88 SPAIN NONWOVEN IN TACKIFIER MARKET, BY PRODUCT, 2014-2030 (USD THOUSAND)
TABLE 89 SPAIN BOOKBINDING IN TACKIFIER MARKET, BY PRODUCT, 2014-2030 (USD THOUSAND)
TABLE 90 SPAIN OTHERS IN TACKIFIER MARKET, BY PRODUCT, 2014-2030 (USD THOUSAND)
TABLE 91 ITALY TACKIFIER MARKET, BY PRODUCT, 2014-2030 (USD THOUSAND)
TABLE 92 ITALY TACKIFIER MARKET, BY FEEDSTOCK, 2014-2030 (USD THOUSAND)
TABLE 93 ITALY TACKIFIER MARKET, BY FORM, 2014-2030 (USD THOUSAND)
TABLE 94 ITALY TACKIFIER MARKET, BY APPLICATION, 2014-2030 (USD THOUSAND)
TABLE 95 ITALY TACKIFIER MARKET, BY END-USER, 2014-2030 (USD THOUSAND)
TABLE 96 ITALY PACKAGING IN TACKIFIER MARKET, BY TYPE, 2014-2030 (USD THOUSAND)
TABLE 97 ITALY PACKAGING IN TACKIFIER MARKET, BY PRODUCT, 2014-2030 (USD THOUSAND)
TABLE 98 ITALY CONSTRUCTION/ASSEMBLY IN TACKIFIER MARKET, BY TYPE, 2014-2030 (USD THOUSAND)
TABLE 99 ITALY CONSTRUCTION/ASSEMBLY IN TACKIFIER MARKET, BY PRODUCT, 2014-2030 (USD THOUSAND)
TABLE 100 ITALY NONWOVEN IN TACKIFIER MARKET, BY PRODUCT, 2014-2030 (USD THOUSAND)
TABLE 101 ITALY BOOKBINDING IN TACKIFIER MARKET, BY PRODUCT, 2014-2030 (USD THOUSAND)
TABLE 102 ITALY OTHERS IN TACKIFIER MARKET, BY PRODUCT, 2014-2030 (USD THOUSAND)
TABLE 103 RUSSIA TACKIFIER MARKET, BY PRODUCT, 2014-2030 (USD THOUSAND)
TABLE 104 RUSSIA TACKIFIER MARKET, BY FEEDSTOCK, 2014-2030 (USD THOUSAND)
TABLE 105 RUSSIA TACKIFIER MARKET, BY FORM, 2014-2030 (USD THOUSAND)
TABLE 106 RUSSIA TACKIFIER MARKET, BY APPLICATION, 2014-2030 (USD THOUSAND)
TABLE 107 RUSSIA TACKIFIER MARKET, BY END-USER, 2014-2030 (USD THOUSAND)
TABLE 108 RUSSIA PACKAGING IN TACKIFIER MARKET, BY TYPE, 2014-2030 (USD THOUSAND)
TABLE 109 RUSSIA PACKAGING IN TACKIFIER MARKET, BY PRODUCT, 2014-2030 (USD THOUSAND)
TABLE 110 RUSSIA CONSTRUCTION/ASSEMBLY IN TACKIFIER MARKET, BY TYPE, 2014-2030 (USD THOUSAND)
TABLE 111 RUSSIA CONSTRUCTION/ASSEMBLY IN TACKIFIER MARKET, BY PRODUCT, 2014-2030 (USD THOUSAND)
TABLE 112 RUSSIA NONWOVEN IN TACKIFIER MARKET, BY PRODUCT, 2014-2030 (USD THOUSAND)
TABLE 113 RUSSIA BOOKBINDING IN TACKIFIER MARKET, BY PRODUCT, 2014-2030 (USD THOUSAND)
TABLE 114 RUSSIA OTHERS IN TACKIFIER MARKET, BY PRODUCT, 2014-2030 (USD THOUSAND)
TABLE 115 NETHERLANDS TACKIFIER MARKET, BY PRODUCT, 2014-2030 (USD THOUSAND)
TABLE 116 NETHERLANDS TACKIFIER MARKET, BY FEEDSTOCK, 2014-2030 (USD THOUSAND)
TABLE 117 NETHERLANDS TACKIFIER MARKET, BY FORM, 2014-2030 (USD THOUSAND)
TABLE 118 NETHERLANDS TACKIFIER MARKET, BY APPLICATION, 2014-2030 (USD THOUSAND)
TABLE 119 NETHERLANDS TACKIFIER MARKET, BY END-USER, 2014-2030 (USD THOUSAND)
TABLE 120 NETHERLANDS PACKAGING IN TACKIFIER MARKET, BY TYPE, 2014-2030 (USD THOUSAND)
TABLE 121 NETHERLANDS PACKAGING IN TACKIFIER MARKET, BY PRODUCT, 2014-2030 (USD THOUSAND)
TABLE 122 NETHERLANDS CONSTRUCTION/ASSEMBLY IN TACKIFIER MARKET, BY TYPE, 2014-2030 (USD THOUSAND)
TABLE 123 NETHERLANDS CONSTRUCTION/ASSEMBLY IN TACKIFIER MARKET, BY PRODUCT, 2014-2030 (USD THOUSAND)
TABLE 124 NETHERLANDS NONWOVEN IN TACKIFIER MARKET, BY PRODUCT, 2014-2030 (USD THOUSAND)
TABLE 125 NETHERLANDS BOOKBINDING IN TACKIFIER MARKET, BY PRODUCT, 2014-2030 (USD THOUSAND)
TABLE 126 NETHERLANDS OTHERS IN TACKIFIER MARKET, BY PRODUCT, 2014-2030 (USD THOUSAND)
TABLE 127 SWITZERLAND TACKIFIER MARKET, BY PRODUCT, 2014-2030 (USD THOUSAND)
TABLE 128 SWITZERLAND TACKIFIER MARKET, BY FEEDSTOCK, 2014-2030 (USD THOUSAND)
TABLE 129 SWITZERLAND TACKIFIER MARKET, BY FORM, 2014-2030 (USD THOUSAND)
TABLE 130 SWITZERLAND TACKIFIER MARKET, BY APPLICATION, 2014-2030 (USD THOUSAND)
TABLE 131 SWITZERLAND TACKIFIER MARKET, BY END-USER, 2014-2030 (USD THOUSAND)
TABLE 132 SWITZERLAND PACKAGING IN TACKIFIER MARKET, BY TYPE, 2014-2030 (USD THOUSAND)
TABLE 133 SWITZERLAND PACKAGING IN TACKIFIER MARKET, BY PRODUCT, 2014-2030 (USD THOUSAND)
TABLE 134 SWITZERLAND CONSTRUCTION/ASSEMBLY IN TACKIFIER MARKET, BY TYPE, 2014-2030 (USD THOUSAND)
TABLE 135 SWITZERLAND CONSTRUCTION/ASSEMBLY IN TACKIFIER MARKET, BY PRODUCT, 2014-2030 (USD THOUSAND)
TABLE 136 SWITZERLAND NONWOVEN IN TACKIFIER MARKET, BY PRODUCT, 2014-2030 (USD THOUSAND)
TABLE 137 SWITZERLAND BOOKBINDING IN TACKIFIER MARKET, BY PRODUCT, 2014-2030 (USD THOUSAND)
TABLE 138 SWITZERLAND OTHERS IN TACKIFIER MARKET, BY PRODUCT, 2014-2030 (USD THOUSAND)
TABLE 139 DENMARK TACKIFIER MARKET, BY PRODUCT, 2014-2030 (USD THOUSAND)
TABLE 140 DENMARK TACKIFIER MARKET, BY FEEDSTOCK, 2014-2030 (USD THOUSAND)
TABLE 141 DENMARK TACKIFIER MARKET, BY FORM, 2014-2030 (USD THOUSAND)
TABLE 142 DENMARK TACKIFIER MARKET, BY APPLICATION, 2014-2030 (USD THOUSAND)
TABLE 143 DENMARK TACKIFIER MARKET, BY END-USER, 2014-2030 (USD THOUSAND)
TABLE 144 DENMARK PACKAGING IN TACKIFIER MARKET, BY TYPE, 2014-2030 (USD THOUSAND)
TABLE 145 DENMARK PACKAGING IN TACKIFIER MARKET, BY PRODUCT, 2014-2030 (USD THOUSAND)
TABLE 146 DENMARK CONSTRUCTION/ASSEMBLY IN TACKIFIER MARKET, BY TYPE, 2014-2030 (USD THOUSAND)
TABLE 147 DENMARK CONSTRUCTION/ASSEMBLY IN TACKIFIER MARKET, BY PRODUCT, 2014-2030 (USD THOUSAND)
TABLE 148 DENMARK NONWOVEN IN TACKIFIER MARKET, BY PRODUCT, 2014-2030 (USD THOUSAND)
TABLE 149 DENMARK BOOKBINDING IN TACKIFIER MARKET, BY PRODUCT, 2014-2030 (USD THOUSAND)
TABLE 150 DENMARK OTHERS IN TACKIFIER MARKET, BY PRODUCT, 2014-2030 (USD THOUSAND)
TABLE 151 SWEDEN TACKIFIER MARKET, BY PRODUCT, 2014-2030 (USD THOUSAND)
TABLE 152 SWEDEN TACKIFIER MARKET, BY FEEDSTOCK, 2014-2030 (USD THOUSAND)
TABLE 153 SWEDEN TACKIFIER MARKET, BY FORM, 2014-2030 (USD THOUSAND)
TABLE 154 SWEDEN TACKIFIER MARKET, BY APPLICATION, 2014-2030 (USD THOUSAND)
TABLE 155 SWEDEN TACKIFIER MARKET, BY END-USER, 2014-2030 (USD THOUSAND)
TABLE 156 SWEDEN PACKAGING IN TACKIFIER MARKET, BY TYPE, 2014-2030 (USD THOUSAND)
TABLE 157 SWEDEN PACKAGING IN TACKIFIER MARKET, BY PRODUCT, 2014-2030 (USD THOUSAND)
TABLE 158 SWEDEN CONSTRUCTION/ASSEMBLY IN TACKIFIER MARKET, BY TYPE, 2014-2030 (USD THOUSAND)
TABLE 159 SWEDEN CONSTRUCTION/ASSEMBLY IN TACKIFIER MARKET, BY PRODUCT, 2014-2030 (USD THOUSAND)
TABLE 160 SWEDEN NONWOVEN IN TACKIFIER MARKET, BY PRODUCT, 2014-2030 (USD THOUSAND)
TABLE 161 SWEDEN BOOKBINDING IN TACKIFIER MARKET, BY PRODUCT, 2014-2030 (USD THOUSAND)
TABLE 162 SWEDEN OTHERS IN TACKIFIER MARKET, BY PRODUCT, 2014-2030 (USD THOUSAND)
TABLE 163 POLAND TACKIFIER MARKET, BY PRODUCT, 2014-2030 (USD THOUSAND)
TABLE 164 POLAND TACKIFIER MARKET, BY FEEDSTOCK, 2014-2030 (USD THOUSAND)
TABLE 165 POLAND TACKIFIER MARKET, BY FORM, 2014-2030 (USD THOUSAND)
TABLE 166 POLAND TACKIFIER MARKET, BY APPLICATION, 2014-2030 (USD THOUSAND)
TABLE 167 POLAND TACKIFIER MARKET, BY END-USER, 2014-2030 (USD THOUSAND)
TABLE 168 POLAND PACKAGING IN TACKIFIER MARKET, BY TYPE, 2014-2030 (USD THOUSAND)
TABLE 169 POLAND PACKAGING IN TACKIFIER MARKET, BY PRODUCT, 2014-2030 (USD THOUSAND)
TABLE 170 POLAND CONSTRUCTION/ASSEMBLY IN TACKIFIER MARKET, BY TYPE, 2014-2030 (USD THOUSAND)
TABLE 171 POLAND CONSTRUCTION/ASSEMBLY IN TACKIFIER MARKET, BY PRODUCT, 2014-2030 (USD THOUSAND)
TABLE 172 POLAND NONWOVEN IN TACKIFIER MARKET, BY PRODUCT, 2014-2030 (USD THOUSAND)
TABLE 173 POLAND BOOKBINDING IN TACKIFIER MARKET, BY PRODUCT, 2014-2030 (USD THOUSAND)
TABLE 174 POLAND OTHERS IN TACKIFIER MARKET, BY PRODUCT, 2014-2030 (USD THOUSAND)
TABLE 175 BELGIUM TACKIFIER MARKET, BY PRODUCT, 2014-2030 (USD THOUSAND)
TABLE 176 BELGIUM TACKIFIER MARKET, BY FEEDSTOCK, 2014-2030 (USD THOUSAND)
TABLE 177 BELGIUM TACKIFIER MARKET, BY FORM, 2014-2030 (USD THOUSAND)
TABLE 178 BELGIUM TACKIFIER MARKET, BY APPLICATION, 2014-2030 (USD THOUSAND)
TABLE 179 BELGIUM TACKIFIER MARKET, BY END-USER, 2014-2030 (USD THOUSAND)
TABLE 180 BELGIUM PACKAGING IN TACKIFIER MARKET, BY TYPE, 2014-2030 (USD THOUSAND)
TABLE 181 BELGIUM PACKAGING IN TACKIFIER MARKET, BY PRODUCT, 2014-2030 (USD THOUSAND)
TABLE 182 BELGIUM CONSTRUCTION/ASSEMBLY IN TACKIFIER MARKET, BY TYPE, 2014-2030 (USD THOUSAND)
TABLE 183 BELGIUM CONSTRUCTION/ASSEMBLY IN TACKIFIER MARKET, BY PRODUCT, 2014-2030 (USD THOUSAND)
TABLE 184 BELGIUM NONWOVEN IN TACKIFIER MARKET, BY PRODUCT, 2014-2030 (USD THOUSAND)
TABLE 185 BELGIUM BOOKBINDING IN TACKIFIER MARKET, BY PRODUCT, 2014-2030 (USD THOUSAND)
TABLE 186 BELGIUM OTHERS IN TACKIFIER MARKET, BY PRODUCT, 2014-2030 (USD THOUSAND)
TABLE 187 TURKEY TACKIFIER MARKET, BY PRODUCT, 2014-2030 (USD THOUSAND)
TABLE 188 TURKEY TACKIFIER MARKET, BY FEEDSTOCK, 2014-2030 (USD THOUSAND)
TABLE 189 TURKEY TACKIFIER MARKET, BY FORM, 2014-2030 (USD THOUSAND)
TABLE 190 TURKEY TACKIFIER MARKET, BY APPLICATION, 2014-2030 (USD THOUSAND)
TABLE 191 TURKEY TACKIFIER MARKET, BY END-USER, 2014-2030 (USD THOUSAND)
TABLE 192 TURKEY PACKAGING IN TACKIFIER MARKET, BY TYPE, 2014-2030 (USD THOUSAND)
TABLE 193 TURKEY PACKAGING IN TACKIFIER MARKET, BY PRODUCT, 2014-2030 (USD THOUSAND)
TABLE 194 TURKEY CONSTRUCTION/ASSEMBLY IN TACKIFIER MARKET, BY TYPE, 2014-2030 (USD THOUSAND)
TABLE 195 TURKEY CONSTRUCTION/ASSEMBLY IN TACKIFIER MARKET, BY PRODUCT, 2014-2030 (USD THOUSAND)
TABLE 196 TURKEY NONWOVEN IN TACKIFIER MARKET, BY PRODUCT, 2014-2030 (USD THOUSAND)
TABLE 197 TURKEY BOOKBINDING IN TACKIFIER MARKET, BY PRODUCT, 2014-2030 (USD THOUSAND)
TABLE 198 TURKEY OTHERS IN TACKIFIER MARKET, BY PRODUCT, 2014-2030 (USD THOUSAND)
TABLE 199 NORWAY TACKIFIER MARKET, BY PRODUCT, 2014-2030 (USD THOUSAND)
TABLE 200 NORWAY TACKIFIER MARKET, BY FEEDSTOCK, 2014-2030 (USD THOUSAND)
TABLE 201 NORWAY TACKIFIER MARKET, BY FORM, 2014-2030 (USD THOUSAND)
TABLE 202 NORWAY TACKIFIER MARKET, BY APPLICATION, 2014-2030 (USD THOUSAND)
TABLE 203 NORWAY TACKIFIER MARKET, BY END-USER, 2014-2030 (USD THOUSAND)
TABLE 204 NORWAY PACKAGING IN TACKIFIER MARKET, BY TYPE, 2014-2030 (USD THOUSAND)
TABLE 205 NORWAY PACKAGING IN TACKIFIER MARKET, BY PRODUCT, 2014-2030 (USD THOUSAND)
TABLE 206 NORWAY CONSTRUCTION/ASSEMBLY IN TACKIFIER MARKET, BY TYPE, 2014-2030 (USD THOUSAND)
TABLE 207 NORWAY CONSTRUCTION/ASSEMBLY IN TACKIFIER MARKET, BY PRODUCT, 2014-2030 (USD THOUSAND)
TABLE 208 NORWAY NONWOVEN IN TACKIFIER MARKET, BY PRODUCT, 2014-2030 (USD THOUSAND)
TABLE 209 NORWAY BOOKBINDING IN TACKIFIER MARKET, BY PRODUCT, 2014-2030 (USD THOUSAND)
TABLE 210 NORWAY OTHERS IN TACKIFIER MARKET, BY PRODUCT, 2014-2030 (USD THOUSAND)
TABLE 211 FINLAND TACKIFIER MARKET, BY PRODUCT, 2014-2030 (USD THOUSAND)
TABLE 212 FINLAND TACKIFIER MARKET, BY FEEDSTOCK, 2014-2030 (USD THOUSAND)
TABLE 213 FINLAND TACKIFIER MARKET, BY FORM, 2014-2030 (USD THOUSAND)
TABLE 214 FINLAND TACKIFIER MARKET, BY APPLICATION, 2014-2030 (USD THOUSAND)
TABLE 215 FINLAND TACKIFIER MARKET, BY END-USER, 2014-2030 (USD THOUSAND)
TABLE 216 FINLAND PACKAGING IN TACKIFIER MARKET, BY TYPE, 2014-2030 (USD THOUSAND)
TABLE 217 FINLAND PACKAGING IN TACKIFIER MARKET, BY PRODUCT, 2014-2030 (USD THOUSAND)
TABLE 218 FINLAND CONSTRUCTION/ASSEMBLY IN TACKIFIER MARKET, BY TYPE, 2014-2030 (USD THOUSAND)
TABLE 219 FINLAND CONSTRUCTION/ASSEMBLY IN TACKIFIER MARKET, BY PRODUCT, 2014-2030 (USD THOUSAND)
TABLE 220 FINLAND NONWOVEN IN TACKIFIER MARKET, BY PRODUCT, 2014-2030 (USD THOUSAND)
TABLE 221 FINLAND BOOKBINDING IN TACKIFIER MARKET, BY PRODUCT, 2014-2030 (USD THOUSAND)
TABLE 222 FINLAND OTHERS IN TACKIFIER MARKET, BY PRODUCT, 2014-2030 (USD THOUSAND)
TABLE 223 REST OF EUROPE TACKIFIER MARKET, BY PRODUCT, 2014-2030 (USD THOUSAND)
TABLE 224 NORTH AMERICA TACKIFIER MARKET, BY COUNTRY, 2014-2030 (USD THOUSAND)
TABLE 225 NORTH AMERICA TACKIFIER MARKET, BY COUNTRY, 2014-2030 (TONS)
TABLE 226 NORTH AMERICA TACKIFIER MARKET, BY PRODUCT, 2014-2030 (USD THOUSAND)
TABLE 227 NORTH AMERICA TACKIFIER MARKET, BY FEEDSTOCK, 2014-2030 (USD THOUSAND)
TABLE 228 NORTH AMERICA TACKIFIER MARKET, BY FORM, 2014-2030 (USD THOUSAND)
TABLE 229 NORTH AMERICA TACKIFIER MARKET, BY APPLICATION, 2014-2030 (USD THOUSAND)
TABLE 230 NORTH AMERICA TACKIFIER MARKET, BY END-USER, 2014-2030 (USD THOUSAND)
TABLE 231 NORTH AMERICA PACKAGING IN TACKIFIER MARKET, BY TYPE, 2014-2030 (USD THOUSAND)
TABLE 232 NORTH AMERICA PACKAGING IN TACKIFIER MARKET, BY PRODUCT, 2014-2030 (USD THOUSAND)
TABLE 233 NORTH AMERICA CONSTRUCTION/ASSEMBLY IN TACKIFIER MARKET, BY TYPE, 2014-2030 (USD THOUSAND)
TABLE 234 NORTH AMERICA CONSTRUCTION/ASSEMBLY IN TACKIFIER MARKET, BY PRODUCT, 2014-2030 (USD THOUSAND)
TABLE 235 NORTH AMERICA NONWOVEN IN TACKIFIER MARKET, BY PRODUCT, 2014-2030 (USD THOUSAND)
TABLE 236 NORTH AMERICA BOOKBINDING IN TACKIFIER MARKET, BY PRODUCT, 2014-2030 (USD THOUSAND)
TABLE 237 NORTH AMERICA OTHERS IN TACKIFIER MARKET, BY PRODUCT, 2014-2030 (USD THOUSAND)
TABLE 238 U.S. TACKIFIER MARKET, BY PRODUCT, 2014-2030 (USD THOUSAND)
TABLE 239 U.S. TACKIFIER MARKET, BY PRODUCT, 2014-2030 (TONS)
TABLE 240 U.S. TACKIFIER MARKET, BY FEEDSTOCK, 2014-2030 (USD THOUSAND)
TABLE 241 U.S. TACKIFIER MARKET, BY FORM, 2014-2030 (USD THOUSAND)
TABLE 242 U.S. TACKIFIER MARKET, BY APPLICATION, 2014-2030 (USD THOUSAND)
TABLE 243 U.S. TACKIFIER MARKET, BY END-USER, 2014-2030 (USD THOUSAND)
TABLE 244 U.S. PACKAGING IN TACKIFIER MARKET, BY TYPE, 2014-2030 (USD THOUSAND)
TABLE 245 U.S. PACKAGING IN TACKIFIER MARKET, BY PRODUCT, 2014-2030 (USD THOUSAND)
TABLE 246 U.S. CONSTRUCTION/ASSEMBLY IN TACKIFIER MARKET, BY TYPE, 2014-2030 (USD THOUSAND)
TABLE 247 U.S. CONSTRUCTION/ASSEMBLY IN TACKIFIER MARKET, BY PRODUCT, 2014-2030 (USD THOUSAND)
TABLE 248 U.S. NONWOVEN IN TACKIFIER MARKET, BY PRODUCT, 2014-2030 (USD THOUSAND)
TABLE 249 U.S. BOOKBINDING IN TACKIFIER MARKET, BY PRODUCT, 2014-2030 (USD THOUSAND)
TABLE 250 U.S. OTHERS IN TACKIFIER MARKET, BY PRODUCT, 2014-2030 (USD THOUSAND)
TABLE 251 CANADA TACKIFIER MARKET, BY PRODUCT, 2014-2030 (USD THOUSAND)
TABLE 252 CANADA TACKIFIER MARKET, BY FEEDSTOCK, 2014-2030 (USD THOUSAND)
TABLE 253 CANADA TACKIFIER MARKET, BY FORM, 2014-2030 (USD THOUSAND)
TABLE 254 CANADA TACKIFIER MARKET, BY APPLICATION, 2014-2030 (USD THOUSAND)
TABLE 255 CANADA TACKIFIER MARKET, BY END-USER, 2014-2030 (USD THOUSAND)
TABLE 256 CANADA PACKAGING IN TACKIFIER MARKET, BY TYPE, 2014-2030 (USD THOUSAND)
TABLE 257 CANADA PACKAGING IN TACKIFIER MARKET, BY PRODUCT, 2014-2030 (USD THOUSAND)
TABLE 258 CANADA CONSTRUCTION/ASSEMBLY IN TACKIFIER MARKET, BY TYPE, 2014-2030 (USD THOUSAND)
TABLE 259 CANADA CONSTRUCTION/ASSEMBLY IN TACKIFIER MARKET, BY PRODUCT, 2014-2030 (USD THOUSAND)
TABLE 260 CANADA NONWOVEN IN TACKIFIER MARKET, BY PRODUCT, 2014-2030 (USD THOUSAND)
TABLE 261 CANADA BOOKBINDING IN TACKIFIER MARKET, BY PRODUCT, 2014-2030 (USD THOUSAND)
TABLE 262 CANADA OTHERS IN TACKIFIER MARKET, BY PRODUCT, 2014-2030 (USD THOUSAND)
TABLE 263 MEXICO TACKIFIER MARKET, BY PRODUCT, 2014-2030 (USD THOUSAND)
TABLE 264 MEXICO TACKIFIER MARKET, BY FEEDSTOCK, 2014-2030 (USD THOUSAND)
TABLE 265 MEXICO TACKIFIER MARKET, BY FORM, 2014-2030 (USD THOUSAND)
TABLE 266 MEXICO TACKIFIER MARKET, BY APPLICATION, 2014-2030 (USD THOUSAND)
TABLE 267 MEXICO TACKIFIER MARKET, BY END-USER, 2014-2030 (USD THOUSAND)
TABLE 268 MEXICO PACKAGING IN TACKIFIER MARKET, BY TYPE, 2014-2030 (USD THOUSAND)
TABLE 269 MEXICO PACKAGING IN TACKIFIER MARKET, BY PRODUCT, 2014-2030 (USD THOUSAND)
TABLE 270 MEXICO CONSTRUCTION/ASSEMBLY IN TACKIFIER MARKET, BY TYPE, 2014-2030 (USD THOUSAND)
TABLE 271 MEXICO CONSTRUCTION/ASSEMBLY IN TACKIFIER MARKET, BY PRODUCT, 2014-2030 (USD THOUSAND)
TABLE 272 MEXICO NONWOVEN IN TACKIFIER MARKET, BY PRODUCT, 2014-2030 (USD THOUSAND)
TABLE 273 MEXICO BOOKBINDING IN TACKIFIER MARKET, BY PRODUCT, 2014-2030 (USD THOUSAND)
TABLE 274 MEXICO OTHERS IN TACKIFIER MARKET, BY PRODUCT, 2014-2030 (USD THOUSAND)
TABLE 275 SOUTH AMERICA TACKIFIER MARKET, BY COUNTRY, 2014-2030 (USD THOUSAND)
TABLE 276 SOUTH AMERICA TACKIFIER MARKET, BY PRODUCT, 2014-2030 (USD THOUSAND)
TABLE 277 SOUTH AMERICA TACKIFIER MARKET, BY FEEDSTOCK, 2014-2030 (USD THOUSAND)
TABLE 278 SOUTH AMERICA TACKIFIER MARKET, BY FORM, 2014-2030 (USD THOUSAND)
TABLE 279 SOUTH AMERICA TACKIFIER MARKET, BY APPLICATION, 2014-2030 (USD THOUSAND)
TABLE 280 SOUTH AMERICA TACKIFIER MARKET, BY END-USER, 2014-2030 (USD THOUSAND)
TABLE 281 SOUTH AMERICA PACKAGING IN TACKIFIER MARKET, BY TYPE, 2014-2030 (USD THOUSAND)
TABLE 282 SOUTH AMERICA PACKAGING IN TACKIFIER MARKET, BY PRODUCT, 2014-2030 (USD THOUSAND)
TABLE 283 SOUTH AMERICA CONSTRUCTION/ASSEMBLY IN TACKIFIER MARKET, BY TYPE, 2014-2030 (USD THOUSAND)
TABLE 284 SOUTH AMERICA CONSTRUCTION/ASSEMBLY IN TACKIFIER MARKET, BY PRODUCT, 2014-2030 (USD THOUSAND)
TABLE 285 SOUTH AMERICA NONWOVEN IN TACKIFIER MARKET, BY PRODUCT, 2014-2030 (USD THOUSAND)
TABLE 286 SOUTH AMERICA BOOKBINDING IN TACKIFIER MARKET, BY PRODUCT, 2014-2030 (USD THOUSAND)
TABLE 287 SOUTH AMERICA OTHERS IN TACKIFIER MARKET, BY PRODUCT, 2014-2030 (USD THOUSAND)
TABLE 288 BRAZIL TACKIFIER MARKET, BY PRODUCT, 2014-2030 (USD THOUSAND)
TABLE 289 BRAZIL TACKIFIER MARKET, BY FEEDSTOCK, 2014-2030 (USD THOUSAND)
TABLE 290 BRAZIL TACKIFIER MARKET, BY FORM, 2014-2030 (USD THOUSAND)
TABLE 291 BRAZIL TACKIFIER MARKET, BY APPLICATION, 2014-2030 (USD THOUSAND)
TABLE 292 BRAZIL TACKIFIER MARKET, BY END-USER, 2014-2030 (USD THOUSAND)
TABLE 293 BRAZIL PACKAGING IN TACKIFIER MARKET, BY TYPE, 2014-2030 (USD THOUSAND)
TABLE 294 BRAZIL PACKAGING IN TACKIFIER MARKET, BY PRODUCT, 2014-2030 (USD THOUSAND)
TABLE 295 BRAZIL CONSTRUCTION/ASSEMBLY IN TACKIFIER MARKET, BY TYPE, 2014-2030 (USD THOUSAND)
TABLE 296 BRAZIL CONSTRUCTION/ASSEMBLY IN TACKIFIER MARKET, BY PRODUCT, 2014-2030 (USD THOUSAND)
TABLE 297 BRAZIL NONWOVEN IN TACKIFIER MARKET, BY PRODUCT, 2014-2030 (USD THOUSAND)
TABLE 298 BRAZIL BOOKBINDING IN TACKIFIER MARKET, BY PRODUCT, 2014-2030 (USD THOUSAND)
TABLE 299 BRAZIL OTHERS IN TACKIFIER MARKET, BY PRODUCT, 2014-2030 (USD THOUSAND)
TABLE 300 ARGENTINA TACKIFIER MARKET, BY PRODUCT, 2014-2030 (USD THOUSAND)
TABLE 301 ARGENTINA TACKIFIER MARKET, BY FEEDSTOCK, 2014-2030 (USD THOUSAND)
TABLE 302 ARGENTINA TACKIFIER MARKET, BY FORM, 2014-2030 (USD THOUSAND)
TABLE 303 ARGENTINA TACKIFIER MARKET, BY APPLICATION, 2014-2030 (USD THOUSAND)
TABLE 304 ARGENTINA TACKIFIER MARKET, BY END-USER, 2014-2030 (USD THOUSAND)
TABLE 305 ARGENTINA PACKAGING IN TACKIFIER MARKET, BY TYPE, 2014-2030 (USD THOUSAND)
TABLE 306 ARGENTINA PACKAGING IN TACKIFIER MARKET, BY PRODUCT, 2014-2030 (USD THOUSAND)
TABLE 307 ARGENTINA CONSTRUCTION/ASSEMBLY IN TACKIFIER MARKET, BY TYPE, 2014-2030 (USD THOUSAND)
TABLE 308 ARGENTINA CONSTRUCTION/ASSEMBLY IN TACKIFIER MARKET, BY PRODUCT, 2014-2030 (USD THOUSAND)
TABLE 309 ARGENTINA NONWOVEN IN TACKIFIER MARKET, BY PRODUCT, 2014-2030 (USD THOUSAND)
TABLE 310 ARGENTINA BOOKBINDING IN TACKIFIER MARKET, BY PRODUCT, 2014-2030 (USD THOUSAND)
TABLE 311 ARGENTINA OTHERS IN TACKIFIER MARKET, BY PRODUCT, 2014-2030 (USD THOUSAND)
TABLE 312 REST OF SOUTH AMERICA TACKIFIER MARKET, BY PRODUCT, 2014-2030 (USD THOUSAND)
TABLE 313 MIDDLE EAST AND AFRICA TACKIFIER MARKET, BY COUNTRY, 2014-2030 (USD THOUSAND)
TABLE 314 MIDDLE EAST AND AFRICA TACKIFIER MARKET, BY PRODUCT, 2014-2030 (USD THOUSAND)
TABLE 315 MIDDLE EAST AND AFRICA TACKIFIER MARKET, BY FEEDSTOCK, 2014-2030 (USD THOUSAND)
TABLE 316 MIDDLE EAST AND AFRICA TACKIFIER MARKET, BY FORM, 2014-2030 (USD THOUSAND)
TABLE 317 MIDDLE EAST AND AFRICA TACKIFIER MARKET, BY APPLICATION, 2014-2030 (USD THOUSAND)
TABLE 318 MIDDLE EAST AND AFRICA TACKIFIER MARKET, BY END-USER, 2014-2030 (USD THOUSAND)
TABLE 319 MIDDLE EAST AND AFRICA PACKAGING IN TACKIFIER MARKET, BY TYPE, 2014-2030 (USD THOUSAND)
TABLE 320 MIDDLE EAST AND AFRICA PACKAGING IN TACKIFIER MARKET, BY PRODUCT, 2014-2030 (USD THOUSAND)
TABLE 321 MIDDLE EAST AND AFRICA CONSTRUCTION/ASSEMBLY IN TACKIFIER MARKET, BY TYPE, 2014-2030 (USD THOUSAND)
TABLE 322 MIDDLE EAST AND AFRICA CONSTRUCTION/ASSEMBLY IN TACKIFIER MARKET, BY PRODUCT, 2014-2030 (USD THOUSAND)
TABLE 323 MIDDLE EAST AND AFRICA NONWOVEN IN TACKIFIER MARKET, BY PRODUCT, 2014-2030 (USD THOUSAND)
TABLE 324 MIDDLE EAST AND AFRICA BOOKBINDING IN TACKIFIER MARKET, BY PRODUCT, 2014-2030 (USD THOUSAND)
TABLE 325 MIDDLE EAST AND AFRICA OTHERS IN TACKIFIER MARKET, BY PRODUCT, 2014-2030 (USD THOUSAND)
TABLE 326 SOUTH AFRICA TACKIFIER MARKET, BY PRODUCT, 2014-2030 (USD THOUSAND)
TABLE 327 SOUTH AFRICA TACKIFIER MARKET, BY FEEDSTOCK, 2014-2030 (USD THOUSAND)
TABLE 328 SOUTH AFRICA TACKIFIER MARKET, BY FORM, 2014-2030 (USD THOUSAND)
TABLE 329 SOUTH AFRICA TACKIFIER MARKET, BY APPLICATION, 2014-2030 (USD THOUSAND)
TABLE 330 SOUTH AFRICA TACKIFIER MARKET, BY END-USER, 2014-2030 (USD THOUSAND)
TABLE 331 SOUTH AFRICA PACKAGING IN TACKIFIER MARKET, BY TYPE, 2014-2030 (USD THOUSAND)
TABLE 332 SOUTH AFRICA PACKAGING IN TACKIFIER MARKET, BY PRODUCT, 2014-2030 (USD THOUSAND)
TABLE 333 SOUTH AFRICA CONSTRUCTION/ASSEMBLY IN TACKIFIER MARKET, BY TYPE, 2014-2030 (USD THOUSAND)
TABLE 334 SOUTH AFRICA CONSTRUCTION/ASSEMBLY IN TACKIFIER MARKET, BY PRODUCT, 2014-2030 (USD THOUSAND)
TABLE 335 SOUTH AFRICA NONWOVEN IN TACKIFIER MARKET, BY PRODUCT, 2014-2030 (USD THOUSAND)
TABLE 336 SOUTH AFRICA BOOKBINDING IN TACKIFIER MARKET, BY PRODUCT, 2014-2030 (USD THOUSAND)
TABLE 337 SOUTH AFRICA OTHERS IN TACKIFIER MARKET, BY PRODUCT, 2014-2030 (USD THOUSAND)
TABLE 338 SAUDI ARABIA TACKIFIER MARKET, BY PRODUCT, 2014-2030 (USD THOUSAND)
TABLE 339 SAUDI ARABIA TACKIFIER MARKET, BY FEEDSTOCK, 2014-2030 (USD THOUSAND)
TABLE 340 SAUDI ARABIA TACKIFIER MARKET, BY FORM, 2014-2030 (USD THOUSAND)
TABLE 341 SAUDI ARABIA TACKIFIER MARKET, BY APPLICATION, 2014-2030 (USD THOUSAND)
TABLE 342 SAUDI ARABIA TACKIFIER MARKET, BY END-USER, 2014-2030 (USD THOUSAND)
TABLE 343 SAUDI ARABIA PACKAGING IN TACKIFIER MARKET, BY TYPE, 2014-2030 (USD THOUSAND)
TABLE 344 SAUDI ARABIA PACKAGING IN TACKIFIER MARKET, BY PRODUCT, 2014-2030 (USD THOUSAND)
TABLE 345 SAUDI ARABIA CONSTRUCTION/ASSEMBLY IN TACKIFIER MARKET, BY TYPE, 2014-2030 (USD THOUSAND)
TABLE 346 SAUDI ARABIA CONSTRUCTION/ASSEMBLY IN TACKIFIER MARKET, BY PRODUCT, 2014-2030 (USD THOUSAND)
TABLE 347 SAUDI ARABIA NONWOVEN IN TACKIFIER MARKET, BY PRODUCT, 2014-2030 (USD THOUSAND)
TABLE 348 SAUDI ARABIA BOOKBINDING IN TACKIFIER MARKET, BY PRODUCT, 2014-2030 (USD THOUSAND)
TABLE 349 SAUDI ARABIA OTHERS IN TACKIFIER MARKET, BY PRODUCT, 2014-2030 (USD THOUSAND)
TABLE 350 U.A.E. TACKIFIER MARKET, BY PRODUCT, 2014-2030 (USD THOUSAND)
TABLE 351 U.A.E. TACKIFIER MARKET, BY FEEDSTOCK, 2014-2030 (USD THOUSAND)
TABLE 352 U.A.E. TACKIFIER MARKET, BY FORM, 2014-2030 (USD THOUSAND)
TABLE 353 U.A.E. TACKIFIER MARKET, BY APPLICATION, 2014-2030 (USD THOUSAND)
TABLE 354 U.A.E. TACKIFIER MARKET, BY END-USER, 2014-2030 (USD THOUSAND)
TABLE 355 U.A.E. PACKAGING IN TACKIFIER MARKET, BY TYPE, 2014-2030 (USD THOUSAND)
TABLE 356 U.A.E. PACKAGING IN TACKIFIER MARKET, BY PRODUCT, 2014-2030 (USD THOUSAND)
TABLE 357 U.A.E. CONSTRUCTION/ASSEMBLY IN TACKIFIER MARKET, BY TYPE, 2014-2030 (USD THOUSAND)
TABLE 358 U.A.E. CONSTRUCTION/ASSEMBLY IN TACKIFIER MARKET, BY PRODUCT, 2014-2030 (USD THOUSAND)
TABLE 359 U.A.E. NONWOVEN IN TACKIFIER MARKET, BY PRODUCT, 2014-2030 (USD THOUSAND)
TABLE 360 U.A.E. BOOKBINDING IN TACKIFIER MARKET, BY PRODUCT, 2014-2030 (USD THOUSAND)
TABLE 361 U.A.E. OTHERS IN TACKIFIER MARKET, BY PRODUCT, 2014-2030 (USD THOUSAND)
TABLE 362 EGYPT TACKIFIER MARKET, BY PRODUCT, 2014-2030 (USD THOUSAND)
TABLE 363 EGYPT TACKIFIER MARKET, BY FEEDSTOCK, 2014-2030 (USD THOUSAND)
TABLE 364 EGYPT TACKIFIER MARKET, BY FORM, 2014-2030 (USD THOUSAND)
TABLE 365 EGYPT TACKIFIER MARKET, BY APPLICATION, 2014-2030 (USD THOUSAND)
TABLE 366 EGYPT TACKIFIER MARKET, BY END-USER, 2014-2030 (USD THOUSAND)
TABLE 367 EGYPT PACKAGING IN TACKIFIER MARKET, BY TYPE, 2014-2030 (USD THOUSAND)
TABLE 368 EGYPT PACKAGING IN TACKIFIER MARKET, BY PRODUCT, 2014-2030 (USD THOUSAND)
TABLE 369 EGYPT CONSTRUCTION/ASSEMBLY IN TACKIFIER MARKET, BY TYPE, 2014-2030 (USD THOUSAND)
TABLE 370 EGYPT CONSTRUCTION/ASSEMBLY IN TACKIFIER MARKET, BY PRODUCT, 2014-2030 (USD THOUSAND)
TABLE 371 EGYPT NONWOVEN IN TACKIFIER MARKET, BY PRODUCT, 2014-2030 (USD THOUSAND)
TABLE 372 EGYPT BOOKBINDING IN TACKIFIER MARKET, BY PRODUCT, 2014-2030 (USD THOUSAND)
TABLE 373 EGYPT OTHERS IN TACKIFIER MARKET, BY PRODUCT, 2014-2030 (USD THOUSAND)
TABLE 374 ISRAEL TACKIFIER MARKET, BY PRODUCT, 2014-2030 (USD THOUSAND)
TABLE 375 ISRAEL TACKIFIER MARKET, BY FEEDSTOCK, 2014-2030 (USD THOUSAND)
TABLE 376 ISRAEL TACKIFIER MARKET, BY FORM, 2014-2030 (USD THOUSAND)
TABLE 377 ISRAEL TACKIFIER MARKET, BY APPLICATION, 2014-2030 (USD THOUSAND)
TABLE 378 ISRAEL TACKIFIER MARKET, BY END-USER, 2014-2030 (USD THOUSAND)
TABLE 379 ISRAEL PACKAGING IN TACKIFIER MARKET, BY TYPE, 2014-2030 (USD THOUSAND)
TABLE 380 ISRAEL PACKAGING IN TACKIFIER MARKET, BY PRODUCT, 2014-2030 (USD THOUSAND)
TABLE 381 ISRAEL CONSTRUCTION/ASSEMBLY IN TACKIFIER MARKET, BY TYPE, 2014-2030 (USD THOUSAND)
TABLE 382 ISRAEL CONSTRUCTION/ASSEMBLY IN TACKIFIER MARKET, BY PRODUCT, 2014-2030 (USD THOUSAND)
TABLE 383 ISRAEL NONWOVEN IN TACKIFIER MARKET, BY PRODUCT, 2014-2030 (USD THOUSAND)
TABLE 384 ISRAEL BOOKBINDING IN TACKIFIER MARKET, BY PRODUCT, 2014-2030 (USD THOUSAND)
TABLE 385 ISRAEL OTHERS IN TACKIFIER MARKET, BY PRODUCT, 2014-2030 (USD THOUSAND)
TABLE 386 QATAR TACKIFIER MARKET, BY PRODUCT, 2014-2030 (USD THOUSAND)
TABLE 387 QATAR TACKIFIER MARKET, BY FEEDSTOCK, 2014-2030 (USD THOUSAND)
TABLE 388 QATAR TACKIFIER MARKET, BY FORM, 2014-2030 (USD THOUSAND)
TABLE 389 QATAR TACKIFIER MARKET, BY APPLICATION, 2014-2030 (USD THOUSAND)
TABLE 390 QATAR TACKIFIER MARKET, BY END-USER, 2014-2030 (USD THOUSAND)
TABLE 391 QATAR PACKAGING IN TACKIFIER MARKET, BY TYPE, 2014-2030 (USD THOUSAND)
TABLE 392 QATAR PACKAGING IN TACKIFIER MARKET, BY PRODUCT, 2014-2030 (USD THOUSAND)
TABLE 393 QATAR CONSTRUCTION/ASSEMBLY IN TACKIFIER MARKET, BY TYPE, 2014-2030 (USD THOUSAND)
TABLE 394 QATAR CONSTRUCTION/ASSEMBLY IN TACKIFIER MARKET, BY PRODUCT, 2014-2030 (USD THOUSAND)
TABLE 395 QATAR NONWOVEN IN TACKIFIER MARKET, BY PRODUCT, 2014-2030 (USD THOUSAND)
TABLE 396 QATAR BOOKBINDING IN TACKIFIER MARKET, BY PRODUCT, 2014-2030 (USD THOUSAND)
TABLE 397 QATAR OTHERS IN TACKIFIER MARKET, BY PRODUCT, 2014-2030 (USD THOUSAND)
TABLE 398 KUWAIT TACKIFIER MARKET, BY PRODUCT, 2014-2030 (USD THOUSAND)
TABLE 399 KUWAIT TACKIFIER MARKET, BY FEEDSTOCK, 2014-2030 (USD THOUSAND)
TABLE 400 KUWAIT TACKIFIER MARKET, BY FORM, 2014-2030 (USD THOUSAND)
TABLE 401 KUWAIT TACKIFIER MARKET, BY APPLICATION, 2014-2030 (USD THOUSAND)
TABLE 402 KUWAIT TACKIFIER MARKET, BY END-USER, 2014-2030 (USD THOUSAND)
TABLE 403 KUWAIT PACKAGING IN TACKIFIER MARKET, BY TYPE, 2014-2030 (USD THOUSAND)
TABLE 404 KUWAIT PACKAGING IN TACKIFIER MARKET, BY PRODUCT, 2014-2030 (USD THOUSAND)
TABLE 405 KUWAIT CONSTRUCTION/ASSEMBLY IN TACKIFIER MARKET, BY TYPE, 2014-2030 (USD THOUSAND)
TABLE 406 KUWAIT CONSTRUCTION/ASSEMBLY IN TACKIFIER MARKET, BY PRODUCT, 2014-2030 (USD THOUSAND)
TABLE 407 KUWAIT NONWOVEN IN TACKIFIER MARKET, BY PRODUCT, 2014-2030 (USD THOUSAND)
TABLE 408 KUWAIT BOOKBINDING IN TACKIFIER MARKET, BY PRODUCT, 2014-2030 (USD THOUSAND)
TABLE 409 KUWAIT OTHERS IN TACKIFIER MARKET, BY PRODUCT, 2014-2030 (USD THOUSAND)
TABLE 410 OMAN TACKIFIER MARKET, BY PRODUCT, 2014-2030 (USD THOUSAND)
TABLE 411 OMAN TACKIFIER MARKET, BY FEEDSTOCK, 2014-2030 (USD THOUSAND)
TABLE 412 OMAN TACKIFIER MARKET, BY FORM, 2014-2030 (USD THOUSAND)
TABLE 413 OMAN TACKIFIER MARKET, BY APPLICATION, 2014-2030 (USD THOUSAND)
TABLE 414 OMAN TACKIFIER MARKET, BY END-USER, 2014-2030 (USD THOUSAND)
TABLE 415 OMAN PACKAGING IN TACKIFIER MARKET, BY TYPE, 2014-2030 (USD THOUSAND)
TABLE 416 OMAN PACKAGING IN TACKIFIER MARKET, BY PRODUCT, 2014-2030 (USD THOUSAND)
TABLE 417 OMAN CONSTRUCTION/ASSEMBLY IN TACKIFIER MARKET, BY TYPE, 2014-2030 (USD THOUSAND)
TABLE 418 OMAN CONSTRUCTION/ASSEMBLY IN TACKIFIER MARKET, BY PRODUCT, 2014-2030 (USD THOUSAND)
TABLE 419 OMAN NONWOVEN IN TACKIFIER MARKET, BY PRODUCT, 2014-2030 (USD THOUSAND)
TABLE 420 OMAN BOOKBINDING IN TACKIFIER MARKET, BY PRODUCT, 2014-2030 (USD THOUSAND)
TABLE 421 OMAN OTHERS IN TACKIFIER MARKET, BY PRODUCT, 2014-2030 (USD THOUSAND)
TABLE 422 BAHRAIN TACKIFIER MARKET, BY PRODUCT, 2014-2030 (USD THOUSAND)
TABLE 423 BAHRAIN TACKIFIER MARKET, BY FEEDSTOCK, 2014-2030 (USD THOUSAND)
TABLE 424 BAHRAIN TACKIFIER MARKET, BY FORM, 2014-2030 (USD THOUSAND)
TABLE 425 BAHRAIN TACKIFIER MARKET, BY APPLICATION, 2014-2030 (USD THOUSAND)
TABLE 426 BAHRAIN TACKIFIER MARKET, BY END-USER, 2014-2030 (USD THOUSAND)
TABLE 427 BAHRAIN PACKAGING IN TACKIFIER MARKET, BY TYPE, 2014-2030 (USD THOUSAND)
TABLE 428 BAHRAIN PACKAGING IN TACKIFIER MARKET, BY PRODUCT, 2014-2030 (USD THOUSAND)
TABLE 429 BAHRAIN CONSTRUCTION/ASSEMBLY IN TACKIFIER MARKET, BY TYPE, 2014-2030 (USD THOUSAND)
TABLE 430 BAHRAIN CONSTRUCTION/ASSEMBLY IN TACKIFIER MARKET, BY PRODUCT, 2014-2030 (USD THOUSAND)
TABLE 431 BAHRAIN NONWOVEN IN TACKIFIER MARKET, BY PRODUCT, 2014-2030 (USD THOUSAND)
TABLE 432 BAHRAIN BOOKBINDING IN TACKIFIER MARKET, BY PRODUCT, 2014-2030 (USD THOUSAND)
TABLE 433 BAHRAIN OTHERS IN TACKIFIER MARKET, BY PRODUCT, 2014-2030 (USD THOUSAND)
TABLE 434 REST OF MIDDLE EAST AND AFRICA TACKIFIER MARKET, BY PRODUCT, 2014-2030 (USD THOUSAND)
TABLE 435 ASIA-PACIFIC TACKIFIER MARKET, BY COUNTRY, 2014-2030 (USD THOUSAND)
TABLE 436 ASIA-PACIFIC TACKIFIER MARKET, BY PRODUCT, 2014-2030 (USD THOUSAND)
TABLE 437 ASIA-PACIFIC TACKIFIER MARKET, BY FEEDSTOCK, 2014-2030 (USD THOUSAND)
TABLE 438 ASIA-PACIFIC TACKIFIER MARKET, BY FORM, 2014-2030 (USD THOUSAND)
TABLE 439 ASIA-PACIFIC TACKIFIER MARKET, BY APPLICATION, 2014-2030 (USD THOUSAND)
TABLE 440 ASIA-PACIFIC TACKIFIER MARKET, BY END-USER, 2014-2030 (USD THOUSAND)
TABLE 441 ASIA-PACIFIC PACKAGING IN TACKIFIER MARKET, BY TYPE, 2014-2030 (USD THOUSAND)
TABLE 442 ASIA-PACIFIC PACKAGING IN TACKIFIER MARKET, BY PRODUCT, 2014-2030 (USD THOUSAND)
TABLE 443 ASIA-PACIFIC CONSTRUCTION/ASSEMBLY IN TACKIFIER MARKET, BY TYPE, 2014-2030 (USD THOUSAND)
TABLE 444 ASIA-PACIFIC CONSTRUCTION/ASSEMBLY IN TACKIFIER MARKET, BY PRODUCT, 2014-2030 (USD THOUSAND)
TABLE 445 ASIA-PACIFIC NONWOVEN IN TACKIFIER MARKET, BY PRODUCT, 2014-2030 (USD THOUSAND)
TABLE 446 ASIA-PACIFIC BOOKBINDING IN TACKIFIER MARKET, BY PRODUCT, 2014-2030 (USD THOUSAND)
TABLE 447 ASIA-PACIFIC OTHERS IN TACKIFIER MARKET, BY PRODUCT, 2014-2030 (USD THOUSAND)
TABLE 448 CHINA TACKIFIER MARKET, BY PRODUCT, 2014-2030 (USD THOUSAND)
TABLE 449 CHINA TACKIFIER MARKET, BY FEEDSTOCK, 2014-2030 (USD THOUSAND)
TABLE 450 CHINA TACKIFIER MARKET, BY FORM, 2014-2030 (USD THOUSAND)
TABLE 451 CHINA TACKIFIER MARKET, BY APPLICATION, 2014-2030 (USD THOUSAND)
TABLE 452 CHINA TACKIFIER MARKET, BY END-USER, 2014-2030 (USD THOUSAND)
TABLE 453 CHINA PACKAGING IN TACKIFIER MARKET, BY TYPE, 2014-2030 (USD THOUSAND)
TABLE 454 CHINA PACKAGING IN TACKIFIER MARKET, BY PRODUCT, 2014-2030 (USD THOUSAND)
TABLE 455 CHINA CONSTRUCTION/ASSEMBLY IN TACKIFIER MARKET, BY TYPE, 2014-2030 (USD THOUSAND)
TABLE 456 CHINA CONSTRUCTION/ASSEMBLY IN TACKIFIER MARKET, BY PRODUCT, 2014-2030 (USD THOUSAND)
TABLE 457 CHINA NONWOVEN IN TACKIFIER MARKET, BY PRODUCT, 2014-2030 (USD THOUSAND)
TABLE 458 CHINA BOOKBINDING IN TACKIFIER MARKET, BY PRODUCT, 2014-2030 (USD THOUSAND)
TABLE 459 CHINA OTHERS IN TACKIFIER MARKET, BY PRODUCT, 2014-2030 (USD THOUSAND)
TABLE 460 JAPAN TACKIFIER MARKET, BY PRODUCT, 2014-2030 (USD THOUSAND)
TABLE 461 JAPAN TACKIFIER MARKET, BY FEEDSTOCK, 2014-2030 (USD THOUSAND)
TABLE 462 JAPAN TACKIFIER MARKET, BY FORM, 2014-2030 (USD THOUSAND)
TABLE 463 JAPAN TACKIFIER MARKET, BY APPLICATION, 2014-2030 (USD THOUSAND)
TABLE 464 JAPAN TACKIFIER MARKET, BY END-USER, 2014-2030 (USD THOUSAND)
TABLE 465 JAPAN PACKAGING IN TACKIFIER MARKET, BY TYPE, 2014-2030 (USD THOUSAND)
TABLE 466 JAPAN PACKAGING IN TACKIFIER MARKET, BY PRODUCT, 2014-2030 (USD THOUSAND)
TABLE 467 JAPAN CONSTRUCTION/ASSEMBLY IN TACKIFIER MARKET, BY TYPE, 2014-2030 (USD THOUSAND)
TABLE 468 JAPAN CONSTRUCTION/ASSEMBLY IN TACKIFIER MARKET, BY PRODUCT, 2014-2030 (USD THOUSAND)
TABLE 469 JAPAN NONWOVEN IN TACKIFIER MARKET, BY PRODUCT, 2014-2030 (USD THOUSAND)
TABLE 470 JAPAN BOOKBINDING IN TACKIFIER MARKET, BY PRODUCT, 2014-2030 (USD THOUSAND)
TABLE 471 JAPAN OTHERS IN TACKIFIER MARKET, BY PRODUCT, 2014-2030 (USD THOUSAND)
TABLE 472 SOUTH KOREA TACKIFIER MARKET, BY PRODUCT, 2014-2030 (USD THOUSAND)
TABLE 473 SOUTH KOREA TACKIFIER MARKET, BY FEEDSTOCK, 2014-2030 (USD THOUSAND)
TABLE 474 SOUTH KOREA TACKIFIER MARKET, BY FORM, 2014-2030 (USD THOUSAND)
TABLE 475 SOUTH KOREA TACKIFIER MARKET, BY APPLICATION, 2014-2030 (USD THOUSAND)
TABLE 476 SOUTH KOREA TACKIFIER MARKET, BY END-USER, 2014-2030 (USD THOUSAND)
TABLE 477 SOUTH KOREA PACKAGING IN TACKIFIER MARKET, BY TYPE, 2014-2030 (USD THOUSAND)
TABLE 478 SOUTH KOREA PACKAGING IN TACKIFIER MARKET, BY PRODUCT, 2014-2030 (USD THOUSAND)
TABLE 479 SOUTH KOREA CONSTRUCTION/ASSEMBLY IN TACKIFIER MARKET, BY TYPE, 2014-2030 (USD THOUSAND)
TABLE 480 SOUTH KOREA CONSTRUCTION/ASSEMBLY IN TACKIFIER MARKET, BY PRODUCT, 2014-2030 (USD THOUSAND)
TABLE 481 SOUTH KOREA NONWOVEN IN TACKIFIER MARKET, BY PRODUCT, 2014-2030 (USD THOUSAND)
TABLE 482 SOUTH KOREA BOOKBINDING IN TACKIFIER MARKET, BY PRODUCT, 2014-2030 (USD THOUSAND)
TABLE 483 SOUTH KOREA OTHERS IN TACKIFIER MARKET, BY PRODUCT, 2014-2030 (USD THOUSAND)
TABLE 484 INDIA TACKIFIER MARKET, BY PRODUCT, 2014-2030 (USD THOUSAND)
TABLE 485 INDIA TACKIFIER MARKET, BY FEEDSTOCK, 2014-2030 (USD THOUSAND)
TABLE 486 INDIA TACKIFIER MARKET, BY FORM, 2014-2030 (USD THOUSAND)
TABLE 487 INDIA TACKIFIER MARKET, BY APPLICATION, 2014-2030 (USD THOUSAND)
TABLE 488 INDIA TACKIFIER MARKET, BY END-USER, 2014-2030 (USD THOUSAND)
TABLE 489 INDIA PACKAGING IN TACKIFIER MARKET, BY TYPE, 2014-2030 (USD THOUSAND)
TABLE 490 INDIA PACKAGING IN TACKIFIER MARKET, BY PRODUCT, 2014-2030 (USD THOUSAND)
TABLE 491 INDIA CONSTRUCTION/ASSEMBLY IN TACKIFIER MARKET, BY TYPE, 2014-2030 (USD THOUSAND)
TABLE 492 INDIA CONSTRUCTION/ASSEMBLY IN TACKIFIER MARKET, BY PRODUCT, 2014-2030 (USD THOUSAND)
TABLE 493 INDIA NONWOVEN IN TACKIFIER MARKET, BY PRODUCT, 2014-2030 (USD THOUSAND)
TABLE 494 INDIA BOOKBINDING IN TACKIFIER MARKET, BY PRODUCT, 2014-2030 (USD THOUSAND)
TABLE 495 INDIA OTHERS IN TACKIFIER MARKET, BY PRODUCT, 2014-2030 (USD THOUSAND)
TABLE 496 AUSTRALIA TACKIFIER MARKET, BY PRODUCT, 2014-2030 (USD THOUSAND)
TABLE 497 AUSTRALIA TACKIFIER MARKET, BY FEEDSTOCK, 2014-2030 (USD THOUSAND)
TABLE 498 AUSTRALIA TACKIFIER MARKET, BY FORM, 2014-2030 (USD THOUSAND)
TABLE 499 AUSTRALIA TACKIFIER MARKET, BY APPLICATION, 2014-2030 (USD THOUSAND)
TABLE 500 AUSTRALIA TACKIFIER MARKET, BY END-USER, 2014-2030 (USD THOUSAND)
TABLE 501 AUSTRALIA PACKAGING IN TACKIFIER MARKET, BY TYPE, 2014-2030 (USD THOUSAND)
TABLE 502 AUSTRALIA PACKAGING IN TACKIFIER MARKET, BY PRODUCT, 2014-2030 (USD THOUSAND)
TABLE 503 AUSTRALIA CONSTRUCTION/ASSEMBLY IN TACKIFIER MARKET, BY TYPE, 2014-2030 (USD THOUSAND)
TABLE 504 AUSTRALIA CONSTRUCTION/ASSEMBLY IN TACKIFIER MARKET, BY PRODUCT, 2014-2030 (USD THOUSAND)
TABLE 505 AUSTRALIA NONWOVEN IN TACKIFIER MARKET, BY PRODUCT, 2014-2030 (USD THOUSAND)
TABLE 506 AUSTRALIA BOOKBINDING IN TACKIFIER MARKET, BY PRODUCT, 2014-2030 (USD THOUSAND)
TABLE 507 AUSTRALIA OTHERS IN TACKIFIER MARKET, BY PRODUCT, 2014-2030 (USD THOUSAND)
TABLE 508 SINGAPORE TACKIFIER MARKET, BY PRODUCT, 2014-2030 (USD THOUSAND)
TABLE 509 SINGAPORE TACKIFIER MARKET, BY FEEDSTOCK, 2014-2030 (USD THOUSAND)
TABLE 510 SINGAPORE TACKIFIER MARKET, BY FORM, 2014-2030 (USD THOUSAND)
TABLE 511 SINGAPORE TACKIFIER MARKET, BY APPLICATION, 2014-2030 (USD THOUSAND)
TABLE 512 SINGAPORE TACKIFIER MARKET, BY END-USER, 2014-2030 (USD THOUSAND)
TABLE 513 SINGAPORE PACKAGING IN TACKIFIER MARKET, BY PRODUCT, 2014-2030 (USD THOUSAND)
TABLE 514 SINGAPORE CONSTRUCTION/ASSEMBLY IN TACKIFIER MARKET, BY TYPE, 2014-2030 (USD THOUSAND)
TABLE 515 GLOBAL CONSTRUCTION/ASSEMBLY IN TACKIFIER MARKET, BY PRODUCT, 2014-2030 (USD THOUSAND)
TABLE 516 SINGAPORE NONWOVEN IN TACKIFIER MARKET, BY PRODUCT, 2014-2030 (USD THOUSAND)
TABLE 517 SINGAPORE BOOKBINDING IN TACKIFIER MARKET, BY PRODUCT, 2014-2030 (USD THOUSAND)
TABLE 518 SINGAPORE OTHERS IN TACKIFIER MARKET, BY PRODUCT, 2014-2030 (USD THOUSAND)
TABLE 519 THAILAND TACKIFIER MARKET, BY PRODUCT, 2014-2030 (USD THOUSAND)
TABLE 520 THAILAND TACKIFIER MARKET, BY FEEDSTOCK, 2014-2030 (USD THOUSAND)
TABLE 521 THAILAND TACKIFIER MARKET, BY FORM, 2014-2030 (USD THOUSAND)
TABLE 522 THAILAND TACKIFIER MARKET, BY APPLICATION, 2014-2030 (USD THOUSAND)
TABLE 523 THAILAND TACKIFIER MARKET, BY END-USER, 2014-2030 (USD THOUSAND)
TABLE 524 THAILAND PACKAGING IN TACKIFIER MARKET, BY TYPE, 2014-2030 (USD THOUSAND)
TABLE 525 THAILAND PACKAGING IN TACKIFIER MARKET, BY PRODUCT, 2014-2030 (USD THOUSAND)
TABLE 526 THAILAND CONSTRUCTION/ASSEMBLY IN TACKIFIER MARKET, BY TYPE, 2014-2030 (USD THOUSAND)
TABLE 527 THAILAND CONSTRUCTION/ASSEMBLY IN TACKIFIER MARKET, BY PRODUCT, 2014-2030 (USD THOUSAND)
TABLE 528 THAILAND NONWOVEN IN TACKIFIER MARKET, BY PRODUCT, 2014-2030 (USD THOUSAND)
TABLE 529 THAILAND BOOKBINDING IN TACKIFIER MARKET, BY PRODUCT, 2014-2030 (USD THOUSAND)
TABLE 530 THAILAND OTHERS IN TACKIFIER MARKET, BY PRODUCT, 2014-2030 (USD THOUSAND)
TABLE 531 MALAYSIA TACKIFIER MARKET, BY PRODUCT, 2014-2030 (USD THOUSAND)
TABLE 532 MALAYSIA TACKIFIER MARKET, BY FEEDSTOCK, 2014-2030 (USD THOUSAND)
TABLE 533 MALAYSIA TACKIFIER MARKET, BY FORM, 2014-2030 (USD THOUSAND)
TABLE 534 MALAYSIA TACKIFIER MARKET, BY APPLICATION, 2014-2030 (USD THOUSAND)
TABLE 535 MALAYSIA TACKIFIER MARKET, BY END-USER, 2014-2030 (USD THOUSAND)
TABLE 536 MALAYSIA PACKAGING IN TACKIFIER MARKET, BY TYPE, 2014-2030 (USD THOUSAND)
TABLE 537 MALAYSIA PACKAGING IN TACKIFIER MARKET, BY PRODUCT, 2014-2030 (USD THOUSAND)
TABLE 538 MALAYSIA CONSTRUCTION/ASSEMBLY IN TACKIFIER MARKET, BY TYPE, 2014-2030 (USD THOUSAND)
TABLE 539 MALAYSIA CONSTRUCTION/ASSEMBLY IN TACKIFIER MARKET, BY PRODUCT, 2014-2030 (USD THOUSAND)
TABLE 540 MALAYSIA NONWOVEN IN TACKIFIER MARKET, BY PRODUCT, 2014-2030 (USD THOUSAND)
TABLE 541 MALAYSIA BOOKBINDING IN TACKIFIER MARKET, BY PRODUCT, 2014-2030 (USD THOUSAND)
TABLE 542 MALAYSIA OTHERS IN TACKIFIER MARKET, BY PRODUCT, 2014-2030 (USD THOUSAND)
TABLE 543 INDONESIA TACKIFIER MARKET, BY PRODUCT, 2014-2030 (USD THOUSAND)
TABLE 544 INDONESIA TACKIFIER MARKET, BY FEEDSTOCK, 2014-2030 (USD THOUSAND)
TABLE 545 INDONESIA TACKIFIER MARKET, BY FORM, 2014-2030 (USD THOUSAND)
TABLE 546 INDONESIA TACKIFIER MARKET, BY APPLICATION, 2014-2030 (USD THOUSAND)
TABLE 547 INDONESIA TACKIFIER MARKET, BY END-USER, 2014-2030 (USD THOUSAND)
TABLE 548 INDONESIA PACKAGING IN TACKIFIER MARKET, BY TYPE, 2014-2030 (USD THOUSAND)
TABLE 549 INDONESIA PACKAGING IN TACKIFIER MARKET, BY PRODUCT, 2014-2030 (USD THOUSAND)
TABLE 550 INDONESIA CONSTRUCTION/ASSEMBLY IN TACKIFIER MARKET, BY TYPE, 2014-2030 (USD THOUSAND)
TABLE 551 INDONESIA CONSTRUCTION/ASSEMBLY IN TACKIFIER MARKET, BY PRODUCT, 2014-2030 (USD THOUSAND)
TABLE 552 INDONESIA NONWOVEN IN TACKIFIER MARKET, BY PRODUCT, 2014-2030 (USD THOUSAND)
TABLE 553 INDONESIA BOOKBINDING IN TACKIFIER MARKET, BY PRODUCT, 2014-2030 (USD THOUSAND)
TABLE 554 INDONESIA OTHERS IN TACKIFIER MARKET, BY PRODUCT, 2014-2030 (USD THOUSAND)
TABLE 555 TAIWAN TACKIFIER MARKET, BY PRODUCT, 2014-2030 (USD THOUSAND)
TABLE 556 TAIWAN TACKIFIER MARKET, BY FEEDSTOCK, 2014-2030 (USD THOUSAND)
TABLE 557 TAIWAN TACKIFIER MARKET, BY FORM, 2014-2030 (USD THOUSAND)
TABLE 558 TAIWAN TACKIFIER MARKET, BY APPLICATION, 2014-2030 (USD THOUSAND)
TABLE 559 TAIWAN TACKIFIER MARKET, BY END-USER, 2014-2030 (USD THOUSAND)
TABLE 560 TAIWAN PACKAGING IN TACKIFIER MARKET, BY TYPE, 2014-2030 (USD THOUSAND)
TABLE 561 TAIWAN PACKAGING IN TACKIFIER MARKET, BY PRODUCT, 2014-2030 (USD THOUSAND)
TABLE 562 TAIWAN CONSTRUCTION/ASSEMBLY IN TACKIFIER MARKET, BY TYPE, 2014-2030 (USD THOUSAND)
TABLE 563 TAIWAN CONSTRUCTION/ASSEMBLY IN TACKIFIER MARKET, BY PRODUCT, 2014-2030 (USD THOUSAND)
TABLE 564 TAIWAN NONWOVEN IN TACKIFIER MARKET, BY PRODUCT, 2014-2030 (USD THOUSAND)
TABLE 565 TAIWAN BOOKBINDING IN TACKIFIER MARKET, BY PRODUCT, 2014-2030 (USD THOUSAND)
TABLE 566 TAIWAN OTHERS IN TACKIFIER MARKET, BY PRODUCT, 2014-2030 (USD THOUSAND)
TABLE 567 NEW ZEALAND TACKIFIER MARKET, BY PRODUCT, 2014-2030 (USD THOUSAND)
TABLE 568 NEW ZEALAND TACKIFIER MARKET, BY FEEDSTOCK, 2014-2030 (USD THOUSAND)
TABLE 569 NEW ZEALAND TACKIFIER MARKET, BY FORM, 2014-2030 (USD THOUSAND)
TABLE 570 NEW ZEALAND TACKIFIER MARKET, BY APPLICATION, 2014-2030 (USD THOUSAND)
TABLE 571 NEW ZEALAND TACKIFIER MARKET, BY END-USER, 2014-2030 (USD THOUSAND)
TABLE 572 NEW ZEALAND PACKAGING IN TACKIFIER MARKET, BY TYPE, 2014-2030 (USD THOUSAND)
TABLE 573 NEW ZEALAND PACKAGING IN TACKIFIER MARKET, BY PRODUCT, 2014-2030 (USD THOUSAND)
TABLE 574 NEW ZEALAND CONSTRUCTION/ASSEMBLY IN TACKIFIER MARKET, BY TYPE, 2014-2030 (USD THOUSAND)
TABLE 575 NEW ZEALAND CONSTRUCTION/ASSEMBLY IN TACKIFIER MARKET, BY PRODUCT, 2014-2030 (USD THOUSAND)
TABLE 576 NEW ZEALAND NONWOVEN IN TACKIFIER MARKET, BY PRODUCT, 2014-2030 (USD THOUSAND)
TABLE 577 NEW ZEALAND BOOKBINDING IN TACKIFIER MARKET, BY PRODUCT, 2014-2030 (USD THOUSAND)
TABLE 578 NEW ZEALAND OTHERS IN TACKIFIER MARKET, BY PRODUCT, 2014-2030 (USD THOUSAND)
TABLE 579 PHILIPPINES TACKIFIER MARKET, BY PRODUCT, 2014-2030 (USD THOUSAND)
TABLE 580 PHILIPPINES TACKIFIER MARKET, BY FEEDSTOCK, 2014-2030 (USD THOUSAND)
TABLE 581 PHILIPPINES TACKIFIER MARKET, BY FORM, 2014-2030 (USD THOUSAND)
TABLE 582 PHILIPPINES TACKIFIER MARKET, BY APPLICATION, 2014-2030 (USD THOUSAND)
TABLE 583 PHILIPPINES TACKIFIER MARKET, BY END-USER, 2014-2030 (USD THOUSAND)
TABLE 584 PHILIPPINES PACKAGING IN TACKIFIER MARKET, BY TYPE, 2014-2030 (USD THOUSAND)
TABLE 585 PHILIPPINES PACKAGING IN TACKIFIER MARKET, BY PRODUCT, 2014-2030 (USD THOUSAND)
TABLE 586 PHILIPPINES CONSTRUCTION/ASSEMBLY IN TACKIFIER MARKET, BY TYPE, 2014-2030 (USD THOUSAND)
TABLE 587 PHILIPPINES CONSTRUCTION/ASSEMBLY IN TACKIFIER MARKET, BY PRODUCT, 2014-2030 (USD THOUSAND)
TABLE 588 PHILIPPINES NONWOVEN IN TACKIFIER MARKET, BY PRODUCT, 2014-2030 (USD THOUSAND)
TABLE 589 PHILIPPINES BOOKBINDING IN TACKIFIER MARKET, BY PRODUCT, 2014-2030 (USD THOUSAND)
TABLE 590 PHILIPPINES OTHERS IN TACKIFIER MARKET, BY PRODUCT, 2014-2030 (USD THOUSAND)
TABLE 591 VIETNAM TACKIFIER MARKET, BY PRODUCT, 2014-2030 (USD THOUSAND)
TABLE 592 VIETNAM TACKIFIER MARKET, BY FEEDSTOCK, 2014-2030 (USD THOUSAND)
TABLE 593 VIETNAM TACKIFIER MARKET, BY FORM, 2014-2030 (USD THOUSAND)
TABLE 594 VIETNAM TACKIFIER MARKET, BY APPLICATION, 2014-2030 (USD THOUSAND)
TABLE 595 VIETNAM TACKIFIER MARKET, BY END-USER, 2014-2030 (USD THOUSAND)
TABLE 596 VIETNAM PACKAGING IN TACKIFIER MARKET, BY TYPE, 2014-2030 (USD THOUSAND)
TABLE 597 VIETNAM PACKAGING IN TACKIFIER MARKET, BY PRODUCT, 2014-2030 (USD THOUSAND)
TABLE 598 VIETNAM CONSTRUCTION/ASSEMBLY IN TACKIFIER MARKET, BY TYPE, 2014-2030 (USD THOUSAND)
TABLE 599 VIETNAM CONSTRUCTION/ASSEMBLY IN TACKIFIER MARKET, BY PRODUCT, 2014-2030 (USD THOUSAND)
TABLE 600 VIETNAM NONWOVEN IN TACKIFIER MARKET, BY PRODUCT, 2014-2030 (USD THOUSAND)
TABLE 601 VIETNAM BOOKBINDING IN TACKIFIER MARKET, BY PRODUCT, 2014-2030 (USD THOUSAND)
TABLE 602 VIETNAM OTHERS IN TACKIFIER MARKET, BY PRODUCT, 2014-2030 (USD THOUSAND)
TABLE 603 REST OF ASIA-PACIFIC TACKIFIER MARKET, BY PRODUCT, 2014-2030 (USD THOUSAND)
Lista de figuras
FIGURE 1 GLOBAL TACKIFIER MARKET: SEGMENTATION
FIGURE 2 GLOBAL TACKIFIER MARKET: DATA TRIANGULATION
FIGURE 3 GLOBAL TACKIFIER MARKET: DROC ANALYSIS
FIGURE 4 GLOBAL TACKIFIER MARKET: GLOBAL VS REGIONAL MARKET ANALYSIS
FIGURE 5 GLOBAL TACKIFIER MARKET: COMPANY RESEARCH ANALYSIS
FIGURE 6 GLOBAL TACKIFIER MARKET: INTERVIEW DEMOGRAPHICS
FIGURE 7 GLOBAL TACKIFIER MARKET: DBMR MARKET POSITION GRID
FIGURE 8 GLOBAL TACKIFIER MARKET: MARKET APPLICATION COVERAGE GRID
FIGURE 9 GLOBAL TACKIFIER MARKET: MULTIVARIATE MODELLING
FIGURE 10 GLOBAL TACKIFIER MARKET: PRODUCT
FIGURE 11 GLOBAL TACKIFIER MARKET: SEGMENTATION
FIGURE 12 EUROPE IS EXPECTED TO DOMINATE THE MARKET AND IS THE FASTEST-GROWING REGION IN THE GLOBAL TACKIFIER MARKET IN THE FORECAST PERIOD OF 2023 TO 2030
FIGURE 13 EUROPE IS THE FASTEST-GROWING MARKET FOR GLOBAL TACKIFIER MARKET MANUFACTURERS IN THE FORECAST PERIOD OF 2023 TO 2030
FIGURE 14 INCREASE IN USAGE OF TACKIFIER IN DIFFERENT END-USER INDUSTRY IS EXPECTED TO DRIVE THE GROWTH OF THE GLOBAL TACKIFIER MARKET IN THE FORECAST PERIOD OF 2023 TO 2030
FIGURE 15 HYDROCARNON RESIN SEGMENT IS EXPECTED TO ACCOUNT FOR THE LARGEST SHARE OF THE GLOBAL TACKIFIER MARKET FROM 2023 TO 2030
FIGURE 16 DRIVERS, OPPORTUNITIES, CHALLENGES, AND RESTRAINTS OF THE GLOBAL TACKIFIER MARKET
FIGURE 17 GLOBAL TACKIFIER MARKET: BY PRODUCT, 2022
FIGURE 18 GLOBAL TACKIFIER MARKET: BY FEEDSTOCK, 2022
FIGURE 19 GLOBAL TACKIFIER MARKET: BY FORM, 2022
FIGURE 20 GLOBAL TACKIFIER MARKET: BY APPLICATION, 2022
FIGURE 21 GLOBAL TACKIFIER MARKET: BY END-USER, 2022
FIGURE 22 GLOBAL TACKIFIER MARKET: SNAPSHOT (2022)
FIGURE 23 GLOBAL TACKIFIER MARKET: COMPANY SHARE 2022 (%)
FIGURE 24 EUROPE TACKIFIER MARKET: COMPANY SHARE 2022 (%)
FIGURE 25 ASIA-PACIFIC TACKIFIER MARKET: COMPANY SHARE 2022 (%)
FIGURE 26 NORTH AMERICA TACKIFIER MARKET: COMPANY SHARE 2022 (%)
Metodología de investigación
La recopilación de datos y el análisis del año base se realizan utilizando módulos de recopilación de datos con muestras de gran tamaño. La etapa incluye la obtención de información de mercado o datos relacionados a través de varias fuentes y estrategias. Incluye el examen y la planificación de todos los datos adquiridos del pasado con antelación. Asimismo, abarca el examen de las inconsistencias de información observadas en diferentes fuentes de información. Los datos de mercado se analizan y estiman utilizando modelos estadísticos y coherentes de mercado. Además, el análisis de la participación de mercado y el análisis de tendencias clave son los principales factores de éxito en el informe de mercado. Para obtener más información, solicite una llamada de un analista o envíe su consulta.
La metodología de investigación clave utilizada por el equipo de investigación de DBMR es la triangulación de datos, que implica la extracción de datos, el análisis del impacto de las variables de datos en el mercado y la validación primaria (experto en la industria). Los modelos de datos incluyen cuadrícula de posicionamiento de proveedores, análisis de línea de tiempo de mercado, descripción general y guía del mercado, cuadrícula de posicionamiento de la empresa, análisis de patentes, análisis de precios, análisis de participación de mercado de la empresa, estándares de medición, análisis global versus regional y de participación de proveedores. Para obtener más información sobre la metodología de investigación, envíe una consulta para hablar con nuestros expertos de la industria.
Personalización disponible
Data Bridge Market Research es líder en investigación formativa avanzada. Nos enorgullecemos de brindar servicios a nuestros clientes existentes y nuevos con datos y análisis que coinciden y se adaptan a sus objetivos. El informe se puede personalizar para incluir análisis de tendencias de precios de marcas objetivo, comprensión del mercado de países adicionales (solicite la lista de países), datos de resultados de ensayos clínicos, revisión de literatura, análisis de mercado renovado y base de productos. El análisis de mercado de competidores objetivo se puede analizar desde análisis basados en tecnología hasta estrategias de cartera de mercado. Podemos agregar tantos competidores sobre los que necesite datos en el formato y estilo de datos que esté buscando. Nuestro equipo de analistas también puede proporcionarle datos en archivos de Excel sin procesar, tablas dinámicas (libro de datos) o puede ayudarlo a crear presentaciones a partir de los conjuntos de datos disponibles en el informe.

