

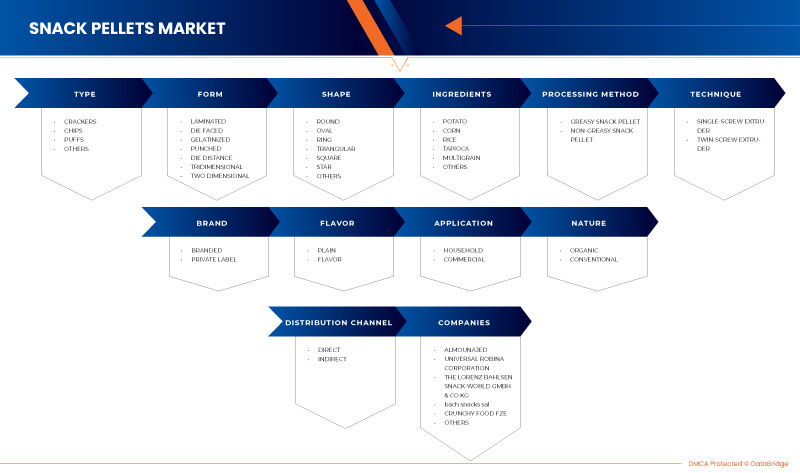
Global Snack Pellets Market, By Type (Crackers, Chips, Puffs, and Others), Form (Laminated, Die Faced, Gelatinized, Punched, Die Distance, Tridimensional and Two Dimensional), Shape (Round, Oval, Ring, Triangular, Square, Star, and Others), Ingredients (Potato, Corn, Rice, Tapioca, Multigrain, and Others), Processing Method (Greasy Snack Pellet and Non-Greasy Snack Pellet), Nature (Organic and Conventional), Technique (Single-Screw Extruder and Twin-Screw Extruder), Brand (Branded and Private Label), Flavor (Plain and Flavor), Application (Household and Commercial), Distribution Channel (Direct and Indirect) – Industry Trends and Forecast to 2029
Market Analysis and Insights
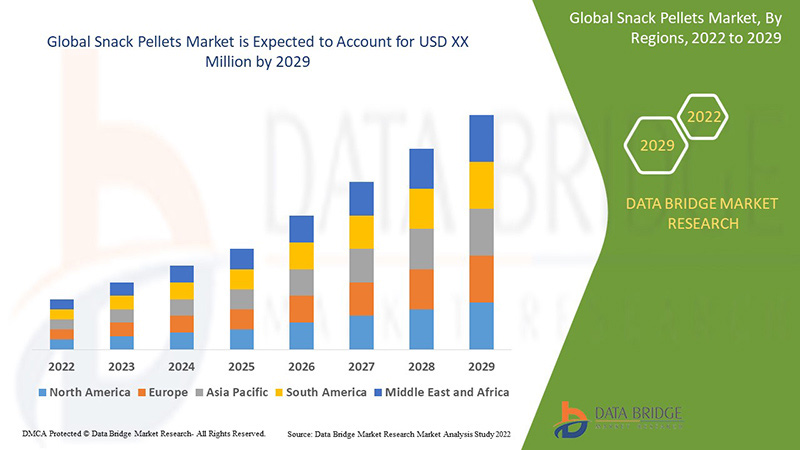
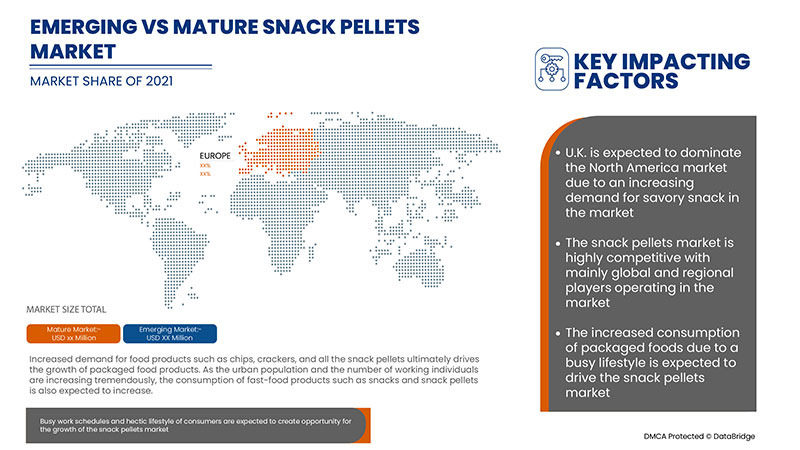
Increased consumption of packaged foods due to busy lifestyles coupled with rising demand for savory snacks is expected to drive the market growth of the global snack pellets market over the forecast period. Data Bridge Market Research analyses that the global snack pellets market will grow at a CAGR of 5.8% during the forecast period of 2022 to 2029.

|
Report Metric |
Details |
|
Forecast Period |
2022 to 2029 |
|
Base Year |
2021 |
|
Historic Year |
2020 (Customizable to 2020 - 2015) |
|
Quantitative Units |
Revenue in USD Million, Pricing in USD |
|
Segments Covered |
By Type (Crackers, Chips, Puffs, and Others), Form (Laminated, Die Faced, Gelatinized, Punched, Die Distance, Tridimensional and Two Dimensional), Shape (Round, Oval, Ring, Triangular, Square, Star, and Others), Ingredients (Potato, Corn, Rice, Tapioca, Multigrain, and Others), Processing Method (Greasy Snack Pellet and Non-Greasy Snack Pellet), Nature (Organic and Conventional), Technique (Single-Screw Extruder and Twin-Screw Extruder), Brand (Branded and Private Label), Flavor (Plain and Flavor), Application (Household and Commercial), Distribution Channel (Direct and Indirect) |
|
Countries Covered |
U.S., Canada, Mexico, Germany, U.K., Italy, France, Spain, Russia, Turkey, Switzerland, Belgium, Netherlands, Denmark, Sweden, Poland, Rest of Europe, Japan, China, South Korea, India, Australia, Singapore, Thailand, Indonesia, New Zealand, Vietnam, Malaysia, Philippines, Rest of Asia-Pacific, Brazil, Argentina, Rest of South America, South Africa, Kuwait, Qatar, Oman, Saudi Arabia, U.A.E., and Rest of the Middle East and Africa |
|
Market Players Covered |
Español BACH SNACKS SAL, Calbee, McFills Enterprises Pvt. Ltd., Sibell, JR Short Snack Products, GRUPO MICHEL, LC America, Inc., Akkel Group., Almounajed Food Industries, Chhajed Foods Pvt. Ltd, Fiorentini Alimentari SpA, Gustinos, Jednosc Sp. z o. o, Productos Alimenticios La Moderna SA de CV, Le Caselle SPA, mafin, Noble Agro Food Products Private Limited, Oriental Food Industries Sdn. Bhd., Snack Creations Ltd., Palmex, SOLINO GROUP, VIJAY INDUSTRIES, Kabir Foods, Universal Robina Corporation, JLM Global Foods, Jopellets, Popchips, Limagrain – Ingredientes, Pol-Foods Sp. Entre otras, se encuentran: Z OO, Al-Qasrawi, Attaybat, Quality Pellets, Pellsnack Products GmbH, Dalmaza Food Industries Co. (Dafico), matarile, Nutradia, Crunchy Food FZE, The Lorenz Bahlsen Snack-World GmbH & Co KG Germany, BFY BRANDS, TTK, Intersnack Group GmbH & Co. KG, Leng-d'Or, V.AL.IN. SRL, YUPI SAS, Bag Snacks, GUANGDONG YUSHENG FOOD INDUSTRIES CO., LTD., VMF (Van Marcke Foods), Continental Snacks, Roger&Roger. |
Definición de mercado
Los snack pellets son un ingrediente semiacabado, lo que significa que una vez producidos por los fabricantes, están listos para que los clientes los transformen en sus innovadores productos terminados. Los snack pellets son una forma versátil e innovadora de revolucionar la categoría de snacks. Existen muchos beneficios para que las marcas de snacks consideren los pellets dentro de su cartera. Se pueden utilizar bases nuevas y de tendencia hechas con aire caliente o sin aceite. Los snack pellets también pueden funcionar sin condimentos. Los snack pellets mantienen bien el sabor. Estos incluyen varios tipos, sabores y formas.
Dinámica del mercado mundial de snacks en pellets
Conductores
- Aumento del consumo de alimentos envasados debido a un estilo de vida ajetreado
Es probable que el aumento del consumo de alimentos envasados impulse el crecimiento del mercado mundial de snacks en pellets durante el período de pronóstico. Además, se espera que la inclinación de los consumidores hacia los productos alimenticios saludables acelere la demanda de snacks en pellets a base de cereales, lo que también está ayudando al mercado a crecer en los próximos años. Para garantizar esto, los fabricantes de snacks en pellets se están centrando en la producción de snacks saludables, que tienen un alto contenido nutricional.
- Aumento de la demanda de snacks salados
La creciente demanda de productos alimenticios convenientes, de fácil disponibilidad y bajo costo es una de las principales razones de la alta demanda de bocadillos salados como papas fritas y galletas saladas, entre otros.
El consumo de tentempiés entre comidas ha experimentado un auge entre los consumidores de todas las edades. Además, los consumidores también demandan tentempiés saludables que combinen nutrición y comodidad.
- Aumentar la sustitución de comidas por snacks saludables
Un snack se define generalmente como cualquier alimento que se consume entre las comidas principales. Muchas personas comen al menos una vez durante el día y existen varias razones por las que los consumidores prefieren tomar snacks, ya que experimentan una caída en los niveles de energía que un pequeño bocado puede remediar. Además, esperan con ansias probar el sabor de ciertos snacks.

Oportunidades
- La aparición de los snacks saludables en forma de pellet
Los snacks saludables ya no son una tendencia pasajera, sino que se han convertido en algo esencial para los consumidores debido a la creciente concienciación sobre la salud. Para satisfacer las fuertes expectativas y demandas de los consumidores, los fabricantes están desarrollando snacks saludables en forma de pellets con un perfil nutricional mejorado.
La introducción de snacks más saludables depende del tipo de aceite con el que se cocinen. Por ejemplo, ahora los consumidores buscan patatas fritas cocinadas con opciones de aceite más saludables, como el de girasol, que tiene la mitad de grasas saturadas que el de semilla de algodón. El aceite de girasol, en cambio, contiene grasas insaturadas, un tipo de grasa que es buena para el corazón. Las patatas fritas y las galletas saladas cocinadas con aceite de soja son otras opciones que no contienen grasas saturadas.
Restricciones/Desafíos
- Precios fluctuantes de las materias primas
A medida que aumenta el precio de las materias primas, afecta a toda la cadena de suministro, desde los fabricantes hasta el canal de distribución y la empresa de comercialización, y principalmente a los consumidores con bajos ingresos. Si aumentan los precios de las materias primas, también aumentarán los precios del producto terminado. Este es el principal factor restrictivo para el mercado de pellets de snack. Las materias primas necesarias para los pellets de snack son las patatas, el maíz, el arroz, la tapioca, los cereales integrales y otros. El aumento de los precios de estas materias primas puede obstaculizar el crecimiento del mercado de pellets de snack, ya que a los fabricantes de pellets de snack les resulta difícil comprar materias primas como patatas, arroz, tapioca y otros en medio de la fluctuación de los precios.
- Alto costo asociado con las máquinas de papas fritas
Las máquinas y equipos necesarios para fabricar patatas fritas se refieren a un conjunto de máquinas que se utilizan para producir patatas fritas a partir de patatas frescas. En otras palabras, es una línea completa de producción de patatas fritas con varias máquinas de procesamiento. Es decir, hay máquinas clasificadoras y calibradoras de patatas, máquinas para lavar y pelar patatas, escaldadoras de patatas, máquinas desaguadoras, máquinas para freír patatas fritas, máquinas desaceitadoras y enfriadoras, máquinas aromatizadoras, máquinas envasadoras y máquinas de manipulación de productos.
Impacto posterior al COVID-19 en el mercado mundial de snacks en pellets
La COVID-19 ha interrumpido la cadena de suministro y ha reducido el crecimiento del mercado de snacks en pellets. Las interrupciones han provocado retrasos en el stock, así como un menor acceso, suministro y consumo de snacks. Con la persistencia de la COVID-19, ha habido restricciones en el transporte, la importación y la exportación de productos alimenticios y bebidas. Además, con la restricción de movimiento de los trabajadores también se ha visto afectada la fabricación de snacks en pellets, por lo que no se ha satisfecho la demanda de los consumidores.
Además, debido a las restricciones a la importación y exportación, a los fabricantes se les hizo difícil suministrar materias primas y productos finales en todo el país, lo que afectó los precios de los snacks en pellets. Por lo tanto, debido a la COVID-19, la cadena de suministro de alimentos se vio interrumpida, lo que creó un gran desafío para el mercado. Sin embargo, los fabricantes ahora están lidiando con la situación, ya que se han eliminado muchas de las restricciones.
Alcance del mercado mundial de pellets para snacks
El mercado mundial de pellets para snacks se divide en once segmentos importantes según el tipo, la forma, la figura, los ingredientes, el método de procesamiento, la naturaleza, la técnica, la marca, el sabor, la aplicación y el canal de distribución. El crecimiento entre estos segmentos le ayudará a analizar los principales segmentos de crecimiento en las industrias y brindará a los usuarios una valiosa descripción general del mercado y conocimientos del mercado para tomar decisiones estratégicas para identificar las principales aplicaciones del mercado.
Tipo
- Galletas
- Papas fritas
- Bocanadas
- Otros
Según el tipo, el mercado mundial de snacks en pellets se segmenta en galletas saladas, patatas fritas, bocaditos y otros.
Forma
- Laminado
- Morir cara a cara
- Gelatinizado
- Perforado
- La distancia
- Tridimensional
- Bidimensional
Sobre la base de la forma, el mercado mundial de pellets de snack se segmenta en laminados, troquelados, gelatinizados, perforados, con distancia de troquel, tridimensionales y bidimensionales.
Forma
- Redondo
- Oval
- Anillo
- Triangular
- Cuadrado
- Estrella
- Otros (si los hay)
Sobre la base de la forma, el mercado mundial de pellets de snack se segmenta en redondos, ovalados, anulares, triangulares, cuadrados, de estrella y otros.
Ingredientes
- Papa
- Maíz
- Arroz
- Tapioca
- Multigrano
- Otros
Sobre la base de los ingredientes, el mercado mundial de pellets de snack está segmentado en papa, maíz, arroz, tapioca, multicereales y otros.
Método de procesamiento
- Bolitas de bocadillos grasosos
- Snack en bolitas sin grasa
Sobre la base del método de procesamiento, el mercado mundial de pellets de snack se segmenta en pellets de snacks grasosos y pellets de snacks no grasosos.
Naturaleza
- Orgánico
- Convencional
Sobre la base de la naturaleza, el mercado mundial de pellets de snack se segmenta en orgánico y convencional.
Técnica
- Extrusora de un solo tornillo
- Extrusora de doble husillo
Sobre la base de la técnica, el mercado mundial de pellets de snack está segmentado en extrusoras de un solo tornillo y extrusoras de doble tornillo.
Marca
- De marca
- Marca privada
Sobre la base de la marca, el mercado mundial de pellets de snack se segmenta en marcas de marca y marcas privadas.
Sabor
- Plano
- Sabor
En función del sabor, el mercado mundial de snacks en pellets se segmenta en simples y con sabor.
Solicitud
- Familiar
- Comercial
Sobre la base de la aplicación, el mercado global de pellets para snacks se segmenta en doméstico y comercial.
Canal de distribución
- Directo
- Indirecto
Sobre la base de los canales de distribución, el mercado mundial de pellets de snack se segmenta en directo e indirecto.
Análisis y perspectivas regionales del mercado mundial de pellets para snacks
Se analiza el mercado global de pellets de snack y se proporcionan información y tendencias del tamaño del mercado por tipo, forma, forma, ingredientes, método de procesamiento, naturaleza, técnica, marca, sabor, aplicación y canales de distribución.
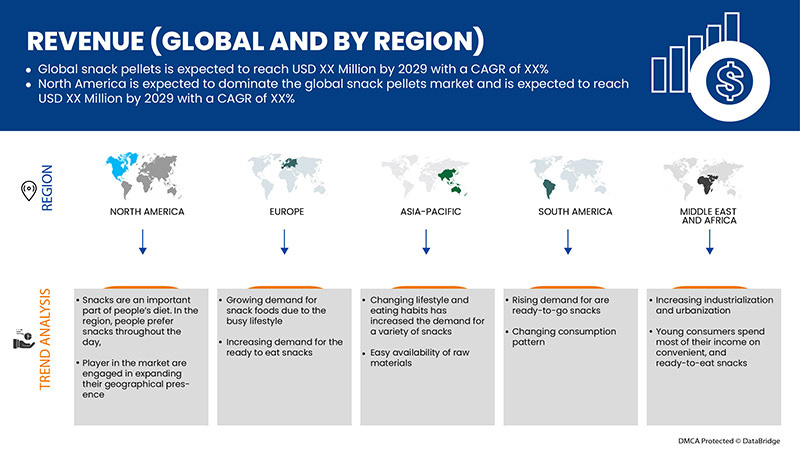
The regions covered in the snack pellets market report are North America, Europe, Asia-Pacific, South America and the Middle East and Africa. These regions are further segmented into - U.S., Canada, Mexico, Germany, U.K., Italy, France, Spain, Russia, Turkey, Switzerland, Belgium, Netherlands, Denmark, Sweden, Poland, Rest of Europe, Japan, China, South Korea, India, Australia, Singapore, Thailand, Indonesia, New Zealand, Vietnam, Malaysia, Philippines, Rest of Asia-Pacific, Brazil, Argentina, Rest of South America, South Africa, Kuwait, Qatar, Oman, Saudi Arabia, U.A.E., and Rest of the Middle East and Africa.
North America is expected to dominate the snack pellets market during the forecast period due to growing demand for ready-to-eat snacks as a meal replacement.
The country section of the report also provides individual market impacting factors and changes in regulations in the market that impact the current and future trends of the market. Data points, such as new and replacement sales, country demographics, disease epidemiology, and import-export tariffs, are some of the major pointers used to forecast the market scenario for individual countries. In addition, the presence and availability of global brands and their challenges faced due to high competition from local and domestic brands and the impact of sales channels are considered while providing forecast analysis of the country data.
Competitive Landscape and Global Snack Pellets Market Share Analysis
The global snack pellets market competitive landscape provides details by the competitors. Details included are company overview, company financials, revenue generated, market potential, investment in research and development, new market initiatives, global presence, production sites and facilities, production capacities, company strengths and weaknesses, product launch, product width and breadth, and application dominance. The above data points provided are only related to the companies' focus on the snack pellets market.
Algunos de los principales actores que operan en el mercado global de pellets de snack son BACH SNACKS SAL, Calbee, McFills Enterprises Pvt. Ltd., Sibell, JR Short Snack Products, GRUPO MICHEL, LC America, Inc., Akkel Group., Almounajed Food Industries, Chhajed Foods Pvt. Ltd, Fiorentini Alimentari SpA, Gustinos, Jednosc Sp. z o. o, Productos Alimenticios La Moderna SA de CV, Le Caselle SPA, mafin, Noble Agro Food Products Private Limited, Oriental Food Industries Sdn. Bhd., Snack Creations Ltd., Palmex, SOLINO GROUP, VIJAY INDUSTRIES, Kabir Foods, Universal Robina Corporation, JLM Global Foods, Jopellets, Popchips, Limagrain – Ingrédients, Pol-Foods Sp. Entre ellas se encuentran: Z OO, Al-Qasrawi, Attaybat, Quality Pellets, Pellsnack Products GmbH, Dalmaza Food Industries Co. (Dafico), matarile, Nutradia, Crunchy Food FZE, The Lorenz Bahlsen Snack-World GmbH & Co KG Germany, BFY BRANDS, TTK, Intersnack Group GmbH & Co. KG, Leng-d'Or, V.AL.IN. SRL, YUPI SAS, Bag Snacks, GUANGDONG YUSHENG FOOD INDUSTRIES CO., LTD., VMF (Van Marcke Foods), Continental Snacks, Roger&Roger, entre otras.
Metodología de la investigación
La recopilación de datos y el análisis del año base se realizan utilizando módulos de recopilación de datos con tamaños de muestra grandes. Los datos del mercado se analizan y estiman utilizando modelos estadísticos y coherentes del mercado. Además, el análisis de la participación de mercado y el análisis de tendencias clave son los principales factores de éxito en el informe de mercado. La metodología de investigación clave utilizada por el equipo de investigación de DBMR es la triangulación de datos que implica la extracción de datos, el análisis del impacto de las variables de datos en el mercado y la validación primaria (experto en la industria). Aparte de esto, los modelos de datos incluyen la cuadrícula de posicionamiento de proveedores, el análisis de la línea de tiempo del mercado, la descripción general y la guía del mercado, la cuadrícula de posicionamiento de la empresa, el análisis de la participación de mercado de la empresa, los estándares de medición, el análisis global frente al regional y el análisis de la participación de los proveedores. Solicite una llamada de un analista en caso de tener más consultas.
SKU-
Obtenga acceso en línea al informe sobre la primera nube de inteligencia de mercado del mundo

- Panel de análisis de datos interactivo
- Panel de análisis de empresas para oportunidades con alto potencial de crecimiento
- Acceso de analista de investigación para personalización y consultas
- Análisis de la competencia con panel interactivo
- Últimas noticias, actualizaciones y análisis de tendencias
- Aproveche el poder del análisis de referencia para un seguimiento integral de la competencia
Tabla de contenido
1 INTRODUCTION
1.1 OBJECTIVES OF THE STUDY
1.2 MARKET DEFINITION
1.3 OVERVIEW OF THE GLOBAL SNACK PELLETS MARKET
1.4 LIMITATIONS
1.5 MARKETS COVERED
2 MARKET SEGMENTATION
2.1 MARKETS COVERED
2.2 GEOGRAPHICAL SCOPE
2.3 YEARS CONSIDERED FOR THE STUDY
2.4 CURRENCY AND PRICING
2.5 DBMR TRIPOD DATA VALIDATION MODEL
2.6 MULTIVARIATE MODELLING
2.7 TYPE LIFELINE CURVE
2.8 PRIMARY INTERVIEWS WITH KEY OPINION LEADERS
2.9 DBMR MARKET POSITION GRID
2.1 MARKET APPLICATION COVERAGE GRID
2.11 VENDOR SHARE ANALYSIS
2.12 SECONDARY SOURCES
2.13 ASSUMPTIONS
3 EXECUTIVE SUMMARY
4 PREMIUM INSIGHTS
4.1 BRAND COMPETITIVE ANALYSIS
4.2 LABELING & CLAIMS:
4.3 NEW PRODUCT LAUNCH STRATEGY
4.3.1 OVERVIEW
4.3.2 NUMBER OF PRODUCT LAUNCHES
4.3.2.1 LINE EXTENSION
4.3.2.2 NEW PACKAGING
4.3.2.3 RE-LAUNCHED
4.3.2.4 NEW FORMULATION
4.3.3 DIFFERENTIAL PRODUCT OFFERING
4.3.4 MEETING CONSUMER REQUIREMENT
4.3.5 PACKAGE DESIGNING
4.3.6 PRICING ANALYSIS
4.3.7 PRODUCT POSITIONING
4.3.8 CONCLUSION
4.4 FACTORS INFLUENCING THE PURCHASE
4.5 INDUSTRY TRENDS AND FUTURE PERSPECTIVE:
4.6 PROMOTIONAL ACTIVITIES
4.7 SHOPPING BEHAVIOUR AND DYNAMICS: GLOBAL SNACKS PELLETS MARKET
4.7.1 RECOMMENDATIONS FROM FAMILY & FRIENDS-
4.7.2 RESEARCH
4.7.3 IMPULSIVE
4.7.4 ADVERTISEMENT:
4.7.4.1 TELEVISION ADVERTISEMENT
4.7.4.2 ONLINE ADVERTISEMENT
4.7.4.3 IN-STORE ADVERTISEMENT
4.7.4.4 OUTDOOR ADVERTISEMENT
4.8 SUPPLY CHAIN ANALYSIS
4.8.1 RAW MATERIAL PROCUREMENT
4.8.2 MANUFACTURING AND DISTRIBUTION
4.8.3 END USERS
4.9 VALUE CHAIN ANALYSIS
4.1 REGULATORY FRAMEWORK
5 MARKET OVERVIEW
5.1 DRIVERS
5.1.1 INCREASED CONSUMPTION OF PACKAGED FOODS DUE TO A BUSY LIFESTYLE
5.1.2 INCREASE IN DEMAND FOR SAVORY SNACKS
5.1.3 INCREASING REPLACEMENT OF MEALS WITH HEALTHY SNACKS
5.1.4 AVAILABILITY OF VARIOUS FLAVOURS IN CHIPS AND CRACKERS
5.2 RESTRAINTS
5.2.1 HEALTH PROBLEMS ASSOCIATED WITH THE HIGHER CONSUMPTION OF PROCESSED POTATO SNACKS
5.2.2 FLUCTUATING PRICES OF RAW MATERIALS
5.3 OPPORTUNITIES
5.3.1 EMERGENCE OF HEALTHY SNACK PELLETS
5.3.2 GOVERNMENT INITIATIVES AND INVESTMENT IN THE PROCESSED INDUSTRY OR SNACK PELLET INDUSTRY
5.3.3 AVAILABILITY OF A WIDE VARIETY OF FORMS, FLAVOURS, AND TASTES IN MULTIGRAIN SNACK PELLETS
5.4 CHALLENGES
5.4.1 HIGH COST ASSOCIATED WITH POTATO CHIPS MACHINES
5.4.2 SUPPLY CHAIN DISRUPTION DUE TO COVID-19
6 GLOBAL SNACK PELLETS MARKET, BY TYPE
6.1 OVERVIEW
6.2 CHIPS
6.3 PUFFS
6.4 CRACKERS
6.5 OTHERS
7 GLOBAL SNACK PELLETS MARKET, BY FORM
7.1 OVERVIEW
7.2 TRIDIMENSIONAL
7.3 TWO DIMENSIONAL
7.4 LAMINATED
7.5 DIE DISTANCE
7.6 GELATINIZED
7.7 DIE FACED
7.8 PUNCHED
8 GLOBAL SNACK PELLETS MARKET, BY BRAND
8.1 OVERVIEW
8.2 BRANDED
8.3 PRIVATE LABEL
9 GLOBAL SNACK PELLETS MARKET, BY APPLICATION
9.1 OVERVIEW
9.2 COMMERCIAL
9.3 HOUSEHOLD
10 GLOBAL SNACK PELLETS MARKET, BY PROCESSING METHOD
10.1 OVERVIEW
10.2 REASY SNACK PELLET
10.3 NON-GREASY SNACK PELLET
10.3.1 HOT AIR BAKING
10.3.2 REGULAR BAKED OR ROASTED
11 GLOBAL SNACK PELLETS MARKET, BY NATURE
11.1 OVERVIEW
11.2 CONVENTIONAL
11.3 ORGANIC
12 GLOBAL SNACK PELLETS MARKET, BY FLAVOR
12.1 OVERVIEW
12.2 FLAVOR
12.2.1 TOMATO
12.2.2 BBQ
12.2.3 CHEESE
12.2.4 CHOCOLATE
12.2.5 CARAMELIZED
12.2.6 HONEY
12.2.7 HERB
12.2.8 BLACK PEPPER
12.2.9 SALSA
12.2.10 CHILE
12.2.11 LEMON
12.2.12 MINT
12.2.13 JALAPENOS
12.2.14 GARLIC
12.2.15 CHIPOTLE
12.2.16 OTHERS
12.3 PLAIN
13 GLOBAL SNACK PELLETS MARKET, BY DISTRIBUTION CHANNEL
13.1 OVERVIEW
13.2 INDIRECT
13.2.1 STORE-BASED RETAILING
13.2.1.1 CONVENIENCE STORES
13.2.1.2 SUPERMARKETS/HYPERMARKETS
13.2.1.3 SPECIALTY STORES
13.2.1.4 WHOLESALERS
13.2.1.5 GROCERY STORES
13.2.1.6 OTHERS
13.2.2 NON-STORE RETAILING
13.2.2.1 ONLINE RETAILERS
13.2.2.2 VENDING MACHINE
13.3 DIRECT
14 GLOBAL SNACK PELLETS MARKET, BY TECHNIQUE
14.1 OVERVIEW
14.2 SINGLE-SCREW EXTRUDER
14.3 TWIN-SCREW EXTRUDER
15 GLOBAL SNACK PELLETS MARKET, BY SHAPE
15.1 OVERVIEW
15.2 OVAL
15.3 ROUND
15.4 SQUARE
15.5 RING
15.6 TRIANGULAR
15.7 STAR
15.8 OTHERS
16 GLOBAL SNACK PELLETS MARKET, BY INGREDIENTS
16.1 OVERVIEW
16.2 MULTIGRAIN
16.3 POTATO
16.4 CORN
16.5 RICE
16.6 TAPIOCO
16.7 OTHERS
17 GLOBAL SNACKS PELLETS MARKET, BY REGION
17.1 OVERVIEW
17.2 NORTH AMERICA
17.2.1 U.S.
17.2.2 CANADA
17.2.3 MEXICO
17.3 EUROPE
17.3.1 U.K.
17.3.2 GERMANY
17.3.3 FRANCE
17.3.4 ITALY
17.3.5 SPAIN
17.3.6 NETHERLANDS
17.3.7 BELGIUM
17.3.8 SWEDEN
17.3.9 DENMARK
17.3.10 POLAND
17.3.11 RUSSIA
17.3.12 SWITZERLAND
17.3.13 TURKEY
17.3.14 REST OF EUROPE
17.4 ASIA-PACIFIC
17.4.1 CHINA
17.4.2 INDIA
17.4.3 JAPAN
17.4.4 AUSTRALIA
17.4.5 SOUTH KOREA
17.4.6 SINGAPORE
17.4.7 NEW ZEALAND
17.4.8 THAILAND
17.4.9 INDONESIA
17.4.10 MALAYSIA
17.4.11 PHILIPPINES
17.4.12 VIETNAM
17.4.13 REST OF ASIA-PACIFIC
17.5 SOUTH AMERICA
17.5.1 BRAZIL
17.5.2 ARGENTINA
17.5.3 REST OF SOUTH AMERICA
17.6 MIDDLE EAST AND AFRICA
17.6.1 SOUTH AFRICA
17.6.2 UAE
17.6.3 SAUDI ARABIA
17.6.4 QATAR
17.6.5 OMAN
17.6.6 KUWAIT
17.6.7 REST OF MIDDLE EAST & AFRICA
18 GLOBAL SNACK PELLETS MARKET: COMPANY LANDSCAPE
18.1 COMPANY SHARE ANALYSIS: GLOBAL
18.2 COMPANY SHARE ANALYSIS: NORTH AMERICA
18.3 COMPANY SHARE ANALYSIS: EUROPE
18.4 COMPANY SHARE ANALYSIS: ASIA-PACIFIC
19 SWOT ANALYSIS
20 COMPANY PROFILE
20.1 INTERSNACK GROUP GMBH & CO. KG
20.1.1 COMPANY SNAPSHOT
20.1.2 COMPANY SHARE ANALYSIS
20.1.3 PRODUCT PORTFOLIO
20.1.4 RECENT DEVELOPMENT
20.2 THE LORENZ BAHLSEN SNACK-WORLD GMBH & CO KG GERMANY
20.2.1 COMPANY SNAPSHOT
20.2.2 COMPANY SHARE ANALYSIS
20.2.3 PRODUCT PORTFOLIO
20.2.4 RECENT DEVELOPMENT
20.3 BFY BRANDS
20.3.1 COMPANY SNAPSHOT
20.3.2 COMPANY SHARE ANALYSIS
20.3.3 PRODUCT PORTFOLIO
20.3.4 RECENT DEVELOPMENTS
20.4 MAFIN
20.4.1 COMPANY SANPSHOT
20.4.2 COMPANY SHARE ANALYSIS
20.4.3 PRODUCT PORTFOLIO
20.4.4 RECENT DEVELOPMENTS
20.5 PRODUCTOS ALIMENTICIOS LA MODERNA S.A. DE C.V.
20.5.1 COMPANY SANPSHOT
20.5.2 COMPANY SHARE ANALYSIS
20.5.3 PRODUCT PORTFOLIO
20.5.4 RECENT DEVELOPMENTS
20.6 AKKEL GROUP.
20.6.1 COMPANY SANPSHOT
20.6.2 PRODUCT PORTFOLIO
20.6.3 RECENT DEVELOPMENTS
20.7 ALMOUNAJED FOOD INDUSTRIES
1.7.1 COMPANY SNAPSHOT 409
20.7.1 PRODUCT PORTFOLIO
20.7.2 RECENT DEVELOPMENT
20.8 AL-QASRAWI
20.8.1 COMPANY SNAPSHOT
20.8.2 PRODUCT PORTFOLIO
20.8.3 RECENT DEVELOPMENT
20.9 ATTAYBAT
20.9.1 COMPANY SNAPSHOT
20.9.2 PRODUCT PORTFOLIO
20.9.3 RECENT DEVELOPMENT
20.1 BACH SNACKS SAL
20.10.1 COMPANY SNAPSHOT
20.10.2 PRODUCT PORTFOLIO
20.10.3 RECENT DEVELOPMENT
20.11 BAG SNACKS
20.11.1 COMPANY SNAPSHOT
20.11.2 PRODUCT PORTFOLIO
20.11.3 RECENT DEVELOPMENT
20.12 CALBEE
20.12.1 COMPANY SNAPSHOT
20.12.2 REVENUE ANALYSIS
20.12.3 PRODUCT PORTFOLIO
20.12.4 RECENT DEVELOPMENTS
20.13 CHHAJED FOODS PVT. LTD
20.13.1 COMPANY SANPSHOT
20.13.2 PRODUCT PORTFOLIO
20.13.3 RECENT DEVELOPMENTS
20.14 CRUNCHY FOOD FZE
20.14.1 COMPANY SNAPSHOT
20.14.2 PRODUCT PORTFOLIO
20.14.3 RECENT DEVELOPMENT
20.15 DALMAZA FOOD INDUSTRIES CO. (DAFICO)
20.15.1 COMPANY SNAPSHOT
20.15.2 PRODUCT PORTFOLIO
20.15.3 RECENT DEVELOPMENT
20.16 FIORENTINI ALIMENTARI S.P.A.
20.16.1 COMPANY SANPSHOT
20.16.2 PRODUCT PORTFOLIO
20.16.3 RECENT DEVELOPMENTS
20.17 GUSTINOS
20.17.1 COMPANY SANPSHOT
20.17.2 PRODUCT PORTFOLIO
20.17.3 RECENT DEVELOPMENTS
20.18 J.R. SHORT SNACK PRODUCTS
20.18.1 COMPANY SNAPSHOT
20.18.2 PRODUCT PORTFOLIO
20.18.3 RECENT DEVELOPMENT
20.19 JEDNOŚĆ SP. Z O. O
20.19.1 COMPANY SANPSHOT
20.19.2 PRODUCT PORTFOLIO
20.19.3 RECENT DEVELOPMENTS
20.2 JLM GLOBAL FOODS
20.20.1 COMPANY SNAPSHOT
20.20.2 PRODUCT PORTFOLIO
20.20.3 RECENT DEVELOPMENT
20.21 JOPELLETS
20.21.1 COMPANY SNAPSHOT
20.21.2 PRODUCT PORTFOLIO
20.21.3 RECENT UPDATE
20.22 KABIR FOODS
20.22.1 COMPANY SNAPSHOT
20.22.2 PRODUCT PORTFOLIO
20.22.3 RECENT DEVELOPMENT
20.23 LC AMERICA, INC.
20.23.1 COMPANY SNAPSHOT
20.23.2 PRODUCT PORTFOLIO
20.23.3 RECENT DEVELOPMENT
20.24 LE CASELLE SPA
20.24.1 COMPANY SANPSHOT
20.24.2 PRODUCT PORTFOLIO
20.24.3 RECENT DEVELOPMENTS
20.25 LENG-D'OR
20.25.1 COMPANY SNAPSHOT
20.25.2 PRODUCT PORTFOLIO
20.25.3 RECENT DEVELOPMENT
20.26 LIMAGRAIN - INGRÉDIENTS
20.26.1 COMPANY SNAPSHOT
20.26.2 PRODUCT PORTFOLIO
20.26.3 RECENT DEVELOPMENT
20.27 MATARILE
20.27.1 COMPANY SNAPSHOT
20.27.2 PRODUCT PORTFOLIO
20.27.3 RECENT DEVELOPMENT
20.28 MCFILLS ENTERPRISES PVT. LTD.
20.28.1 COMPANY SNAPSHOT
20.28.2 PRODUCT PORTFOLIO
20.28.3 RECENT DEVELOPMENT
20.29 GRUPO MICHEL
20.29.1 COMPANY SNAPSHOT
20.29.2 PRODUCT PORTFOLIO
20.29.3 RECENT DEVELOPMENT
20.3 NOBLE AGRO FOOD PRODUCTS PRIVATE LIMITED
20.30.1 COMPANY SANPSHOT
20.30.2 PRODUCT PORTFOLIO
20.30.3 RECENT DEVELOPMENT
20.31 NUTRADIA
20.31.1 COMPANY SNAPSHOT
20.31.2 PRODUCT PORTFOLIO
20.31.3 RECENT DEVELOPMENT
20.32 ORIENTAL FOOD INDUSTRIES SDN. BHD.
20.32.1 COMPANY SANPSHOT
20.32.2 REVENUE ANALYSIS
20.32.3 PRODUCT PORTFOLIO
20.32.4 RECENT DEVELOPMENTS
20.33 PALMEX
20.33.1 COMPANY SANPSHOT
20.33.2 PRODUCT PORTFOLIO
20.33.3 RECENT DEVELOPMENTS
20.34 PELLSNACK PRODUCTS GMBH
20.34.1 COMPANY SNAPSHOT
20.34.2 PRODUCT PORTFOLIO
20.34.3 RECENT DEVELOPMENT
20.35 POL-FOODS SP. Z O.O.
20.35.1 COMPANY SNAPSHOT
20.35.2 PRODUCT PORTFOLIO
20.35.3 RECENT DEVELOPMENT
20.36 POPCHIPS
20.36.1 COMPANY SNAPSHOT
20.36.2 PRODUCT PORTFOLIO
20.36.3 RECENT UPDATE
20.37 QUALITY PELLETS
20.37.1 COMPANY SNAPSHOT
20.37.2 PRODUCT PORTFOLIO
20.37.3 RECENT DEVELOPMENT
20.38 ROGER&ROGER
20.38.1 COMPANY SANPSHOT
20.38.2 PRODUCT PORTFOLIO
20.38.3 RECENT DEVELOPMENTS
20.39 GUANGDONG YUSHENG FOOD INDUSTRIES CO., LTD.
20.39.1 COMPANY SNAPSHOT
20.39.2 PRODUCT PORTFOLIO
20.39.3 RECENT DEVELOPMENT
20.4 SIBELL
20.40.1 COMPANY SNAPSHOT
20.40.2 PRODUCT PORTFOLIO
20.40.3 RECENT DEVELOPMENTS
20.41 SNACK CREATIONS LTD.
20.41.1 COMPANY SANPSHOT
20.41.2 PRODUCT PORTFOLIO
20.41.3 RECENT DEVELOPMENTS
20.42 SNACKLETS
20.43 SOLINO GROUP
20.43.1 COMPANY SNAPSHOT
20.43.2 PRODUCT PORTFOLIO
20.43.3 RECENT DEVELOPMENT
20.44 TTK
20.44.1 COMPANY SNAPSHOT
20.44.2 REVENUE ANALYSIS
20.44.3 PRODUCT PORTFOLIO
20.44.4 RECENT DEVELOPMENT
20.45 UNIVERSAL ROBINA CORPORATION
20.45.1 COMPANY SNAPSHOT
20.45.2 REVENUE ANALYSIS
20.45.3 PRODUCT PORTFOLIO
20.45.4 RECENT DEVELOPMENTS
20.46 V.AL.IN. SRL
20.46.1 COMPANY SNAPSHOT
20.46.2 PRODUCT PORTFOLIO
20.46.3 RECENT DEVELOPMENT
20.47 VIJAY INDUSTRIES
20.47.1 COMPANY SNAPSHOT
20.47.2 PRODUCT PORTFOLIO
20.47.3 RECENT DEVELOPMENT
20.48 VMF (VAN MARCKE FOODS) CONTINENTAL SNACKS
20.48.1 COMPANY SNAPSHOT
20.48.2 PRODUCT PORTFOLIO
20.48.3 RECENT DEVELOPMENT
20.49 YUPI SAS
20.49.1 COMPANY SNAPSHOT
20.49.2 PRODUCT PORTFOLIO
20.49.3 RECENT DEVELOPMENT
21 QUESTIONNAIRE
22 RELATED REPORTS
Lista de Tablas
TABLE 1 NUTRITIONAL BENEFITS OF HEALTHY SNACK PELLETS:
TABLE 2 FLAVORS AND INGREDIENTS OF MULTIGRAIN PELLETS
TABLE 3 GLOBAL SNACK PELLETS MARKET, BY TYPE, 2020-2029 (USD MILLION)
TABLE 4 GLOBAL CHIPS IN SNACK PELLETS MARKET, BY REGION, 2020-2029 (USD MILLION)
TABLE 5 GLOBAL PUFFS IN SNACK PELLETS MARKET, BY REGION, 2020-2029 (USD MILLION)
TABLE 6 GLOBAL CRACKERS IN SNACK PELLETS MARKET, BY REGION, 2020-2029 (USD MILLION)
TABLE 7 GLOBAL OTHERS IN SNACK PELLETS MARKET, BY REGION, 2020-2029 (USD MILLION)
TABLE 8 GLOBAL SNACK PELLETS MARKET, BY FORM, 2020-2029 (USD MILLION)
TABLE 9 GLOBAL TRIDIMENSIONAL IN SNACK PELLETS MARKET, BY REGION, 2020-2029 (USD MILLION)
TABLE 10 GLOBAL TWO DIMENSIONAL IN SNACK PELLETS MARKET, BY REGION, 2020-2029 (USD MILLION)
TABLE 11 GLOBAL LAMINATED IN SNACK PELLETS MARKET, BY REGION, 2020-2029 (USD MILLION)
TABLE 12 GLOBAL DIE DISTANCE IN GLOBAL SNACK PELLETS MARKET, BY REGION, 2020-2029 (USD MILLION)
TABLE 13 GLOBAL GELATINIZED IN SNACK PELLETS MARKET, BY REGION, 2020-2029 (USD MILLION)
TABLE 14 GLOBAL DIE FACED IN SNACK PELLETS MARKET, BY REGION, 2020-2029 (USD MILLION)
TABLE 15 GLOBAL PUNCHED IN SNACK PELLETS MARKET, BY REGION, 2020-2029 (USD MILLION)
NOTE: PERCENTAGE IN THE FIGURE REPRESENT CAGR OF THE SEGMENT 109
TABLE 16 GLOBAL SNACK PELLETS MARKET, BY BRAND, 2020-2029 (USD MILLION)
TABLE 17 GLOBAL BRANDED IN SNACK PELLETS MARKET, BY REGION, 2020-2029 (USD MILLION)
TABLE 18 GLOBAL PRIVATE-LABEL IN SNACK PELLETS MARKET, BY REGION, 2020-2029 (USD MILLION)
NOTE: PERCENTAGE IN THE FIGURE REPRESENT CAGR OF THE SEGMENT 113
TABLE 19 GLOBAL SNACK PELLETS MARKET, BY APPLICATION, 2020-2029 (USD MILLION)
TABLE 20 GLOBAL COMMERCIAL IN GLOBAL SNACK PELLETS MARKET, BY REGION, 2020-2029 (USD MILLION)
TABLE 21 GLOBAL HOUSEHOLD IN GLOBAL SNACK PELLETS MARKET, BY REGION, 2020-2029 (USD MILLION)
TABLE 22 GLOBAL SNACK PELLETS MARKET, BY PROCESSING METHOD, 2020-2029 (USD MILLION)
TABLE 23 GLOBAL GREASY SNACK PELLET IN SNACK PELLETS MARKET, BY REGION, 2020-2029 (USD MILLION)
TABLE 24 GLOBAL NON-GREASY SNACK PELLET IN SNACK PELLETS MARKET, BY REGION, 2020-2029 (USD MILLION)
TABLE 25 GLOBAL NON-GREASY SNACK PELLET IN SNACK PELLETS MARKET, BY PROCESSING METHOD, 2020-2029 (USD MILLION)
TABLE 26 GLOBAL SNACK PELLETS MARKET, BY NATURE, 2020-2029 (USD MILLION)
TABLE 27 GLOBAL CONVENTIONAL IN SNACK PELLETS MARKET, BY REGION, 2020-2029 (USD MILLION)
TABLE 28 GLOBAL ORGANIC IN SNACK PELLETS MARKET, BY REGION, 2020-2029 (USD MILLION)
TABLE 29 GLOBAL SNACK PELLETS MARKET, BY FLAVOR, 2020-2029 (USD MILLION)
TABLE 30 GLOBAL FLAVOR IN SNACK PELLETS MARKET, BY REGION, 2020-2029 (USD MILLION)
TABLE 31 GLOBAL FLAVOR IN SNACK PELLETS MARKET, BY FLAVOR, 2020-2029 (USD MILLION)
TABLE 32 GLOBAL PLAIN IN SNACK PELLETS MARKET, BY REGION, 2020-2029 (USD MILLION)
TABLE 33 GLOBAL SNACK PELLETS MARKET, BY DISTRIBUTION CHANNEL, 2020-2029 (USD MILLION)
TABLE 34 GLOBAL INDIRECT IN SNACK PELLETS MARKET, BY REGION, 2020-2029 (USD MILLION)
TABLE 35 GLOBAL INDIRECT IN SNACK PELLETS MARKET, BY DISTRIBUTION CHANNEL, 2020-2029 (USD MILLION)
TABLE 36 GLOBAL STORE-BASED RETAILING IN SNACK PELLETS MARKET, BY DISTRIBUTION CHANNEL, 2020-2029 (USD MILLION)
TABLE 37 GLOBAL NON-STORE-BASED RETAILING IN SNACK PELLETS MARKET, BY DISTRIBUTION CHANNEL, 2020-2029 (USD MILLION)
TABLE 38 GLOBAL DIRECT IN SNACK PELLETS MARKET, BY REGION, 2020-2029 (USD MILLION)
TABLE 39 GLOBAL SNACK PELLETS MARKET, BY TECHNIQUE, 2020-2029 (USD MILLION)
TABLE 40 GLOBAL SINGLE-SCREW EXTRUDER IN SNACK PELLETS MARKET, BY REGION, 2020-2029 (USD MILLION)
TABLE 41 GLOBAL TWIN-SCREW EXTRUDER IN SNACK PELLETS MARKET, BY REGION, 2020-2029 (USD MILLION)
TABLE 42 GLOBAL SNACK PELLETS MARKET, BY SHAPE, 2020-2029 (USD MILLION)
TABLE 43 GLOBAL OVAL IN SNACK PELLETS MARKET, BY REGION, 2020-2029 (USD MILLION)
TABLE 44 GLOBAL ROUND IN SNACK PELLETS MARKET, BY REGION, 2020-2029 (USD MILLION)
TABLE 45 GLOBAL SQUARE IN SNACK PELLETS MARKET, BY REGION, 2020-2029 (USD MILLION)
TABLE 46 GLOBAL RING IN SNACK PELLETS MARKET, BY REGION, 2020-2029 (USD MILLION)
TABLE 47 GLOBAL TRIANGULAR IN SNACK PELLETS MARKET, BY REGION, 2020-2029 (USD MILLION)
TABLE 48 GLOBAL STAR IN SNACK PELLETS MARKET, BY REGION, 2020-2029 (USD MILLION)
TABLE 49 GLOBAL OTHERS IN SNACK PELLETS MARKET, BY REGION, 2020-2029 (USD MILLION)
TABLE 50 GLOBAL SNACK PELLETS MARKET, BY INGREDIENTS, 2020-2029 (USD MILLION)
TABLE 51 GLOBAL MULTIGRAIN IN SNACK PELLETS MARKET, BY REGION, 2020-2029 (USD MILLION)
TABLE 52 GLOBAL POTATO IN SNACK PELLETS MARKET, BY REGION, 2020-2029 (USD MILLION)
TABLE 53 GLOBAL CORN IN SNACK PELLETS MARKET, BY REGION, 2020-2029 (USD MILLION)
TABLE 54 GLOBAL RICE IN SNACK PELLETS MARKET, BY REGION, 2020-2029 (USD MILLION)
TABLE 55 GLOBAL TAPIOCO IN SNACK PELLETS MARKET, BY REGION, 2020-2029 (USD MILLION)
TABLE 56 GLOBAL OTHERS IN SNACK PELLETS MARKET, BY REGION, 2020-2029 (USD MILLION)
TABLE 57 GLOBAL SNACK PELLETS MARKET, BY REGION, 2020-2029 (USD MILLION)
TABLE 58 NORTH AMERICA SNACK PELLETS MARKET, BY COUNTRY, 2020-2029 (USD MILLION)
TABLE 59 NORTH AMERICA SNACK PELLETS MARKET, BY TYPE, 2020-2029 (USD MILLION)
TABLE 60 NORTH AMERICA SNACK PELLETS MARKET, BY FORM, 2020-2029 (USD MILLION)
TABLE 61 NORTH AMERICA SNACK PELLETS MARKET, BY SHAPE, 2020-2029 (USD MILLION)
TABLE 62 NORTH AMERICA SNACK PELLETS MARKET, BY INGREDIENTS, 2020-2029 (USD MILLION)
TABLE 63 NORTH AMERICA SNACK PELLETS MARKET, BY PROCESSING METHOD, 2020-2029 (USD MILLION)
TABLE 64 NORTH AMERICA NON-GREASY SNACK PELLET IN SNACK PELLETS MARKET, BY PROCESSING METHOD, 2020-2029 (USD MILLION)
TABLE 65 NORTH AMERICA SNACK PELLETS MARKET, BY NATURE, 2020-2029 (USD MILLION)
TABLE 66 NORTH AMERICA SNACK PELLETS MARKET, BY TECHNIQUE, 2020-2029 (USD MILLION)
TABLE 67 NORTH AMERICA SNACK PELLETS MARKET, BY BRAND, 2020-2029 (USD MILLION)
TABLE 68 NORTH AMERICA SNACK PELLETS MARKET, BY FLAVOR, 2020-2029 (USD MILLION)
TABLE 69 NORTH AMERICA FLAVOR IN SNACK PELLETS MARKET, BY FLAVOR, 2020-2029 (USD MILLION)
TABLE 70 NORTH AMERICA SNACK PELLETS MARKET, BY APPLICATION, 2020-2029 (USD MILLION)
TABLE 71 NORTH AMERICA SNACK PELLETS MARKET, BY DISTRIBUTION CHANNEL, 2020-2029 (USD MILLION)
TABLE 72 NORTH AMERICA INDIRECT IN SNACK PELLETS MARKET, BY DISTRIBUTION CHANNEL, 2020-2029 (USD MILLION)
TABLE 73 NORTH AMERICA NON-STORE-BASED RETAILING IN SNACK PELLETS MARKET, BY DISTRIBUTION CHANNEL, 2020-2029 (USD MILLION)
TABLE 74 NORTH AMERICA INDIRECT IN SNACK PELLETS MARKET, BY DISTRIBUTION CHANNEL, 2020-2029 (USD MILLION)
TABLE 75 U.S. SNACK PELLETS MARKET, BY TYPE, 2020-2029 (USD MILLION)
TABLE 76 U.S. SNACK PELLETS MARKET, BY FORM, 2020-2029 (USD MILLION)
TABLE 77 U.S. SNACK PELLETS MARKET, BY SHAPE, 2020-2029 (USD MILLION)
TABLE 78 U.S. SNACK PELLETS MARKET, BY INGREDIENTS, 2020-2029 (USD MILLION)
TABLE 79 U.S. SNACK PELLETS MARKET, BY PROCESSING METHOD, 2020-2029 (USD MILLION)
TABLE 80 U.S. NON-GREASY SNACK PELLET IN SNACK PELLETS MARKET, BY PROCESSING METHOD, 2020-2029 (USD MILLION)
TABLE 81 U.S. SNACK PELLETS MARKET, BY NATURE, 2020-2029 (USD MILLION)
TABLE 82 U.S. SNACK PELLETS MARKET, BY TECHNIQUE, 2020-2029 (USD MILLION)
TABLE 83 U.S. SNACK PELLETS MARKET, BY BRAND, 2020-2029 (USD MILLION)
TABLE 84 U.S. SNACK PELLETS MARKET, BY FLAVOR, 2020-2029 (USD MILLION)
TABLE 85 U.S. FLAVOR IN SNACK PELLETS MARKET, BY FLAVOR, 2020-2029 (USD MILLION)
TABLE 86 U.S. SNACK PELLETS MARKET, BY APPLICATION, 2020-2029 (USD MILLION)
TABLE 87 U.S. SNACK PELLETS MARKET, BY DISTRIBUTION CHANNEL, 2020-2029 (USD MILLION)
TABLE 88 U.S. INDIRECT IN SNACK PELLETS MARKET, BY DISTRIBUTION CHANNEL, 2020-2029 (USD MILLION)
TABLE 89 U.S. STORE-BASED RETAILING IN SNACK PELLETS MARKET, BY DISTRIBUTION CHANNEL, 2020-2029 (USD MILLION)
TABLE 90 U.S. NON-STORE-BASED RETAILING IN SNACK PELLETS MARKET, BY DISTRIBUTION CHANNEL, 2020-2029 (USD MILLION)
TABLE 91 CANADA SNACK PELLETS MARKET, BY TYPE, 2020-2029 (USD MILLION)
TABLE 92 CANADA SNACK PELLETS MARKET, BY FORM, 2020-2029 (USD MILLION)
TABLE 93 CANADA SNACK PELLETS MARKET, BY SHAPE, 2020-2029 (USD MILLION)
TABLE 94 CANADA SNACK PELLETS MARKET, BY INGREDIENTS, 2020-2029 (USD MILLION)
TABLE 95 CANADA SNACK PELLETS MARKET, BY PROCESSING METHOD, 2020-2029 (USD MILLION)
TABLE 96 CANADA NON-GREASY SNACK PELLET IN SNACK PELLETS MARKET, BY PROCESSING METHOD, 2020-2029 (USD MILLION)
TABLE 97 CANADA SNACK PELLETS MARKET, BY NATURE, 2020-2029 (USD MILLION)
TABLE 98 CANADA SNACK PELLETS MARKET, BY TECHNIQUE, 2020-2029 (USD MILLION)
TABLE 99 CANADA SNACK PELLETS MARKET, BY BRAND, 2020-2029 (USD MILLION)
TABLE 100 CANADA SNACK PELLETS MARKET, BY FLAVOR, 2020-2029 (USD MILLION)
TABLE 101 CANADA FLAVOR IN SNACK PELLETS MARKET, BY FLAVOR, 2020-2029 (USD MILLION)
TABLE 102 CANADA SNACK PELLETS MARKET, BY APPLICATION, 2020-2029 (USD MILLION)
TABLE 103 CANADA SNACK PELLETS MARKET, BY DISTRIBUTION CHANNEL, 2020-2029 (USD MILLION)
TABLE 104 CANADA INDIRECT IN SNACK PELLETS MARKET, BY DISTRIBUTION CHANNEL, 2020-2029 (USD MILLION)
TABLE 105 CANADA STORE-BASED RETAILING IN SNACK PELLETS MARKET, BY DISTRIBUTION CHANNEL, 2020-2029 (USD MILLION)
TABLE 106 CANADA NON-STORE-BASED RETAILING IN SNACK PELLETS MARKET, BY DISTRIBUTION CHANNEL, 2020-2029 (USD MILLION)
TABLE 107 MEXICO SNACK PELLETS MARKET, BY TYPE, 2020-2029 (USD MILLION)
TABLE 108 MEXICO SNACK PELLETS MARKET, BY FORM, 2020-2029 (USD MILLION)
TABLE 109 MEXICO SNACK PELLETS MARKET, BY SHAPE, 2020-2029 (USD MILLION)
TABLE 110 MEXICO SNACK PELLETS MARKET, BY INGREDIENTS, 2020-2029 (USD MILLION)
TABLE 111 MEXICO SNACK PELLETS MARKET, BY PROCESSING METHOD, 2020-2029 (USD MILLION)
TABLE 112 MEXICO NON-GREASY SNACK PELLET IN SNACK PELLETS MARKET, BY PROCESSING METHOD, 2020-2029 (USD MILLION)
TABLE 113 MEXICO SNACK PELLETS MARKET, BY NATURE, 2020-2029 (USD MILLION)
TABLE 114 MEXICO SNACK PELLETS MARKET, BY TECHNIQUE, 2020-2029 (USD MILLION)
TABLE 115 MEXICO SNACK PELLETS MARKET, BY BRAND, 2020-2029 (USD MILLION)
TABLE 116 MEXICO SNACK PELLETS MARKET, BY FLAVOR, 2020-2029 (USD MILLION)
TABLE 117 MEXICO FLAVOR IN SNACK PELLETS MARKET, BY FLAVOR, 2020-2029 (USD MILLION)
TABLE 118 MEXICO SNACK PELLETS MARKET, BY APPLICATION, 2020-2029 (USD MILLION)
TABLE 119 MEXICO SNACK PELLETS MARKET, BY DISTRIBUTION CHANNEL, 2020-2029 (USD MILLION)
TABLE 120 MEXICO INDIRECT IN SNACK PELLETS MARKET, BY DISTRIBUTION CHANNEL, 2020-2029 (USD MILLION)
TABLE 121 MEXICO STORE-BASED RETAILING IN SNACK PELLETS MARKET, BY DISTRIBUTION CHANNEL, 2020-2029 (USD MILLION)
TABLE 122 MEXICO NON-STORE-BASED RETAILING IN SNACK PELLETS MARKET, BY DISTRIBUTION CHANNEL, 2020-2029 (USD MILLION)
TABLE 123 EUROPE SNACK PELLETS MARKET, BY COUNTRY, 2020-2029 (USD MILLION)
TABLE 124 EUROPE SNACK PELLETS MARKET, BY TYPE, 2020-2029 (USD MILLION)
TABLE 125 EUROPE SNACK PELLETS MARKET, BY FORM, 2020-2029 (USD MILLION)
TABLE 126 EUROPE SNACK PELLETS MARKET, BY SHAPE, 2020-2029 (USD MILLION)
TABLE 127 EUROPE SNACK PELLETS MARKET, BY INGREDIENTS, 2020-2029 (USD MILLION)
TABLE 128 EUROPE SNACK PELLETS MARKET, BY PROCESSING METHOD, 2020-2029 (USD MILLION)
TABLE 129 EUROPE NON-GREASY SNACK PELLET IN SNACK PELLETS MARKET, BY PROCESSING METHOD, 2020-2029 (USD MILLION)
TABLE 130 EUROPE SNACK PELLETS MARKET, BY NATURE, 2020-2029 (USD MILLION)
TABLE 131 EUROPE SNACK PELLETS MARKET, BY TECHNIQUE, 2020-2029 (USD MILLION)
TABLE 132 EUROPE SNACK PELLETS MARKET, BY BRAND, 2020-2029 (USD MILLION)
TABLE 133 EUROPE SNACK PELLETS MARKET, BY FLAVOR, 2020-2029 (USD MILLION)
TABLE 134 EUROPE FLAVOR IN SNACK PELLETS MARKET, BY FLAVOR, 2020-2029 (USD MILLION)
TABLE 135 EUROPE SNACK PELLETS MARKET, BY APPLICATION, 2020-2029 (USD MILLION)
TABLE 136 EUROPE SNACK PELLETS MARKET, BY DISTRIBUTION CHANNEL, 2020-2029 (USD MILLION)
TABLE 137 EUROPE INDIRECT IN SNACK PELLETS MARKET, BY DISTRIBUTION CHANNEL, 2020-2029 (USD MILLION)
TABLE 138 EUROPE STORE-BASED RETAILING IN SNACK PELLETS MARKET, BY DISTRIBUTION CHANNEL, 2020-2029 (USD MILLION)
TABLE 139 EUROPE NON-STORE RETAILING IN SNACK PELLETS MARKET, BY DISTRIBUTION CHANNEL, 2020-2029 (USD MILLION)
TABLE 140 U.K. SNACK PELLETS MARKET, BY TYPE, 2020-2029 (USD MILLION)
TABLE 141 U.K. SNACK PELLETS MARKET, BY FORM, 2020-2029 (USD MILLION)
TABLE 142 U.K. SNACK PELLETS MARKET, BY SHAPE, 2020-2029 (USD MILLION)
TABLE 143 U.K. SNACK PELLETS MARKET, BY INGREDIENTS, 2020-2029 (USD MILLION)
TABLE 144 U.K. SNACK PELLETS MARKET, BY PROCESSING METHOD, 2020-2029 (USD MILLION)
TABLE 145 U.K. NON-GREASY SNACK PELLET IN SNACK PELLETS MARKET, BY PROCESSING METHOD, 2020-2029 (USD MILLION)
TABLE 146 U.K. SNACK PELLETS MARKET, BY NATURE, 2020-2029 (USD MILLION)
TABLE 147 U.K. SNACK PELLETS MARKET, BY TECHNIQUE, 2020-2029 (USD MILLION)
TABLE 148 U.K. SNACK PELLETS MARKET, BY BRAND, 2020-2029 (USD MILLION)
TABLE 149 U.K. SNACK PELLETS MARKET, BY FLAVOR, 2020-2029 (USD MILLION)
TABLE 150 U.K. FLAVOR IN SNACK PELLETS MARKET, BY FLAVOR, 2020-2029 (USD MILLION)
TABLE 151 U.K. SNACK PELLETS MARKET, BY APPLICATION, 2020-2029 (USD MILLION)
TABLE 152 U.K. SNACK PELLETS MARKET, BY DISTRIBUTION CHANNEL, 2020-2029 (USD MILLION)
TABLE 153 U.K. INDIRECT IN SNACK PELLETS MARKET, BY DISTRIBUTION CHANNEL, 2020-2029 (USD MILLION)
TABLE 154 U.K. NON-STORE-BASED RETAILING IN SNACK PELLETS MARKET, BY DISTRIBUTION CHANNEL, 2020-2029 (USD MILLION)
TABLE 155 U.K. NON-STORE-BASED RETAILING IN SNACK PELLETS MARKET, BY DISTRIBUTION CHANNEL, 2020-2029 (USD MILLION)
TABLE 156 GERMANY SNACK PELLETS MARKET, BY TYPE, 2020-2029 (USD MILLION)
TABLE 157 GERMANY SNACK PELLETS MARKET, BY FORM, 2020-2029 (USD MILLION)
TABLE 158 GERMANY SNACK PELLETS MARKET, BY SHAPE, 2020-2029 (USD MILLION)
TABLE 159 GERMANY SNACK PELLETS MARKET, BY INGREDIENTS, 2020-2029 (USD MILLION)
TABLE 160 GERMANY SNACK PELLETS MARKET, BY PROCESSING METHOD, 2020-2029 (USD MILLION)
TABLE 161 GERMANY NON-GREASY SNACK PELLET IN SNACK PELLETS MARKET, BY PROCESSING METHOD, 2020-2029 (USD MILLION)
TABLE 162 GERMANY SNACK PELLETS MARKET, BY NATURE, 2020-2029 (USD MILLION)
TABLE 163 GERMANY SNACK PELLETS MARKET, BY TECHNIQUE, 2020-2029 (USD MILLION)
TABLE 164 GERMANY SNACK PELLETS MARKET, BY BRAND, 2020-2029 (USD MILLION)
TABLE 165 GERMANY SNACK PELLETS MARKET, BY FLAVOR, 2020-2029 (USD MILLION)
TABLE 166 GERMANY FLAVOR IN SNACK PELLETS MARKET, BY FLAVOR, 2020-2029 (USD MILLION)
TABLE 167 GERMANY SNACK PELLETS MARKET, BY APPLICATION, 2020-2029 (USD MILLION)
TABLE 168 GERMANY SNACK PELLETS MARKET, BY DISTRIBUTION CHANNEL, 2020-2029 (USD MILLION)
TABLE 169 GERMANY INDIRECT IN SNACK PELLETS MARKET, BY DISTRIBUTION CHANNEL, 2020-2029 (USD MILLION)
TABLE 170 GERMANY STORE-BASED RETAILING IN SNACK PELLETS MARKET, BY DISTRIBUTION CHANNEL, 2020-2029 (USD MILLION)
TABLE 171 GERMANY NON-STORE-BASED RETAILING IN SNACK PELLETS MARKET, BY DISTRIBUTION CHANNEL, 2020-2029 (USD MILLION)
TABLE 172 FRANCE SNACK PELLETS MARKET, BY TYPE, 2020-2029 (USD MILLION)
TABLE 173 FRANCE SNACK PELLETS MARKET, BY FORM, 2020-2029 (USD MILLION)
TABLE 174 FRANCE SNACK PELLETS MARKET, BY SHAPE, 2020-2029 (USD MILLION)
TABLE 175 FRANCE SNACK PELLETS MARKET, BY INGREDIENTS, 2020-2029 (USD MILLION)
TABLE 176 FRANCE SNACK PELLETS MARKET, BY PROCESSING METHOD, 2020-2029 (USD MILLION)
TABLE 177 FRANCE NON-GREASY SNACK PELLET IN SNACK PELLETS MARKET, BY PROCESSING METHOD, 2020-2029 (USD MILLION)
TABLE 178 FRANCE SNACK PELLETS MARKET, BY NATURE, 2020-2029 (USD MILLION)
TABLE 179 FRANCE SNACK PELLETS MARKET, BY TECHNIQUE, 2020-2029 (USD MILLION)
TABLE 180 FRANCE SNACK PELLETS MARKET, BY BRAND, 2020-2029 (USD MILLION)
TABLE 181 FRANCE SNACK PELLETS MARKET, BY FLAVOR, 2020-2029 (USD MILLION)
TABLE 182 FRANCE FLAVOR IN SNACK PELLETS MARKET, BY FLAVOR, 2020-2029 (USD MILLION)
TABLE 183 FRANCE SNACK PELLETS MARKET, BY APPLICATION, 2020-2029 (USD MILLION)
TABLE 184 FRANCE SNACK PELLETS MARKET, BY DISTRIBUTION CHANNEL, 2020-2029 (USD MILLION)
TABLE 185 FRANCE INDIRECT IN SNACK PELLETS MARKET, BY DISTRIBUTION CHANNEL, 2020-2029 (USD MILLION)
TABLE 186 FRANCE STORE-BASED RETAILING IN SNACK PELLETS MARKET, BY DISTRIBUTION CHANNEL, 2020-2029 (USD MILLION)
TABLE 187 FRANCE NON-STORE-BASED RETAILING IN SNACK PELLETS MARKET, BY DISTRIBUTION CHANNEL, 2020-2029 (USD MILLION)
TABLE 188 ITALY SNACK PELLETS MARKET, BY TYPE, 2020-2029 (USD MILLION)
TABLE 189 ITALY SNACK PELLETS MARKET, BY FORM, 2020-2029 (USD MILLION)
TABLE 190 ITALY SNACK PELLETS MARKET, BY SHAPE, 2020-2029 (USD MILLION)
TABLE 191 ITALY SNACK PELLETS MARKET, BY INGREDIENTS, 2020-2029 (USD MILLION)
TABLE 192 ITALY SNACK PELLETS MARKET, BY PROCESSING METHOD, 2020-2029 (USD MILLION)
TABLE 193 ITALY NON-GREASY SNACK PELLET IN SNACK PELLETS MARKET, BY PROCESSING METHOD, 2020-2029 (USD MILLION)
TABLE 194 ITALY SNACK PELLETS MARKET, BY NATURE, 2020-2029 (USD MILLION)
TABLE 195 ITALY SNACK PELLETS MARKET, BY TECHNIQUE, 2020-2029 (USD MILLION)
TABLE 196 ITALY SNACK PELLETS MARKET, BY BRAND, 2020-2029 (USD MILLION)
TABLE 197 ITALY SNACK PELLETS MARKET, BY FLAVOR, 2020-2029 (USD MILLION)
TABLE 198 ITALY FLAVOR IN SNACK PELLETS MARKET, BY FLAVOR, 2020-2029 (USD MILLION)
TABLE 199 ITALY SNACK PELLETS MARKET, BY APPLICATION, 2020-2029 (USD MILLION)
TABLE 200 ITALY SNACK PELLETS MARKET, BY DISTRIBUTION CHANNEL, 2020-2029 (USD MILLION)
TABLE 201 ITALY INDIRECT IN SNACK PELLETS MARKET, BY DISTRIBUTION CHANNEL, 2020-2029 (USD MILLION)
TABLE 202 ITALY STORE-BASED RETAILING IN SNACK PELLETS MARKET, BY DISTRIBUTION CHANNEL, 2020-2029 (USD MILLION)
TABLE 203 ITALY NON-STORE-BASED RETAILING IN SNACK PELLETS MARKET, BY DISTRIBUTION CHANNEL, 2020-2029 (USD MILLION)
TABLE 204 SPAIN SNACK PELLETS MARKET, BY TYPE, 2020-2029 (USD MILLION)
TABLE 205 SPAIN SNACK PELLETS MARKET, BY FORM, 2020-2029 (USD MILLION)
TABLE 206 SPAIN SNACK PELLETS MARKET, BY SHAPE, 2020-2029 (USD MILLION)
TABLE 207 SPAIN SNACK PELLETS MARKET, BY INGREDIENTS, 2020-2029 (USD MILLION)
TABLE 208 SPAIN SNACK PELLETS MARKET, BY PROCESSING METHOD, 2020-2029 (USD MILLION)
TABLE 209 SPAIN NON-GREASY SNACK PELLET IN SNACK PELLETS MARKET, BY PROCESSING METHOD, 2020-2029 (USD MILLION)
TABLE 210 SPAIN SNACK PELLETS MARKET, BY NATURE, 2020-2029 (USD MILLION)
TABLE 211 SPAIN SNACK PELLETS MARKET, BY TECHNIQUE, 2020-2029 (USD MILLION)
TABLE 212 SPAIN SNACK PELLETS MARKET, BY BRAND, 2020-2029 (USD MILLION)
TABLE 213 SPAIN SNACK PELLETS MARKET, BY FLAVOR, 2020-2029 (USD MILLION)
TABLE 214 SPAIN FLAVOR IN SNACK PELLETS MARKET, BY FLAVOR, 2020-2029 (USD MILLION)
TABLE 215 SPAIN SNACK PELLETS MARKET, BY APPLICATION, 2020-2029 (USD MILLION)
TABLE 216 SPAIN SNACK PELLETS MARKET, BY DISTRIBUTION CHANNEL, 2020-2029 (USD MILLION)
TABLE 217 SPAIN INDIRECT IN SNACK PELLETS MARKET, BY DISTRIBUTION CHANNEL, 2020-2029 (USD MILLION)
TABLE 218 SPAIN STORE-BASED RETAILING IN SNACK PELLETS MARKET, BY DISTRIBUTION CHANNEL, 2020-2029 (USD MILLION)
TABLE 219 SPAIN NON-STORE-BASED RETAILING IN SNACK PELLETS MARKET, BY DISTRIBUTION CHANNEL, 2020-2029 (USD MILLION)
TABLE 220 NETHERLANDS SNACK PELLETS MARKET, BY TYPE, 2020-2029 (USD MILLION)
TABLE 221 NETHERLANDS SNACK PELLETS MARKET, BY FORM, 2020-2029 (USD MILLION)
TABLE 222 NETHERLANDS SNACK PELLETS MARKET, BY SHAPE, 2020-2029 (USD MILLION)
TABLE 223 NETHERLANDS SNACK PELLETS MARKET, BY INGREDIENTS, 2020-2029 (USD MILLION)
TABLE 224 NETHERLANDS SNACK PELLETS MARKET, BY PROCESSING METHOD, 2020-2029 (USD MILLION)
TABLE 225 NETHERLANDS NON-GREASY SNACK PELLET IN SNACK PELLETS MARKET, BY PROCESSING METHOD, 2020-2029 (USD MILLION)
TABLE 226 NETHERLANDS SNACK PELLETS MARKET, BY NATURE, 2020-2029 (USD MILLION)
TABLE 227 NETHERLANDS SNACK PELLETS MARKET, BY TECHNIQUE, 2020-2029 (USD MILLION)
TABLE 228 NETHERLANDS SNACK PELLETS MARKET, BY BRAND, 2020-2029 (USD MILLION)
TABLE 229 NETHERLANDS SNACK PELLETS MARKET, BY FLAVOR, 2020-2029 (USD MILLION)
TABLE 230 NETHERLANDS FLAVOR IN SNACK PELLETS MARKET, BY FLAVOR, 2020-2029 (USD MILLION)
TABLE 231 NETHERLANDS SNACK PELLETS MARKET, BY APPLICATION, 2020-2029 (USD MILLION)
TABLE 232 NETHERLANDS SNACK PELLETS MARKET, BY DISTRIBUTION CHANNEL, 2020-2029 (USD MILLION)
TABLE 233 NETHERLANDS INDIRECT IN SNACK PELLETS MARKET, BY DISTRIBUTION CHANNEL, 2020-2029 (USD MILLION)
TABLE 234 NETHERLANDS STORE-BASED RETAILING IN SNACK PELLETS MARKET, BY DISTRIBUTION CHANNEL, 2020-2029 (USD MILLION)
TABLE 235 NETHERLANDS NON-STORE-BASED RETAILING IN SNACK PELLETS MARKET, BY DISTRIBUTION CHANNEL, 2020-2029 (USD MILLION)
TABLE 236 BELGIUM SNACK PELLETS MARKET, BY TYPE, 2020-2029 (USD MILLION)
TABLE 237 BELGIUM SNACK PELLETS MARKET, BY FORM, 2020-2029 (USD MILLION)
TABLE 238 BELGIUM SNACK PELLETS MARKET, BY SHAPE, 2020-2029 (USD MILLION)
TABLE 239 BELGIUM SNACK PELLETS MARKET, BY INGREDIENTS, 2020-2029 (USD MILLION)
TABLE 240 BELGIUM SNACK PELLETS MARKET, BY PROCESSING METHOD, 2020-2029 (USD MILLION)
TABLE 241 BELGIUM NON-GREASY SNACK PELLET IN SNACK PELLETS MARKET, BY PROCESSING METHOD, 2020-2029 (USD MILLION)
TABLE 242 BELGIUM SNACK PELLETS MARKET, BY NATURE, 2020-2029 (USD MILLION)
TABLE 243 BELGIUM SNACK PELLETS MARKET, BY TECHNIQUE, 2020-2029 (USD MILLION)
TABLE 244 BELGIUM SNACK PELLETS MARKET, BY BRAND, 2020-2029 (USD MILLION)
TABLE 245 BELGIUM SNACK PELLETS MARKET, BY FLAVOR, 2020-2029 (USD MILLION)
TABLE 246 BELGIUM FLAVOR IN SNACK PELLETS MARKET, BY FLAVOR, 2020-2029 (USD MILLION)
TABLE 247 BELGIUM SNACK PELLETS MARKET, BY APPLICATION, 2020-2029 (USD MILLION)
TABLE 248 BELGIUM SNACK PELLETS MARKET, BY DISTRIBUTION CHANNEL, 2020-2029 (USD MILLION)
TABLE 249 BELGIUM INDIRECT IN SNACK PELLETS MARKET, BY DISTRIBUTION CHANNEL, 2020-2029 (USD MILLION)
TABLE 250 BELGIUM STORE-BASED RETAILING IN SNACK PELLETS MARKET, BY DISTRIBUTION CHANNEL, 2020-2029 (USD MILLION)
TABLE 251 BELGIUM NON-STORE-BASED RETAILING IN SNACK PELLETS MARKET, BY DISTRIBUTION CHANNEL, 2020-2029 (USD MILLION)
TABLE 252 SWEDEN SNACK PELLETS MARKET, BY TYPE, 2020-2029 (USD MILLION)
TABLE 253 SWEDEN SNACK PELLETS MARKET, BY FORM, 2020-2029 (USD MILLION)
TABLE 254 SWEDEN SNACK PELLETS MARKET, BY SHAPE, 2020-2029 (USD MILLION)
TABLE 255 SWEDEN SNACK PELLETS MARKET, BY INGREDIENTS, 2020-2029 (USD MILLION)
TABLE 256 SWEDEN SNACK PELLETS MARKET, BY PROCESSING METHOD, 2020-2029 (USD MILLION)
TABLE 257 SWEDEN NON-GREASY SNACK PELLET IN SNACK PELLETS MARKET, BY PROCESSING METHOD, 2020-2029 (USD MILLION)
TABLE 258 SWEDEN SNACK PELLETS MARKET, BY NATURE, 2020-2029 (USD MILLION)
TABLE 259 SWEDEN SNACK PELLETS MARKET, BY TECHNIQUE, 2020-2029 (USD MILLION)
TABLE 260 SWEDEN SNACK PELLETS MARKET, BY BRAND, 2020-2029 (USD MILLION)
TABLE 261 SWEDEN SNACK PELLETS MARKET, BY FLAVOR, 2020-2029 (USD MILLION)
TABLE 262 SWEDEN FLAVOR IN SNACK PELLETS MARKET, BY FLAVOR, 2020-2029 (USD MILLION)
TABLE 263 SWEDEN SNACK PELLETS MARKET, BY APPLICATION, 2020-2029 (USD MILLION)
TABLE 264 SWEDEN SNACK PELLETS MARKET, BY DISTRIBUTION CHANNEL, 2020-2029 (USD MILLION)
TABLE 265 SWEDEN INDIRECT IN SNACK PELLETS MARKET, BY DISTRIBUTION CHANNEL, 2020-2029 (USD MILLION)
TABLE 266 SWEDEN STORE-BASED RETAILING IN SNACK PELLETS MARKET, BY DISTRIBUTION CHANNEL, 2020-2029 (USD MILLION)
TABLE 267 SWEDEN NON-STORE-BASED RETAILING IN SNACK PELLETS MARKET, BY DISTRIBUTION CHANNEL, 2020-2029 (USD MILLION)
TABLE 268 DENMARK SNACK PELLETS MARKET, BY TYPE, 2020-2029 (USD MILLION)
TABLE 269 DENMARK SNACK PELLETS MARKET, BY FORM, 2020-2029 (USD MILLION)
TABLE 270 DENMARK SNACK PELLETS MARKET, BY SHAPE, 2020-2029 (USD MILLION)
TABLE 271 DENMARK SNACK PELLETS MARKET, BY INGREDIENTS, 2020-2029 (USD MILLION)
TABLE 272 DENMARK SNACK PELLETS MARKET, BY PROCESSING METHOD, 2020-2029 (USD MILLION)
TABLE 273 DENMARK NON-GREASY SNACK PELLET IN SNACK PELLETS MARKET, BY PROCESSING METHOD, 2020-2029 (USD MILLION)
TABLE 274 DENMARK SNACK PELLETS MARKET, BY NATURE, 2020-2029 (USD MILLION)
TABLE 275 DENMARK SNACK PELLETS MARKET, BY TECHNIQUE, 2020-2029 (USD MILLION)
TABLE 276 DENMARK SNACK PELLETS MARKET, BY BRAND, 2020-2029 (USD MILLION)
TABLE 277 DENMARK SNACK PELLETS MARKET, BY FLAVOR, 2020-2029 (USD MILLION)
TABLE 278 DENMARK FLAVOR IN SNACK PELLETS MARKET, BY FLAVOR, 2020-2029 (USD MILLION)
TABLE 279 DENMARK SNACK PELLETS MARKET, BY APPLICATION, 2020-2029 (USD MILLION)
TABLE 280 DENMARK SNACK PELLETS MARKET, BY DISTRIBUTION CHANNEL, 2020-2029 (USD MILLION)
TABLE 281 DENMARK INDIRECT IN SNACK PELLETS MARKET, BY DISTRIBUTION CHANNEL, 2020-2029 (USD MILLION)
TABLE 282 DENMARK STORE-BASED RETAILING IN SNACK PELLETS MARKET, BY DISTRIBUTION CHANNEL, 2020-2029 (USD MILLION)
TABLE 283 DENMARK NON-STORE-BASED RETAILING IN SNACK PELLETS MARKET, BY DISTRIBUTION CHANNEL, 2020-2029 (USD MILLION)
TABLE 284 POLAND SNACK PELLETS MARKET, BY TYPE, 2020-2029 (USD MILLION)
TABLE 285 POLAND SNACK PELLETS MARKET, BY FORM, 2020-2029 (USD MILLION)
TABLE 286 POLAND SNACK PELLETS MARKET, BY SHAPE, 2020-2029 (USD MILLION)
TABLE 287 POLAND SNACK PELLETS MARKET, BY INGREDIENTS, 2020-2029 (USD MILLION)
TABLE 288 POLAND SNACK PELLETS MARKET, BY PROCESSING METHOD, 2020-2029 (USD MILLION)
TABLE 289 POLAND NON-GREASY SNACK PELLET IN SNACK PELLETS MARKET, BY PROCESSING METHOD, 2020-2029 (USD MILLION)
TABLE 290 POLAND SNACK PELLETS MARKET, BY NATURE, 2020-2029 (USD MILLION)
TABLE 291 POLAND SNACK PELLETS MARKET, BY TECHNIQUE, 2020-2029 (USD MILLION)
TABLE 292 POLAND SNACK PELLETS MARKET, BY BRAND, 2020-2029 (USD MILLION)
TABLE 293 POLAND SNACK PELLETS MARKET, BY FLAVOR, 2020-2029 (USD MILLION)
TABLE 294 POLAND FLAVOR IN SNACK PELLETS MARKET, BY FLAVOR, 2020-2029 (USD MILLION)
TABLE 295 POLAND SNACK PELLETS MARKET, BY APPLICATION, 2020-2029 (USD MILLION)
TABLE 296 POLAND SNACK PELLETS MARKET, BY DISTRIBUTION CHANNEL, 2020-2029 (USD MILLION)
TABLE 297 POLAND INDIRECT IN SNACK PELLETS MARKET, BY DISTRIBUTION CHANNEL, 2020-2029 (USD MILLION)
TABLE 298 POLAND STORE-BASED RETAILING IN SNACK PELLETS MARKET, BY DISTRIBUTION CHANNEL, 2020-2029 (USD MILLION)
TABLE 299 POLAND NON-STORE-BASED RETAILING IN SNACK PELLETS MARKET, BY DISTRIBUTION CHANNEL, 2020-2029 (USD MILLION)
TABLE 300 RUSSIA SNACK PELLETS MARKET, BY TYPE, 2020-2029 (USD MILLION)
TABLE 301 RUSSIA SNACK PELLETS MARKET, BY FORM, 2020-2029 (USD MILLION)
TABLE 302 RUSSIA SNACK PELLETS MARKET, BY SHAPE, 2020-2029 (USD MILLION)
TABLE 303 RUSSIA SNACK PELLETS MARKET, BY INGREDIENTS, 2020-2029 (USD MILLION)
TABLE 304 RUSSIA SNACK PELLETS MARKET, BY PROCESSING METHOD, 2020-2029 (USD MILLION)
TABLE 305 RUSSIA NON-GREASY SNACK PELLET IN SNACK PELLETS MARKET, BY PROCESSING METHOD, 2020-2029 (USD MILLION)
TABLE 306 RUSSIA SNACK PELLETS MARKET, BY NATURE, 2020-2029 (USD MILLION)
TABLE 307 RUSSIA SNACK PELLETS MARKET, BY TECHNIQUE, 2020-2029 (USD MILLION)
TABLE 308 RUSSIA SNACK PELLETS MARKET, BY BRAND, 2020-2029 (USD MILLION)
TABLE 309 RUSSIA SNACK PELLETS MARKET, BY FLAVOR, 2020-2029 (USD MILLION)
TABLE 310 RUSSIA FLAVOR IN SNACK PELLETS MARKET, BY FLAVOR, 2020-2029 (USD MILLION)
TABLE 311 RUSSIA SNACK PELLETS MARKET, BY APPLICATION, 2020-2029 (USD MILLION)
TABLE 312 RUSSIA SNACK PELLETS MARKET, BY DISTRIBUTION CHANNEL, 2020-2029 (USD MILLION)
TABLE 313 RUSSIA INDIRECT IN SNACK PELLETS MARKET, BY DISTRIBUTION CHANNEL, 2020-2029 (USD MILLION)
TABLE 314 RUSSIA STORE-BASED RETAILING IN SNACK PELLETS MARKET, BY DISTRIBUTION CHANNEL, 2020-2029 (USD MILLION)
TABLE 315 RUSSIA NON-STORE-BASED RETAILING IN SNACK PELLETS MARKET, BY DISTRIBUTION CHANNEL, 2020-2029 (USD MILLION)
TABLE 316 SWITZERLAND SNACK PELLETS MARKET, BY TYPE, 2020-2029 (USD MILLION)
TABLE 317 SWITZERLAND SNACK PELLETS MARKET, BY FORM, 2020-2029 (USD MILLION)
TABLE 318 SWITZERLAND SNACK PELLETS MARKET, BY SHAPE, 2020-2029 (USD MILLION)
TABLE 319 SWITZERLAND SNACK PELLETS MARKET, BY INGREDIENTS, 2020-2029 (USD MILLION)
TABLE 320 SWITZERLAND SNACK PELLETS MARKET, BY PROCESSING METHOD, 2020-2029 (USD MILLION)
TABLE 321 SWITZERLAND NON-GREASY SNACK PELLET IN SNACK PELLETS MARKET, BY PROCESSING METHOD, 2020-2029 (USD MILLION)
TABLE 322 SWITZERLAND SNACK PELLETS MARKET, BY NATURE, 2020-2029 (USD MILLION)
TABLE 323 SWITZERLAND SNACK PELLETS MARKET, BY TECHNIQUE, 2020-2029 (USD MILLION)
TABLE 324 SWITZERLAND SNACK PELLETS MARKET, BY BRAND, 2020-2029 (USD MILLION)
TABLE 325 SWITZERLAND SNACK PELLETS MARKET, BY FLAVOR, 2020-2029 (USD MILLION)
TABLE 326 SWITZERLAND FLAVOR IN SNACK PELLETS MARKET, BY FLAVOR, 2020-2029 (USD MILLION)
TABLE 327 SWITZERLAND SNACK PELLETS MARKET, BY APPLICATION, 2020-2029 (USD MILLION)
TABLE 328 SWITZERLAND SNACK PELLETS MARKET, BY DISTRIBUTION CHANNEL, 2020-2029 (USD MILLION)
TABLE 329 SWITZERLAND INDIRECT IN SNACK PELLETS MARKET, BY DISTRIBUTION CHANNEL, 2020-2029 (USD MILLION)
TABLE 330 SWITZERLAND STORE-BASED RETAILING IN SNACK PELLETS MARKET, BY DISTRIBUTION CHANNEL, 2020-2029 (USD MILLION)
TABLE 331 SWITZERLAND NON-STORE-BASED RETAILING IN SNACK PELLETS MARKET, BY DISTRIBUTION CHANNEL, 2020-2029 (USD MILLION)
TABLE 332 TURKEY SNACK PELLETS MARKET, BY TYPE, 2020-2029 (USD MILLION)
TABLE 333 TURKEY SNACK PELLETS MARKET, BY FORM, 2020-2029 (USD MILLION)
TABLE 334 TURKEY SNACK PELLETS MARKET, BY SHAPE, 2020-2029 (USD MILLION)
TABLE 335 TURKEY SNACK PELLETS MARKET, BY INGREDIENTS, 2020-2029 (USD MILLION)
TABLE 336 TURKEY SNACK PELLETS MARKET, BY PROCESSING METHOD, 2020-2029 (USD MILLION)
TABLE 337 TURKEY NON-GREASY SNACK PELLET IN SNACK PELLETS MARKET, BY PROCESSING METHOD, 2020-2029 (USD MILLION)
TABLE 338 TURKEY SNACK PELLETS MARKET, BY NATURE, 2020-2029 (USD MILLION)
TABLE 339 TURKEY SNACK PELLETS MARKET, BY TECHNIQUE, 2020-2029 (USD MILLION)
TABLE 340 TURKEY SNACK PELLETS MARKET, BY BRAND, 2020-2029 (USD MILLION)
TABLE 341 TURKEY SNACK PELLETS MARKET, BY FLAVOR, 2020-2029 (USD MILLION)
TABLE 342 TURKEY FLAVOR IN SNACK PELLETS MARKET, BY FLAVOR, 2020-2029 (USD MILLION)
TABLE 343 TURKEY SNACK PELLETS MARKET, BY APPLICATION, 2020-2029 (USD MILLION)
TABLE 344 TURKEY SNACK PELLETS MARKET, BY DISTRIBUTION CHANNEL, 2020-2029 (USD MILLION)
TABLE 345 TURKEY INDIRECT IN SNACK PELLETS MARKET, BY DISTRIBUTION CHANNEL, 2020-2029 (USD MILLION)
TABLE 346 TURKEY STORE-BASED RETAILING IN SNACK PELLETS MARKET, BY DISTRIBUTION CHANNEL, 2020-2029 (USD MILLION)
TABLE 347 TURKEY NON-STORE-BASED RETAILING IN SNACK PELLETS MARKET, BY DISTRIBUTION CHANNEL, 2020-2029 (USD MILLION)
TABLE 348 REST OF EUROPE SNACK PELLETS MARKET, BY TYPE, 2020-2029 (USD MILLION)
TABLE 349 ASIA-PACIFIC SNACK PELLETS MARKET, BY COUNTRY, 2020-2029 (USD MILLION)
TABLE 350 ASIA-PACIFIC SNACK PELLETS MARKET, BY TYPE, 2020-2029 (USD MILLION)
TABLE 351 ASIA-PACIFIC SNACK PELLETS MARKET, BY FORM, 2020-2029 (USD MILLION)
TABLE 352 ASIA-PACIFIC SNACK PELLETS MARKET, BY SHAPE, 2020-2029 (USD MILLION)
TABLE 353 ASIA-PACIFIC SNACK PELLETS MARKET, BY INGREDIENTS, 2020-2029 (USD MILLION)
TABLE 354 ASIA-PACIFIC SNACK PELLETS MARKET, BY PROCESSING METHOD, 2020-2029 (USD MILLION)
TABLE 355 ASIA-PACIFIC NON-GREASY SNACK PELLET IN SNACK PELLETS MARKET, BY PROCESSING METHOD, 2020-2029 (USD MILLION)
TABLE 356 ASIA-PACIFIC SNACK PELLETS MARKET, BY NATURE, 2020-2029 (USD MILLION)
TABLE 357 ASIA-PACIFIC SNACK PELLETS MARKET, BY TECHNIQUE, 2020-2029 (USD MILLION)
TABLE 358 ASIA-PACIFIC SNACK PELLETS MARKET, BY BRAND, 2020-2029 (USD MILLION)
TABLE 359 ASIA-PACIFIC SNACK PELLETS MARKET, BY FLAVOR, 2020-2029 (USD MILLION)
TABLE 360 ASIA-PACIFIC FLAVOR IN SNACK PELLETS MARKET, BY FLAVOR, 2020-2029 (USD MILLION)
TABLE 361 ASIA-PACIFIC SNACK PELLETS MARKET, BY APPLICATION, 2020-2029 (USD MILLION)
TABLE 362 ASIA-PACIFIC SNACK PELLETS MARKET, BY DISTRIBUTION CHANNEL, 2020-2029 (USD MILLION)
TABLE 363 ASIA-PACIFIC INDIRECT IN SNACK PELLETS MARKET, BY DISTRIBUTION CHANNEL, 2020-2029 (USD MILLION)
TABLE 364 ASIA-PACIFIC STORE-BASED RETAILING IN SNACK PELLETS MARKET, BY DISTRIBUTION CHANNEL, 2020-2029 (USD MILLION)
TABLE 365 ASIA-PACIFIC NON-STORE-BASED RETAILING IN SNACK PELLETS MARKET, BY DISTRIBUTION CHANNEL, 2020-2029 (USD MILLION)
TABLE 366 CHINA SNACK PELLETS MARKET, BY TYPE, 2020-2029 (USD MILLION)
TABLE 367 CHINA SNACK PELLETS MARKET, BY FORM, 2020-2029 (USD MILLION)
TABLE 368 CHINA SNACK PELLETS MARKET, BY SHAPE, 2020-2029 (USD MILLION)
TABLE 369 CHINA SNACK PELLETS MARKET, BY INGREDIENTS, 2020-2029 (USD MILLION)
TABLE 370 CHINA SNACK PELLETS MARKET, BY PROCESSING METHOD, 2020-2029 (USD MILLION)
TABLE 371 CHINA NON-GREASY SNACK PELLET IN SNACK PELLETS MARKET, BY PROCESSING METHOD, 2020-2029 (USD MILLION)
TABLE 372 CHINA SNACK PELLETS MARKET, BY NATURE, 2020-2029 (USD MILLION)
TABLE 373 CHINA SNACK PELLETS MARKET, BY TECHNIQUE, 2020-2029 (USD MILLION)
TABLE 374 CHINA SNACK PELLETS MARKET, BY BRAND, 2020-2029 (USD MILLION)
TABLE 375 CHINA SNACK PELLETS MARKET, BY FLAVOR, 2020-2029 (USD MILLION)
TABLE 376 CHINA FLAVOR IN SNACK PELLETS MARKET, BY FLAVOR, 2020-2029 (USD MILLION)
TABLE 377 CHINA SNACK PELLETS MARKET, BY APPLICATION, 2020-2029 (USD MILLION)
TABLE 378 CHINA SNACK PELLETS MARKET, BY DISTRIBUTION CHANNEL, 2020-2029 (USD MILLION)
TABLE 379 CHINA INDIRECT IN SNACK PELLETS MARKET, BY DISTRIBUTION CHANNEL, 2020-2029 (USD MILLION)
TABLE 380 CHINA STORE-BASED RETAILING IN SNACK PELLETS MARKET, BY DISTRIBUTION CHANNEL, 2020-2029 (USD MILLION)
TABLE 381 CHINA NON-STORE-BASED RETAILING IN SNACK PELLETS MARKET, BY DISTRIBUTION CHANNEL, 2020-2029 (USD MILLION)
TABLE 382 INDIA SNACK PELLETS MARKET, BY TYPE, 2020-2029 (USD MILLION)
TABLE 383 INDIA SNACK PELLETS MARKET, BY FORM, 2020-2029 (USD MILLION)
TABLE 384 INDIA SNACK PELLETS MARKET, BY SHAPE, 2020-2029 (USD MILLION)
TABLE 385 INDIA SNACK PELLETS MARKET, BY INGREDIENTS, 2020-2029 (USD MILLION)
TABLE 386 INDIA SNACK PELLETS MARKET, BY PROCESSING METHOD, 2020-2029 (USD MILLION)
TABLE 387 INDIA NON-GREASY SNACK PELLET IN SNACK PELLETS MARKET, BY PROCESSING METHOD, 2020-2029 (USD MILLION)
TABLE 388 INDIA SNACK PELLETS MARKET, BY NATURE, 2020-2029 (USD MILLION)
TABLE 389 INDIA SNACK PELLETS MARKET, BY TECHNIQUE, 2020-2029 (USD MILLION)
TABLE 390 INDIA SNACK PELLETS MARKET, BY BRAND, 2020-2029 (USD MILLION)
TABLE 391 INDIA SNACK PELLETS MARKET, BY FLAVOR, 2020-2029 (USD MILLION)
TABLE 392 INDIA FLAVOR IN SNACK PELLETS MARKET, BY FLAVOR, 2020-2029 (USD MILLION)
TABLE 393 INDIA SNACK PELLETS MARKET, BY APPLICATION, 2020-2029 (USD MILLION)
TABLE 394 INDIA SNACK PELLETS MARKET, BY DISTRIBUTION CHANNEL, 2020-2029 (USD MILLION)
TABLE 395 INDIA INDIRECT IN SNACK PELLETS MARKET, BY DISTRIBUTION CHANNEL, 2020-2029 (USD MILLION)
TABLE 396 INDIA STORE-BASED RETAILING IN SNACK PELLETS MARKET, BY DISTRIBUTION CHANNEL, 2020-2029 (USD MILLION)
TABLE 397 INDIA NON-STORE-BASED RETAILING IN SNACK PELLETS MARKET, BY DISTRIBUTION CHANNEL, 2020-2029 (USD MILLION)
TABLE 398 JAPAN SNACK PELLETS MARKET, BY TYPE, 2020-2029 (USD MILLION)
TABLE 399 JAPAN SNACK PELLETS MARKET, BY FORM, 2020-2029 (USD MILLION)
TABLE 400 JAPAN SNACK PELLETS MARKET, BY SHAPE, 2020-2029 (USD MILLION)
TABLE 401 JAPAN SNACK PELLETS MARKET, BY INGREDIENTS, 2020-2029 (USD MILLION)
TABLE 402 JAPAN SNACK PELLETS MARKET, BY PROCESSING METHOD, 2020-2029 (USD MILLION)
TABLE 403 JAPAN NON-GREASY SNACK PELLET IN SNACK PELLETS MARKET, BY PROCESSING METHOD, 2020-2029 (USD MILLION)
TABLE 404 JAPAN SNACK PELLETS MARKET, BY NATURE, 2020-2029 (USD MILLION)
TABLE 405 JAPAN SNACK PELLETS MARKET, BY TECHNIQUE, 2020-2029 (USD MILLION)
TABLE 406 JAPAN SNACK PELLETS MARKET, BY BRAND, 2020-2029 (USD MILLION)
TABLE 407 JAPAN SNACK PELLETS MARKET, BY FLAVOR, 2020-2029 (USD MILLION)
TABLE 408 JAPAN FLAVOR IN SNACK PELLETS MARKET, BY FLAVOR, 2020-2029 (USD MILLION)
TABLE 409 JAPAN SNACK PELLETS MARKET, BY APPLICATION, 2020-2029 (USD MILLION)
TABLE 410 JAPAN SNACK PELLETS MARKET, BY DISTRIBUTION CHANNEL, 2020-2029 (USD MILLION)
TABLE 411 JAPAN INDIRECT IN SNACK PELLETS MARKET, BY DISTRIBUTION CHANNEL, 2020-2029 (USD MILLION)
TABLE 412 JAPAN STORE-BASED RETAILING IN SNACK PELLETS MARKET, BY DISTRIBUTION CHANNEL, 2020-2029 (USD MILLION)
TABLE 413 JAPAN NON-STORE-BASED RETAILING IN SNACK PELLETS MARKET, BY DISTRIBUTION CHANNEL, 2020-2029 (USD MILLION)
TABLE 414 AUSTRALIA SNACK PELLETS MARKET, BY TYPE, 2020-2029 (USD MILLION)
TABLE 415 AUSTRALIA SNACK PELLETS MARKET, BY FORM, 2020-2029 (USD MILLION)
TABLE 416 AUSTRALIA SNACK PELLETS MARKET, BY SHAPE, 2020-2029 (USD MILLION)
TABLE 417 AUSTRALIA SNACK PELLETS MARKET, BY INGREDIENTS, 2020-2029 (USD MILLION)
TABLE 418 AUSTRALIA SNACK PELLETS MARKET, BY PROCESSING METHOD, 2020-2029 (USD MILLION)
TABLE 419 AUSTRALIA NON-GREASY SNACK PELLET IN SNACK PELLETS MARKET, BY PROCESSING METHOD, 2020-2029 (USD MILLION)
TABLE 420 AUSTRALIA SNACK PELLETS MARKET, BY NATURE, 2020-2029 (USD MILLION)
TABLE 421 AUSTRALIA SNACK PELLETS MARKET, BY TECHNIQUE, 2020-2029 (USD MILLION)
TABLE 422 AUSTRALIA SNACK PELLETS MARKET, BY BRAND, 2020-2029 (USD MILLION)
TABLE 423 AUSTRALIA SNACK PELLETS MARKET, BY FLAVOR, 2020-2029 (USD MILLION)
TABLE 424 AUSTRALIA FLAVOR IN SNACK PELLETS MARKET, BY FLAVOR, 2020-2029 (USD MILLION)
TABLE 425 AUSTRALIA SNACK PELLETS MARKET, BY APPLICATION, 2020-2029 (USD MILLION)
TABLE 426 AUSTRALIA SNACK PELLETS MARKET, BY DISTRIBUTION CHANNEL, 2020-2029 (USD MILLION)
TABLE 427 AUSTRALIA INDIRECT IN SNACK PELLETS MARKET, BY DISTRIBUTION CHANNEL, 2020-2029 (USD MILLION)
TABLE 428 AUSTRALIA STORE-BASED RETAILING IN SNACK PELLETS MARKET, BY DISTRIBUTION CHANNEL, 2020-2029 (USD MILLION)
TABLE 429 AUSTRALIA NON-STORE-BASED RETAILING IN SNACK PELLETS MARKET, BY DISTRIBUTION CHANNEL, 2020-2029 (USD MILLION)
TABLE 430 SOUTH KOREA SNACK PELLETS MARKET, BY TYPE, 2020-2029 (USD MILLION)
TABLE 431 SOUTH KOREA SNACK PELLETS MARKET, BY FORM, 2020-2029 (USD MILLION)
TABLE 432 SOUTH KOREA SNACK PELLETS MARKET, BY SHAPE, 2020-2029 (USD MILLION)
TABLE 433 SOUTH KOREA SNACK PELLETS MARKET, BY INGREDIENTS, 2020-2029 (USD MILLION)
TABLE 434 SOUTH KOREA SNACK PELLETS MARKET, BY PROCESSING METHOD, 2020-2029 (USD MILLION)
TABLE 435 SOUTH KOREA NON-GREASY SNACK PELLET IN SNACK PELLETS MARKET, BY PROCESSING METHOD, 2020-2029 (USD MILLION)
TABLE 436 SOUTH KOREA SNACK PELLETS MARKET, BY NATURE, 2020-2029 (USD MILLION)
TABLE 437 SOUTH KOREA SNACK PELLETS MARKET, BY TECHNIQUE, 2020-2029 (USD MILLION)
TABLE 438 SOUTH KOREA SNACK PELLETS MARKET, BY BRAND, 2020-2029 (USD MILLION)
TABLE 439 SOUTH KOREA SNACK PELLETS MARKET, BY FLAVOR, 2020-2029 (USD MILLION)
TABLE 440 SOUTH KOREA FLAVOR IN SNACK PELLETS MARKET, BY FLAVOR, 2020-2029 (USD MILLION)
TABLE 441 SOUTH KOREA SNACK PELLETS MARKET, BY APPLICATION, 2020-2029 (USD MILLION)
TABLE 442 SOUTH KOREA SNACK PELLETS MARKET, BY DISTRIBUTION CHANNEL, 2020-2029 (USD MILLION)
TABLE 443 SOUTH KOREA INDIRECT IN SNACK PELLETS MARKET, BY DISTRIBUTION CHANNEL, 2020-2029 (USD MILLION)
TABLE 444 SOUTH KOREA STORE-BASED RETAILING IN SNACK PELLETS MARKET, BY DISTRIBUTION CHANNEL, 2020-2029 (USD MILLION)
TABLE 445 SOUTH KOREA NON-STORE-BASED RETAILING IN SNACK PELLETS MARKET, BY DISTRIBUTION CHANNEL, 2020-2029 (USD MILLION)
TABLE 446 SINGAPORE SNACK PELLETS MARKET, BY TYPE, 2020-2029 (USD MILLION)
TABLE 447 SINGAPORE SNACK PELLETS MARKET, BY FORM, 2020-2029 (USD MILLION)
TABLE 448 SINGAPORE SNACK PELLETS MARKET, BY SHAPE, 2020-2029 (USD MILLION)
TABLE 449 SINGAPORE SNACK PELLETS MARKET, BY INGREDIENTS, 2020-2029 (USD MILLION)
TABLE 450 SINGAPORE SNACK PELLETS MARKET, BY PROCESSING METHOD, 2020-2029 (USD MILLION)
TABLE 451 SINGAPORE NON-GREASY SNACK PELLET IN SNACK PELLETS MARKET, BY PROCESSING METHOD, 2020-2029 (USD MILLION)
TABLE 452 SINGAPORE SNACK PELLETS MARKET, BY NATURE, 2020-2029 (USD MILLION)
TABLE 453 SINGAPORE SNACK PELLETS MARKET, BY TECHNIQUE, 2020-2029 (USD MILLION)
TABLE 454 SINGAPORE SNACK PELLETS MARKET, BY BRAND, 2020-2029 (USD MILLION)
TABLE 455 SINGAPORE SNACK PELLETS MARKET, BY FLAVOR, 2020-2029 (USD MILLION)
TABLE 456 SINGAPORE FLAVOR IN SNACK PELLETS MARKET, BY FLAVOR, 2020-2029 (USD MILLION)
TABLE 457 SINGAPORE SNACK PELLETS MARKET, BY APPLICATION, 2020-2029 (USD MILLION)
TABLE 458 SINGAPORE SNACK PELLETS MARKET, BY DISTRIBUTION CHANNEL, 2020-2029 (USD MILLION)
TABLE 459 SINGAPORE INDIRECT IN SNACK PELLETS MARKET, BY DISTRIBUTION CHANNEL, 2020-2029 (USD MILLION)
TABLE 460 SINGAPORE STORE-BASED RETAILING IN SNACK PELLETS MARKET, BY DISTRIBUTION CHANNEL, 2020-2029 (USD MILLION)
TABLE 461 SINGAPORE NON-STORE-BASED RETAILING IN SNACK PELLETS MARKET, BY DISTRIBUTION CHANNEL, 2020-2029 (USD MILLION)
TABLE 462 NEW ZEALAND SNACK PELLETS MARKET, BY TYPE, 2020-2029 (USD MILLION)
TABLE 463 NEW ZEALAND SNACK PELLETS MARKET, BY FORM, 2020-2029 (USD MILLION)
TABLE 464 NEW ZEALAND SNACK PELLETS MARKET, BY SHAPE, 2020-2029 (USD MILLION)
TABLE 465 NEW ZEALAND SNACK PELLETS MARKET, BY INGREDIENTS, 2020-2029 (USD MILLION)
TABLE 466 NEW ZEALAND SNACK PELLETS MARKET, BY PROCESSING METHOD, 2020-2029 (USD MILLION)
TABLE 467 NEW ZEALAND NON-GREASY SNACK PELLET IN SNACK PELLETS MARKET, BY PROCESSING METHOD, 2020-2029 (USD MILLION)
TABLE 468 NEW ZEALAND SNACK PELLETS MARKET, BY NATURE, 2020-2029 (USD MILLION)
TABLE 469 NEW ZEALAND SNACK PELLETS MARKET, BY TECHNIQUE, 2020-2029 (USD MILLION)
TABLE 470 NEW ZEALAND SNACK PELLETS MARKET, BY BRAND, 2020-2029 (USD MILLION)
TABLE 471 NEW ZEALAND SNACK PELLETS MARKET, BY FLAVOR, 2020-2029 (USD MILLION)
TABLE 472 NEW ZEALAND FLAVOR IN SNACK PELLETS MARKET, BY FLAVOR, 2020-2029 (USD MILLION)
TABLE 473 NEW ZEALAND SNACK PELLETS MARKET, BY APPLICATION, 2020-2029 (USD MILLION)
TABLE 474 NEW ZEALAND SNACK PELLETS MARKET, BY DISTRIBUTION CHANNEL, 2020-2029 (USD MILLION)
TABLE 475 NEW ZEALAND INDIRECT IN SNACK PELLETS MARKET, BY DISTRIBUTION CHANNEL, 2020-2029 (USD MILLION)
TABLE 476 NEW ZEALAND STORE-BASED RETAILING IN SNACK PELLETS MARKET, BY DISTRIBUTION CHANNEL, 2020-2029 (USD MILLION)
TABLE 477 NEW ZEALAND NON-STORE-BASED RETAILING IN SNACK PELLETS MARKET, BY DISTRIBUTION CHANNEL, 2020-2029 (USD MILLION)
TABLE 478 THAILAND SNACK PELLETS MARKET, BY TYPE, 2020-2029 (USD MILLION)
TABLE 479 THAILAND SNACK PELLETS MARKET, BY FORM, 2020-2029 (USD MILLION)
TABLE 480 THAILAND SNACK PELLETS MARKET, BY SHAPE, 2020-2029 (USD MILLION)
TABLE 481 THAILAND SNACK PELLETS MARKET, BY INGREDIENTS, 2020-2029 (USD MILLION)
TABLE 482 THAILAND SNACK PELLETS MARKET, BY PROCESSING METHOD, 2020-2029 (USD MILLION)
TABLE 483 THAILAND NON-GREASY SNACK PELLET IN SNACK PELLETS MARKET, BY PROCESSING METHOD, 2020-2029 (USD MILLION)
TABLE 484 THAILAND SNACK PELLETS MARKET, BY NATURE, 2020-2029 (USD MILLION)
TABLE 485 THAILAND SNACK PELLETS MARKET, BY TECHNIQUE, 2020-2029 (USD MILLION)
TABLE 486 THAILAND SNACK PELLETS MARKET, BY BRAND, 2020-2029 (USD MILLION)
TABLE 487 THAILAND SNACK PELLETS MARKET, BY FLAVOR, 2020-2029 (USD MILLION)
TABLE 488 THAILAND FLAVOR IN SNACK PELLETS MARKET, BY FLAVOR, 2020-2029 (USD MILLION)
TABLE 489 THAILAND SNACK PELLETS MARKET, BY APPLICATION, 2020-2029 (USD MILLION)
TABLE 490 THAILAND SNACK PELLETS MARKET, BY DISTRIBUTION CHANNEL, 2020-2029 (USD MILLION)
TABLE 491 THAILAND INDIRECT IN SNACK PELLETS MARKET, BY DISTRIBUTION CHANNEL, 2020-2029 (USD MILLION)
TABLE 492 THAILAND STORE-BASED RETAILING IN SNACK PELLETS MARKET, BY DISTRIBUTION CHANNEL, 2020-2029 (USD MILLION)
TABLE 493 THAILAND NON-STORE-BASED RETAILING IN SNACK PELLETS MARKET, BY DISTRIBUTION CHANNEL, 2020-2029 (USD MILLION)
TABLE 494 INDONESIA SNACK PELLETS MARKET, BY TYPE, 2020-2029 (USD MILLION)
TABLE 495 INDONESIA SNACK PELLETS MARKET, BY FORM, 2020-2029 (USD MILLION)
TABLE 496 INDONESIA SNACK PELLETS MARKET, BY SHAPE, 2020-2029 (USD MILLION)
TABLE 497 INDONESIA SNACK PELLETS MARKET, BY INGREDIENTS, 2020-2029 (USD MILLION)
TABLE 498 INDONESIA SNACK PELLETS MARKET, BY PROCESSING METHOD, 2020-2029 (USD MILLION)
TABLE 499 INDONESIA NON-GREASY SNACK PELLET IN SNACK PELLETS MARKET, BY PROCESSING METHOD, 2020-2029 (USD MILLION)
TABLE 500 INDONESIA SNACK PELLETS MARKET, BY NATURE, 2020-2029 (USD MILLION)
TABLE 501 INDONESIA SNACK PELLETS MARKET, BY TECHNIQUE, 2020-2029 (USD MILLION)
TABLE 502 INDONESIA SNACK PELLETS MARKET, BY BRAND, 2020-2029 (USD MILLION)
TABLE 503 INDONESIA SNACK PELLETS MARKET, BY FLAVOR, 2020-2029 (USD MILLION)
TABLE 504 INDONESIA FLAVOR IN SNACK PELLETS MARKET, BY FLAVOR, 2020-2029 (USD MILLION)
TABLE 505 INDONESIA SNACK PELLETS MARKET, BY APPLICATION, 2020-2029 (USD MILLION)
TABLE 506 INDONESIA SNACK PELLETS MARKET, BY DISTRIBUTION CHANNEL, 2020-2029 (USD MILLION)
TABLE 507 INDONESIA INDIRECT IN SNACK PELLETS MARKET, BY DISTRIBUTION CHANNEL, 2020-2029 (USD MILLION)
TABLE 508 INDONESIA STORE-BASED RETAILING IN SNACK PELLETS MARKET, BY DISTRIBUTION CHANNEL, 2020-2029 (USD MILLION)
TABLE 509 INDONESIA NON-STORE-BASED RETAILING IN SNACK PELLETS MARKET, BY DISTRIBUTION CHANNEL, 2020-2029 (USD MILLION)
TABLE 510 MALAYSIA SNACK PELLETS MARKET, BY TYPE, 2020-2029 (USD MILLION)
TABLE 511 MALAYSIA SNACK PELLETS MARKET, BY FORM, 2020-2029 (USD MILLION)
TABLE 512 MALAYSIA SNACK PELLETS MARKET, BY SHAPE, 2020-2029 (USD MILLION)
TABLE 513 MALAYSIA SNACK PELLETS MARKET, BY INGREDIENTS, 2020-2029 (USD MILLION)
TABLE 514 MALAYSIA SNACK PELLETS MARKET, BY PROCESSING METHOD, 2020-2029 (USD MILLION)
TABLE 515 MALAYSIA NON-GREASY SNACK PELLET IN SNACK PELLETS MARKET, BY PROCESSING METHOD, 2020-2029 (USD MILLION)
TABLE 516 MALAYSIA SNACK PELLETS MARKET, BY NATURE, 2020-2029 (USD MILLION)
TABLE 517 MALAYSIA SNACK PELLETS MARKET, BY TECHNIQUE, 2020-2029 (USD MILLION)
TABLE 518 MALAYSIA SNACK PELLETS MARKET, BY BRAND, 2020-2029 (USD MILLION)
TABLE 519 MALAYSIA SNACK PELLETS MARKET, BY FLAVOR, 2020-2029 (USD MILLION)
TABLE 520 MALAYSIA FLAVOR IN SNACK PELLETS MARKET, BY FLAVOR, 2020-2029 (USD MILLION)
TABLE 521 MALAYSIA SNACK PELLETS MARKET, BY APPLICATION, 2020-2029 (USD MILLION)
TABLE 522 MALAYSIA SNACK PELLETS MARKET, BY DISTRIBUTION CHANNEL, 2020-2029 (USD MILLION)
TABLE 523 MALAYSIA INDIRECT IN SNACK PELLETS MARKET, BY DISTRIBUTION CHANNEL, 2020-2029 (USD MILLION)
TABLE 524 MALAYSIA STORE-BASED RETAILING IN SNACK PELLETS MARKET, BY DISTRIBUTION CHANNEL, 2020-2029 (USD MILLION)
TABLE 525 MALAYSIA NON-STORE-BASED RETAILING IN SNACK PELLETS MARKET, BY DISTRIBUTION CHANNEL, 2020-2029 (USD MILLION)
TABLE 526 PHILIPPINES SNACK PELLETS MARKET, BY TYPE, 2020-2029 (USD MILLION)
TABLE 527 PHILIPPINES SNACK PELLETS MARKET, BY FORM, 2020-2029 (USD MILLION)
TABLE 528 PHILIPPINES SNACK PELLETS MARKET, BY SHAPE, 2020-2029 (USD MILLION)
TABLE 529 PHILIPPINES SNACK PELLETS MARKET, BY INGREDIENTS, 2020-2029 (USD MILLION)
TABLE 530 PHILIPPINES SNACK PELLETS MARKET, BY PROCESSING METHOD, 2020-2029 (USD MILLION)
TABLE 531 PHILIPPINES NON-GREASY SNACK PELLET IN SNACK PELLETS MARKET, BY PROCESSING METHOD, 2020-2029 (USD MILLION)
TABLE 532 PHILIPPINES SNACK PELLETS MARKET, BY NATURE, 2020-2029 (USD MILLION)
TABLE 533 PHILIPPINES SNACK PELLETS MARKET, BY TECHNIQUE, 2020-2029 (USD MILLION)
TABLE 534 PHILIPPINES SNACK PELLETS MARKET, BY BRAND, 2020-2029 (USD MILLION)
TABLE 535 PHILIPPINES SNACK PELLETS MARKET, BY FLAVOR, 2020-2029 (USD MILLION)
TABLE 536 PHILIPPINES FLAVOR IN SNACK PELLETS MARKET, BY FLAVOR, 2020-2029 (USD MILLION)
TABLE 537 PHILIPPINES SNACK PELLETS MARKET, BY APPLICATION, 2020-2029 (USD MILLION)
TABLE 538 PHILIPPINES SNACK PELLETS MARKET, BY DISTRIBUTION CHANNEL, 2020-2029 (USD MILLION)
TABLE 539 PHILIPPINES INDIRECT IN SNACK PELLETS MARKET, BY DISTRIBUTION CHANNEL, 2020-2029 (USD MILLION)
TABLE 540 PHILIPPINES STORE-BASED RETAILING IN SNACK PELLETS MARKET, BY DISTRIBUTION CHANNEL, 2020-2029 (USD MILLION)
TABLE 541 PHILIPPINES NON-STORE-BASED RETAILING IN SNACK PELLETS MARKET, BY DISTRIBUTION CHANNEL, 2020-2029 (USD MILLION)
TABLE 542 VIETNAM SNACK PELLETS MARKET, BY TYPE, 2020-2029 (USD MILLION)
TABLE 543 VIETNAM SNACK PELLETS MARKET, BY FORM, 2020-2029 (USD MILLION)
TABLE 544 VIETNAM SNACK PELLETS MARKET, BY SHAPE, 2020-2029 (USD MILLION)
TABLE 545 VIETNAM SNACK PELLETS MARKET, BY INGREDIENTS, 2020-2029 (USD MILLION)
TABLE 546 VIETNAM SNACK PELLETS MARKET, BY PROCESSING METHOD, 2020-2029 (USD MILLION)
TABLE 547 VIETNAM NON-GREASY SNACK PELLET IN SNACK PELLETS MARKET, BY PROCESSING METHOD, 2020-2029 (USD MILLION)
TABLE 548 VIETNAM SNACK PELLETS MARKET, BY NATURE, 2020-2029 (USD MILLION)
TABLE 549 VIETNAM SNACK PELLETS MARKET, BY TECHNIQUE, 2020-2029 (USD MILLION)
TABLE 550 VIETNAM SNACK PELLETS MARKET, BY BRAND, 2020-2029 (USD MILLION)
TABLE 551 VIETNAM SNACK PELLETS MARKET, BY FLAVOR, 2020-2029 (USD MILLION)
TABLE 552 VIETNAM FLAVOR IN SNACK PELLETS MARKET, BY FLAVOR, 2020-2029 (USD MILLION)
TABLE 553 VIETNAM SNACK PELLETS MARKET, BY APPLICATION, 2020-2029 (USD MILLION)
TABLE 554 VIETNAM SNACK PELLETS MARKET, BY DISTRIBUTION CHANNEL, 2020-2029 (USD MILLION)
TABLE 555 VIETNAM INDIRECT IN SNACK PELLETS MARKET, BY DISTRIBUTION CHANNEL, 2020-2029 (USD MILLION)
TABLE 556 VIETNAM STORE-BASED RETAILING IN SNACK PELLETS MARKET, BY DISTRIBUTION CHANNEL, 2020-2029 (USD MILLION)
TABLE 557 VIETNAM NON-STORE-BASED RETAILING IN SNACK PELLETS MARKET, BY DISTRIBUTION CHANNEL, 2020-2029 (USD MILLION)
TABLE 558 REST OF ASIA-PACIFIC SNACK PELLETS MARKET, BY TYPE, 2020-2029 (USD MILLION)
TABLE 559 SOUTH AMERICA SNACK PELLETS MARKET, BY COUNTRY, 2020-2029 (USD MILLION)
TABLE 560 SOUTH AMERICA SNACK PELLETS MARKET, BY TYPE, 2020-2029 (USD MILLION)
TABLE 561 SOUTH AMERICA SNACK PELLETS MARKET, BY FORM, 2020-2029 (USD MILLION)
TABLE 562 SOUTH AMERICA SNACK PELLETS MARKET, BY SHAPE, 2020-2029 (USD MILLION)
TABLE 563 SOUTH AMERICA SNACK PELLETS MARKET, BY INGREDIENTS, 2020-2029 (USD MILLION)
TABLE 564 SOUTH AMERICA SNACK PELLETS MARKET, BY PROCESSING METHOD, 2020-2029 (USD MILLION)
TABLE 565 SOUTH AMERICA NON-GREASY SNACK PELLET IN SNACK PELLETS MARKET, BY PROCESSING METHOD, 2020-2029 (USD MILLION)
TABLE 566 SOUTH AMERICA SNACK PELLETS MARKET, BY NATURE, 2020-2029 (USD MILLION)
TABLE 567 SOUTH AMERICA SNACK PELLETS MARKET, BY TECHNIQUE, 2020-2029 (USD MILLION)
TABLE 568 SOUTH AMERICA SNACK PELLETS MARKET, BY BRAND, 2020-2029 (USD MILLION)
TABLE 569 SOUTH AMERICA SNACK PELLETS MARKET, BY FLAVOR, 2020-2029 (USD MILLION)
TABLE 570 SOUTH AMERICA FLAVOR IN SNACK PELLETS MARKET, BY FLAVOR, 2020-2029 (USD MILLION)
TABLE 571 SOUTH AMERICA SNACK PELLETS MARKET, BY APPLICATION, 2020-2029 (USD MILLION)
TABLE 572 SOUTH AMERICA SNACK PELLETS MARKET, BY DISTRIBUTION CHANNEL, 2020-2029 (USD MILLION)
TABLE 573 SOUTH AMERICA INDIRECT IN SNACK PELLETS MARKET, BY DISTRIBUTION CHANNEL, 2020-2029 (USD MILLION)
TABLE 574 SOUTH AMERICA STORE-BASED RETAILING IN SNACK PELLETS MARKET, BY DISTRIBUTION CHANNEL, 2020-2029 (USD MILLION)
TABLE 575 SOUTH AMERICA N0N-STORE-BASED RETAILING IN SNACK PELLETS MARKET, BY DISTRIBUTION CHANNEL, 2020-2029 (USD MILLION)
TABLE 576 BRAZIL SNACK PELLETS MARKET, BY TYPE, 2020-2029 (USD MILLION)
TABLE 577 BRAZIL SNACK PELLETS MARKET, BY FORM, 2020-2029 (USD MILLION)
TABLE 578 BRAZIL SNACK PELLETS MARKET, BY SHAPE, 2020-2029 (USD MILLION)
TABLE 579 BRAZIL SNACK PELLETS MARKET, BY INGREDIENTS, 2020-2029 (USD MILLION)
TABLE 580 BRAZIL SNACK PELLETS MARKET, BY PROCESSING METHOD, 2020-2029 (USD MILLION)
TABLE 581 BRAZIL NON-GREASY SNACK PELLET IN SNACK PELLETS MARKET, BY PROCESSING METHOD, 2020-2029 (USD MILLION)
TABLE 582 BRAZIL SNACK PELLETS MARKET, BY NATURE, 2020-2029 (USD MILLION)
TABLE 583 BRAZIL SNACK PELLETS MARKET, BY TECHNIQUE, 2020-2029 (USD MILLION)
TABLE 584 BRAZIL SNACK PELLETS MARKET, BY BRAND, 2020-2029 (USD MILLION)
TABLE 585 BRAZIL SNACK PELLETS MARKET, BY FLAVOR, 2020-2029 (USD MILLION)
TABLE 586 BRAZIL FLAVOR IN SNACK PELLETS MARKET, BY FLAVOR, 2020-2029 (USD MILLION)
TABLE 587 BRAZIL SNACK PELLETS MARKET, BY APPLICATION, 2020-2029 (USD MILLION)
TABLE 588 BRAZIL SNACK PELLETS MARKET, BY DISTRIBUTION CHANNEL, 2020-2029 (USD MILLION)
TABLE 589 BRAZIL INDIRECT IN SNACK PELLETS MARKET, BY DISTRIBUTION CHANNEL, 2020-2029 (USD MILLION)
TABLE 590 BRAZIL STORE-BASED RETAILING IN SNACK PELLETS MARKET, BY DISTRIBUTION CHANNEL, 2020-2029 (USD MILLION)
TABLE 591 BRAZIL NON-STORE-BASED RETAILING IN SNACK PELLETS MARKET, BY DISTRIBUTION CHANNEL, 2020-2029 (USD MILLION)
TABLE 592 ARGENTINA SNACK PELLETS MARKET, BY TYPE, 2020-2029 (USD MILLION)
TABLE 593 ARGENTINA SNACK PELLETS MARKET, BY FORM, 2020-2029 (USD MILLION)
TABLE 594 ARGENTINA SNACK PELLETS MARKET, BY SHAPE, 2020-2029 (USD MILLION)
TABLE 595 ARGENTINA SNACK PELLETS MARKET, BY INGREDIENTS, 2020-2029 (USD MILLION)
TABLE 596 ARGENTINA SNACK PELLETS MARKET, BY PROCESSING METHOD, 2020-2029 (USD MILLION)
TABLE 597 ARGENTINA NON-GREASY SNACK PELLET IN SNACK PELLETS MARKET, BY PROCESSING METHOD, 2020-2029 (USD MILLION)
TABLE 598 ARGENTINA SNACK PELLETS MARKET, BY NATURE, 2020-2029 (USD MILLION)
TABLE 599 ARGENTINA SNACK PELLETS MARKET, BY TECHNIQUE, 2020-2029 (USD MILLION)
TABLE 600 ARGENTINA SNACK PELLETS MARKET, BY BRAND, 2020-2029 (USD MILLION)
TABLE 601 ARGENTINA SNACK PELLETS MARKET, BY FLAVOR, 2020-2029 (USD MILLION)
TABLE 602 ARGENTINA FLAVOR IN SNACK PELLETS MARKET, BY FLAVOR, 2020-2029 (USD MILLION)
TABLE 603 ARGENTINA SNACK PELLETS MARKET, BY APPLICATION, 2020-2029 (USD MILLION)
TABLE 604 ARGENTINA SNACK PELLETS MARKET, BY DISTRIBUTION CHANNEL, 2020-2029 (USD MILLION)
TABLE 605 ARGENTINA INDIRECT IN SNACK PELLETS MARKET, BY DISTRIBUTION CHANNEL, 2020-2029 (USD MILLION)
TABLE 606 ARGENTINA STORE-BASED RETAILING IN SNACK PELLETS MARKET, BY DISTRIBUTION CHANNEL, 2020-2029 (USD MILLION)
TABLE 607 ARGENTINA NON-STORE-BASED RETAILING IN SNACK PELLETS MARKET, BY DISTRIBUTION CHANNEL, 2020-2029 (USD MILLION)
TABLE 608 REST OF SOUTH AMERICA SNACK PELLETS MARKET, BY TYPE, 2020-2029 (USD MILLION)
TABLE 609 MIDDLE EAST & AFRICA SNACK PELLETS MARKET, BY COUNTRY, 2020-2029 (USD MILLION)
TABLE 610 MIDDLE EAST & AFRICA SNACK PELLETS MARKET, BY TYPE, 2020-2029 (USD MILLION)
TABLE 611 MIDDLE EAST & AFRICA SNACK PELLETS MARKET, BY FORM, 2020-2029 (USD MILLION)
TABLE 612 MIDDLE EAST & AFRICA SNACK PELLETS MARKET, BY SHAPE, 2020-2029 (USD MILLION)
TABLE 613 MIDDLE EAST & AFRICA SNACK PELLETS MARKET, BY INGREDIENTS, 2020-2029 (USD MILLION)
TABLE 614 MIDDLE EAST & AFRICA SNACK PELLETS MARKET, BY PROCESSING METHOD, 2020-2029 (USD MILLION)
TABLE 615 MIDDLE EAST & AFRICA NON-GREASY SNACK PELLET IN SNACK PELLETS MARKET, BY PROCESSING METHOD, 2020-2029 (USD MILLION)
TABLE 616 MIDDLE EAST & AFRICA SNACK PELLETS MARKET, BY NATURE, 2020-2029 (USD MILLION)
TABLE 617 MIDDLE EAST & AFRICA SNACK PELLETS MARKET, BY TECHNIQUE, 2020-2029 (USD MILLION)
TABLE 618 MIDDLE EAST & AFRICA SNACK PELLETS MARKET, BY BRAND, 2020-2029 (USD MILLION)
TABLE 619 MIDDLE EAST & AFRICA SNACK PELLETS MARKET, BY FLAVOR, 2020-2029 (USD MILLION)
TABLE 620 MIDDLE EAST & AFRICA FLAVOR IN SNACK PELLETS MARKET, BY FLAVOR, 2020-2029 (USD MILLION)
TABLE 621 MIDDLE EAST & AFRICA SNACK PELLETS MARKET, BY APPLICATION, 2020-2029 (USD MILLION)
TABLE 622 MIDDLE EAST & AFRICA SNACK PELLETS MARKET, BY DISTRIBUTION CHANNEL, 2020-2029 (USD MILLION)
TABLE 623 MIDDLE EAST & AFRICA INDIRECT IN SNACK PELLETS MARKET, BY DISTRIBUTION CHANNEL, 2020-2029 (USD MILLION)
TABLE 624 MIDDLE EAST & AFRICA STORE-BASED RETAILING IN SNACK PELLETS MARKET, BY DISTRIBUTION CHANNEL, 2020-2029 (USD MILLION)
TABLE 625 MIDDLE EAST & AFRICA NON-STORE-BASED RETAILING IN SNACK PELLETS MARKET, BY DISTRIBUTION CHANNEL, 2020-2029 (USD MILLION)
TABLE 626 SOUTH AFRICA SNACK PELLETS MARKET, BY TYPE, 2020-2029 (USD MILLION)
TABLE 627 SOUTH AFRICA SNACK PELLETS MARKET, BY FORM, 2020-2029 (USD MILLION)
TABLE 628 SOUTH AFRICA SNACK PELLETS MARKET, BY SHAPE, 2020-2029 (USD MILLION)
TABLE 629 SOUTH AFRICA SNACK PELLETS MARKET, BY INGREDIENTS, 2020-2029 (USD MILLION)
TABLE 630 SOUTH AFRICA SNACK PELLETS MARKET, BY PROCESSING METHOD, 2020-2029 (USD MILLION)
TABLE 631 SOUTH AFRICA NON-GREASY SNACK PELLET IN SNACK PELLETS MARKET, BY PROCESSING METHOD, 2020-2029 (USD MILLION)
TABLE 632 SOUTH AFRICA SNACK PELLETS MARKET, BY NATURE, 2020-2029 (USD MILLION)
TABLE 633 SOUTH AFRICA SNACK PELLETS MARKET, BY TECHNIQUE, 2020-2029 (USD MILLION)
TABLE 634 SOUTH AFRICA SNACK PELLETS MARKET, BY BRAND, 2020-2029 (USD MILLION)
TABLE 635 SOUTH AFRICA SNACK PELLETS MARKET, BY FLAVOR, 2020-2029 (USD MILLION)
TABLE 636 SOUTH AFRICA FLAVOR IN SNACK PELLETS MARKET, BY FLAVOR, 2020-2029 (USD MILLION)
TABLE 637 SOUTH AFRICA SNACK PELLETS MARKET, BY APPLICATION, 2020-2029 (USD MILLION)
TABLE 638 SOUTH AFRICA SNACK PELLETS MARKET, BY DISTRIBUTION CHANNEL, 2020-2029 (USD MILLION)
TABLE 639 SOUTH AFRICA INDIRECT IN SNACK PELLETS MARKET, BY DISTRIBUTION CHANNEL, 2020-2029 (USD MILLION)
TABLE 640 SOUTH AFRICA STORE-BASED RETAILING IN SNACK PELLETS MARKET, BY DISTRIBUTION CHANNEL, 2020-2029 (USD MILLION)
TABLE 641 SOUTH AFRICA NON-STORE-BASED RETAILING IN SNACK PELLETS MARKET, BY DISTRIBUTION CHANNEL, 2020-2029 (USD MILLION)
TABLE 642 UAE SNACK PELLETS MARKET, BY TYPE, 2020-2029 (USD MILLION)
TABLE 643 UAE SNACK PELLETS MARKET, BY FORM, 2020-2029 (USD MILLION)
TABLE 644 UAE SNACK PELLETS MARKET, BY SHAPE, 2020-2029 (USD MILLION)
TABLE 645 UAE SNACK PELLETS MARKET, BY INGREDIENTS, 2020-2029 (USD MILLION)
TABLE 646 UAE SNACK PELLETS MARKET, BY PROCESSING METHOD, 2020-2029 (USD MILLION)
TABLE 647 UAE NON-GREASY SNACK PELLET IN SNACK PELLETS MARKET, BY PROCESSING METHOD, 2020-2029 (USD MILLION)
TABLE 648 UAE SNACK PELLETS MARKET, BY NATURE, 2020-2029 (USD MILLION)
TABLE 649 UAE SNACK PELLETS MARKET, BY TECHNIQUE, 2020-2029 (USD MILLION)
TABLE 650 UAE SNACK PELLETS MARKET, BY BRAND, 2020-2029 (USD MILLION)
TABLE 651 UAE SNACK PELLETS MARKET, BY FLAVOR, 2020-2029 (USD MILLION)
TABLE 652 UAE FLAVOR IN SNACK PELLETS MARKET, BY FLAVOR, 2020-2029 (USD MILLION)
TABLE 653 UAE SNACK PELLETS MARKET, BY APPLICATION, 2020-2029 (USD MILLION)
TABLE 654 UAE SNACK PELLETS MARKET, BY DISTRIBUTION CHANNEL, 2020-2029 (USD MILLION)
TABLE 655 UAE INDIRECT IN SNACK PELLETS MARKET, BY DISTRIBUTION CHANNEL, 2020-2029 (USD MILLION)
TABLE 656 UAE STORE-BASED RETAILING IN SNACK PELLETS MARKET, BY DISTRIBUTION CHANNEL, 2020-2029 (USD MILLION)
TABLE 657 UAE NON-STORE-BASED RETAILING IN SNACK PELLETS MARKET, BY DISTRIBUTION CHANNEL, 2020-2029 (USD MILLION)
TABLE 658 SAUDI ARABIA SNACK PELLETS MARKET, BY TYPE, 2020-2029 (USD MILLION)
TABLE 659 SAUDI ARABIA SNACK PELLETS MARKET, BY FORM, 2020-2029 (USD MILLION)
TABLE 660 SAUDI ARABIA SNACK PELLETS MARKET, BY SHAPE, 2020-2029 (USD MILLION)
TABLE 661 SAUDI ARABIA SNACK PELLETS MARKET, BY INGREDIENTS, 2020-2029 (USD MILLION)
TABLE 662 SAUDI ARABIA SNACK PELLETS MARKET, BY PROCESSING METHOD, 2020-2029 (USD MILLION)
TABLE 663 SAUDI ARABIA NON-GREASY SNACK PELLET IN SNACK PELLETS MARKET, BY PROCESSING METHOD, 2020-2029 (USD MILLION)
TABLE 664 SAUDI ARABIA SNACK PELLETS MARKET, BY NATURE, 2020-2029 (USD MILLION)
TABLE 665 SAUDI ARABIA SNACK PELLETS MARKET, BY TECHNIQUE, 2020-2029 (USD MILLION)
TABLE 666 SAUDI ARABIA SNACK PELLETS MARKET, BY BRAND, 2020-2029 (USD MILLION)
TABLE 667 SAUDI ARABIA SNACK PELLETS MARKET, BY FLAVOR, 2020-2029 (USD MILLION)
TABLE 668 SAUDI ARABIA FLAVOR IN SNACK PELLETS MARKET, BY FLAVOR, 2020-2029 (USD MILLION)
TABLE 669 SAUDI ARABIA SNACK PELLETS MARKET, BY APPLICATION, 2020-2029 (USD MILLION)
TABLE 670 SAUDI ARABIA SNACK PELLETS MARKET, BY DISTRIBUTION CHANNEL, 2020-2029 (USD MILLION)
TABLE 671 SAUDI ARABIA INDIRECT IN SNACK PELLETS MARKET, BY DISTRIBUTION CHANNEL, 2020-2029 (USD MILLION)
TABLE 672 SAUDI ARABIA STORE-BASED RETAILING IN SNACK PELLETS MARKET, BY DISTRIBUTION CHANNEL, 2020-2029 (USD MILLION)
TABLE 673 SAUDI ARABIA NON-STORE-BASED RETAILING IN SNACK PELLETS MARKET, BY DISTRIBUTION CHANNEL, 2020-2029 (USD MILLION)
TABLE 674 QATAR SNACK PELLETS MARKET, BY TYPE, 2020-2029 (USD MILLION)
TABLE 675 QATAR SNACK PELLETS MARKET, BY FORM, 2020-2029 (USD MILLION)
TABLE 676 QATAR SNACK PELLETS MARKET, BY SHAPE, 2020-2029 (USD MILLION)
TABLE 677 QATAR SNACK PELLETS MARKET, BY INGREDIENTS, 2020-2029 (USD MILLION)
TABLE 678 QATAR SNACK PELLETS MARKET, BY PROCESSING METHOD, 2020-2029 (USD MILLION)
TABLE 679 QATAR NON-GREASY SNACK PELLET IN SNACK PELLETS MARKET, BY PROCESSING METHOD, 2020-2029 (USD MILLION)
TABLE 680 QATAR SNACK PELLETS MARKET, BY NATURE, 2020-2029 (USD MILLION)
TABLE 681 QATAR SNACK PELLETS MARKET, BY TECHNIQUE, 2020-2029 (USD MILLION)
TABLE 682 QATAR SNACK PELLETS MARKET, BY BRAND, 2020-2029 (USD MILLION)
TABLE 683 QATAR SNACK PELLETS MARKET, BY FLAVOR, 2020-2029 (USD MILLION)
TABLE 684 QATAR FLAVOR IN SNACK PELLETS MARKET, BY FLAVOR, 2020-2029 (USD MILLION)
TABLE 685 QATAR SNACK PELLETS MARKET, BY APPLICATION, 2020-2029 (USD MILLION)
TABLE 686 QATAR SNACK PELLETS MARKET, BY DISTRIBUTION CHANNEL, 2020-2029 (USD MILLION)
TABLE 687 QATAR INDIRECT IN SNACK PELLETS MARKET, BY DISTRIBUTION CHANNEL, 2020-2029 (USD MILLION)
TABLE 688 QATAR STORE-BASED RETAILING IN SNACK PELLETS MARKET, BY DISTRIBUTION CHANNEL, 2020-2029 (USD MILLION)
TABLE 689 QATAR NON-STORE-BASED RETAILING IN SNACK PELLETS MARKET, BY DISTRIBUTION CHANNEL, 2020-2029 (USD MILLION)
TABLE 690 OMAN SNACK PELLETS MARKET, BY TYPE, 2020-2029 (USD MILLION)
TABLE 691 OMAN SNACK PELLETS MARKET, BY FORM, 2020-2029 (USD MILLION)
TABLE 692 OMAN SNACK PELLETS MARKET, BY SHAPE, 2020-2029 (USD MILLION)
TABLE 693 OMAN SNACK PELLETS MARKET, BY INGREDIENTS, 2020-2029 (USD MILLION)
TABLE 694 OMAN SNACK PELLETS MARKET, BY PROCESSING METHOD, 2020-2029 (USD MILLION)
TABLE 695 OMAN NON-GREASY SNACK PELLET IN SNACK PELLETS MARKET, BY PROCESSING METHOD, 2020-2029 (USD MILLION)
TABLE 696 OMAN SNACK PELLETS MARKET, BY NATURE, 2020-2029 (USD MILLION)
TABLE 697 OMAN SNACK PELLETS MARKET, BY TECHNIQUE, 2020-2029 (USD MILLION)
TABLE 698 OMAN SNACK PELLETS MARKET, BY BRAND, 2020-2029 (USD MILLION)
TABLE 699 OMAN SNACK PELLETS MARKET, BY FLAVOR, 2020-2029 (USD MILLION)
TABLE 700 OMAN FLAVOR IN SNACK PELLETS MARKET, BY FLAVOR, 2020-2029 (USD MILLION)
TABLE 701 OMAN SNACK PELLETS MARKET, BY APPLICATION, 2020-2029 (USD MILLION)
TABLE 702 OMAN SNACK PELLETS MARKET, BY DISTRIBUTION CHANNEL, 2020-2029 (USD MILLION)
TABLE 703 OMAN INDIRECT IN SNACK PELLETS MARKET, BY DISTRIBUTION CHANNEL, 2020-2029 (USD MILLION)
TABLE 704 OMAN STORE-BASED RETAILING IN SNACK PELLETS MARKET, BY DISTRIBUTION CHANNEL, 2020-2029 (USD MILLION)
TABLE 705 OMAN NON-STORE-BASED RETAILING IN SNACK PELLETS MARKET, BY DISTRIBUTION CHANNEL, 2020-2029 (USD MILLION)
TABLE 706 KUWAIT SNACK PELLETS MARKET, BY TYPE, 2020-2029 (USD MILLION)
TABLE 707 KUWAIT SNACK PELLETS MARKET, BY FORM, 2020-2029 (USD MILLION)
TABLE 708 KUWAIT SNACK PELLETS MARKET, BY SHAPE, 2020-2029 (USD MILLION)
TABLE 709 KUWAIT SNACK PELLETS MARKET, BY INGREDIENTS, 2020-2029 (USD MILLION)
TABLE 710 KUWAIT SNACK PELLETS MARKET, BY PROCESSING METHOD, 2020-2029 (USD MILLION)
TABLE 711 KUWAIT NON-GREASY SNACK PELLET IN SNACK PELLETS MARKET, BY PROCESSING METHOD, 2020-2029 (USD MILLION)
TABLE 712 KUWAIT SNACK PELLETS MARKET, BY NATURE, 2020-2029 (USD MILLION)
TABLE 713 KUWAIT SNACK PELLETS MARKET, BY TECHNIQUE, 2020-2029 (USD MILLION)
TABLE 714 KUWAIT SNACK PELLETS MARKET, BY BRAND, 2020-2029 (USD MILLION)
TABLE 715 KUWAIT SNACK PELLETS MARKET, BY FLAVOR, 2020-2029 (USD MILLION)
TABLE 716 KUWAIT FLAVOR IN SNACK PELLETS MARKET, BY FLAVOR, 2020-2029 (USD MILLION)
TABLE 717 KUWAIT SNACK PELLETS MARKET, BY APPLICATION, 2020-2029 (USD MILLION)
TABLE 718 KUWAIT SNACK PELLETS MARKET, BY DISTRIBUTION CHANNEL, 2020-2029 (USD MILLION)
TABLE 719 KUWAIT INDIRECT IN SNACK PELLETS MARKET, BY DISTRIBUTION CHANNEL, 2020-2029 (USD MILLION)
TABLE 720 KUWAIT STORE-BASED RETAILING IN SNACK PELLETS MARKET, BY DISTRIBUTION CHANNEL, 2020-2029 (USD MILLION)
TABLE 721 KUWAIT NON-STORE-BASED RETAILING IN SNACK PELLETS MARKET, BY DISTRIBUTION CHANNEL, 2020-2029 (USD MILLION)
TABLE 722 REST OF MIDDLE EAST & AFRICA SNACK PELLETS MARKET, BY TYPE, 2020-2029 (USD MILLION)
Lista de figuras
FIGURE 1 GLOBAL SNACK PELLETS MARKET: SEGMENTATION
FIGURE 2 GLOBAL SNACK PELLETS MARKET: DATA TRIANGULATION
FIGURE 3 GLOBAL SNACK PELLETS MARKET: DROC ANALYSIS
FIGURE 4 GLOBAL SNACK PELLETS MARKET: REGIONAL VS COUNTRY MARKET ANALYSIS
FIGURE 5 GLOBAL SNACK PELLETS MARKET: COMPANY RESEARCH ANALYSIS
FIGURE 6 GLOBAL SNACK PELLETS MARKET: INTERVIEW DEMOGRAPHICS
FIGURE 7 GLOBAL SNACK PELLETS MARKET: DBMR MARKET POSITION GRID
FIGURE 8 GLOBAL SNACK PELLETS MARKET: MARKET END-USER COVERAGE GRID
FIGURE 9 GLOBAL SNACK PELLETS MARKET: VENDOR SHARE ANALYSIS
FIGURE 10 GLOBAL SNACK PELLETS MARKET: SEGMENTATION
FIGURE 11 NORTH AMERICA IS EXPECTED TO DOMINATE THE FIGURE GLOBAL SNACK PELLETS MARKET AND IS GROWING WITH THE HIGHEST CAGR IN THE FORECAST PERIOD OF 2022 TO 2029
FIGURE 12 INCREASE IN DEMAND FOR SAVORY SNACKS IS DRIVING THE GLOBAL SNACK PELLETS MARKET IN THE FORECAST PERIOD.
FIGURE 13 TYPE SEGMENT IS EXPECTED TO ACCOUNT FOR THE LARGEST SHARE OF THE GLOBAL SNACK PELLETS MARKET IN 2022 & 2029
FIGURE 14 NORTH AMERICA IS THE FASTEST GROWING MARKET FOR FOOD DIAGNOSTICS MANUFACTURERS IN THE FORECAST PERIOD OF 2022 TO 2029
FIGURE 15 GLOBAL SNACK PELLETS MARKET: FACTORS AFFECTING NEW PRODUCT LAUNCHES STRATEGY
FIGURE 16 SUPPLY CHAIN ANALYSIS OF GLOBAL SNACK PELLETS MARKET
FIGURE 17 VALUE CHAIN ANALYSIS OF GLOBAL SNACK PELLETS MARKET
FIGURE 18 DRIVERS, RESTRAINTS, OPPORTUNITIES, AND CHALLENGES OF SNACK PELLETS MARKET
FIGURE 19 GLOBAL SNACK PELLETS MARKET: BY TYPE, 2021
FIGURE 20 GLOBAL SNACK PELLETS MARKET, BY FORM, 2021
FIGURE 21 GLOBAL SNACK PELLETS MARKET, BY BRAND, 2021
FIGURE 22 GLOBAL SNACK PELLETS MARKET, BY APPLICATION, 2021
FIGURE 23 GLOBAL SNACK PELLETS MARKET: BY PROCESSING METHOD, 2021
FIGURE 24 GLOBAL SNACK PELLETS MARKET: BY NATURE, 2021
FIGURE 25 GLOBAL SNACK PELLETS MARKET: BY FLAVOR, 2021
FIGURE 26 GLOBAL SNACK PELLETS MARKET: BY DISTRIBUTION CHANNEL, 2021
FIGURE 27 GLOBAL SNACK PELLETS MARKET: BY TECHNIQUE, 2021
FIGURE 28 GLOBAL SNACK PELLETS MARKET: BY SHAPE, 2021
FIGURE 29 GLOBAL SNACK PELLETS MARKET: BY INGREDIENTS, 2021
FIGURE 30 GLOBAL SNACK PELLETS MARKET: SNAPSHOT (2021)
FIGURE 31 GLOBAL SNACK PELLETS MARKET: BY REGION (2021)
FIGURE 32 GLOBAL SNACK PELLETS MARKET: BY REGION (2022 & 2029)
FIGURE 33 GLOBAL SNACK PELLETS MARKET: BY REGION (2021 & 2029)
FIGURE 34 GLOBAL SNACK PELLETS MARKET: BY TYPE (2022-2029)
FIGURE 35 NORTH AMERICA SNACK PELLETS MARKET: SNAPSHOT (2021)
FIGURE 36 NORTH AMERICA SNACK PELLETS MARKET: BY COUNTRY (2021)
FIGURE 37 NORTH AMERICA SNACK PELLETS MARKET: BY COUNTRY (2022 & 2029)
FIGURE 38 NORTH AMERICA SNACK PELLETS MARKET: BY COUNTRY (2021 & 2029)
FIGURE 39 NORTH AMERICA SNACK PELLETS MARKET: BY TYPE (2022 & 2029)
FIGURE 40 EUROPE SNACK PELLETS MARKET: SNAPSHOT (2021)
FIGURE 41 EUROPE SNACK PELLETS MARKET: BY COUNTRY (2021)
FIGURE 42 EUROPE SNACK PELLETS MARKET: BY COUNTRY (2022 & 2029)
FIGURE 43 EUROPE SNACK PELLETS MARKET: BY COUNTRY (2021 & 2029)
FIGURE 44 EUROPE SNACK PELLETS MARKET: BY TYPE (2022 & 2029)
FIGURE 45 ASIA-PACIFIC SNACK PELLETS MARKET: SNAPSHOT (2021)
FIGURE 46 ASIA-PACIFIC SNACK PELLETS MARKET: BY COUNTRY (2021)
FIGURE 47 ASIA-PACIFIC SNACK PELLETS MARKET: BY COUNTRY (2022 & 2029)
FIGURE 48 ASIA-PACIFIC SNACK PELLETS MARKET: BY COUNTRY (2021 & 2029)
FIGURE 49 ASIA-PACIFIC SNACK PELLETS MARKET: BY TYPE (2022 & 2029)
FIGURE 50 SOUTH AMERICA SNACK PELLETS MARKET: SNAPSHOT (2021)
FIGURE 51 SOUTH AMERICA SNACK PELLETS MARKET: BY COUNTRY (2021)
FIGURE 52 SOUTH AMERICA SNACK PELLETS MARKET: BY COUNTRY (2022 & 2029)
FIGURE 53 SOUTH AMERICA SNACK PELLETS MARKET: BY COUNTRY (2021 & 2029)
FIGURE 54 SOUTH AMERICA SNACK PELLETS MARKET: BY TYPE (2022 & 2029)
FIGURE 55 MIDDLE EAST & AFRICA SNACK PELLETS MARKET: SNAPSHOT (2021)
FIGURE 56 MIDDLE EAST & AFRICA SNACK PELLETS MARKET: BY COUNTRY (2021)
FIGURE 57 MIDDLE EAST & AFRICA SNACK PELLETS MARKET: BY COUNTRY (2022 & 2029)
FIGURE 58 MIDDLE EAST & AFRICA SNACK PELLETS MARKET: BY COUNTRY (2021 & 2029)
FIGURE 59 MIDDLE EAST & AFRICA SNACK PELLETS MARKET: BY TYPE (2022 & 2029)
FIGURE 60 GLOBAL SNACK PELLETS MARKET: COMPANY SHARE 2021 (%)
FIGURE 61 NORTH AMERICA SNACK PELLETS MARKET: COMPANY SHARE 2021 (%)
FIGURE 62 EUROPE SNACK PELLETS MARKET: COMPANY SHARE 2021 (%)
FIGURE 63 ASIA-PACIFIC SNACK PELLET MARKET: COMPANY SHARE 2021 (%)
Metodología de investigación
La recopilación de datos y el análisis del año base se realizan utilizando módulos de recopilación de datos con muestras de gran tamaño. La etapa incluye la obtención de información de mercado o datos relacionados a través de varias fuentes y estrategias. Incluye el examen y la planificación de todos los datos adquiridos del pasado con antelación. Asimismo, abarca el examen de las inconsistencias de información observadas en diferentes fuentes de información. Los datos de mercado se analizan y estiman utilizando modelos estadísticos y coherentes de mercado. Además, el análisis de la participación de mercado y el análisis de tendencias clave son los principales factores de éxito en el informe de mercado. Para obtener más información, solicite una llamada de un analista o envíe su consulta.
La metodología de investigación clave utilizada por el equipo de investigación de DBMR es la triangulación de datos, que implica la extracción de datos, el análisis del impacto de las variables de datos en el mercado y la validación primaria (experto en la industria). Los modelos de datos incluyen cuadrícula de posicionamiento de proveedores, análisis de línea de tiempo de mercado, descripción general y guía del mercado, cuadrícula de posicionamiento de la empresa, análisis de patentes, análisis de precios, análisis de participación de mercado de la empresa, estándares de medición, análisis global versus regional y de participación de proveedores. Para obtener más información sobre la metodología de investigación, envíe una consulta para hablar con nuestros expertos de la industria.
Personalización disponible
Data Bridge Market Research es líder en investigación formativa avanzada. Nos enorgullecemos de brindar servicios a nuestros clientes existentes y nuevos con datos y análisis que coinciden y se adaptan a sus objetivos. El informe se puede personalizar para incluir análisis de tendencias de precios de marcas objetivo, comprensión del mercado de países adicionales (solicite la lista de países), datos de resultados de ensayos clínicos, revisión de literatura, análisis de mercado renovado y base de productos. El análisis de mercado de competidores objetivo se puede analizar desde análisis basados en tecnología hasta estrategias de cartera de mercado. Podemos agregar tantos competidores sobre los que necesite datos en el formato y estilo de datos que esté buscando. Nuestro equipo de analistas también puede proporcionarle datos en archivos de Excel sin procesar, tablas dinámicas (libro de datos) o puede ayudarlo a crear presentaciones a partir de los conjuntos de datos disponibles en el informe.

