
Mercado mundial de semiconductores de potencia de SiC, por tipo (MOSFETS, módulos híbridos, diodos de barrera Schottky (SBDS), IGBT, transistor de unión bipolar (BJT), diodo pin, FET de unión (JFET) y otros), rango de voltaje (301-900 V, 901-1700 V, por encima de 1701 V), tamaño de oblea (6 pulgadas, 4 pulgadas, 2 pulgadas, por encima de 6 pulgadas), tipo de oblea (obleas epitaxiales de SiC, obleas de SiC en blanco), aplicación ( vehículos eléctricos (VE), fotovoltaica, fuentes de alimentación, variadores de motor industriales, infraestructura de carga de EV, dispositivos de RF y otros), vertical (automotriz, servicios públicos y energía, industrial, transporte, TI y telecomunicaciones, electrónica de consumo, aeroespacial y defensa, comercial y otros) Tendencias de la industria y pronóstico hasta 2030.
Análisis y tamaño del mercado de semiconductores de potencia de SiC
Los semiconductores de potencia de SiC son los semiconductores más comunes y se consideran la mejor opción para la electrónica. Estos semiconductores de potencia de SiC se aplican en los sectores doméstico, comercial e industrial y en otras áreas. Los semiconductores de potencia de SiC están disponibles en dos tipos de dispositivos, como dispositivos discretos de SiC y chips de SiC. Debido a los avances tecnológicos, la prevalencia de los dispositivos discretos de SiC ha aumentado más rápido. La propiedad más importante de los semiconductores de potencia de SiC es su alta conductividad térmica, junto con otras que utilizan la electricidad de manera eficiente. Los semiconductores de potencia de SiC se utilizan en telecomunicaciones, energía y electricidad, generación de energía renovable y en varios otros lugares. Los semiconductores de potencia de SiC se utilizan en la electrónica de potencia y están ganando popularidad entre las personas. La demanda de semiconductores de potencia de SiC en el mercado mundial de semiconductores de potencia de SiC está aumentando a un ritmo mayor. Para ello, varios actores del mercado están introduciendo nuevos productos y formando asociaciones para expandir su negocio en el mercado mundial de semiconductores de potencia de SiC.
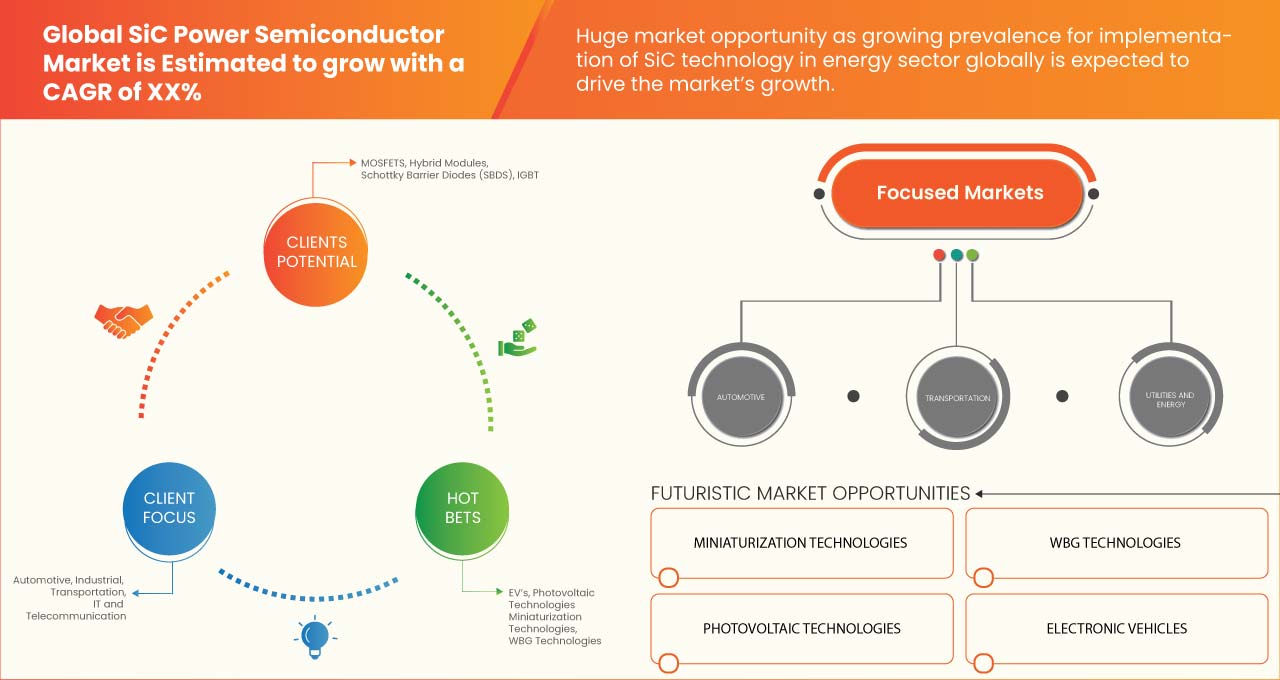
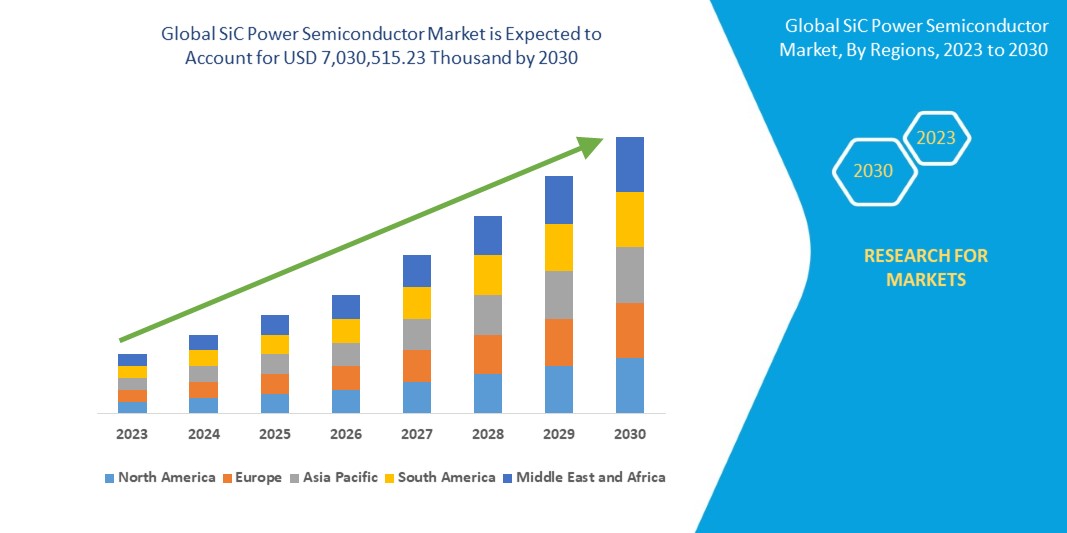
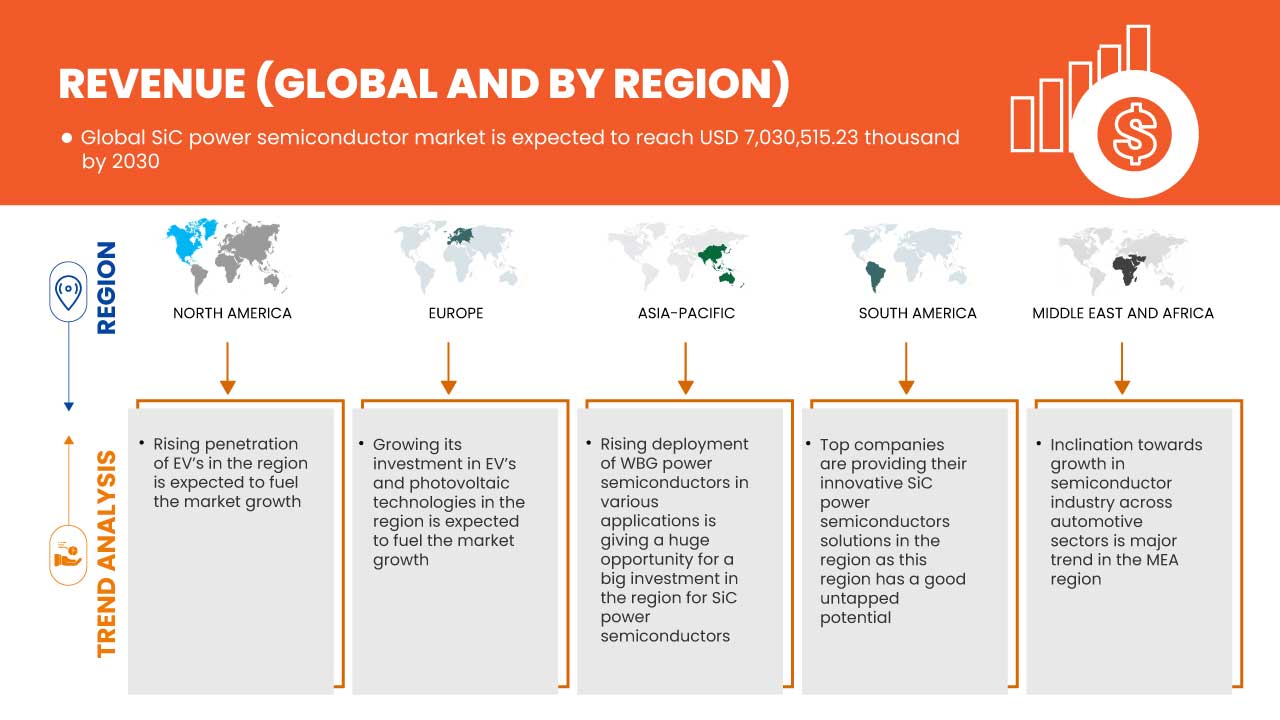
Data Bridge Market Research analiza que se espera que el mercado global de semiconductores de potencia de SiC alcance un valor de USD 7.030.515,23 mil para 2030, con una CAGR del 26,0 % durante el período de pronóstico. El informe del mercado global de semiconductores de potencia de SiC también cubre de manera integral el análisis de precios, el análisis de patentes y los avances tecnológicos.
|
Métrica del informe |
Detalles |
|
Período de pronóstico |
2023 a 2030 |
|
Año base |
2022 |
|
Años históricos |
2021 (Personalizable para 2020-2016) |
|
Unidades cuantitativas |
Ingresos en miles de USD, volúmenes en unidades, precios en USD |
|
Segmentos cubiertos |
Por tipo (MOSFETS, módulos híbridos, diodos de barrera Schottky (SBDS), IGBT, transistor de unión bipolar (BJT), diodo pin, FET de unión (JFET) y otros), rango de voltaje (301-900 V, 901-1700 V, más de 1701 V), tamaño de oblea (6 pulgadas, 4 pulgadas, 2 pulgadas, más de 6 pulgadas), tipo de oblea (obleas epitaxiales de SiC, obleas de SiC en blanco), aplicación (vehículos eléctricos (VE), fotovoltaica , fuentes de alimentación, variadores de motor industriales, infraestructura de carga de EV, dispositivos de RF y otros), vertical (automotriz, servicios públicos y energía, industrial, transporte, TI y telecomunicaciones, electrónica de consumo , aeroespacial y defensa, comercial y otros). |
|
Regiones cubiertas |
EE. UU., Canadá, México, Alemania, Reino Unido, Italia, Francia, España, Suiza, Países Bajos, Bélgica, Rusia, Turquía, Polonia, Suecia, Dinamarca, resto de Europa, Japón, China, Corea del Sur, India, Australia y Nueva Zelanda, Hong Kong, Taiwán, Singapur, Tailandia, Indonesia, Malasia, Filipinas, Vietnam y resto de Asia-Pacífico, Sudáfrica, Emiratos Árabes Unidos, Israel, Egipto, Qatar, Arabia Saudita, Kuwait, resto de Medio Oriente y África, Brasil, Argentina y resto de Sudamérica. |
|
Actores del mercado cubiertos |
Entre otros se encuentran: Wolfspeed, Inc., STMicroelectronics, ROHM CO., LTD., Fuji Electric Co., Ltd., Mitsubishi Electric Corporation, Texas Instruments Incorporated, Infineon Technologies AG, Semikron Danfoss, Xiamen Powerway Advanced Material Co., Ltd., Renesas Electronics Corporation, TOSHIBA ELECTRONIC DEVICES & STORAGE CORPORATION, Microchip Technology Inc., Semiconductor Components Industries, LLC, NXP Semiconductors, UnitedSiC, SemiQ Inc., Littlefuse, Inc., Allegro MicroSystems, Inc., Hitachi Power Semiconductor Device, Ltd. (una subsidiaria de Hitachi Group) y GeneSiC Semiconductor Inc. |
Definición de mercado
El término semiconductor de potencia de SiC se refiere al tipo de semiconductor que contiene carbono y silicio y opera a voltajes y temperaturas muy altos. Los semiconductores de potencia de SiC se pueden utilizar para producir un material fuerte y muy duro. Los semiconductores de potencia de SiC se pueden implementar en varios sectores, como telecomunicaciones, energía y electricidad, automoción, generación de energía renovable y en diferentes áreas más. Básicamente, se los considera debido a sus propiedades de conducción térmica máxima más altas que han ampliado el área de aplicación. Los semiconductores de potencia de SiC son dispositivos que se consideran dispositivos de potencia de alta frecuencia que se aplican principalmente en comunicaciones inalámbricas. El semiconductor de SiC ofrece diez veces la intensidad del campo de ruptura dieléctrica, tres veces la conductividad térmica y tres veces la banda prohibida en comparación con un semiconductor de silicio. El semiconductor de SiC se ha apoderado del mercado debido a su alto rendimiento y eficiencia. El semiconductor de potencia de SiC ofrece trabajar a alto voltaje y corriente y ofrece baja resistencia de encendido además de ser eficiente a altas temperaturas. Por lo tanto, la combinación de carburo de silicio ha demostrado ser una mejor y óptima opción de semiconductor.
Dinámica del mercado mundial de semiconductores de potencia de SiC
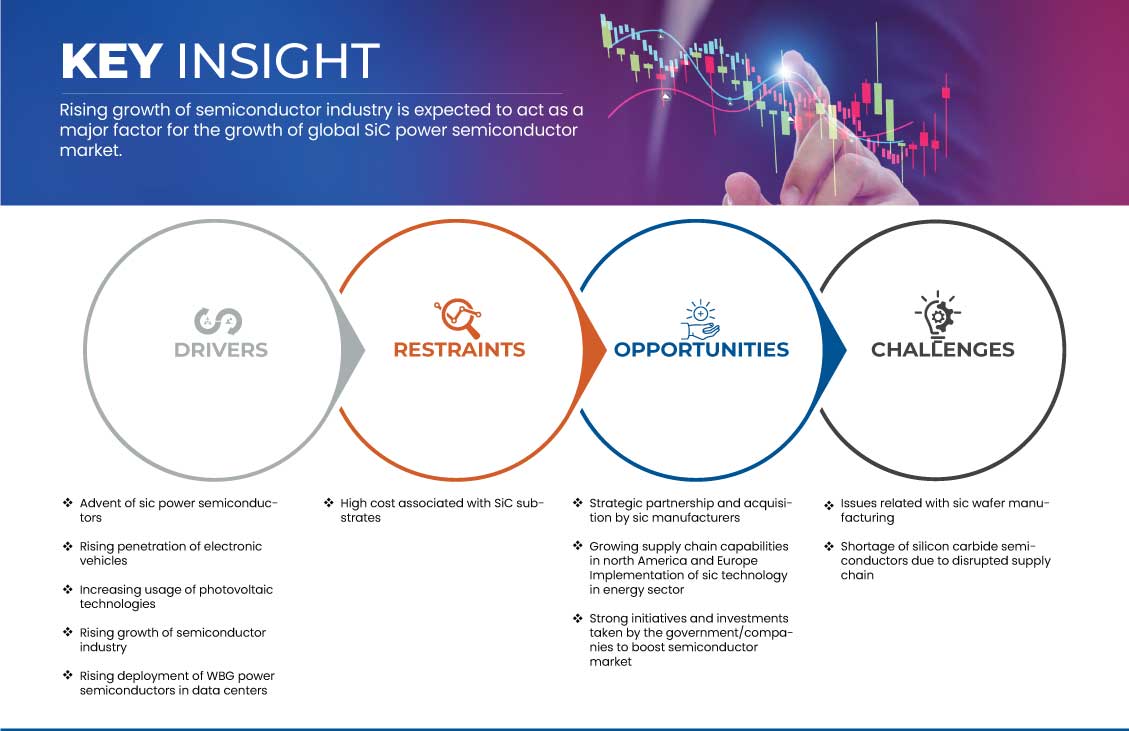
En esta sección se aborda la comprensión de los factores impulsores, las ventajas, las oportunidades, las limitaciones y los desafíos del mercado. Todo esto se analiza en detalle a continuación:
Conductores
- La llegada de los semiconductores de potencia de SiC
El SiC tiene propiedades muy útiles como material semiconductor. En aplicaciones como inversores, controladores de motores y cargadores de baterías, los dispositivos de carburo de silicio (SiC) ofrecen muchas ventajas, como una densidad de potencia mejorada, menores requisitos de refrigeración y un menor coste general del sistema. Estas ventajas son suficientes para que los semiconductores de potencia de SiC alcancen una alta eficiencia.
La energía que pierde el SiC durante la fase de recuperación inversa es solo el 1% de la energía que pierde el silicio, lo que crea una enorme diferencia en la eficiencia del material. La ausencia virtual de una corriente de cola permite un apagado más rápido y genera menores pérdidas. Dado que hay menos energía para disipar, un dispositivo de SiC puede conmutar a frecuencias más altas y mejorar la eficiencia. El tamaño más pequeño, más eficiente y el menor peso del SiC en comparación con otros materiales pueden crear una solución de mayor calificación o un diseño más pequeño con requisitos de enfriamiento reducidos. Por lo tanto, la llegada de los semiconductores de potencia de SiC es un factor importante que se espera que impulse el crecimiento del mercado global de semiconductores de potencia de SiC.
- Creciente penetración de los vehículos electrónicos
El mundo está cambiando muy rápido y se está orientando hacia las energías renovables. Todos los sectores, los actores del mercado y las instituciones gubernamentales están poniendo más atención en construir infraestructura para vehículos eléctricos y generar más demanda de estos vehículos.
Según la información de la Agencia Internacional de la Energía (AIE), en 2021 había 16,5 millones de coches eléctricos en circulación, el triple en solo tres años, y se trata de una cifra importante en comparación con 2020. Las ventas de coches eléctricos aumentaron y se duplicaron en China, siguieron aumentando en Europa y repuntaron en Estados Unidos en 2021. Estos datos muestran que hay un tremendo aumento en la penetración de los vehículos eléctricos en el mercado, lo que puede afectar positivamente al medio ambiente, así como al mercado mundial de semiconductores de potencia de SiC. El SiC es muy eficiente a altos voltajes, lo que permite tiempos de carga de batería rápidos que son comparables a llenar el tanque de los vehículos convencionales. La electrónica de potencia de carburo de silicio está permitiendo un aumento en los sistemas de propulsión de 800 voltios, allanando el camino para vehículos eléctricos más ligeros con mayor autonomía.
Oportunidad
- Asociación estratégica y adquisición por parte de fabricantes de SiC
Existen varias organizaciones y actores del mercado que están creando alianzas y adquisiciones estratégicas. Esta alianza genera un enorme impacto positivo en el crecimiento del mercado global de semiconductores de potencia de SiC. Esta colaboración da como resultado una cooperación, convirtiéndose en una ruta de bajo costo para que nuevos competidores obtengan tecnología y acceso al mercado.
Una empresa conjunta implica que dos o más empresas aúnen sus recursos y conocimientos para lograr un objetivo en particular. Hay muchas organizaciones que colaboran entre sí y generan un impacto positivo en el crecimiento del mercado mundial de semiconductores de potencia de SiC.
Restricción/Desafío
- Problemas relacionados con la fabricación de obleas de SiC
Una oblea de SiC es un material semiconductor que tiene excelentes propiedades eléctricas y térmicas. Es un semiconductor de alto rendimiento que es ideal para una amplia variedad de aplicaciones. Además de su alta resistencia térmica, también presenta un nivel muy alto de dureza. Los fabricantes de obleas de SiC se enfrentan a muchos desafíos de fabricación. Los principales defectos que pueden ocurrir durante la fabricación de sustratos de SiC son fallas de apilamiento cristalino, microtubos, picaduras, rasguños, manchas y partículas superficiales. Estos factores están afectando negativamente el rendimiento de los dispositivos de SiC, que se han detectado con mayor frecuencia en obleas de 150 mm que en obleas de 100 mm. Esto se debe a que el SiC es el tercer material compuesto más duro del mundo y también es muy frágil, y su producción plantea desafíos complejos relacionados con el tiempo de ciclo, el costo y el rendimiento de corte. Es efectivo predecir que incluso el cambio a obleas de 200 mm implicará problemas importantes. De hecho, será necesario garantizar la misma calidad del sustrato, enfrentando una densidad inevitablemente mayor de defectos.
Impacto posterior a la COVID-19 en el mercado mundial de semiconductores de potencia de SiC
La industria de semiconductores de potencia de SiC observó una disminución gradual de la demanda debido al confinamiento y las leyes gubernamentales de COVID-19, ya que las instalaciones de fabricación y los servicios estaban cerrados. Incluso el desarrollo privado y público se suspendió. Además, la industria también se vio afectada por la interrupción de la cadena de suministro, especialmente de las materias primas utilizadas en el proceso de fabricación de semiconductores de potencia de SiC. Las estrictas regulaciones gubernamentales para diferentes industrias y las restricciones al comercio y el transporte fueron algunos de los principales factores que hicieron mella en el crecimiento del mercado de semiconductores de potencia de SiC en todo el mundo en 2020 y en los dos primeros trimestres de 2021. A medida que la producción de semiconductores de potencia de SiC se desaceleró debido a las restricciones de los gobiernos de todo el mundo, la producción no satisfizo la demanda en los primeros tres trimestres de 2020. Además, se ha observado una alta demanda/requerimiento de productos semiconductores de potencia de SiC en la industria automotriz y de defensa, en el sector médico y en aplicaciones hidráulicas. La reanudación de la producción de la industria del petróleo y el gas y la automotriz; impulsó aún más la creciente demanda de semiconductores de potencia de SiC en todo el mundo. Esto no sólo provocó un aumento de la demanda sino que también aumentó el coste del producto.
Acontecimientos recientes
- En diciembre de 2022, STMicroelectronics y Soitec (Euronext Paris), en el diseño y fabricación de materiales semiconductores innovadores, anunciaron la siguiente etapa de su cooperación en sustratos de carburo de silicio (SiC), con la calificación de la tecnología de sustrato de SiC de Soitec por parte de ST prevista para los próximos 18 meses. El objetivo de esta cooperación es la adopción por parte de ST de la tecnología SmartSiC de Soitec para su futura fabricación de sustratos de 200 mm, alimentando su negocio de fabricación de dispositivos y módulos, con una producción en volumen prevista a medio plazo. Esta colaboración ayudará a la empresa a impulsar sus finanzas, así como el crecimiento del mercado mundial de semiconductores de potencia de SiC.
- En julio de 2022, Semikron Danfoss y la empresa ROHM Semiconductor, con sede en Kioto, llevan más de diez años colaborando en la implementación de carburo de silicio (SiC) en módulos de potencia. Recientemente, la última cuarta generación de MOSFET de SiC de ROHM ha sido totalmente homologada en los módulos eMPack de SEMIKRON para uso en automoción. Por tanto, ambas empresas atienden las necesidades de los clientes de todo el mundo. Esta colaboración mejoró las finanzas de la empresa y tuvo un impacto positivo en el crecimiento del mercado mundial de semiconductores de potencia de SiC.
Alcance del mercado mundial de semiconductores de potencia de SiC
El mercado global de semiconductores de potencia de SiC está segmentado en función del tipo, rango de voltaje, tamaño de oblea, tipo de oblea, aplicación y vertical. El crecimiento entre estos segmentos le ayudará a analizar segmentos de crecimiento reducido en las industrias y brindará a los usuarios una valiosa descripción general del mercado y conocimientos del mercado para ayudarlos a tomar decisiones estratégicas para identificar las principales aplicaciones del mercado.
Por tipo
- MOSFET
- Módulos híbridos
- Diodos de barrera Schottky (SBDS)
- Transistor bipolar de transistores (IGTB)
- Transistor de unión bipolar (BJT)
- Diodo pin
- Transistor de transistores de unión (JFET)
- Otros
Según el tipo, el mercado global de semiconductores de potencia de SiC está segmentado en MOSFETS, módulos híbridos, diodos de barrera Schottky (SBDS), IGBT, transistor de unión bipolar (BJT), diodo Pin, FET de unión (JFET) y otros.
Por rango de voltaje
- 301-900 voltios
- 901-1700 voltios
- Por encima de 1701 V
Sobre la base del rango de voltaje, el mercado global de semiconductores de potencia de SiC está segmentado en 301-900 V, 901-1700 V y más de 1701 V.
Por tamaño de oblea
- 6 pulgadas
- 4 pulgadas
- 2 pulgadas
- Más de 6 pulgadas
Sobre la base del tamaño de la oblea, el mercado global de semiconductores de potencia de SiC está segmentado en 6 pulgadas, 4 pulgadas, 2 pulgadas y más de 6 pulgadas.
Por tipo de oblea
- Obleas epitaxiales de SiC
- Obleas de SiC en blanco
Sobre la base del tipo de oblea, el mercado global de semiconductores de potencia de SiC está segmentado en obleas epitaxiales de SiC y obleas de SiC en blanco.
Por aplicación
- Vehículos eléctricos (VE)
- Fotovoltaica
- Fuentes de alimentación
- Accionamientos de motores industriales
- Infraestructura de carga de vehículos eléctricos
- Dispositivos de RF
- Otros
Sobre la base de la aplicación, el mercado global de semiconductores de potencia SIC está segmentado en vehículos eléctricos (VE), energía fotovoltaica, fuentes de alimentación, controladores de motores industriales, infraestructura de carga de VE, dispositivos de RF y otros.
Por vertical
- Automotor
- Servicios públicos y energía
- Industrial
- Transporte
- Informática y telecomunicaciones
- Electrónica de consumo
- Aeroespacial y defensa
- Comercial
- Otros
Sobre la base de la vertical, el mercado global de semiconductores de potencia de SiC está segmentado en automotriz, servicios públicos y energía, industrial, transporte, TI y telecomunicaciones, electrónica de consumo, aeroespacial y defensa, comercial y otros.

Análisis y perspectivas regionales del mercado mundial de semiconductores de potencia de SiC
Se analiza el mercado global de semiconductores de potencia SiC y se proporcionan información y tendencias del tamaño del mercado por región, tipo, rango de voltaje, tamaño de oblea, tipo de oblea, aplicación y vertical como se menciona anteriormente.
Los países cubiertos en el informe global del mercado de semiconductores de potencia de SiC son EE. UU., Canadá, México, Alemania, Reino Unido, Italia, Francia, España, Suiza, Países Bajos, Bélgica, Rusia, Turquía, Polonia, Suecia, Dinamarca, resto de Europa, Japón, China, Corea del Sur, India, Australia y Nueva Zelanda, Hong Kong, Taiwán, Singapur, Tailandia, Indonesia, Malasia, Filipinas, Vietnam y resto de Asia-Pacífico, Sudáfrica, Emiratos Árabes Unidos, Israel, Egipto, Qatar, Arabia Saudita, Kuwait, resto de Medio Oriente y África, Brasil, Argentina y resto de Sudamérica.
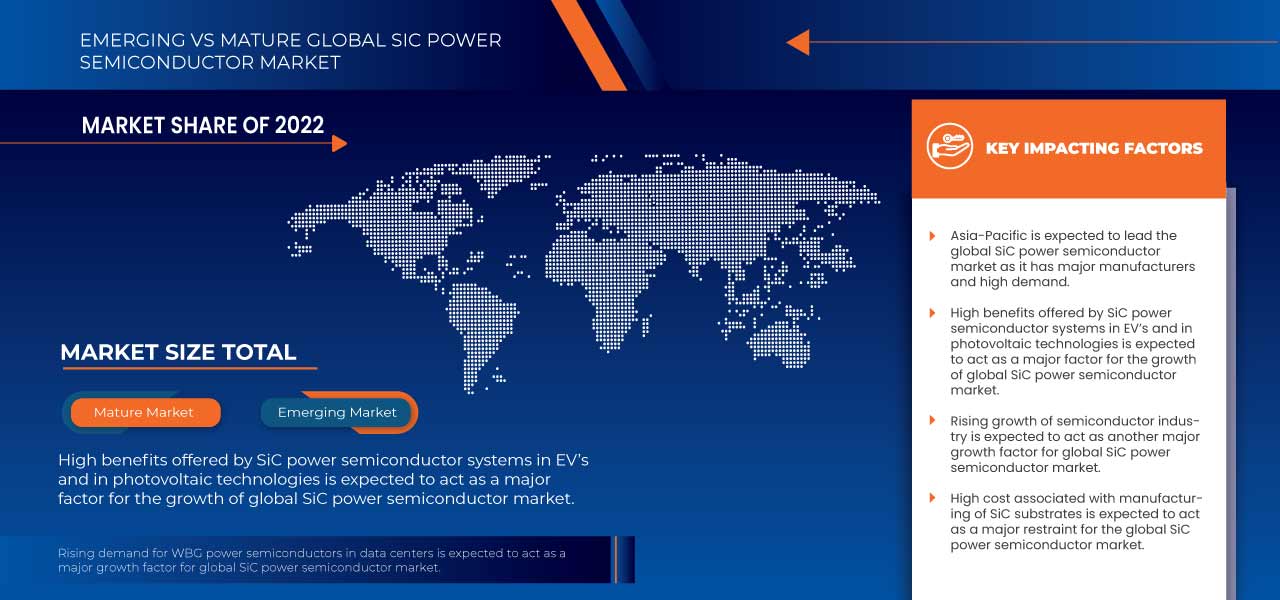
En 2023, se espera que la región de Asia y el Pacífico domine el mercado mundial de semiconductores de potencia de SiC debido a la alta demanda de semiconductores de potencia de SiC. Además, se espera que la alta demanda de módulos de potencia y dispositivos relacionados actúe como un factor impulsor del crecimiento del mercado.
La sección de regiones del informe también proporciona factores individuales que impactan en el mercado y cambios en la regulación del mercado que afectan las tendencias actuales y futuras del mercado. Los puntos de datos como el análisis de la cadena de valor ascendente y descendente, las tendencias técnicas y el análisis de las cinco fuerzas de Porter, los estudios de casos son algunos de los indicadores utilizados para pronosticar el escenario del mercado para países individuales. Además, la presencia y disponibilidad de marcas globales y sus desafíos enfrentados debido a la competencia grande o escasa de las marcas locales y nacionales, el impacto de los aranceles nacionales y las rutas comerciales se consideran al proporcionar un análisis de pronóstico de los datos de la región.
Análisis del panorama competitivo y de la cuota de mercado global de semiconductores de potencia de SiC
El panorama competitivo del mercado global de semiconductores de potencia de SiC proporciona detalles por competidor. Los detalles incluidos son una descripción general de la empresa, las finanzas de la empresa, los ingresos generados, el potencial de mercado, la inversión en investigación y desarrollo, las nuevas iniciativas de mercado, la presencia global, los sitios e instalaciones de producción, las capacidades de producción, las fortalezas y debilidades de la empresa, el lanzamiento de productos, la amplitud y variedad de productos y el dominio de las aplicaciones. Los puntos de datos anteriores proporcionados solo están relacionados con el enfoque de las empresas en relación con el mercado global de semiconductores de potencia de SiC.
Algunos de los principales actores que operan en el mercado global de semiconductores de potencia de SiC son WOLFSPEED, INC., STMicroelectronics, ROHM CO., LTD., Fuji Electric Co., Ltd., Mitsubishi Electric Corporation, Texas Instruments Incorporated, Infineon Technologies AG, Semikron Danfoss, Xiamen Powerway Advanced Material Co., Ltd., Renesas Electronics Corporation, TOSHIBA ELECTRONIC DEVICES & STORAGE CORPORATION, Microchip Technology Inc., Semiconductor Components Industries, LLC, NXP Semiconductors, UnitedSiC, SemiQ Inc., Littlefuse, Inc., Allegro MicroSystems, Inc., Hitachi Power Semiconductor Device, Ltd. (una subsidiaria de Hitachi Group) y GeneSiC Semiconductor Inc., entre otros.
SKU-
Obtenga acceso en línea al informe sobre la primera nube de inteligencia de mercado del mundo

- Panel de análisis de datos interactivo
- Panel de análisis de empresas para oportunidades con alto potencial de crecimiento
- Acceso de analista de investigación para personalización y consultas
- Análisis de la competencia con panel interactivo
- Últimas noticias, actualizaciones y análisis de tendencias
- Aproveche el poder del análisis de referencia para un seguimiento integral de la competencia
Tabla de contenido
1 INTRODUCTION
1.1 OBJECTIVES OF THE STUDY
1.2 MARKET DEFINITION
1.3 OVERVIEW OF THE GLOBAL SIC POWER SEMICONDUCTOR MARKET
1.4 CURRENCY AND PRICING
1.5 LIMITATIONS
1.6 MARKET COVERED
2 MARKET SEGMENTATION
2.1 MARKETS COVERED
2.2 YEARS CONSIDERED FOR THE STUDY
2.3 GEOGRAPHIC SCOPE
2.4 DBMR TRIPOD DATA VALIDATION MODEL
2.5 PRIMARY INTERVIEWS WITH KEY OPINION LEADERS
2.6 DBMR MARKET POSITION GRID
2.7 VENDOR SHARE ANALYSIS
2.8 MULTIVARIATE MODELLING
2.9 TYPE CURVE
2.1 MARKET APPLICATION COVERAGE GRID
2.11 SECONDARY SOURCES
2.12 ASSUMPTIONS
3 EXECUTIVE SUMMARY
4 PREMIUM INSIGHTS
5 MARKET OVERVIEW
5.1 DRIVERS
5.1.1 ADVENT OF SIC POWER SEMICONDUCTORS
5.1.2 RISING PENETRATION OF ELECTRONIC VEHICLES
5.1.3 INCREASING USAGE OF PHOTOVOLTAIC TECHNOLOGIES
5.1.4 RISING GROWTH OF SEMICONDUCTOR INDUSTRY
5.1.5 RISING DEPLOYMENT OF WBG POWER SEMICONDUCTORS IN DATA CENTERS
5.2 RESTRAINTS
5.2.1 HIGH COST ASSOCIATED WITH SIC SUBSTRATES
5.3 OPPORTUNITIES
5.3.1 STRATEGIC PARTNERSHIP AND ACQUISITION BY SIC MANUFACTURERS
5.3.2 GROWING SUPPLY CHAIN CAPABILITIES IN NORTH AMERICA AND EUROPE
5.3.3 IMPLEMENTATION OF SIC TECHNOLOGY IN THE ENERGY SECTOR
5.3.4 STRONG INITIATIVES AND INVESTMENTS TAKEN BY THE GOVERNMENT/COMPANIES TO BOOST SEMICONDUCTOR MARKET.
5.4 CHALLENGES
5.4.1 ISSUES RELATED WITH SIC WAFER MANUFACTURING
5.4.2 SHORTAGE OF SILICON CARBIDE SEMICONDUCTORS DUE TO DISRUPTED SUPPLY CHAIN
6 GLOBAL SIC POWER SEMICONDUCTOR MARKET, BY TYPE
6.1 OVERVIEW
6.2 MOSFETS
6.3 HYBRID MODULES
6.4 SCHOTTKY BARRIER DIODES (SBDS)
6.5 IGBT
6.6 BIPOLAR JUNCTION TRANSISTOR (BJT)
6.7 PIN DIODE
6.8 JUNCTION FET (JFET)
6.9 OTHERS
7 GLOBAL SIC POWER SEMICONDUCTOR MARKET, BY VOLTAGE RANGE
7.1 OVERVIEW
7.2 301-900 V
7.3 901-1700 V
7.4 ABOVE 1701 V
8 GLOBAL SIC POWER SEMICONDUCTOR MARKET, BY WAFER SIZE
8.1 OVERVIEW
8.2 6 INCH
8.3 4 INCH
8.4 2 INCH
8.5 ABOVE 6 INCH
9 GLOBAL SIC POWER SEMICONDUCTOR MARKET, BY WAFER TYPE
9.1 OVERVIEW
9.2 SIC EPITAXIAL WAFERS
9.3 BLANK SIC WAFERS
10 GLOBAL SIC POWER SEMICONDUCTOR MARKET, BY APPLICATION
10.1 OVERVIEW
10.2 ELECTRIC VEHICLES
10.3 PHOTOVOLTAICS
10.4 POWER SUPPLIES
10.5 INDUSTRIAL MOTOR DRIVES
10.6 EV CHARGING INFRASTRUCTURE
10.7 RF DEVICES
10.8 OTHERS
11 GLOBAL SIC POWER SEMICONDUCTOR MARKET, BY VERTICAL
11.1 OVERVIEW
11.2 AUTOMOTIVE
11.3 UTILITIES AND ENERGY
11.4 INDUSTRIAL
11.5 TRANSPORTATION
11.6 IT AND TELECOMMUNICATION
11.7 CONSUMER ELECTRONICS
11.8 AEROSPACE AND DEFENSE
11.9 COMMERCIAL
11.1 OTHERS
12 GLOBAL SIC POWER SEMICONDUCTOR MARKET, BY REGION
12.1 OVERVIEW
12.2 ASIA-PACIFIC
12.2.1 CHINA
12.2.2 JAPAN
12.2.3 SOUTH KOREA
12.2.4 INDIA
12.2.5 TAIWAN
12.2.6 AUSTRALIA AND NEW ZEALAND
12.2.7 SINGAPORE
12.2.8 THAILAND
12.2.9 INDONESIA
12.2.10 MALAYSIA
12.2.11 PHILIPPINES
12.2.12 VIETNAM
12.2.13 REST OF ASIA-PACIFIC
12.3 NORTH AMERICA
12.3.1 U.S.
12.3.2 CANADA
12.3.3 MEXICO
12.4 EUROPE
12.4.1 GERMANY
12.4.2 FRANCE
12.4.3 U.K
12.4.4 NETHERLANDS
12.4.5 ITALY
12.4.6 SPAIN
12.4.7 SWITZERLAND
12.4.8 RUSSIA
12.4.9 TURKEY
12.4.10 BELGIUM
12.4.11 POLAND
12.4.12 SWEDEN
12.4.13 DENMARK
12.4.14 REST OF EUROPE
12.5 MIDDLE EAST & AFRICA
12.5.1 ISRAEL
12.5.2 U.A.E.
12.5.3 SAUDI ARABIA
12.5.4 SOUTH AFRICA
12.5.5 EGYPT
12.5.6 KUWAIT
12.5.7 QATAR
12.5.8 REST OF MIDDLE EAST AND AFRICA
12.6 SOUTH AMERICA
12.6.1 BRAZIL
12.6.2 ARGENTINA
12.6.3 REST OF SOUTH AMERICA
13 GLOBAL SIC POWER SEMICONDUCTOR MARKET, COMPANY LANDSCAPE
13.1 COMPANY SHARE ANALYSIS: GLOBAL
13.2 COMPANY SHARE ANALYSIS: NORTH AMERICA
13.3 COMPANY SHARE ANALYSIS: EUROPE
13.4 COMPANY SHARE ANALYSIS: ASIA-PACIFIC
14 SWOT ANALYSIS
15 COMPANY PROFILINGS
15.1 STMICROELECTRONICS
15.1.1 COMPANY SNAPSHOT
15.1.2 REVENUE ANALYSIS
15.1.3 COMPANY SHARE ANALYSIS
15.1.4 PRODUCT PORTFOLIO
15.1.5 RECENT DEVELOPMENTS
15.2 INFINEON TECHNOLOGIES AG
15.2.1 COMPANY SNAPSHOT
15.2.2 REVENUE ANALYSIS
15.2.3 COMPANY SHARE ANALYSIS
15.2.4 PRODUCT PORTFOLIO
15.2.5 RECENT DEVELOPMENTS
15.3 WOLFSPEED INC.
15.3.1 COMPANY SNAPSHOT
15.3.2 REVENUE ANALYSIS
15.3.3 COMPANY SHARE ANALYSIS
15.3.4 PRODUCT PORTFOLIO
15.3.5 RECENT DEVELOPMENTS
15.4 ROHM CO., LTD.
15.4.1 COMPANY SNAPSHOT
15.4.2 REVENUE ANALYSIS
15.4.3 COMPANY SHARE ANALYSIS
15.4.4 PRODUCT PORTFOLIO
15.4.5 RECENT DEVELOPMENTS
15.5 SEMICONDUCTOR COMPONENTS INDUSTRIES LLC
15.5.1 COMPANY SNAPSHOT
15.5.2 REVENUE ANALYSIS
15.5.3 COMPANY SHARE ANALYSIS
15.5.4 PRODUCT PORTFOLIO
15.5.5 RECENT DEVELOPMENTS
15.6 ALLEGRO MICROSYSTEMS, INC.
15.6.1 COMPANY SNAPSHOT
15.6.2 REVENUE ANALYSIS
15.6.3 COMPANY SHARE ANALYSIS
15.6.4 PRODUCT PORTFOLIO
15.6.5 RECENT DEVELOPMENTS
15.7 FUJI ELECTRIC CO. LTD.
15.7.1 COMPANY SNAPSHOT
15.7.2 REVENUE ANALYSIS
15.7.3 PRODUCT PORTFOLIO
15.7.4 RECENT DEVELOPMENTS
15.8 GENESIC SEMICONDUCTOR INC.
15.8.1 COMPANY SNAPSHOT
15.8.2 PRODUCT PORTFOLIO
15.8.3 RECENT DEVELOPMENTS
15.9 HITACHI POWER SEMICONDUCTOR DEVICE, LTD.
15.9.1 COMPANY SNAPSHOT
15.9.2 PRODUCT PORTFOLIO
15.9.3 RECENT DEVELOPMENTS
15.1 LITTLEFUSE, INC.
15.10.1 COMPANY SNAPSHOT
15.10.2 REVENUE ANALYSIS
15.10.3 PRODUCT PORTFOLIO
15.10.4 RECENT DEVELOPMENTS
15.11 MICROCHIP TECHNOLOGY INC.
15.11.1 COMPANY SNAPSHOT
15.11.2 REVENUE ANALYSIS
15.11.3 PRODUCT PORTFOLIO
15.11.4 RECENT DEVELOPMENTS
15.12 MITSUBISHI ELECTRIC CORPORATION
15.12.1 COMPANY SNAPSHOT
15.12.2 REVENUE ANALYSIS
15.12.3 PRODUCT PORTFOLIO
15.12.4 RECENT DEVELOPMENTS
15.13 NXP SEMICONDUCTORS
15.13.1 COMPANY SNAPSHOT
15.13.2 REVENUE ANALYSIS
15.13.3 DESIGN PORTFOLIO
15.13.4 RECENT DEVELOPMENTS
15.14 RENESAS ELECTRONICS CORPORATION
15.14.1 COMPANY SNAPSHOT
15.14.2 REVENUE ANALYSIS
15.14.3 PRODUCT PORTFOLIO
15.14.4 RECENT DEVELOPMENTS
15.15 SEMIKRON DANFOSS
15.15.1 COMPANY SNAPSHOT
15.15.2 PRODUCT PORTFOLIO
15.15.3 RECENT DEVELOPMENTS
15.16 SEMIQ INC.
15.16.1 COMPANY SNAPSHOT
15.16.2 PRODUCT PORTFOLIO
15.16.3 RECENT DEVELOPMENTS
15.17 TEXAS INSTRUMENTS INCORPORATED
15.17.1 COMPANY SNAPSHOT
15.17.2 REVENUE ANALYSIS
15.17.3 PRODUCT PORTFOLIO
15.17.4 RECENT DEVELOPMENTS
15.18 TOSHIBA ELECTRONIC DEVICES AND STORAGE CORPORATION
15.18.1 COMPANY SNAPSHOT
15.18.2 PRODUCTS PORTFOLIO
15.18.3 RECENT DEVELOPMENTS
15.19 UNITEDSIC
15.19.1 COMPANY SNAPSHOT
15.19.2 PRODUCT PORTFOLIO
15.19.3 RECENT DEVELOPMENTS
15.2 XIAMEN POWERWAY ADVANCED MATERIAL CO. LTD.
15.20.1 COMPANY SNAPSHOT
15.20.2 PRODUCT PORTFOLIO
15.20.3 RECENT DEVELOPMENTS
16 QUESTIONNAIRE
17 RELATED REPORTS
Lista de Tablas
TABLE 1 GLOBAL SIC POWER SEMICONDUCTOR MARKET, BY TYPE, 2021-2030 (USD THOUSAND)
TABLE 2 GLOBAL MOSFETS IN SIC POWER SEMICONDUCTOR MARKET, BY REGION, 2021-2030 (USD THOUSAND)
TABLE 3 GLOBAL HYBRID MODULES IN SIC POWER SEMICONDUCTOR MARKET, BY REGION, 2021-2030 (USD THOUSAND)
TABLE 4 GLOBAL SCHOTTKY BARRIER DIODES (SBDS) IN SIC POWER SEMICONDUCTOR MARKET, BY REGION, 2021-2030 (USD THOUSAND)
TABLE 5 GLOBAL IGBT IN SIC POWER SEMICONDUCTOR MARKET, BY REGION, 2021-2030 (USD THOUSAND)
TABLE 6 GLOBAL BIPOLAR JUNCTION TRANSISTOR (BJT) IN SIC POWER SEMICONDUCTOR MARKET, BY REGION, 2021-2030 (USD THOUSAND)
TABLE 7 GLOBAL PIN DIODE IN SIC POWER SEMICONDUCTOR MARKET, BY REGION, 2021-2030 (USD THOUSAND)
TABLE 8 GLOBAL JUNCTION FET (JFET) IN SIC POWER SEMICONDUCTOR MARKET, BY REGION, 2021-2030 (USD THOUSAND)
TABLE 9 GLOBAL OTHERS IN SIC POWER SEMICONDUCTOR MARKET, BY REGION, 2021-2030 (USD THOUSAND)
TABLE 10 GLOBAL SIC POWER SEMICONDUCTOR MARKET, BY VOLTAGE RANGE, 2021-2030 (USD THOUSAND)
TABLE 11 GLOBAL 301-900 V IN SIC POWER SEMICONDUCTOR MARKET, BY REGION, 2021-2030 (USD THOUSAND)
TABLE 12 GLOBAL 901-1700 V IN SIC POWER SEMICONDUCTOR MARKET, BY REGION, 2021-2030 (USD THOUSAND)
TABLE 13 GLOBAL ABOVE 1701 V IN SIC POWER SEMICONDUCTOR MARKET, BY REGION, 2021-2030 (USD THOUSAND)
TABLE 14 GLOBAL SIC POWER SEMICONDUCTOR MARKET, BY WAFER SIZE, 2021-2030 (USD THOUSAND)
TABLE 15 GLOBAL 6 INCH IN SIC POWER SEMICONDUCTOR MARKET, BY REGION, 2021-2030 (USD THOUSAND)
TABLE 16 GLOBAL 4 INCH IN SIC POWER SEMICONDUCTOR MARKET, BY REGION, 2021-2030 (USD THOUSAND)
TABLE 17 GLOBAL 2 INCH IN SIC POWER SEMICONDUCTOR MARKET, BY REGION, 2021-2030 (USD THOUSAND)
TABLE 18 GLOBAL ABOVE 6 INCH IN SIC POWER SEMICONDUCTOR MARKET, BY REGION, 2021-2030 (USD THOUSAND)
TABLE 19 GLOBAL SIC POWER SEMICONDUCTOR MARKET, BY WAFER TYPE, 2021-2030 (USD THOUSAND)
TABLE 20 GLOBAL SIC EPITAXIAL WAFERS IN SIC POWER SEMICONDUCTOR MARKET, BY REGION, 2021-2030 (USD THOUSAND)
TABLE 21 GLOBAL BLANK SIC WAFERS IN SIC POWER SEMICONDUCTOR MARKET, BY REGION, 2021-2030 (USD THOUSAND)
TABLE 22 GLOBAL SIC POWER SEMICONDUCTOR MARKET, BY APPLICATION, 2021-2030 (USD THOUSAND)
TABLE 23 GLOBAL ELECTRIC VEHICLES (EV) IN SIC POWER SEMICONDUCTOR MARKET, BY REGION, 2021-2030 (USD THOUSAND)
TABLE 24 GLOBAL PHOTOVOLTAICS IN SIC POWER SEMICONDUCTOR MARKET, BY REGION, 2021-2030 (USD THOUSAND)
TABLE 25 GLOBAL POWER SUPPLIES IN SIC POWER SEMICONDUCTOR MARKET, BY REGION, 2021-2030 (USD THOUSAND)
TABLE 26 GLOBAL INDUSTRIAL MOTOR DRIVES IN SIC POWER SEMICONDUCTOR MARKET, BY REGION, 2021-2030 (USD THOUSAND)
TABLE 27 GLOBAL EV CHARGING INFRASTRUCTURE IN SIC POWER SEMICONDUCTOR MARKET, BY REGION, 2021-2030 (USD THOUSAND)
TABLE 28 GLOBAL RF DEVICES IN SIC POWER SEMICONDUCTOR MARKET, BY REGION, 2021-2030 (USD THOUSAND)
TABLE 29 GLOBAL OTHERS IN SIC POWER SEMICONDUCTOR MARKET, BY REGION, 2021-2030 (USD THOUSAND)
TABLE 30 GLOBAL SIC POWER SEMICONDUCTOR MARKET, BY VERTICAL, 2021-2030 (USD THOUSAND)
TABLE 31 GLOBAL AUTOMOTIVE IN SIC POWER SEMICONDUCTOR MARKET, BY REGION, 2021-2030 (USD THOUSAND)
TABLE 32 GLOBAL UTILITIES AND ENERGY IN SIC POWER SEMICONDUCTOR MARKET, BY REGION, 2021-2030 (USD THOUSAND)
TABLE 33 GLOBAL INDUSTRIAL IN SIC POWER SEMICONDUCTOR MARKET, BY REGION, 2021-2030 (USD THOUSAND)
TABLE 34 GLOBAL TRANSPORTATION IN SIC POWER SEMICONDUCTOR MARKET, BY REGION, 2021-2030 (USD THOUSAND)
TABLE 35 GLOBAL IT AND TELECOMMUNICATION IN SIC POWER SEMICONDUCTOR MARKET, BY REGION, 2021-2030 (USD THOUSAND)
TABLE 36 GLOBAL CONSUMER ELECTRONICS IN SIC POWER SEMICONDUCTOR MARKET, BY REGION, 2021-2030 (USD THOUSAND)
TABLE 37 GLOBAL AEROSPACE AND DEFENSE IN SIC POWER SEMICONDUCTOR MARKET, BY REGION, 2021-2030 (USD THOUSAND)
TABLE 38 GLOBAL COMMERCIAL IN SIC POWER SEMICONDUCTOR MARKET, BY REGION, 2021-2030 (USD THOUSAND)
TABLE 39 GLOBAL OTHERS IN SIC POWER SEMICONDUCTOR MARKET, BY REGION, 2021-2030 (USD THOUSAND)
TABLE 40 GLOBAL SIC POWER SEMICONDUCTOR MARKET, BY REGION, 2021-2030 (USD THOUSAND)
TABLE 41 ASIA-PACIFIC SIC POWER SEMICONDUCTOR MARKET, BY COUNTRY, 2021-2030 (USD THOUSAND)
TABLE 42 ASIA-PACIFIC SIC POWER SEMICONDUCTOR MARKET, BY TYPE, 2021-2030 (USD THOUSAND)
TABLE 43 ASIA-PACIFIC SIC POWER SEMICONDUCTOR MARKET, BY VOLTAGE RANGE, 2021-2030 (USD THOUSAND)
TABLE 44 ASIA-PACIFIC SIC POWER SEMICONDUCTOR MARKET, BY WAFER SIZE, 2021-2030 (USD THOUSAND)
TABLE 45 ASIA-PACIFIC SIC POWER SEMICONDUCTOR MARKET, BY WAFER TYPE, 2021-2030 (USD THOUSAND)
TABLE 46 ASIA-PACIFIC SIC POWER SEMICONDUCTOR MARKET, BY APPLICATION, 2021-2030 (USD THOUSAND)
TABLE 47 ASIA-PACIFIC SIC POWER SEMICONDUCTOR MARKET, BY VERTICAL, 2021-2030 (USD THOUSAND)
TABLE 48 CHINA SIC POWER SEMICONDUCTOR MARKET, BY TYPE, 2021-2030 (USD THOUSAND)
TABLE 49 CHINA SIC POWER SEMICONDUCTOR MARKET, BY VOLTAGE RANGE, 2021-2030 (USD THOUSAND)
TABLE 50 CHINA SIC POWER SEMICONDUCTOR MARKET, BY WAFER SIZE, 2021-2030 (USD THOUSAND)
TABLE 51 CHINA SIC POWER SEMICONDUCTOR MARKET, BY WAFER TYPE, 2021-2030 (USD THOUSAND)
TABLE 52 CHINA SIC POWER SEMICONDUCTOR MARKET, BY APPLICATION, 2021-2030 (USD THOUSAND)
TABLE 53 CHINA SIC POWER SEMICONDUCTOR MARKET, BY VERTICAL, 2021-2030 (USD THOUSAND)
TABLE 54 JAPAN SIC POWER SEMICONDUCTOR MARKET, BY TYPE, 2021-2030 (USD THOUSAND)
TABLE 55 JAPAN SIC POWER SEMICONDUCTOR MARKET, BY VOLTAGE RANGE, 2021-2030 (USD THOUSAND)
TABLE 56 JAPAN SIC POWER SEMICONDUCTOR MARKET, BY WAFER SIZE, 2021-2030 (USD THOUSAND)
TABLE 57 JAPAN SIC POWER SEMICONDUCTOR MARKET, BY WAFER TYPE, 2021-2030 (USD THOUSAND)
TABLE 58 JAPAN SIC POWER SEMICONDUCTOR MARKET, BY APPLICATION, 2021-2030 (USD THOUSAND)
TABLE 59 JAPAN SIC POWER SEMICONDUCTOR MARKET, BY VERTICAL, 2021-2030 (USD THOUSAND)
TABLE 60 SOUTH KOREA SIC POWER SEMICONDUCTOR MARKET, BY TYPE, 2021-2030 (USD THOUSAND)
TABLE 61 SOUTH KOREA SIC POWER SEMICONDUCTOR MARKET, BY VOLTAGE RANGE, 2021-2030 (USD THOUSAND)
TABLE 62 SOUTH KOREA SIC POWER SEMICONDUCTOR MARKET, BY WAFER SIZE, 2021-2030 (USD THOUSAND)
TABLE 63 SOUTH KOREA SIC POWER SEMICONDUCTOR MARKET, BY WAFER TYPE, 2021-2030 (USD THOUSAND)
TABLE 64 SOUTH KOREA SIC POWER SEMICONDUCTOR MARKET, BY APPLICATION, 2021-2030 (USD THOUSAND)
TABLE 65 SOUTH KOREA SIC POWER SEMICONDUCTOR MARKET, BY VERTICAL, 2021-2030 (USD THOUSAND)
TABLE 66 INDIA SIC POWER SEMICONDUCTOR MARKET, BY TYPE, 2021-2030 (USD THOUSAND)
TABLE 67 INDIA SIC POWER SEMICONDUCTOR MARKET, BY VOLTAGE RANGE, 2021-2030 (USD THOUSAND)
TABLE 68 INDIA SIC POWER SEMICONDUCTOR MARKET, BY WAFER SIZE, 2021-2030 (USD THOUSAND)
TABLE 69 INDIA SIC POWER SEMICONDUCTOR MARKET, BY WAFER TYPE, 2021-2030 (USD THOUSAND)
TABLE 70 INDIA SIC POWER SEMICONDUCTOR MARKET, BY APPLICATION, 2021-2030 (USD THOUSAND)
TABLE 71 INDIA SIC POWER SEMICONDUCTOR MARKET, BY VERTICAL, 2021-2030 (USD THOUSAND)
TABLE 72 TAIWAN SIC POWER SEMICONDUCTOR MARKET, BY TYPE, 2021-2030 (USD THOUSAND)
TABLE 73 TAIWAN SIC POWER SEMICONDUCTOR MARKET, BY VOLTAGE RANGE, 2021-2030 (USD THOUSAND)
TABLE 74 TAIWAN SIC POWER SEMICONDUCTOR MARKET, BY WAFER SIZE, 2021-2030 (USD THOUSAND)
TABLE 75 TAIWAN SIC POWER SEMICONDUCTOR MARKET, BY WAFER TYPE, 2021-2030 (USD THOUSAND)
TABLE 76 TAIWAN SIC POWER SEMICONDUCTOR MARKET, BY APPLICATION, 2021-2030 (USD THOUSAND)
TABLE 77 TAIWAN SIC POWER SEMICONDUCTOR MARKET, BY VERTICAL, 2021-2030 (USD THOUSAND)
TABLE 78 AUSTRALIA AND NEW ZEALAND SIC POWER SEMICONDUCTOR MARKET, BY TYPE, 2021-2030 (USD THOUSAND)
TABLE 79 AUSTRALIA AND NEW ZEALAND SIC POWER SEMICONDUCTOR MARKET, BY VOLTAGE RANGE, 2021-2030 (USD THOUSAND)
TABLE 80 AUSTRALIA AND NEW ZEALAND SIC POWER SEMICONDUCTOR MARKET, BY WAFER SIZE, 2021-2030 (USD THOUSAND)
TABLE 81 AUSTRALIA AND NEW ZEALAND SIC POWER SEMICONDUCTOR MARKET, BY WAFER TYPE, 2021-2030 (USD THOUSAND)
TABLE 82 AUSTRALIA AND NEW ZEALAND SIC POWER SEMICONDUCTOR MARKET, BY APPLICATION, 2021-2030 (USD THOUSAND)
TABLE 83 AUSTRALIA AND NEW ZEALAND SIC POWER SEMICONDUCTOR MARKET, BY VERTICAL, 2021-2030 (USD THOUSAND)
TABLE 84 SINGAPORE SIC POWER SEMICONDUCTOR MARKET, BY TYPE, 2021-2030 (USD THOUSAND)
TABLE 85 SINGAPORE SIC POWER SEMICONDUCTOR MARKET, BY VOLTAGE RANGE, 2021-2030 (USD THOUSAND)
TABLE 86 SINGAPORE SIC POWER SEMICONDUCTOR MARKET, BY WAFER SIZE, 2021-2030 (USD THOUSAND)
TABLE 87 SINGAPORE SIC POWER SEMICONDUCTOR MARKET, BY WAFER TYPE, 2021-2030 (USD THOUSAND)
TABLE 88 SINGAPORE SIC POWER SEMICONDUCTOR MARKET, BY APPLICATION, 2021-2030 (USD THOUSAND)
TABLE 89 SINGAPORE SIC POWER SEMICONDUCTOR MARKET, BY VERTICAL, 2021-2030 (USD THOUSAND)
TABLE 90 THAILAND SIC POWER SEMICONDUCTOR MARKET, BY TYPE, 2021-2030 (USD THOUSAND)
TABLE 91 THAILAND SIC POWER SEMICONDUCTOR MARKET, BY VOLTAGE RANGE, 2021-2030 (USD THOUSAND)
TABLE 92 THAILAND SIC POWER SEMICONDUCTOR MARKET, BY WAFER SIZE, 2021-2030 (USD THOUSAND)
TABLE 93 THAILAND SIC POWER SEMICONDUCTOR MARKET, BY WAFER TYPE, 2021-2030 (USD THOUSAND)
TABLE 94 THAILAND SIC POWER SEMICONDUCTOR MARKET, BY APPLICATION, 2021-2030 (USD THOUSAND)
TABLE 95 THAILAND SIC POWER SEMICONDUCTOR MARKET, BY VERTICAL, 2021-2030 (USD THOUSAND)
TABLE 96 INDONESIA SIC POWER SEMICONDUCTOR MARKET, BY TYPE, 2021-2030 (USD THOUSAND)
TABLE 97 INDONESIA SIC POWER SEMICONDUCTOR MARKET, BY VOLTAGE RANGE, 2021-2030 (USD THOUSAND)
TABLE 98 INDONESIA SIC POWER SEMICONDUCTOR MARKET, BY WAFER SIZE, 2021-2030 (USD THOUSAND)
TABLE 99 INDONESIA SIC POWER SEMICONDUCTOR MARKET, BY WAFER TYPE, 2021-2030 (USD THOUSAND)
TABLE 100 INDONESIA SIC POWER SEMICONDUCTOR MARKET, BY APPLICATION, 2021-2030 (USD THOUSAND)
TABLE 101 INDONESIA SIC POWER SEMICONDUCTOR MARKET, BY VERTICAL, 2021-2030 (USD THOUSAND)
TABLE 102 MALAYSIA SIC POWER SEMICONDUCTOR MARKET, BY TYPE, 2021-2030 (USD THOUSAND)
TABLE 103 MALAYSIA SIC POWER SEMICONDUCTOR MARKET, BY VOLTAGE RANGE, 2021-2030 (USD THOUSAND)
TABLE 104 MALAYSIA SIC POWER SEMICONDUCTOR MARKET, BY WAFER SIZE, 2021-2030 (USD THOUSAND)
TABLE 105 MALAYSIA SIC POWER SEMICONDUCTOR MARKET, BY WAFER TYPE, 2021-2030 (USD THOUSAND)
TABLE 106 MALAYSIA SIC POWER SEMICONDUCTOR MARKET, BY APPLICATION, 2021-2030 (USD THOUSAND)
TABLE 107 MALAYSIA SIC POWER SEMICONDUCTOR MARKET, BY VERTICAL, 2021-2030 (USD THOUSAND)
TABLE 108 PHILIPPINES SIC POWER SEMICONDUCTOR MARKET, BY TYPE, 2021-2030 (USD THOUSAND)
TABLE 109 PHILIPPINES SIC POWER SEMICONDUCTOR MARKET, BY VOLTAGE RANGE, 2021-2030 (USD THOUSAND)
TABLE 110 PHILIPPINES SIC POWER SEMICONDUCTOR MARKET, BY WAFER SIZE, 2021-2030 (USD THOUSAND)
TABLE 111 PHILIPPINES SIC POWER SEMICONDUCTOR MARKET, BY WAFER TYPE, 2021-2030 (USD THOUSAND)
TABLE 112 PHILIPPINES SIC POWER SEMICONDUCTOR MARKET, BY APPLICATION, 2021-2030 (USD THOUSAND)
TABLE 113 PHILIPPINES SIC POWER SEMICONDUCTOR MARKET, BY VERTICAL, 2021-2030 (USD THOUSAND)
TABLE 114 VIETNAM SIC POWER SEMICONDUCTOR MARKET, BY TYPE, 2021-2030 (USD THOUSAND)
TABLE 115 VIETNAM SIC POWER SEMICONDUCTOR MARKET, BY VOLTAGE RANGE, 2021-2030 (USD THOUSAND)
TABLE 116 VIETNAM SIC POWER SEMICONDUCTOR MARKET, BY WAFER SIZE, 2021-2030 (USD THOUSAND)
TABLE 117 VIETNAM SIC POWER SEMICONDUCTOR MARKET, BY WAFER TYPE, 2021-2030 (USD THOUSAND)
TABLE 118 VIETNAM SIC POWER SEMICONDUCTOR MARKET, BY APPLICATION, 2021-2030 (USD THOUSAND)
TABLE 119 VIETNAM SIC POWER SEMICONDUCTOR MARKET, BY VERTICAL, 2021-2030 (USD THOUSAND)
TABLE 120 REST OF ASIA-PACIFIC SIC POWER SEMICONDUCTOR MARKET, BY TYPE, 2021-2030 (USD THOUSAND)
TABLE 121 NORTH AMERICA SIC POWER SEMICONDUCTOR MARKET, BY COUNTRY, 2021-2030 (USD THOUSAND)
TABLE 122 NORTH AMERICA SIC POWER SEMICONDUCTOR MARKET, BY TYPE, 2021-2030 (USD THOUSAND)
TABLE 123 NORTH AMERICA SIC POWER SEMICONDUCTOR MARKET, BY VOLTAGE RANGE, 2021-2030 (USD THOUSAND)
TABLE 124 NORTH AMERICA SIC POWER SEMICONDUCTOR MARKET, BY WAFER SIZE, 2021-2030 (USD THOUSAND)
TABLE 125 NORTH AMERICA SIC POWER SEMICONDUCTOR MARKET, BY WAFER TYPE, 2021-2030 (USD THOUSAND)
TABLE 126 NORTH AMERICA SIC POWER SEMICONDUCTOR MARKET, BY APPLICATION, 2021-2030 (USD THOUSAND)
TABLE 127 NORTH AMERICA SIC POWER SEMICONDUCTOR MARKET, BY VERTICAL, 2021-2030 (USD THOUSAND)
TABLE 128 U.S. SIC POWER SEMICONDUCTOR MARKET, BY TYPE, 2021-2030 (USD THOUSAND)
TABLE 129 U.S. SIC POWER SEMICONDUCTOR MARKET, BY VOLTAGE RANGE, 2021-2030 (USD THOUSAND)
TABLE 130 U.S. SIC POWER SEMICONDUCTOR MARKET, BY WAFER SIZE, 2021-2030 (USD THOUSAND)
TABLE 131 U.S. SIC POWER SEMICONDUCTOR MARKET, BY WAFER TYPE, 2021-2030 (USD THOUSAND)
TABLE 132 U.S. SIC POWER SEMICONDUCTOR MARKET, BY APPLICATION, 2021-2030 (USD THOUSAND)
TABLE 133 U.S. SIC POWER SEMICONDUCTOR MARKET, BY VERTICAL, 2021-2030 (USD THOUSAND)
TABLE 134 CANADA SIC POWER SEMICONDUCTOR MARKET, BY TYPE, 2021-2030 (USD THOUSAND)
TABLE 135 CANADA SIC POWER SEMICONDUCTOR MARKET, BY VOLTAGE RANGE, 2021-2030 (USD THOUSAND)
TABLE 136 CANADA SIC POWER SEMICONDUCTOR MARKET, BY WAFER SIZE, 2021-2030 (USD THOUSAND)
TABLE 137 CANADA SIC POWER SEMICONDUCTOR MARKET, BY WAFER TYPE, 2021-2030 (USD THOUSAND)
TABLE 138 CANADA SIC POWER SEMICONDUCTOR MARKET, BY APPLICATION, 2021-2030 (USD THOUSAND)
TABLE 139 CANADA SIC POWER SEMICONDUCTOR MARKET, BY VERTICAL, 2021-2030 (USD THOUSAND)
TABLE 140 MEXICO SIC POWER SEMICONDUCTOR MARKET, BY TYPE, 2021-2030 (USD THOUSAND)
TABLE 141 MEXICO SIC POWER SEMICONDUCTOR MARKET, BY VOLTAGE RANGE, 2021-2030 (USD THOUSAND)
TABLE 142 MEXICO SIC POWER SEMICONDUCTOR MARKET, BY WAFER SIZE, 2021-2030 (USD THOUSAND)
TABLE 143 MEXICO SIC POWER SEMICONDUCTOR MARKET, BY WAFER TYPE, 2021-2030 (USD THOUSAND)
TABLE 144 MEXICO SIC POWER SEMICONDUCTOR MARKET, BY APPLICATION, 2021-2030 (USD THOUSAND)
TABLE 145 MEXICO SIC POWER SEMICONDUCTOR MARKET, BY VERTICAL, 2021-2030 (USD THOUSAND)
TABLE 146 EUROPE SIC POWER SEMICONDUCTOR MARKET, BY COUNTRY, 2021-2030 (USD THOUSAND)
TABLE 147 EUROPE SIC POWER SEMICONDUCTOR MARKET, BY TYPE, 2021-2030 (USD THOUSAND)
TABLE 148 EUROPE SIC POWER SEMICONDUCTOR MARKET, BY VOLTAGE RANGE, 2021-2030 (USD THOUSAND)
TABLE 149 EUROPE SIC POWER SEMICONDUCTOR MARKET, BY WAFER SIZE, 2021-2030 (USD THOUSAND)
TABLE 150 EUROPE SIC POWER SEMICONDUCTOR MARKET, BY WAFER TYPE, 2021-2030 (USD THOUSAND)
TABLE 151 EUROPE SIC POWER SEMICONDUCTOR MARKET, BY APPLICATION, 2021-2030 (USD THOUSAND)
TABLE 152 EUROPE SIC POWER SEMICONDUCTOR MARKET, BY VERTICAL, 2021-2030 (USD THOUSAND)
TABLE 153 GERMANY SIC POWER SEMICONDUCTOR MARKET, BY TYPE, 2021-2030 (USD THOUSAND)
TABLE 154 GERMANY SIC POWER SEMICONDUCTOR MARKET, BY VOLTAGE RANGE, 2021-2030 (USD THOUSAND)
TABLE 155 GERMANY SIC POWER SEMICONDUCTOR MARKET, BY WAFER SIZE, 2021-2030 (USD THOUSAND)
TABLE 156 GERMANY SIC POWER SEMICONDUCTOR MARKET, BY WAFER TYPE, 2021-2030 (USD THOUSAND)
TABLE 157 GERMANY SIC POWER SEMICONDUCTOR MARKET, BY APPLICATION, 2021-2030 (USD THOUSAND)
TABLE 158 GERMANY SIC POWER SEMICONDUCTOR MARKET, BY VERTICAL, 2021-2030 (USD THOUSAND)
TABLE 159 FRANCE SIC POWER SEMICONDUCTOR MARKET, BY TYPE, 2021-2030 (USD THOUSAND)
TABLE 160 FRANCE SIC POWER SEMICONDUCTOR MARKET, BY VOLTAGE RANGE, 2021-2030 (USD THOUSAND)
TABLE 161 FRANCE SIC POWER SEMICONDUCTOR MARKET, BY WAFER SIZE, 2021-2030 (USD THOUSAND)
TABLE 162 FRANCE SIC POWER SEMICONDUCTOR MARKET, BY WAFER TYPE, 2021-2030 (USD THOUSAND)
TABLE 163 FRANCE SIC POWER SEMICONDUCTOR MARKET, BY APPLICATION, 2021-2030 (USD THOUSAND)
TABLE 164 FRANCE SIC POWER SEMICONDUCTOR MARKET, BY VERTICAL, 2021-2030 (USD THOUSAND)
TABLE 165 U.K. SIC POWER SEMICONDUCTOR MARKET, BY TYPE, 2021-2030 (USD THOUSAND)
TABLE 166 U.K. SIC POWER SEMICONDUCTOR MARKET, BY VOLTAGE RANGE, 2021-2030 (USD THOUSAND)
TABLE 167 U.K. SIC POWER SEMICONDUCTOR MARKET, BY WAFER SIZE, 2021-2030 (USD THOUSAND)
TABLE 168 U.K. SIC POWER SEMICONDUCTOR MARKET, BY WAFER TYPE, 2021-2030 (USD THOUSAND)
TABLE 169 U.K. SIC POWER SEMICONDUCTOR MARKET, BY APPLICATION, 2021-2030 (USD THOUSAND)
TABLE 170 U.K. SIC POWER SEMICONDUCTOR MARKET, BY VERTICAL, 2021-2030 (USD THOUSAND)
TABLE 171 NETHERLANDS SIC POWER SEMICONDUCTOR MARKET, BY TYPE, 2021-2030 (USD THOUSAND)
TABLE 172 NETHERLANDS SIC POWER SEMICONDUCTOR MARKET, BY VOLTAGE RANGE, 2021-2030 (USD THOUSAND)
TABLE 173 NETHERLANDS SIC POWER SEMICONDUCTOR MARKET, BY WAFER SIZE, 2021-2030 (USD THOUSAND)
TABLE 174 NETHERLANDS SIC POWER SEMICONDUCTOR MARKET, BY WAFER TYPE, 2021-2030 (USD THOUSAND)
TABLE 175 NETHERLANDS SIC POWER SEMICONDUCTOR MARKET, BY APPLICATION, 2021-2030 (USD THOUSAND)
TABLE 176 NETHERLANDS SIC POWER SEMICONDUCTOR MARKET, BY VERTICAL, 2021-2030 (USD THOUSAND)
TABLE 177 ITALY SIC POWER SEMICONDUCTOR MARKET, BY TYPE, 2021-2030 (USD THOUSAND)
TABLE 178 ITALY SIC POWER SEMICONDUCTOR MARKET, BY VOLTAGE RANGE, 2021-2030 (USD THOUSAND)
TABLE 179 ITALY SIC POWER SEMICONDUCTOR MARKET, BY WAFER SIZE, 2021-2030 (USD THOUSAND)
TABLE 180 ITALY SIC POWER SEMICONDUCTOR MARKET, BY WAFER TYPE, 2021-2030 (USD THOUSAND)
TABLE 181 ITALY SIC POWER SEMICONDUCTOR MARKET, BY APPLICATION, 2021-2030 (USD THOUSAND)
TABLE 182 ITALY SIC POWER SEMICONDUCTOR MARKET, BY VERTICAL, 2021-2030 (USD THOUSAND)
TABLE 183 SPAIN SIC POWER SEMICONDUCTOR MARKET, BY TYPE, 2021-2030 (USD THOUSAND)
TABLE 184 SPAIN SIC POWER SEMICONDUCTOR MARKET, BY VOLTAGE RANGE, 2021-2030 (USD THOUSAND)
TABLE 185 SPAIN SIC POWER SEMICONDUCTOR MARKET, BY WAFER SIZE, 2021-2030 (USD THOUSAND)
TABLE 186 SPAIN SIC POWER SEMICONDUCTOR MARKET, BY WAFER TYPE, 2021-2030 (USD THOUSAND)
TABLE 187 SPAIN SIC POWER SEMICONDUCTOR MARKET, BY APPLICATION, 2021-2030 (USD THOUSAND)
TABLE 188 SPAIN SIC POWER SEMICONDUCTOR MARKET, BY VERTICAL, 2021-2030 (USD THOUSAND)
TABLE 189 SWITZERLAND SIC POWER SEMICONDUCTOR MARKET, BY TYPE, 2021-2030 (USD THOUSAND)
TABLE 190 SWITZERLAND SIC POWER SEMICONDUCTOR MARKET, BY VOLTAGE RANGE, 2021-2030 (USD THOUSAND)
TABLE 191 SWITZERLAND SIC POWER SEMICONDUCTOR MARKET, BY WAFER SIZE, 2021-2030 (USD THOUSAND)
TABLE 192 SWITZERLAND SIC POWER SEMICONDUCTOR MARKET, BY WAFER TYPE, 2021-2030 (USD THOUSAND)
TABLE 193 SWITZERLAND SIC POWER SEMICONDUCTOR MARKET, BY APPLICATION, 2021-2030 (USD THOUSAND)
TABLE 194 SWITZERLAND SIC POWER SEMICONDUCTOR MARKET, BY VERTICAL, 2021-2030 (USD THOUSAND)
TABLE 195 RUSSIA SIC POWER SEMICONDUCTOR MARKET, BY TYPE, 2021-2030 (USD THOUSAND)
TABLE 196 RUSSIA SIC POWER SEMICONDUCTOR MARKET, BY VOLTAGE RANGE, 2021-2030 (USD THOUSAND)
TABLE 197 RUSSIA SIC POWER SEMICONDUCTOR MARKET, BY WAFER SIZE, 2021-2030 (USD THOUSAND)
TABLE 198 RUSSIA SIC POWER SEMICONDUCTOR MARKET, BY WAFER TYPE, 2021-2030 (USD THOUSAND)
TABLE 199 RUSSIA SIC POWER SEMICONDUCTOR MARKET, BY APPLICATION, 2021-2030 (USD THOUSAND)
TABLE 200 RUSSIA SIC POWER SEMICONDUCTOR MARKET, BY VERTICAL, 2021-2030 (USD THOUSAND)
TABLE 201 TURKEY SIC POWER SEMICONDUCTOR MARKET, BY TYPE, 2021-2030 (USD THOUSAND)
TABLE 202 TURKEY SIC POWER SEMICONDUCTOR MARKET, BY VOLTAGE RANGE, 2021-2030 (USD THOUSAND)
TABLE 203 TURKEY SIC POWER SEMICONDUCTOR MARKET, BY WAFER SIZE, 2021-2030 (USD THOUSAND)
TABLE 204 TURKEY SIC POWER SEMICONDUCTOR MARKET, BY WAFER TYPE, 2021-2030 (USD THOUSAND)
TABLE 205 TURKEY SIC POWER SEMICONDUCTOR MARKET, BY APPLICATION, 2021-2030 (USD THOUSAND)
TABLE 206 TURKEY SIC POWER SEMICONDUCTOR MARKET, BY VERTICAL, 2021-2030 (USD THOUSAND)
TABLE 207 BELGIUM SIC POWER SEMICONDUCTOR MARKET, BY TYPE, 2021-2030 (USD THOUSAND)
TABLE 208 BELGIUM SIC POWER SEMICONDUCTOR MARKET, BY VOLTAGE RANGE, 2021-2030 (USD THOUSAND)
TABLE 209 BELGIUM SIC POWER SEMICONDUCTOR MARKET, BY WAFER SIZE, 2021-2030 (USD THOUSAND)
TABLE 210 BELGIUM SIC POWER SEMICONDUCTOR MARKET, BY WAFER TYPE, 2021-2030 (USD THOUSAND)
TABLE 211 BELGIUM SIC POWER SEMICONDUCTOR MARKET, BY APPLICATION, 2021-2030 (USD THOUSAND)
TABLE 212 BELGIUM SIC POWER SEMICONDUCTOR MARKET, BY VERTICAL, 2021-2030 (USD THOUSAND)
TABLE 213 POLAND SIC POWER SEMICONDUCTOR MARKET, BY TYPE, 2021-2030 (USD THOUSAND)
TABLE 214 POLAND SIC POWER SEMICONDUCTOR MARKET, BY VOLTAGE RANGE, 2021-2030 (USD THOUSAND)
TABLE 215 POLAND SIC POWER SEMICONDUCTOR MARKET, BY WAFER SIZE, 2021-2030 (USD THOUSAND)
TABLE 216 POLAND SIC POWER SEMICONDUCTOR MARKET, BY WAFER TYPE, 2021-2030 (USD THOUSAND)
TABLE 217 POLAND SIC POWER SEMICONDUCTOR MARKET, BY APPLICATION, 2021-2030 (USD THOUSAND)
TABLE 218 POLAND SIC POWER SEMICONDUCTOR MARKET, BY VERTICAL, 2021-2030 (USD THOUSAND)
TABLE 219 SWEDEN SIC POWER SEMICONDUCTOR MARKET, BY TYPE, 2021-2030 (USD THOUSAND)
TABLE 220 SWEDEN SIC POWER SEMICONDUCTOR MARKET, BY VOLTAGE RANGE, 2021-2030 (USD THOUSAND)
TABLE 221 SWEDEN SIC POWER SEMICONDUCTOR MARKET, BY WAFER SIZE, 2021-2030 (USD THOUSAND)
TABLE 222 SWEDEN SIC POWER SEMICONDUCTOR MARKET, BY WAFER TYPE, 2021-2030 (USD THOUSAND)
TABLE 223 SWEDEN SIC POWER SEMICONDUCTOR MARKET, BY APPLICATION, 2021-2030 (USD THOUSAND)
TABLE 224 SWEDEN SIC POWER SEMICONDUCTOR MARKET, BY VERTICAL, 2021-2030 (USD THOUSAND)
TABLE 225 DENMARK SIC POWER SEMICONDUCTOR MARKET, BY TYPE, 2021-2030 (USD THOUSAND)
TABLE 226 DENMARK SIC POWER SEMICONDUCTOR MARKET, BY VOLTAGE RANGE, 2021-2030 (USD THOUSAND)
TABLE 227 DENMARK SIC POWER SEMICONDUCTOR MARKET, BY WAFER SIZE, 2021-2030 (USD THOUSAND)
TABLE 228 DENMARK SIC POWER SEMICONDUCTOR MARKET, BY WAFER TYPE, 2021-2030 (USD THOUSAND)
TABLE 229 DENMARK SIC POWER SEMICONDUCTOR MARKET, BY APPLICATION, 2021-2030 (USD THOUSAND)
TABLE 230 DENMARK SIC POWER SEMICONDUCTOR MARKET, BY VERTICAL, 2021-2030 (USD THOUSAND)
TABLE 231 REST OF EUROPE SIC POWER SEMICONDUCTOR MARKET, BY TYPE, 2021-2030 (USD THOUSAND)
TABLE 232 MIDDLE EAST AND AFRICA SIC POWER SEMICONDUCTOR MARKET, BY COUNTRY, 2021-2030 (USD THOUSAND)
TABLE 233 MIDDLE EAST AND AFRICA SIC POWER SEMICONDUCTOR MARKET, BY TYPE, 2021-2030 (USD THOUSAND)
TABLE 234 MIDDLE EAST AND AFRICA SIC POWER SEMICONDUCTOR MARKET, BY VOLTAGE RANGE, 2021-2030 (USD THOUSAND)
TABLE 235 MIDDLE EAST AND AFRICA SIC POWER SEMICONDUCTOR MARKET, BY WAFER SIZE, 2021-2030 (USD THOUSAND)
TABLE 236 MIDDLE EAST AND AFRICA SIC POWER SEMICONDUCTOR MARKET, BY WAFER TYPE, 2021-2030 (USD THOUSAND)
TABLE 237 MIDDLE EAST AND AFRICA SIC POWER SEMICONDUCTOR MARKET, BY APPLICATION, 2021-2030 (USD THOUSAND)
TABLE 238 MIDDLE EAST AND AFRICA SIC POWER SEMICONDUCTOR MARKET, BY VERTICAL, 2021-2030 (USD THOUSAND)
TABLE 239 ISRAEL SIC POWER SEMICONDUCTOR MARKET, BY TYPE, 2021-2030 (USD THOUSAND)
TABLE 240 ISRAEL SIC POWER SEMICONDUCTOR MARKET, BY VOLTAGE RANGE, 2021-2030 (USD THOUSAND)
TABLE 241 ISRAEL SIC POWER SEMICONDUCTOR MARKET, BY WAFER SIZE, 2021-2030 (USD THOUSAND)
TABLE 242 ISRAEL SIC POWER SEMICONDUCTOR MARKET, BY WAFER TYPE, 2021-2030 (USD THOUSAND)
TABLE 243 ISRAEL SIC POWER SEMICONDUCTOR MARKET, BY APPLICATION, 2021-2030 (USD THOUSAND)
TABLE 244 ISRAEL SIC POWER SEMICONDUCTOR MARKET, BY VERTICAL, 2021-2030 (USD THOUSAND)
TABLE 245 U.A.E. SIC POWER SEMICONDUCTOR MARKET, BY TYPE, 2021-2030 (USD THOUSAND)
TABLE 246 U.A.E. SIC POWER SEMICONDUCTOR MARKET, BY VOLTAGE RANGE, 2021-2030 (USD THOUSAND)
TABLE 247 U.A.E. SIC POWER SEMICONDUCTOR MARKET, BY WAFER SIZE, 2021-2030 (USD THOUSAND)
TABLE 248 U.A.E. SIC POWER SEMICONDUCTOR MARKET, BY WAFER TYPE, 2021-2030 (USD THOUSAND)
TABLE 249 U.A.E. SIC POWER SEMICONDUCTOR MARKET, BY APPLICATION, 2021-2030 (USD THOUSAND)
TABLE 250 U.A.E. SIC POWER SEMICONDUCTOR MARKET, BY VERTICAL, 2021-2030 (USD THOUSAND)
TABLE 251 SAUDI ARABIA SIC POWER SEMICONDUCTOR MARKET, BY TYPE, 2021-2030 (USD THOUSAND)
TABLE 252 SAUDI ARABIA SIC POWER SEMICONDUCTOR MARKET, BY VOLTAGE RANGE, 2021-2030 (USD THOUSAND)
TABLE 253 SAUDI ARABIA SIC POWER SEMICONDUCTOR MARKET, BY WAFER SIZE, 2021-2030 (USD THOUSAND)
TABLE 254 SAUDI ARABIA SIC POWER SEMICONDUCTOR MARKET, BY WAFER TYPE, 2021-2030 (USD THOUSAND)
TABLE 255 SAUDI ARABIA SIC POWER SEMICONDUCTOR MARKET, BY APPLICATION, 2021-2030 (USD THOUSAND)
TABLE 256 SAUDI ARABIA SIC POWER SEMICONDUCTOR MARKET, BY VERTICAL, 2021-2030 (USD THOUSAND)
TABLE 257 SOUTH AFRICA SIC POWER SEMICONDUCTOR MARKET, BY TYPE, 2021-2030 (USD THOUSAND)
TABLE 258 SOUTH AFRICA SIC POWER SEMICONDUCTOR MARKET, BY VOLTAGE RANGE, 2021-2030 (USD THOUSAND)
TABLE 259 SOUTH AFRICA SIC POWER SEMICONDUCTOR MARKET, BY WAFER SIZE, 2021-2030 (USD THOUSAND)
TABLE 260 SOUTH AFRICA SIC POWER SEMICONDUCTOR MARKET, BY WAFER TYPE, 2021-2030 (USD THOUSAND)
TABLE 261 SOUTH AFRICA SIC POWER SEMICONDUCTOR MARKET, BY APPLICATION, 2021-2030 (USD THOUSAND)
TABLE 262 SOUTH AFRICA SIC POWER SEMICONDUCTOR MARKET, BY VERTICAL, 2021-2030 (USD THOUSAND)
TABLE 263 EGYPT SIC POWER SEMICONDUCTOR MARKET, BY TYPE, 2021-2030 (USD THOUSAND)
TABLE 264 EGYPT SIC POWER SEMICONDUCTOR MARKET, BY VOLTAGE RANGE, 2021-2030 (USD THOUSAND)
TABLE 265 EGYPT SIC POWER SEMICONDUCTOR MARKET, BY WAFER SIZE, 2021-2030 (USD THOUSAND)
TABLE 266 EGYPT SIC POWER SEMICONDUCTOR MARKET, BY WAFER TYPE, 2021-2030 (USD THOUSAND)
TABLE 267 EGYPT SIC POWER SEMICONDUCTOR MARKET, BY APPLICATION, 2021-2030 (USD THOUSAND)
TABLE 268 EGYPT SIC POWER SEMICONDUCTOR MARKET, BY VERTICAL, 2021-2030 (USD THOUSAND)
TABLE 269 KUWAIT SIC POWER SEMICONDUCTOR MARKET, BY TYPE, 2021-2030 (USD THOUSAND)
TABLE 270 KUWAIT SIC POWER SEMICONDUCTOR MARKET, BY VOLTAGE RANGE, 2021-2030 (USD THOUSAND)
TABLE 271 KUWAIT SIC POWER SEMICONDUCTOR MARKET, BY WAFER SIZE, 2021-2030 (USD THOUSAND)
TABLE 272 KUWAIT SIC POWER SEMICONDUCTOR MARKET, BY WAFER TYPE, 2021-2030 (USD THOUSAND)
TABLE 273 KUWAIT SIC POWER SEMICONDUCTOR MARKET, BY APPLICATION, 2021-2030 (USD THOUSAND)
TABLE 274 KUWAIT SIC POWER SEMICONDUCTOR MARKET, BY VERTICAL, 2021-2030 (USD THOUSAND)
TABLE 275 QATAR SIC POWER SEMICONDUCTOR MARKET, BY TYPE, 2021-2030 (USD THOUSAND)
TABLE 276 QATAR SIC POWER SEMICONDUCTOR MARKET, BY VOLTAGE RANGE, 2021-2030 (USD THOUSAND)
TABLE 277 QATAR SIC POWER SEMICONDUCTOR MARKET, BY WAFER SIZE, 2021-2030 (USD THOUSAND)
TABLE 278 QATAR SIC POWER SEMICONDUCTOR MARKET, BY WAFER TYPE, 2021-2030 (USD THOUSAND)
TABLE 279 QATAR SIC POWER SEMICONDUCTOR MARKET, BY APPLICATION, 2021-2030 (USD THOUSAND)
TABLE 280 QATAR SIC POWER SEMICONDUCTOR MARKET, BY VERTICAL, 2021-2030 (USD THOUSAND)
TABLE 281 REST OF MIDDLE EAST AND AFRICA SIC POWER SEMICONDUCTOR MARKET, BY TYPE, 2021-2030 (USD THOUSAND)
TABLE 282 SOUTH AMERICA SIC POWER SEMICONDUCTOR MARKET, BY COUNTRY, 2021-2030 (USD THOUSAND)
TABLE 283 SOUTH AMERICA SIC POWER SEMICONDUCTOR MARKET, BY TYPE, 2021-2030 (USD THOUSAND)
TABLE 284 SOUTH AMERICA SIC POWER SEMICONDUCTOR MARKET, BY VOLTAGE RANGE, 2021-2030 (USD THOUSAND)
TABLE 285 SOUTH AMERICA SIC POWER SEMICONDUCTOR MARKET, BY WAFER SIZE, 2021-2030 (USD THOUSAND)
TABLE 286 SOUTH AMERICA SIC POWER SEMICONDUCTOR MARKET, BY WAFER TYPE, 2021-2030 (USD THOUSAND)
TABLE 287 SOUTH AMERICA SIC POWER SEMICONDUCTOR MARKET, BY APPLICATION, 2021-2030 (USD THOUSAND)
TABLE 288 SOUTH AMERICA SIC POWER SEMICONDUCTOR MARKET, BY VERTICAL, 2021-2030 (USD THOUSAND)
TABLE 289 BRAZIL SIC POWER SEMICONDUCTOR MARKET, BY TYPE, 2021-2030 (USD THOUSAND)
TABLE 290 BRAZIL SIC POWER SEMICONDUCTOR MARKET, BY VOLTAGE RANGE, 2021-2030 (USD THOUSAND)
TABLE 291 BRAZIL SIC POWER SEMICONDUCTOR MARKET, BY WAFER SIZE, 2021-2030 (USD THOUSAND)
TABLE 292 BRAZIL SIC POWER SEMICONDUCTOR MARKET, BY WAFER TYPE, 2021-2030 (USD THOUSAND)
TABLE 293 BRAZIL SIC POWER SEMICONDUCTOR MARKET, BY APPLICATION, 2021-2030 (USD THOUSAND)
TABLE 294 BRAZIL SIC POWER SEMICONDUCTOR MARKET, BY VERTICAL, 2021-2030 (USD THOUSAND)
TABLE 295 ARGENTINA SIC POWER SEMICONDUCTOR MARKET, BY TYPE, 2021-2030 (USD THOUSAND)
TABLE 296 ARGENTINA SIC POWER SEMICONDUCTOR MARKET, BY VOLTAGE RANGE, 2021-2030 (USD THOUSAND)
TABLE 297 ARGENTINA SIC POWER SEMICONDUCTOR MARKET, BY WAFER SIZE, 2021-2030 (USD THOUSAND)
TABLE 298 ARGENTINA SIC POWER SEMICONDUCTOR MARKET, BY WAFER TYPE, 2021-2030 (USD THOUSAND)
TABLE 299 ARGENTINA SIC POWER SEMICONDUCTOR MARKET, BY APPLICATION, 2021-2030 (USD THOUSAND)
TABLE 300 ARGENTINA SIC POWER SEMICONDUCTOR MARKET, BY VERTICAL, 2021-2030 (USD THOUSAND)
TABLE 301 REST OF SOUTH AMERICA SIC POWER SEMICONDUCTOR MARKET, BY TYPE, 2021-2030 (USD THOUSAND)
Lista de figuras
FIGURE 1 GLOBAL SIC POWER SEMICONDUCTOR MARKET: SEGMENTATION
FIGURE 2 GLOBAL SIC POWER SEMICONDUCTOR MARKET: DATA TRIANGULATION
FIGURE 3 GLOBAL SIC POWER SEMICONDUCTOR MARKET: DROC ANALYSIS
FIGURE 4 GLOBAL SIC POWER SEMICONDUCTOR MARKET: REGIONAL MARKET ANALYSIS
FIGURE 5 GLOBAL SIC POWER SEMICONDUCTOR MARKET: COMPANY RESEARCH ANALYSIS
FIGURE 6 GLOBAL SIC POWER SEMICONDUCTOR MARKET: INTERVIEW DEMOGRAPHICS
FIGURE 7 GLOBAL SIC POWER SEMICONDUCTOR MARKET: DBMR MARKET POSITION GRID
FIGURE 8 GLOBAL SIC POWER SEMICONDUCTOR MARKET: VENDOR SHARE ANALYSIS
FIGURE 9 GLOBAL SIC POWER SEMICONDUCTOR MARKET: MULTIVARIATE MODELLING
FIGURE 10 GLOBAL SIC POWER SEMICONDUCTOR MARKET: TYPE CURVE
FIGURE 11 GLOBAL SIC POWER SEMICONDUCTOR MARKET:MARKET APPLICATION COVERAGE GRID
FIGURE 12 GLOBAL SIC POWER SEMICONDUCTOR MARKET: SEGMENTATION
FIGURE 13 RISING PENETRATION OF ELECTRONIC VEHICLES IN THE MARKET IS EXPECTED TO DRIVE THE GLOBAL SIC POWER SEMICONDUCTOR MARKET GROWTH IN THE FORECAST PERIOD OF 2023 TO 2030
FIGURE 14 MOSFETS SEGMENT IS EXPECTED TO ACCOUNT FOR THE LARGEST SHARE OF THE GLOBAL SIC POWER SEMICONDUCTOR MARKET IN 2023 & 2030
FIGURE 15 ASIA-PACIFIC IS EXPECTED TO DOMINATE AND EUROPE IS THE FASTEST-GROWING REGION IN THE GLOBAL SIC POWER SEMICONDUCTOR MARKET IN THE FORECAST PERIOD OF 2023 TO 2030
FIGURE 16 EUROPE IS THE FASTEST GROWING MARKET FOR SIC POWER SEMICONDUCTOR MANUFACTURERS IN THE FORECAST PERIOD OF 2023 TO 2030
FIGURE 17 DRIVERS, RESTRAINTS, OPPORTUNITIES, AND CHALLENGES OF THE GLOBAL SIC POWER SEMICONDUCTOR MARKET
FIGURE 18 GLOBAL SIC POWER SEMICONDUCTOR MARKET: BY TYPE, 2022
FIGURE 19 GLOBAL SIC POWER SEMICONDUCTOR MARKET: VOLTAGE RANGE, 2022
FIGURE 20 GLOBAL SIC POWER SEMICONDUCTOR MARKET: BY WAFER SIZE, 2022
FIGURE 21 GLOBAL SIC POWER SEMICONDUCTOR MARKET: BY WAFER TYPE, 2022
FIGURE 22 GLOBAL SIC POWER SEMICONDUCTOR MARKET: BY APPLICATION, 2022
FIGURE 23 GLOBAL SIC POWER SEMICONDUCTOR MARKET: BY VERTICAL, 2022
FIGURE 24 GLOBAL SIC POWER SEMICONDUCTOR MARKET: SNAPSHOT (2022)
FIGURE 25 GLOBAL SIC POWER SEMICONDUCTOR MARKET: BY GEOGRAPHY (2022)
FIGURE 26 GLOBAL SIC POWER SEMICONDUCTOR MARKET: BY GEOGRAPHY (2023 & 2030)
FIGURE 27 GLOBAL SIC POWER SEMICONDUCTOR MARKET: BY GEOGRAPHY (2022 & 2030)
FIGURE 28 GLOBAL SIC POWER SEMICONDUCTOR MARKET: BY TYPE (2023-2030)
FIGURE 29 ASIA-PACIFIC SIC POWER SEMICONDUCTOR MARKET: SNAPSHOT (2022)
FIGURE 30 ASIA-PACIFIC SIC POWER SEMICONDUCTOR MARKET: BY COUNTRY (2022)
FIGURE 31 ASIA-PACIFIC SIC POWER SEMICONDUCTOR MARKET: BY COUNTRY (2023 & 2030)
FIGURE 32 ASIA-PACIFIC SIC POWER SEMICONDUCTOR MARKET: BY COUNTRY (2022 & 2030)
FIGURE 33 ASIA-PACIFIC SIC POWER SEMICONDUCTOR MARKET: BY TYPE (2023-2030)
FIGURE 34 NORTH AMERICA SIC POWER SEMICONDUCTOR MARKET: SNAPSHOT (2022)
FIGURE 35 NORTH AMERICA SIC POWER SEMICONDUCTOR MARKET: BY COUNTRY (2022)
FIGURE 36 NORTH AMERICA SIC POWER SEMICONDUCTOR MARKET: BY COUNTRY (2023 & 2030)
FIGURE 37 NORTH AMERICA SIC POWER SEMICONDUCTOR MARKET: BY COUNTRY (2022 & 2030)
FIGURE 38 NORTH AMERICA SIC POWER SEMICONDUCTOR MARKET: BY TYPE (2023-2030)
FIGURE 39 EUROPE SIC POWER SEMICONDUCTOR MARKET: SNAPSHOT (2022)
FIGURE 40 EUROPE SIC POWER SEMICONDUCTOR MARKET: BY COUNTRY (2022)
FIGURE 41 EUROPE SIC POWER SEMICONDUCTOR MARKET: BY COUNTRY (2023 & 2030)
FIGURE 42 EUROPE SIC POWER SEMICONDUCTOR MARKET: BY COUNTRY (2022 & 2030)
FIGURE 43 EUROPE SIC POWER SEMICONDUCTOR MARKET: BY TYPE (2023-2030)
FIGURE 44 MIDDLE EAST & AFRICA SIC POWER SEMICONDUCTOR MARKET: SNAPSHOT (2022)
FIGURE 45 MIDDLE EAST & AFRICA SIC POWER SEMICONDUCTOR MARKET: BY COUNTRY (2022)
FIGURE 46 MIDDLE EAST & AFRICA SIC POWER SEMICONDUCTOR MARKET: BY COUNTRY (2023 & 2030)
FIGURE 47 MIDDLE EAST & AFRICA SIC POWER SEMICONDUCTOR MARKET: BY COUNTRY (2022 & 2030)
FIGURE 48 MIDDLE EAST & AFRICA SIC POWER SEMICONDUCTOR MARKET: BY TYPE (2023-2030)
FIGURE 49 SOUTH AMERICA SIC POWER SEMICONDUCTOR MARKET: SNAPSHOT (2022)
FIGURE 50 SOUTH AMERICA SIC POWER SEMICONDUCTOR MARKET: BY COUNTRY (2022)
FIGURE 51 SOUTH AMERICA SIC POWER SEMICONDUCTOR MARKET: BY COUNTRY (2023 & 2030)
FIGURE 52 SOUTH AMERICA SIC POWER SEMICONDUCTOR MARKET: BY COUNTRY (2022 & 2030)
FIGURE 53 SOUTH AMERICA SIC POWER SEMICONDUCTOR MARKET: BY TYPE (2023-2030)
FIGURE 54 GLOBAL SIC POWER SEMICONDUCTOR MARKET: COMPANY SHARE 2022 (%)
FIGURE 55 NORTH AMERICA SIC POWER SEMICONDUCTOR MARKET: COMPANY SHARE 2022 (%)
FIGURE 56 EUROPE SIC POWER SEMICONDUCTOR MARKET: COMPANY SHARE 2022 (%)
FIGURE 57 ASIA-PACIFIC SIC POWER SEMICONDUCTOR MARKET: COMPANY SHARE 2022 (%)
Metodología de investigación
La recopilación de datos y el análisis del año base se realizan utilizando módulos de recopilación de datos con muestras de gran tamaño. La etapa incluye la obtención de información de mercado o datos relacionados a través de varias fuentes y estrategias. Incluye el examen y la planificación de todos los datos adquiridos del pasado con antelación. Asimismo, abarca el examen de las inconsistencias de información observadas en diferentes fuentes de información. Los datos de mercado se analizan y estiman utilizando modelos estadísticos y coherentes de mercado. Además, el análisis de la participación de mercado y el análisis de tendencias clave son los principales factores de éxito en el informe de mercado. Para obtener más información, solicite una llamada de un analista o envíe su consulta.
La metodología de investigación clave utilizada por el equipo de investigación de DBMR es la triangulación de datos, que implica la extracción de datos, el análisis del impacto de las variables de datos en el mercado y la validación primaria (experto en la industria). Los modelos de datos incluyen cuadrícula de posicionamiento de proveedores, análisis de línea de tiempo de mercado, descripción general y guía del mercado, cuadrícula de posicionamiento de la empresa, análisis de patentes, análisis de precios, análisis de participación de mercado de la empresa, estándares de medición, análisis global versus regional y de participación de proveedores. Para obtener más información sobre la metodología de investigación, envíe una consulta para hablar con nuestros expertos de la industria.
Personalización disponible
Data Bridge Market Research es líder en investigación formativa avanzada. Nos enorgullecemos de brindar servicios a nuestros clientes existentes y nuevos con datos y análisis que coinciden y se adaptan a sus objetivos. El informe se puede personalizar para incluir análisis de tendencias de precios de marcas objetivo, comprensión del mercado de países adicionales (solicite la lista de países), datos de resultados de ensayos clínicos, revisión de literatura, análisis de mercado renovado y base de productos. El análisis de mercado de competidores objetivo se puede analizar desde análisis basados en tecnología hasta estrategias de cartera de mercado. Podemos agregar tantos competidores sobre los que necesite datos en el formato y estilo de datos que esté buscando. Nuestro equipo de analistas también puede proporcionarle datos en archivos de Excel sin procesar, tablas dinámicas (libro de datos) o puede ayudarlo a crear presentaciones a partir de los conjuntos de datos disponibles en el informe.

