

Global Risk Management Market
Tamaño del mercado en miles de millones de dólares
Tasa de crecimiento anual compuesta (CAGR) :
% 
 USD
6,767.58 Million
USD
23,441.00 Million
2022
2030
USD
6,767.58 Million
USD
23,441.00 Million
2022
2030
| 2023 –2030 | |
| USD 6,767.58 Million | |
| USD 23,441.00 Million | |
| % | |
|
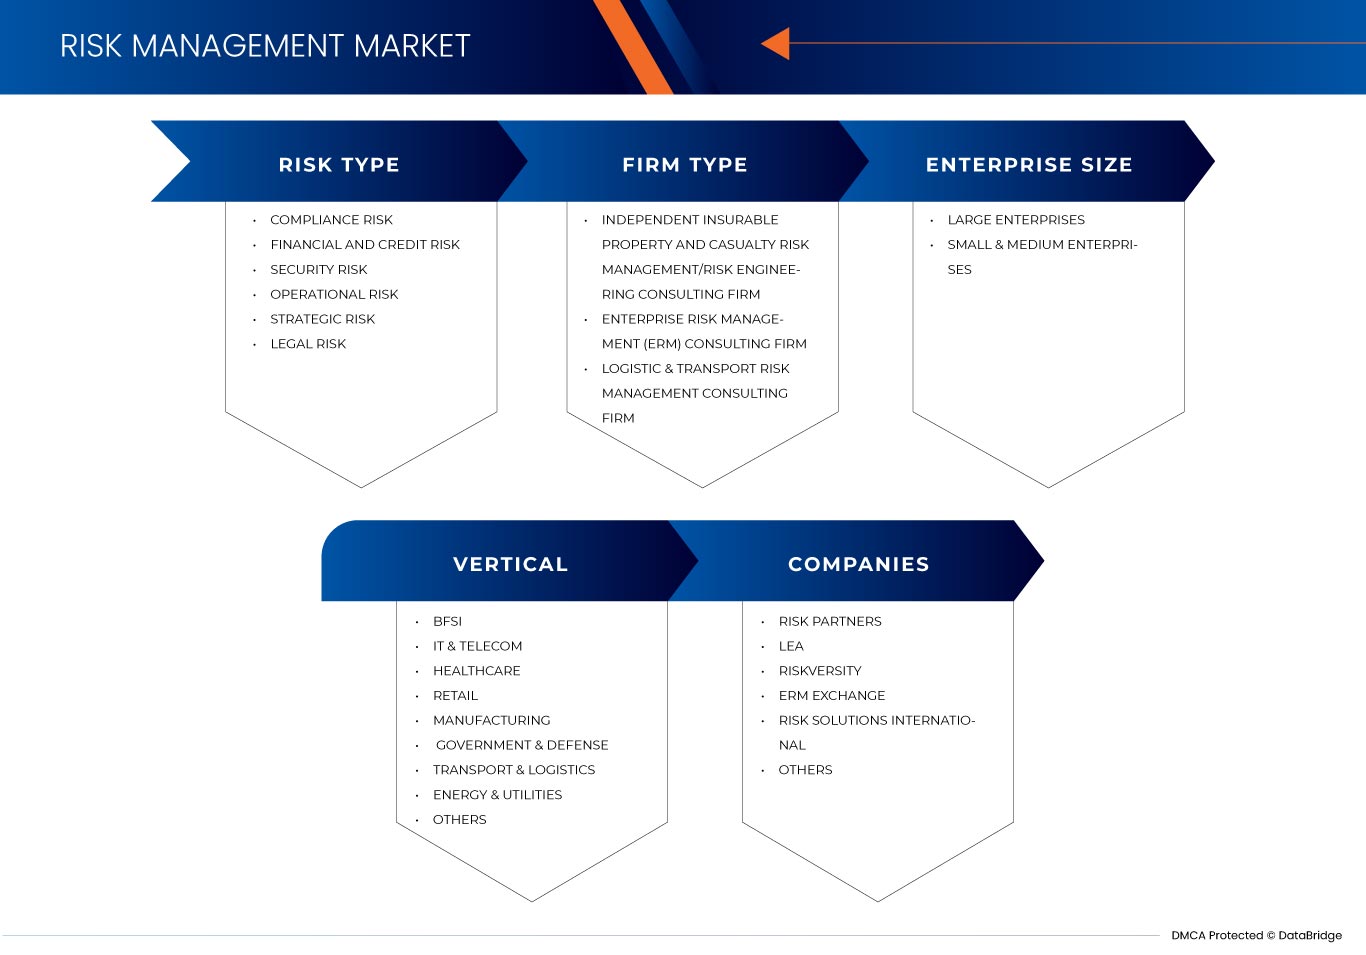
Mercado global de gestión de riesgos, por tipo de riesgo (riesgo de cumplimiento, riesgo financiero y crediticio, riesgo de seguridad, riesgo operativo, riesgo estratégico y riesgo legal), tipo de empresa (empresa consultora de gestión de riesgos empresariales (ERM), empresa consultora independiente de gestión de riesgos de propiedad y accidentes asegurables/ingeniería de riesgos y empresa consultora de gestión de riesgos logísticos y de transporte), tamaño de la empresa (grandes empresas y pequeñas y medianas empresas), vertical (BFSI, TI y telecomunicaciones, atención médica, comercio minorista, fabricación, gobierno y defensa, transporte y logística, energía y servicios públicos, y otros) - Tendencias de la industria y pronóstico hasta 2030.
Análisis y tamaño del mercado de gestión de riesgos
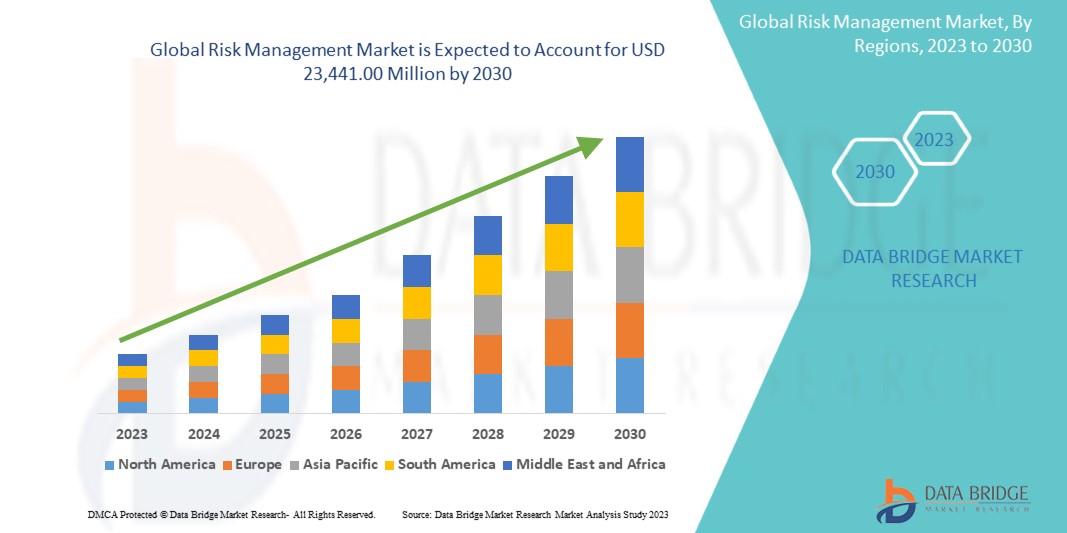
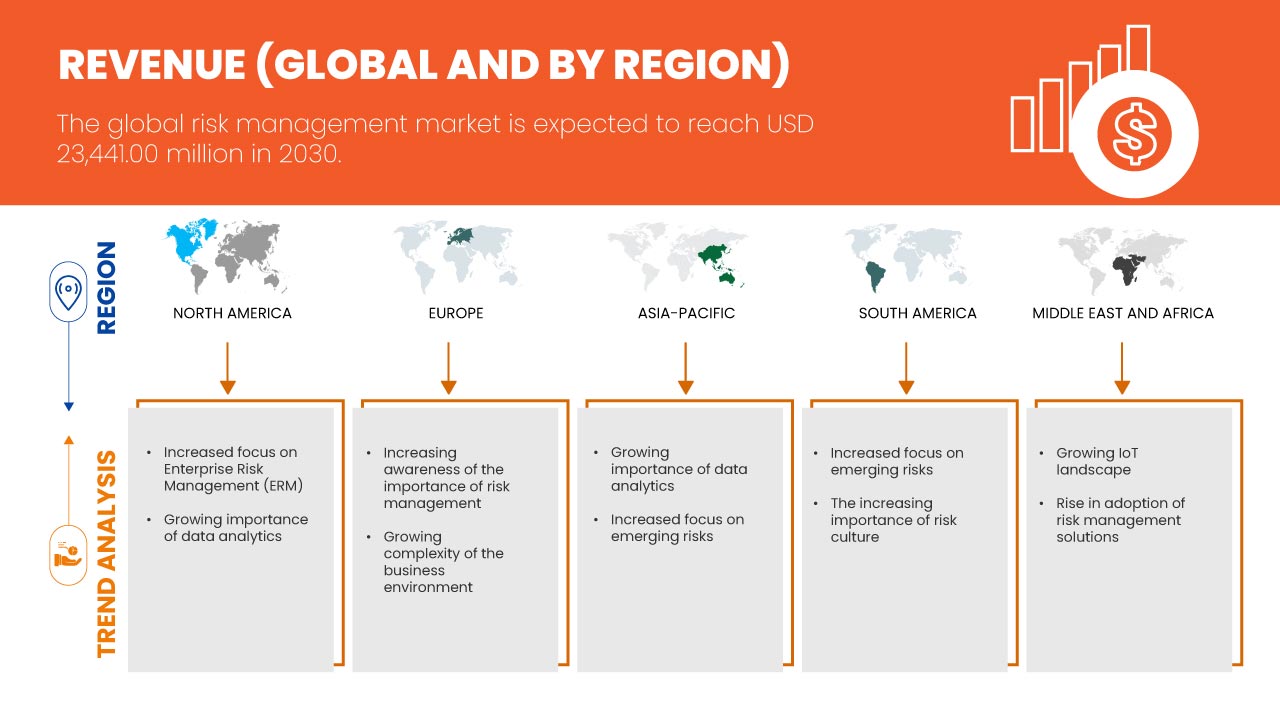
Se espera que el mercado global de gestión de riesgos gane crecimiento de mercado en el período de pronóstico de 2023 a 2030. Data Bridge Market Research analiza que el mercado está creciendo con una CAGR del 16,8% en el período de pronóstico de 2023 a 2030 y se espera que alcance los USD 23.441,00 millones para 2030. Se espera que la creciente demanda de actividades de I+D impulse el crecimiento del mercado.
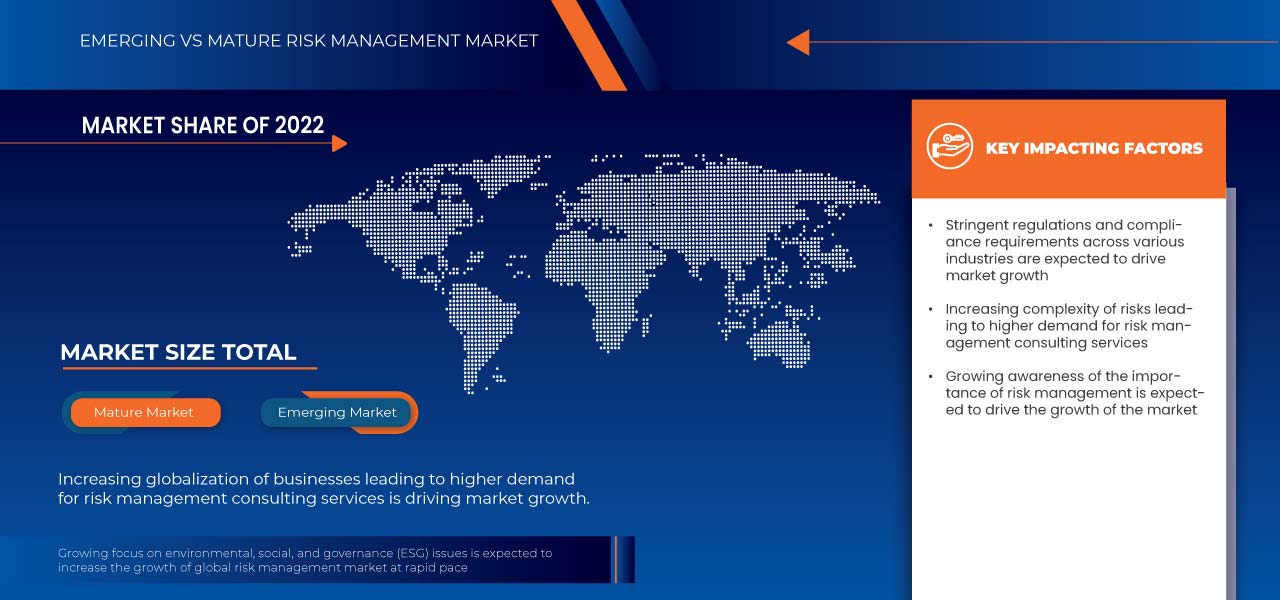
Se espera que el mercado gane crecimiento debido a la creciente complejidad de los riesgos, lo que genera una mayor demanda de servicios de consultoría en gestión de riesgos.
Este informe de mercado de gestión de riesgos global proporciona detalles de la participación de mercado, nuevos desarrollos y análisis de la cartera de productos, el impacto de los actores del mercado nacional y localizado, analiza las oportunidades en términos de bolsas de ingresos emergentes, cambios en las regulaciones del mercado, aprobaciones de productos, decisiones estratégicas, lanzamientos de productos, expansiones geográficas e innovaciones tecnológicas en el mercado. Para comprender el análisis y el escenario del mercado, contáctenos para obtener un resumen de analistas; nuestro equipo lo ayudará a crear una solución de impacto en los ingresos para lograr su objetivo deseado.
|
Métrica del informe |
Detalles |
|
Período de pronóstico |
2023 a 2030 |
|
Año base |
2022 |
|
Años históricos |
2021 (Personalizable 2015-2020) |
|
Unidades cuantitativas |
Ingresos en millones de USD |
|
Segmentos cubiertos |
Tipo de riesgo (riesgo de cumplimiento, riesgo financiero y crediticio, riesgo de seguridad, riesgo operativo, riesgo estratégico y riesgo legal), tipo de empresa (empresa consultora de gestión de riesgos empresariales (ERM), empresa consultora independiente de gestión de riesgos de propiedad y accidentes asegurables/ingeniería de riesgos y empresa consultora de gestión de riesgos logísticos y de transporte), tamaño de la empresa (grandes empresas y pequeñas y medianas empresas), vertical (BFSI, TI y telecomunicaciones, atención médica, comercio minorista, fabricación, gobierno y defensa, transporte y logística, energía y servicios públicos, y otros) |
|
Países cubiertos |
EE. UU., Canadá, México, Alemania, Francia, Reino Unido, Italia, España, Suiza, Países Bajos, Rusia, Turquía, Bélgica, resto de Europa, Japón, China, Corea del Sur, India, Australia, Singapur, Tailandia, Malasia, Indonesia, Filipinas, resto de Asia-Pacífico, Sudáfrica, Israel, Emiratos Árabes Unidos, Arabia Saudita, Egipto, resto de Medio Oriente y África, Brasil, Argentina y resto de Sudamérica. |
|
Actores del mercado cubiertos |
Risk Logic Inc, RISKPARTNER, RiskVersity, JVB & Co., Cymune, Riskinsight Consulting Pvt. Ltd, Risk Solutions International, LEA, Riskpro India Ventures Private Limited, ICON Risk, ERM EXCHANGE y CEERISK, entre otros. |
Definición del mercado de gestión de riesgos globales
El mercado global de gestión de riesgos incluye un conjunto diverso de productos, servicios y métodos destinados a ayudar a las organizaciones a identificar, evaluar y mitigar posibles amenazas a sus operaciones, activos y objetivos. Se encuentran disponibles herramientas de evaluación de riesgos, productos de seguros, instrumentos de cobertura financiera, soluciones de cumplimiento y gobernanza, medidas de ciberseguridad y servicios de asesoramiento. Su objetivo principal es permitir que las empresas e instituciones gestionen y minimicen de manera proactiva el impacto de diversos riesgos, como los financieros, operativos, estratégicos, regulatorios y técnicos, para proteger su estabilidad, reputación y éxito a largo plazo en un entorno empresarial desafiante y en constante cambio.
Dinámica del mercado de gestión de riesgos globales
En esta sección se aborda la comprensión de los factores impulsores, las ventajas, las oportunidades, las limitaciones y los desafíos del mercado. Todo esto se analiza en detalle a continuación:
Conductores
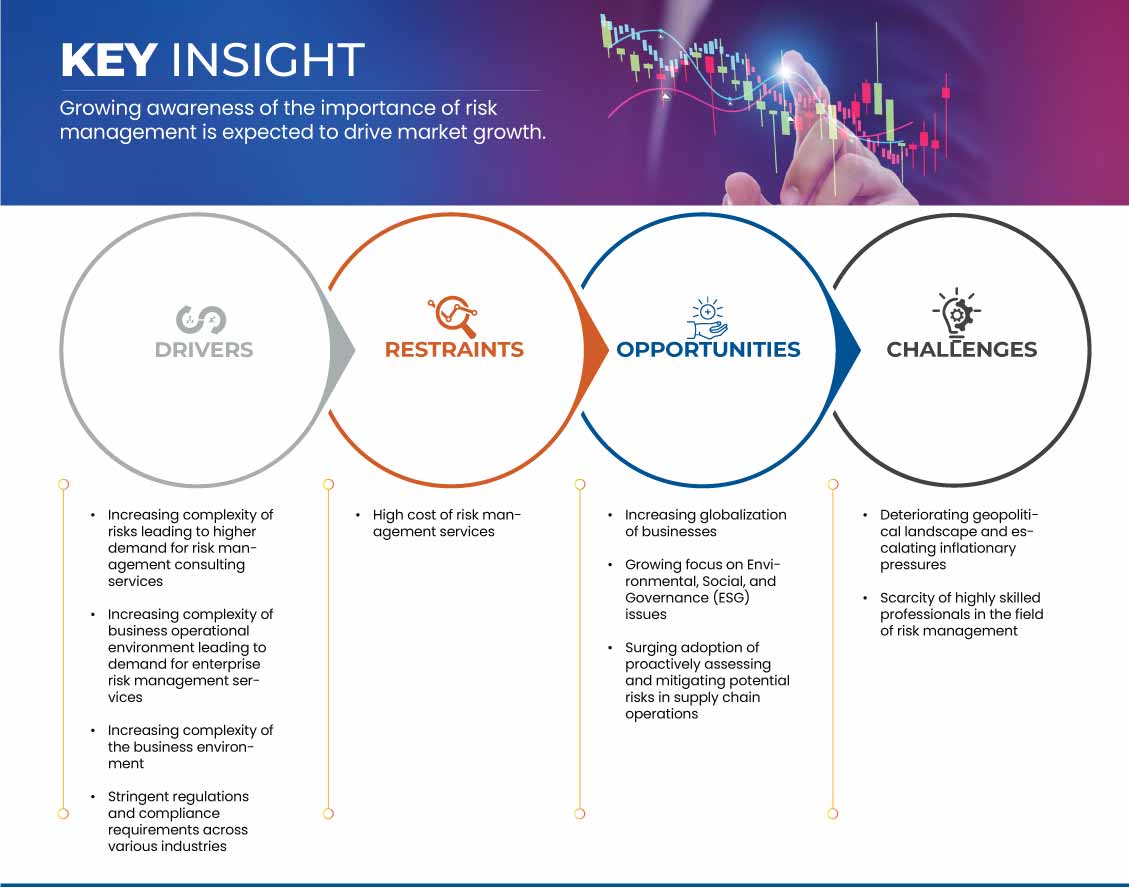
- La creciente complejidad de los riesgos genera una mayor demanda de servicios de consultoría en gestión de riesgos
En el actual entorno empresarial interconectado y en rápida evolución, las organizaciones se enfrentan a numerosos riesgos mucho más complejos y multifacéticos que en el pasado. Estos riesgos abarcan un amplio espectro, incluidos los financieros, operativos, de ciberseguridad, de cumplimiento normativo, medioambientales y de reputación, entre otros. La interacción y la superposición de estos riesgos hacen que sea esencial que las empresas adopten soluciones sofisticadas de gestión de riesgos que puedan identificar, evaluar y mitigar eficazmente estas complejidades.
- La creciente complejidad del entorno empresarial
La creciente complejidad del panorama empresarial contemporáneo es un factor determinante para el crecimiento del mercado. En el actual entorno empresarial interconectado y en rápida evolución, las organizaciones se enfrentan a una intrincada red de riesgos que abarca desafíos financieros, operativos, regulatorios, tecnológicos y de reputación. Las empresas se enfrentan a una gama cada vez mayor de posibles amenazas e incertidumbres a medida que la globalización y la digitalización siguen avanzando. Esta mayor complejidad requiere estrategias y herramientas de gestión de riesgos sofisticadas para ayudar a las empresas a identificar, evaluar y mitigar estos riesgos de manera eficaz.
Oportunidades
- La creciente globalización de las empresas
La creciente globalización de los negocios presenta una oportunidad importante para el mercado. A medida que las empresas expanden sus operaciones a través de las fronteras y participan en el comercio internacional, enfrentan riesgos más amplios y complejos, como incertidumbres geopolíticas, interrupciones en la cadena de suministro, fluctuaciones monetarias y desafíos de cumplimiento normativo.
Restricción/Desafío
- Alto costo de los servicios de gestión de riesgos
Muchas empresas, en particular las pequeñas y medianas empresas (PYME), suelen considerar que invertir en soluciones integrales de gestión de riesgos supone un desafío financiero. Estos servicios suelen requerir conocimientos especializados, tecnología sofisticada y un seguimiento constante, todo lo cual resulta sustancialmente caro. El gasto puede disuadir a las organizaciones de gestionar los riesgos de forma proactiva, dejándolas vulnerables a acontecimientos imprevistos y posibles pérdidas financieras. Como resultado, el alto coste de los servicios de gestión de riesgos supone una barrera de entrada para muchas empresas, lo que limita el potencial de crecimiento del mercado.
Desarrollo reciente
- En septiembre de 2023, CEERISK patrocinó la Semana del Arbitraje de Estambul. El patrocinio de CEERISK de la Semana del Arbitraje de Estambul demuestra su compromiso con el arbitraje y su participación en importantes debates sobre el impacto global del arbitraje. Esta participación mejoró la reputación y la visibilidad de CEERISK dentro de la comunidad jurídica y de arbitraje, lo que podría generar nuevas oportunidades comerciales, asociaciones y crecimiento.
- En septiembre de 2022, Riskpro India Ventures Private Limited obtuvo la certificación ISO 27001, lo que demuestra su compromiso de cumplir con rigurosos estándares de seguridad durante todo el proceso de certificación. Esta certificación refleja la dedicación de la organización a garantizar la seguridad y la confidencialidad de la información, lo que puede mejorar su credibilidad, confiabilidad y competitividad en el panorama empresarial.
Alcance del mercado de gestión de riesgos globales
El mercado global de gestión de riesgos se divide en cuatro segmentos importantes según el tipo de riesgo, el tipo de empresa, el tamaño de la empresa y la vertical. El crecimiento entre estos segmentos le ayudará a analizar los segmentos de crecimiento reducido de las industrias y brindará a los usuarios una valiosa descripción general del mercado y conocimientos del mercado para ayudarlos a tomar decisiones estratégicas para identificar las principales aplicaciones del mercado.
Tipo de riesgo
- Riesgo de cumplimiento
- Riesgo financiero y crediticio
- Riesgo de seguridad
- Riesgo operacional
- Riesgo estratégico
- Riesgo legal
Según el tipo de riesgo, el mercado se segmenta en riesgo de cumplimiento, riesgo financiero y crediticio, riesgo de seguridad, riesgo operacional, riesgo estratégico y riesgo legal .
Tipo de empresa
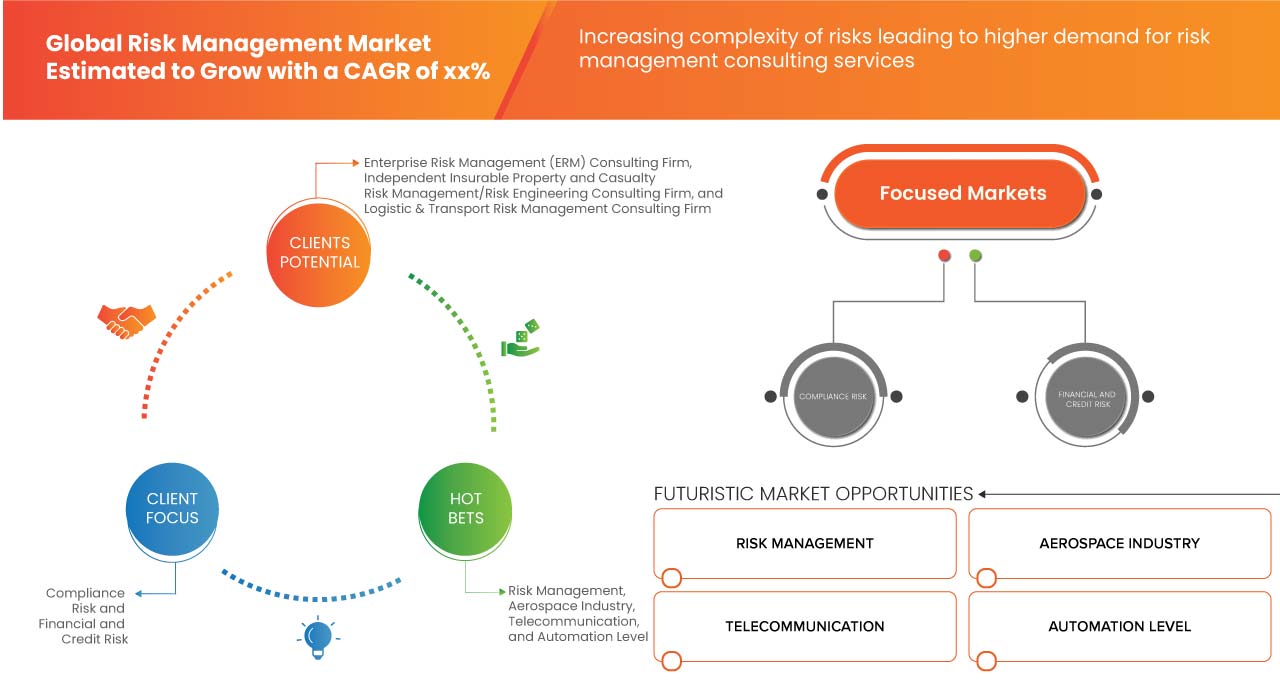
- Empresa de consultoría en gestión de riesgos empresariales (ERM)
- Empresa independiente de consultoría en gestión de riesgos de propiedad y accidentes asegurables e ingeniería de riesgos
- Consultoría en gestión de riesgos logísticos y de transporte
Sobre la base del tipo de empresa, el mercado se segmenta en empresas de consultoría de Gestión de Riesgos Empresariales (ERM), empresas de consultoría independientes de gestión de riesgos de propiedad y accidentes asegurables/ingeniería de riesgos, y empresas de consultoría de gestión de riesgos logísticos y de transporte.
Tamaño de la empresa
- Grandes empresas
- Pequeñas y medianas empresas
Según el tamaño de la empresa, el mercado se segmenta en grandes empresas y pequeñas y medianas empresas.
Vertical
- BFSI
- TI y telecomunicaciones
- Cuidado de la salud
- Minorista
- Fabricación
- Gobierno y defensa
- Transporte y Logística
- Energía y servicios públicos
- Otros
Sobre la base vertical, el mercado está segmentado en BFSI, TI y telecomunicaciones, atención médica, comercio minorista, manufactura, gobierno y defensa, transporte y logística, energía y servicios públicos, y otros.
Análisis y perspectivas regionales del mercado de gestión de riesgos globales
Se analiza el mercado global de gestión de riesgos y se proporciona información sobre el tamaño del mercado por país, tipo de riesgo, tipo de empresa, tamaño de empresa y vertical.
Los países cubiertos en el informe del mercado global de gestión de riesgos son EE. UU., Canadá, México, Alemania, Francia, Reino Unido, Italia, España, Suiza, Países Bajos, Rusia, Turquía, Bélgica, resto de Europa, Japón, China, Corea del Sur, India, Australia, Singapur, Tailandia, Malasia, Indonesia, Filipinas, resto de Asia-Pacífico, Sudáfrica, Israel, Emiratos Árabes Unidos, Arabia Saudita, Egipto, resto de Medio Oriente y África, Brasil, Argentina y el resto de América del Sur.
Se espera que Estados Unidos domine en la región de América del Norte debido a la creciente complejidad de los riesgos. Se espera que el Reino Unido domine en la región de Europa debido a la creciente complejidad del entorno empresarial y la creciente demanda de soluciones de riesgo. Se espera que China domine en la región de Asia Pacífico debido a la creciente conciencia de la importancia de la gestión de riesgos.
La sección de países del informe también proporciona factores de impacto de mercado individuales y cambios en la regulación del mercado que afectan las tendencias actuales y futuras del mercado. Los puntos de datos como el análisis de la cadena de valor ascendente y descendente, las tendencias técnicas y el análisis de las cinco fuerzas de Porter, los estudios de casos son algunos de los indicadores utilizados para pronosticar el escenario del mercado para países individuales. Además, la presencia y disponibilidad de marcas globales y sus desafíos enfrentados debido a la competencia grande o escasa de las marcas locales y nacionales, el impacto de los aranceles nacionales y las rutas comerciales se consideran al proporcionar un análisis de pronóstico de los datos del país.
Análisis del panorama competitivo y de la cuota de mercado de la gestión de riesgos globales
El panorama competitivo del mercado global de gestión de riesgos proporciona detalles por competidor. Los detalles incluidos son una descripción general de la empresa, las finanzas de la empresa, los ingresos generados, el potencial de mercado, la inversión en investigación y desarrollo, las nuevas iniciativas de mercado, la presencia global, los sitios e instalaciones de producción, las capacidades de producción, las fortalezas y debilidades de la empresa, el lanzamiento de productos, la amplitud y variedad de productos y el dominio de las aplicaciones. Los puntos de datos anteriores proporcionados solo están relacionados con el enfoque de las empresas en relación con el mercado.
Algunos de los principales actores que operan en el mercado global de gestión de riesgos son Risk Logic Inc., RISKPARTNER, RiskVersity, JVB & Co., Cymune, Riskinsight Consulting Pvt. Ltd., Risk Solutions International, LEA, Riskpro India Ventures Private Limited, ICON Risk, ERM EXCHANGE y CEERISK, entre otros.
SKU-
Obtenga acceso en línea al informe sobre la primera nube de inteligencia de mercado del mundo

- Panel de análisis de datos interactivo
- Panel de análisis de empresas para oportunidades con alto potencial de crecimiento
- Acceso de analista de investigación para personalización y consultas
- Análisis de la competencia con panel interactivo
- Últimas noticias, actualizaciones y análisis de tendencias
- Aproveche el poder del análisis de referencia para un seguimiento integral de la competencia
Tabla de contenido
1 INTRODUCTION
1.1 OBJECTIVES OF THE STUDY
1.2 MARKET DEFINITION
1.3 OVERVIEW OF THE GLOBAL RISK MANAGEMENT MARKET
1.4 CURRENCY AND PRICING
1.5 LIMITATIONS
1.6 MARKETS COVERED
2 MARKET SEGMENTATION
2.1 MARKETS COVERED
2.2 YEARS CONSIDERED FOR THE STUDY
2.3 GEOGRAPHIC SCOPE
2.4 DBMR TRIPOD DATA VALIDATION MODEL
2.5 PRIMARY INTERVIEWS WITH KEY OPINION LEADERS
2.6 DBMR MARKET POSITION GRID
2.7 MARKET APPLICATION COVERAGE GRID
2.8 VENDOR SHARE ANALYSIS
2.9 MULTIVARIATE MODELLING
2.1 RISK TYPE TIMELINE CURVE
2.11 SECONDARY SOURCES
2.12 ASSUMPTIONS
3 EXECUTIVE SUMMARY
4 PREMIUM INSIGHTS
5 MARKET OVERVIEW
5.1 DRIVERS
5.1.1 INCREASING COMPLEXITY OF RISKS LEADING TO HIGHER DEMAND FOR RISK MANAGEMENT CONSULTING SERVICES
5.1.2 GROWING AWARENESS TOWARDS RISK MANAGEMENT SERVICES
5.1.3 INCREASING COMPLEXITY OF BUSINESS OPERATIONAL ENVIRONMENT LEADING TO DEMAND FOR ENTERPRISE RISK MANAGEMENT SERVICES
5.1.4 STRINGENT REGULATIONS AND COMPLIANCE REQUIREMENTS ACROSS VARIOUS INDUSTRIES
5.2 RESTRAINTS
5.2.1 HIGH COST OF RISK MANAGEMENT SERVICES
5.3 OPPORTUNITIES
5.3.1 INCREASING GLOBALIZATION OF BUSINESSES
5.3.2 GROWING FOCUS ON ENVIRONMENTAL, SOCIAL, AND GOVERNANCE (ESG) ISSUES
5.3.3 SURGING ADOPTION OF PROACTIVELY ASSESSING AND MITIGATING POTENTIAL RISKS IN SUPPLY CHAIN OPERATIONS
5.4 CHALLENGES
5.4.1 DETERIORATING GEOPOLITICAL LANDSCAPE AND ESCALATING INFLATIONARY PRESSURES
5.4.2 SCARCITY OF HIGHLY SKILLED PROFESSIONALS IN THE FIELD OF RISK MANAGEMENT
6 GLOBAL RISK MANAGEMENT MARKET, BY RISK TYPE
6.1 OVERVIEW
6.2 COMPLIANCE RISK
6.3 FINANCIAL AND CREDIT RISK
6.4 SECURITY RISK
6.5 OPERATIONAL RISK
6.6 STRATEGIC RISK
6.7 LEGAL RISK
7 GLOBAL RISK MANAGEMENT MARKET, BY FIRM TYPE
7.1 OVERVIEW
7.2 ENTERPRISE RISK MANAGEMENT (ERM) CONSULTING FIRM
7.3 INDEPENDENT INSURABLE PROPERTY AND CASUALTY RISK MANAGEMENT/RISK ENGINEERING CONSULTING FIRM
7.4 LOGISTIC & TRANSPORT RISK MANAGEMENT CONSULTING FIRM
8 GLOBAL RISK MANAGEMENT MARKET, BY ENTERPRISE SIZE
8.1 OVERVIEW
8.2 LARGE ENTERPRISES
8.3 SMALL & MEDIUM ENTERPRISES
9 GLOBAL RISK MANAGEMENT MARKET, BY VERTICAL
9.1 OVERVIEW
9.2 BFSI
9.2.1 COMPLIANCE RISK
9.2.2 FINANCIAL AND CREDIT RISK
9.2.3 SECURITY RISK
9.2.4 OPERATIONAL RISK
9.2.5 STRATEGIC RISK
9.2.6 LEGAL RISK
9.3 IT & TELECOM
9.3.1 COMPLIANCE RISK
9.3.2 FINANCIAL AND CREDIT RISK
9.3.3 SECURITY RISK
9.3.4 OPERATIONAL RISK
9.3.5 STRATEGIC RISK
9.3.6 LEGAL RISK
9.4 HEALTHCARE
9.4.1 COMPLIANCE RISK
9.4.2 FINANCIAL AND CREDIT RISK
9.4.3 SECURITY RISK
9.4.4 OPERATIONAL RISK
9.4.5 STRATEGIC RISK
9.4.6 LEGAL RISK
9.5 RETAIL
9.5.1 COMPLIANCE RISK
9.5.2 FINANCIAL AND CREDIT RISK
9.5.3 SECURITY RISK
9.5.4 OPERATIONAL RISK
9.5.5 STRATEGIC RISK
9.5.6 LEGAL RISK
9.6 MANUFACTURING
9.6.1 COMPLIANCE RISK
9.6.2 FINANCIAL AND CREDIT RISK
9.6.3 SECURITY RISK
9.6.4 OPERATIONAL RISK
9.6.5 STRATEGIC RISK
9.6.6 LEGAL RISK
9.7 GOVERNMENT AND DEFENCE
9.7.1 COMPLIANCE RISK
9.7.2 FINANCIAL AND CREDIT RISK
9.7.3 SECURITY RISK
9.7.4 OPERATIONAL RISK
9.7.5 STRATEGIC RISK
9.7.6 LEGAL RISK
9.8 TRANSPORT AND LOGISTICS
9.8.1 COMPLIANCE RISK
9.8.2 FINANCIAL AND CREDIT RISK
9.8.3 SECURITY RISK
9.8.4 OPERATIONAL RISK
9.8.5 STRATEGIC RISK
9.8.6 LEGAL RISK
9.9 ENERGY AND UTILITIES
9.9.1 COMPLIANCE RISK
9.9.2 FINANCIAL AND CREDIT RISK
9.9.3 SECURITY RISK
9.9.4 OPERATIONAL RISK
9.9.5 STRATEGIC RISK
9.9.6 LEGAL RISK
9.1 OTHERS
10 GLOBAL RISK MANAGEMENT MARKET, BY REGION
10.1 OVERVIEW
10.2 NORTH AMERICA
10.2.1 U.S.
10.2.2 CANADA
10.2.3 MEXICO
10.3 EUROPE
10.3.1 U.K.
10.3.2 GERMANY
10.3.3 FRANCE
10.3.4 ITALY
10.3.5 SPAIN
10.3.6 NETHERLANDS
10.3.7 SWITZERLAND
10.3.8 TURKEY
10.3.9 RUSSIA
10.3.10 BELGIUM
10.3.11 DENMARK
10.3.12 SWEDEN
10.3.13 POLAND
10.3.14 NORWAY
10.3.15 FINLAND
10.3.16 REST OF EUROPE
10.4 ASIA-PACIFIC
10.4.1 CHINA
10.4.2 JAPAN
10.4.3 SOUTH KOREA
10.4.4 INDIA
10.4.5 AUSTRALIA
10.4.6 TAIWAN
10.4.7 THAILAND
10.4.8 INDONESIA
10.4.9 MALAYSIA
10.4.10 SINGAPORE
10.4.11 NEW ZEALAND
10.4.12 PHILIPPINES
10.4.13 VIETNAM
10.4.14 REST OF ASIA-PACIFIC
10.5 MIDDLE EAST AND AFRICA
10.5.1 U.A.E.
10.5.2 SAUDI ARABIA
10.5.3 QATAR
10.5.4 SOUTH AFRICA
10.5.5 EGYPT
10.5.6 ISRAEL
10.5.7 OMAN
10.5.8 KUWAIT
10.5.9 BAHRAIN
10.5.10 REST OF MIDDLE EAST AND AFRICA
10.6 SOUTH AMERICA
10.6.1 BRAZIL
10.6.2 ARGENTINA
10.6.3 REST OF SOUTH AMERICA
11 GLOBAL RISK MANAGEMENT MARKET: COMPANY LANDSCAPE
11.1 COMPANY SHARE ANALYSIS: GLOBAL
11.2 COMPANY SHARE ANALYSIS: NORTH AMERICA
11.3 COMPANY SHARE ANALYSIS: EUROPE
11.4 COMPANY SHARE ANALYSIS: ASIA-PACIFIC
12 SWOT ANALYSIS
13 COMPANY PROFILES
13.1 RISKPARTNER
13.1.1 COMPANY SNAPSHOT
13.1.2 SERVICE PORTFOLIO
13.1.3 RECENT DEVELOPMENT
13.2 LEA
13.2.1 COMPANY SNAPSHOT
13.2.2 SERVICE PORTFOLIO
13.2.3 RECENT DEVELOPMENTS
13.3 RISKVERSITY
13.3.1 COMPANY SNAPSHOT
13.3.2 SERVICE PORTFOLIO
13.3.3 RECENT DEVELOPMENT
13.4 ERM EXCHANGE
13.4.1 COMPANY SNAPSHOT
13.4.2 SERVICE PORTFOLIO
13.4.3 RECENT DEVELOPMENT
13.5 RISK SOLUTIONS INTERNATIONAL
13.5.1 COMPANY SNAPSHOT
13.5.2 SERVICE PORTFOLIO
13.5.3 RECENT DEVELOPMENTS
13.6 CEERISK
13.6.1 COMPANY SNAPSHOT
13.6.2 SERVICE PORTFOLIO
13.6.3 RECENT DEVELOPMENTS
13.7 CYMUNE
13.7.1 COMPANY SNAPSHOT
13.7.2 SERVICE PORTFOLIO
13.7.3 RECENT DEVELOPMENT
13.8 ICON RISK
13.8.1 COMPANY SNAPSHOT
13.8.2 SERVICE PORTFOLIO
13.8.3 RECENT DEVELOPMENT
13.9 JVB & CO.
13.9.1 COMPANY SNAPSHOT
13.9.2 SERVICE PORTFOLIO
13.9.3 RECENT DEVELOPMENT
13.1 RISKINSIGHT CONSULTING PVT. LTD
13.10.1 COMPANY SNAPSHOT
13.10.2 SERVICE PORTFOLIO
13.10.3 RECENT DEVELOPMENT
13.11 RISKPRO INDIA VENTURES PRIVATE LIMITED
13.11.1 COMPANY SNAPSHOT
13.11.2 SERVICE PORTFOLIO
13.11.3 RECENT DEVELOPMENT
13.12 RISK LOGIC INC.
13.12.1 COMPANY SNAPSHOT
13.12.2 SERVICE PORTFOLIO
13.12.3 RECENT DEVELOPMENT
14 QUESTIONNAIRE
15 RELATED REPORTS
Lista de Tablas
TABLE 1 GLOBAL RISK MANAGEMENT MARKET, BY RISK TYPE, 2021-2030 (USD MILLION)
TABLE 2 GLOBAL COMPLIANCE RISK IN GLOBAL RISK MANAGEMENT MARKET, BY REGION, 2021-2030 (USD MILLION)
TABLE 3 GLOBAL FINANCIAL AND CREDIT RISK IN GLOBAL RISK MANAGEMENT MARKET, BY REGION, 2021-2030 (USD MILLION)
TABLE 4 GLOBAL SECURITY RISK IN GLOBAL RISK MANAGEMENT MARKET, BY REGION, 2021-2030 (USD MILLION)
TABLE 5 GLOBAL OPERATIONAL RISK IN GLOBAL RISK MANAGEMENT MARKET, BY REGION, 2021-2030 (USD MILLION)
TABLE 6 GLOBAL STRATEGIC RISK IN GLOBAL RISK MANAGEMENT MARKET, BY REGION, 2021-2030 (USD MILLION)
TABLE 7 GLOBAL LEGAL RISK IN GLOBAL RISK MANAGEMENT MARKET, BY REGION, 2021-2030 (USD MILLION)
TABLE 8 GLOBAL RISK MANAGEMENT MARKET, BY FIRM TYPE, 2021-2030 (USD MILLION)
TABLE 9 GLOBAL ENTERPRISE RISK MANAGEMENT (ERM) CONSULTING FIRM IN GLOBAL RISK MANAGEMENT MARKET, BY REGION, 2021-2030 (USD MILLION)
TABLE 10 GLOBAL INDEPENDENT INSURABLE PROPERTY AND CASUALTY RISK MANAGEMENT/RISK ENGINEERING CONSULTING FIRM IN GLOBAL RISK MANAGEMENT MARKET, BY REGION, 2021-2030 (USD MILLION)
TABLE 11 GLOBAL LOGISTIC & TRANSPORT RISK MANAGEMENT CONSULTING FIRM IN GLOBAL RISK MANAGEMENT MARKET, BY REGION, 2021-2030 (USD MILLION)
TABLE 12 GLOBAL RISK MANAGEMENT MARKET, BY ENTERPRISE SIZE, 2021-2030 (USD MILLION)
TABLE 13 GLOBAL LARGE ENTERPRISE IN GLOBAL RISK MANAGEMENT MARKET, BY REGION, 2021-2030 (USD MILLION)
TABLE 14 GLOBAL SMALL & MEDIUM ENTERPRISES IN GLOBAL RISK MANAGEMENT MARKET, BY REGION, 2021-2030 (USD MILLION)
TABLE 15 GLOBAL RISK MANAGEMENT MARKET, BY VERTICAL, 2021-2030 (USD MILLION)
TABLE 16 GLOBAL BFSI IN GLOBAL RISK MANAGEMENT MARKET, BY REGION, 2021-2030 (USD MILLION)
TABLE 17 GLOBAL BFSI IN RISK MANAGEMENT MARKET, BY RISK TYPE, 2021-2030 (USD MILLION)
TABLE 18 GLOBAL IT & TELECOM IN GLOBAL RISK MANAGEMENT MARKET, BY REGION, 2021-2030 (USD MILLION)
TABLE 19 GLOBAL IT & TELECOM IN RISK MANAGEMENT MARKET, BY RISK TYPE, 2021-2030 (USD MILLION)
TABLE 20 GLOBAL HEALTHCARE IN GLOBAL RISK MANAGEMENT MARKET, BY REGION, 2021-2030 (USD MILLION)
TABLE 21 GLOBAL HEATHCARE IN RISK MANAGEMENT MARKET, BY RISK TYPE, 2021-2030 (USD MILLION)
TABLE 22 GLOBAL RETAIL IN GLOBAL RISK MANAGEMENT MARKET, BY REGION, 2021-2030 (USD MILLION)
TABLE 23 GLOBAL RETAIL IN RISK MANAGEMENT MARKET, BY RISK TYPE, 2021-2030 (USD MILLION)
TABLE 24 GLOBAL MANUFACTURING IN GLOBAL RISK MANAGEMENT MARKET, BY REGION, 2021-2030 (USD MILLION)
TABLE 25 GLOBAL MANUFACTURING IN RISK MANAGEMENT MARKET, BY RISK TYPE, 2021-2030 (USD MILLION)
TABLE 26 GLOBAL GOVERNMENT AND DEFENCE IN GLOBAL RISK MANAGEMENT MARKET, BY REGION, 2021-2030 (USD MILLION)
TABLE 27 GLOBAL GOVERNMENT AND DEFENCE IN RISK MANAGEMENT MARKET, BY RISK TYPE, 2021-2030 (USD MILLION)
TABLE 28 GLOBAL TRANSPORT AND LOGISTICS IN GLOBAL RISK MANAGEMENT MARKET, BY REGION, 2021-2030 (USD MILLION)
TABLE 29 GLOBAL TRANSPORT AND LOGISTICS IN RISK MANAGEMENT MARKET, BY RISK TYPE, 2021-2030 (USD MILLION)
TABLE 30 GLOBAL ENERGY AND UTILITIES IN GLOBAL RISK MANAGEMENT MARKET, BY REGION, 2021-2030 (USD MILLION)
TABLE 31 GLOBAL ENERGY AND UTILITIES IN RISK MANAGEMENT MARKET, BY RISK TYPE, 2021-2030 (USD MILLION)
TABLE 32 GLOBAL OTHERS IN GLOBAL RISK MANAGEMENT MARKET, BY REGION, 2021-2030 (USD MILLION)
TABLE 33 GLOBAL RISK MANAGEMENT MARKET, 2021-2030 (USD MILLION)
TABLE 34 NORTH AMERICA RISK MANAGEMENT MARKET, BY COUNTRY, 2021-2030 (USD MILLION)
TABLE 35 NORTH AMERICA RISK MANAGEMENT MARKET, BY RISK TYPE, 2021-2030 (USD MILLION)
TABLE 36 NORTH AMERICA RISK MANAGEMENT MARKET, BY FIRM TYPE, 2021-2030 (USD MILLION)
TABLE 37 NORTH AMERICA RISK MANAGEMENT MARKET, BY ENTERPRISE SIZE, 2021-2030 (USD MILLION)
TABLE 38 NORTH AMERICA RISK MANAGEMENT MARKET, BY VERTICAL, 2021-2030 (USD MILLION)
TABLE 39 NORTH AMERICA RISK MANAGEMENT MARKET, BY RISK TYPE, 2021-2030 (USD MILLION)
TABLE 40 NORTH AMERICA IT & TELECOM IN RISK MANAGEMENT MARKET, BY RISK TYPE, 2021-2030 (USD MILLION)
TABLE 41 NORTH AMERICA HEALTHCARE IN RISK MANAGEMENT MARKET, BY RISK TYPE, 2021-2030 (USD MILLION)
TABLE 42 NORTH AMERICA RETAIL IN RISK MANAGEMENT MARKET, BY RISK TYPE, 2021-2030 (USD MILLION)
TABLE 43 NORTH AMERICA MANUFACTURING IN RISK MANAGEMENT MARKET, BY RISK TYPE, 2021-2030 (USD MILLION)
TABLE 44 NORTH AMERICA GOVERNMENT AND DEFENCE IN RISK MANAGEMENT MARKET, BY RISK TYPE, 2021-2030 (USD MILLION)
TABLE 45 NORTH AMERICA TRANSPORT AND LOGISTIC IN RISK MANAGEMENT MARKET, BY RISK TYPE, 2021-2030 (USD MILLION)
TABLE 46 NORTH AMERICA ENERGY AND UTILITIES IN RISK MANAGEMENT MARKET, BY RISK TYPE, 2021-2030 (USD MILLION)
TABLE 47 U.S. RISK MANAGEMENT MARKET, BY RISK TYPE, 2021-2030 (USD MILLION)
TABLE 48 U.S. RISK MANAGEMENT MARKET, BY FIRM TYPE, 2021-2030 (USD MILLION)
TABLE 49 U.S. RISK MANAGEMENT MARKET, BY ENTERPRISE SIZE, 2021-2030 (USD MILLION)
TABLE 50 U.S. RISK MANAGEMENT MARKET, BY VERTICAL, 2021-2030 (USD MILLION)
TABLE 51 U.S. BFSI IN RISK MANAGEMENT MARKET, BY RISK TYPE, 2021-2030 (USD MILLION)
TABLE 52 U.S. IT & TELECOM IN RISK MANAGEMENT MARKET, BY RISK TYPE, 2021-2030 (USD MILLION)
TABLE 53 U.S. HEALTHCARE IN RISK MANAGEMENT MARKET, BY RISK TYPE, 2021-2030 (USD MILLION)
TABLE 54 U.S. RETAIL IN RISK MANAGEMENT MARKET, BY RISK TYPE, 2021-2030 (USD MILLION)
TABLE 55 U.S. MANUFACTURING IN RISK MANAGEMENT MARKET, BY RISK TYPE, 2021-2030 (USD MILLION)
TABLE 56 U.S. GOVERNMENT AND DEFENCE IN RISK MANAGEMENT MARKET, BY RISK TYPE, 2021-2030 (USD MILLION)
TABLE 57 U.S. TRANSPORT AND LOGISTIC IN RISK MANAGEMENT MARKET, BY RISK TYPE, 2021-2030 (USD MILLION)
TABLE 58 U.S. ENERGY AND UTILITIES IN RISK MANAGEMENT MARKET, BY RISK TYPE, 2021-2030 (USD MILLION)
TABLE 59 CANADA RISK MANAGEMENT MARKET, BY RISK TYPE, 2021-2030 (USD MILLION)
TABLE 60 CANADA RISK MANAGEMENT MARKET, BY FIRM TYPE, 2021-2030 (USD MILLION)
TABLE 61 CANADA RISK MANAGEMENT MARKET, BY ENTERPRISE SIZE, 2021-2030 (USD MILLION)
TABLE 62 CANADA RISK MANAGEMENT MARKET, BY VERTICAL, 2021-2030 (USD MILLION)
TABLE 63 CANADA BFSI IN RISK MANAGEMENT MARKET, BY RISK TYPE, 2021-2030 (USD MILLION)
TABLE 64 CANADA IT & TELECOM IN RISK MANAGEMENT MARKET, BY RISK TYPE, 2021-2030 (USD MILLION)
TABLE 65 CANADA HEALTHCARE IN RISK MANAGEMENT MARKET, BY RISK TYPE, 2021-2030 (USD MILLION)
TABLE 66 CANADA RETAIL IN RISK MANAGEMENT MARKET, BY RISK TYPE, 2021-2030 (USD MILLION)
TABLE 67 CANADA MANUFACTURING IN RISK MANAGEMENT MARKET, BY RISK TYPE, 2021-2030 (USD MILLION)
TABLE 68 CANADA GOVERNMENT AND DEFENCE IN RISK MANAGEMENT MARKET, BY RISK TYPE, 2021-2030 (USD MILLION)
TABLE 69 CANADA TRANSPORT AND LOGISTIC IN RISK MANAGEMENT MARKET, BY RISK TYPE, 2021-2030 (USD MILLION)
TABLE 70 CANADA ENERGY AND UTILITIES IN RISK MANAGEMENT MARKET, BY RISK TYPE, 2021-2030 (USD MILLION)
TABLE 71 MEXICO RISK MANAGEMENT MARKET, BY RISK TYPE, 2021-2030 (USD MILLION)
TABLE 72 MEXICO RISK MANAGEMENT MARKET, BY FIRM TYPE, 2021-2030 (USD MILLION)
TABLE 73 MEXICO RISK MANAGEMENT MARKET, BY ENTERPRISE SIZE, 2021-2030 (USD MILLION)
TABLE 74 MEXICO RISK MANAGEMENT MARKET, BY VERTICAL, 2021-2030 (USD MILLION)
TABLE 75 MEXICO BFSI IN RISK MANAGEMENT MARKET, BY RISK TYPE, 2021-2030 (USD MILLION)
TABLE 76 MEXICO IT & TELECOM IN RISK MANAGEMENT MARKET, BY RISK TYPE, 2021-2030 (USD MILLION)
TABLE 77 MEXICO HEALTHCARE IN RISK MANAGEMENT MARKET, BY RISK TYPE, 2021-2030 (USD MILLION)
TABLE 78 MEXICO RETAIL IN RISK MANAGEMENT MARKET, BY RISK TYPE, 2021-2030 (USD MILLION)
TABLE 79 MEXICO MANUFACTURING IN RISK MANAGEMENT MARKET, BY RISK TYPE, 2021-2030 (USD MILLION)
TABLE 80 MEXICO GOVERNMENT AND DEFENCE IN RISK MANAGEMENT MARKET, BY RISK TYPE, 2021-2030 (USD MILLION)
TABLE 81 MEXICO TRANSPORT AND LOGISTIC IN RISK MANAGEMENT MARKET, BY RISK TYPE, 2021-2030 (USD MILLION)
TABLE 82 MEXICO ENERGY AND UTILITIES IN RISK MANAGEMENT MARKET, BY RISK TYPE, 2021-2030 (USD MILLION)
TABLE 83 EUROPE RISK MANAGEMENT MARKET, BY COUNTRY, 2021-2030 (USD MILLION)
TABLE 84 EUROPE RISK MANAGEMENT MARKET, BY RISK TYPE, 2021-2030 (USD MILLION)
TABLE 85 EUROPE RISK MANAGEMENT MARKET, BY FIRM TYPE, 2021-2030 (USD MILLION)
TABLE 86 EUROPE RISK MANAGEMENT MARKET, BY ENTERPRISE SIZE, 2021-2030 (USD MILLION)
TABLE 87 EUROPE RISK MANAGEMENT MARKET, BY VERTICAL, 2021-2030 (USD MILLION)
TABLE 88 EUROPE BFSI IN RISK MANAGEMENT MARKET, BY RISK TYPE, 2021-2030 (USD MILLION)
TABLE 89 EUROPE IT & TELECOM IN RISK MANAGEMENT MARKET, BY RISK TYPE, 2021-2030 (USD MILLION)
TABLE 90 EUROPE HEALTHCARE IN RISK MANAGEMENT MARKET, BY RISK TYPE, 2021-2030 (USD MILLION)
TABLE 91 EUROPE RETAIL IN RISK MANAGEMENT MARKET, BY RISK TYPE, 2021-2030 (USD MILLION)
TABLE 92 EUROPE MANUFACTURING IN RISK MANAGEMENT MARKET, BY RISK TYPE, 2021-2030 (USD MILLION)
TABLE 93 EUROPE GOVERNMENT AND DEFENCE IN RISK MANAGEMENT MARKET, BY RISK TYPE, 2021-2030 (USD MILLION)
TABLE 94 EUROPE TRANSPORT AND LOGISTIC IN RISK MANAGEMENT MARKET, BY RISK TYPE, 2021-2030 (USD MILLION)
TABLE 95 EUROPE ENERGY AND UTILITIES IN RISK MANAGEMENT MARKET, BY RISK TYPE, 2021-2030 (USD MILLION)
TABLE 96 U.K. RISK MANAGEMENT MARKET, BY RISK TYPE, 2021-2030 (USD MILLION)
TABLE 97 U.K. RISK MANAGEMENT MARKET, BY FIRM TYPE, 2021-2030 (USD MILLION)
TABLE 98 U.K. RISK MANAGEMENT MARKET, BY ENTERPRISE SIZE, 2021-2030 (USD MILLION)
TABLE 99 U.K. RISK MANAGEMENT MARKET, BY VERTICAL, 2021-2030 (USD MILLION)
TABLE 100 U.K. BFSI IN RISK MANAGEMENT MARKET, BY RISK TYPE, 2021-2030 (USD MILLION)
TABLE 101 U.K. IT & TELECOM IN RISK MANAGEMENT MARKET, BY RISK TYPE, 2021-2030 (USD MILLION)
TABLE 102 U.K. HEALTHCARE IN RISK MANAGEMENT MARKET, BY RISK TYPE, 2021-2030 (USD MILLION)
TABLE 103 U.K. RETAIL IN RISK MANAGEMENT MARKET, BY RISK TYPE, 2021-2030 (USD MILLION)
TABLE 104 U.K. MANUFACTURING IN RISK MANAGEMENT MARKET, BY RISK TYPE, 2021-2030 (USD MILLION)
TABLE 105 U.K. GOVERNMENT AND DEFENCE IN RISK MANAGEMENT MARKET, BY RISK TYPE, 2021-2030 (USD MILLION)
TABLE 106 U.K. TRANSPORT AND LOGISTIC IN RISK MANAGEMENT MARKET, BY RISK TYPE, 2021-2030 (USD MILLION)
TABLE 107 U.K. ENERGY AND UTILITIES IN RISK MANAGEMENT MARKET, BY RISK TYPE, 2021-2030 (USD MILLION)
TABLE 108 GERMANY RISK MANAGEMENT MARKET, BY RISK TYPE, 2021-2030 (USD MILLION)
TABLE 109 GERMANY RISK MANAGEMENT MARKET, BY FIRM TYPE, 2021-2030 (USD MILLION)
TABLE 110 GERMANY RISK MANAGEMENT MARKET, BY ENTERPRISE SIZE, 2021-2030 (USD MILLION)
TABLE 111 GERMANY RISK MANAGEMENT MARKET, BY VERTICAL, 2021-2030 (USD MILLION)
TABLE 112 GERMANY BFSI IN RISK MANAGEMENT MARKET, BY RISK TYPE, 2021-2030 (USD MILLION)
TABLE 113 GERMANY IT & TELECOM IN RISK MANAGEMENT MARKET, BY RISK TYPE, 2021-2030 (USD MILLION)
TABLE 114 GERMANY HEALTHCARE IN RISK MANAGEMENT MARKET, BY RISK TYPE, 2021-2030 (USD MILLION)
TABLE 115 GERMANY RETAIL IN RISK MANAGEMENT MARKET, BY RISK TYPE, 2021-2030 (USD MILLION)
TABLE 116 GERMANY MANUFACTURING IN RISK MANAGEMENT MARKET, BY RISK TYPE, 2021-2030 (USD MILLION)
TABLE 117 GERMANY GOVERNMENT AND DEFENCE IN RISK MANAGEMENT MARKET, BY RISK TYPE, 2021-2030 (USD MILLION)
TABLE 118 GERMANY TRANSPORT AND LOGISTIC IN RISK MANAGEMENT MARKET, BY RISK TYPE, 2021-2030 (USD MILLION)
TABLE 119 GERMANY ENERGY AND UTILITIES IN RISK MANAGEMENT MARKET, BY RISK TYPE, 2021-2030 (USD MILLION)
TABLE 120 FRANCE RISK MANAGEMENT MARKET, BY RISK TYPE, 2021-2030 (USD MILLION)
TABLE 121 FRANCE RISK MANAGEMENT MARKET, BY FIRM TYPE, 2021-2030 (USD MILLION)
TABLE 122 FRANCE RISK MANAGEMENT MARKET, BY ENTERPRISE SIZE, 2021-2030 (USD MILLION)
TABLE 123 FRANCE RISK MANAGEMENT MARKET, BY VERTICAL, 2021-2030 (USD MILLION)
TABLE 124 FRANCE BFSI IN RISK MANAGEMENT MARKET, BY RISK TYPE, 2021-2030 (USD MILLION)
TABLE 125 FRANCE IT & TELECOM IN RISK MANAGEMENT MARKET, BY RISK TYPE, 2021-2030 (USD MILLION)
TABLE 126 FRANCE HEALTHCARE IN RISK MANAGEMENT MARKET, BY RISK TYPE, 2021-2030 (USD MILLION)
TABLE 127 FRANCE RETAIL IN RISK MANAGEMENT MARKET, BY RISK TYPE, 2021-2030 (USD MILLION)
TABLE 128 FRANCE MANUFACTURING IN RISK MANAGEMENT MARKET, BY RISK TYPE, 2021-2030 (USD MILLION)
TABLE 129 FRANCE GOVERNMENT AND DEFENCE IN RISK MANAGEMENT MARKET, BY RISK TYPE, 2021-2030 (USD MILLION)
TABLE 130 FRANCE TRANSPORT AND LOGISTIC IN RISK MANAGEMENT MARKET, BY RISK TYPE, 2021-2030 (USD MILLION)
TABLE 131 FRANCE ENERGY AND UTILITIES IN RISK MANAGEMENT MARKET, BY RISK TYPE, 2021-2030 (USD MILLION)
TABLE 132 ITALY RISK MANAGEMENT MARKET, BY RISK TYPE, 2021-2030 (USD MILLION)
TABLE 133 ITALY RISK MANAGEMENT MARKET, BY FIRM TYPE, 2021-2030 (USD MILLION)
TABLE 134 ITALY RISK MANAGEMENT MARKET, BY ENTERPRISE SIZE, 2021-2030 (USD MILLION)
TABLE 135 ITALY RISK MANAGEMENT MARKET, BY VERTICAL, 2021-2030 (USD MILLION)
TABLE 136 ITALY BFSI IN RISK MANAGEMENT MARKET, BY RISK TYPE, 2021-2030 (USD MILLION)
TABLE 137 ITALY IT & TELECOM IN RISK MANAGEMENT MARKET, BY RISK TYPE, 2021-2030 (USD MILLION)
TABLE 138 ITALY HEALTHCARE IN RISK MANAGEMENT MARKET, BY RISK TYPE, 2021-2030 (USD MILLION)
TABLE 139 ITALY RETAIL IN RISK MANAGEMENT MARKET, BY RISK TYPE, 2021-2030 (USD MILLION)
TABLE 140 ITALY MANUFACTURING IN RISK MANAGEMENT MARKET, BY RISK TYPE, 2021-2030 (USD MILLION)
TABLE 141 ITALY GOVERNMENT AND DEFENCE IN RISK MANAGEMENT MARKET, BY RISK TYPE, 2021-2030 (USD MILLION)
TABLE 142 ITALY TRANSPORT AND LOGISTIC IN RISK MANAGEMENT MARKET, BY RISK TYPE, 2021-2030 (USD MILLION)
TABLE 143 ITALY ENERGY AND UTILITIES IN RISK MANAGEMENT MARKET, BY RISK TYPE, 2021-2030 (USD MILLION)
TABLE 144 SPAIN RISK MANAGEMENT MARKET, BY RISK TYPE, 2021-2030 (USD MILLION)
TABLE 145 SPAIN RISK MANAGEMENT MARKET, BY FIRM TYPE, 2021-2030 (USD MILLION)
TABLE 146 SPAIN RISK MANAGEMENT MARKET, BY ENTERPRISE SIZE, 2021-2030 (USD MILLION)
TABLE 147 SPAIN RISK MANAGEMENT MARKET, BY VERTICAL, 2021-2030 (USD MILLION)
TABLE 148 SPAIN BFSI IN RISK MANAGEMENT MARKET, BY RISK TYPE, 2021-2030 (USD MILLION)
TABLE 149 SPAIN IT & TELECOM IN RISK MANAGEMENT MARKET, BY RISK TYPE, 2021-2030 (USD MILLION)
TABLE 150 SPAIN HEALTHCARE IN RISK MANAGEMENT MARKET, BY RISK TYPE, 2021-2030 (USD MILLION)
TABLE 151 SPAIN RETAIL IN RISK MANAGEMENT MARKET, BY RISK TYPE, 2021-2030 (USD MILLION)
TABLE 152 SPAIN MANUFACTURING IN RISK MANAGEMENT MARKET, BY RISK TYPE, 2021-2030 (USD MILLION)
TABLE 153 SPAIN GOVERNMENT AND DEFENCE IN RISK MANAGEMENT MARKET, BY RISK TYPE, 2021-2030 (USD MILLION)
TABLE 154 SPAIN TRANSPORT AND LOGISTIC IN RISK MANAGEMENT MARKET, BY RISK TYPE, 2021-2030 (USD MILLION)
TABLE 155 SPAIN ENERGY AND UTILITIES IN RISK MANAGEMENT MARKET, BY RISK TYPE, 2021-2030 (USD MILLION)
TABLE 156 NETHERLANDS RISK MANAGEMENT MARKET, BY RISK TYPE, 2021-2030 (USD MILLION)
TABLE 157 NETHERLANDS RISK MANAGEMENT MARKET, BY FIRM TYPE, 2021-2030 (USD MILLION)
TABLE 158 NETHERLANDS RISK MANAGEMENT MARKET, BY ENTERPRISE SIZE, 2021-2030 (USD MILLION)
TABLE 159 NETHERLANDS RISK MANAGEMENT MARKET, BY VERTICAL, 2021-2030 (USD MILLION)
TABLE 160 NETHERLANDS BFSI IN RISK MANAGEMENT MARKET, BY RISK TYPE, 2021-2030 (USD MILLION)
TABLE 161 NETHERLANDS IT & TELECOM IN RISK MANAGEMENT MARKET, BY RISK TYPE, 2021-2030 (USD MILLION)
TABLE 162 NETHERLANDS HEALTHCARE IN RISK MANAGEMENT MARKET, BY RISK TYPE, 2021-2030 (USD MILLION)
TABLE 163 NETHERLANDS RETAIL IN RISK MANAGEMENT MARKET, BY RISK TYPE, 2021-2030 (USD MILLION)
TABLE 164 NETHERLANDS MANUFACTURING IN RISK MANAGEMENT MARKET, BY RISK TYPE, 2021-2030 (USD MILLION)
TABLE 165 NETHERLANDS GOVERNMENT AND DEFENCE IN RISK MANAGEMENT MARKET, BY RISK TYPE, 2021-2030 (USD MILLION)
TABLE 166 NETHERLANDS TRANSPORT AND LOGISTIC IN RISK MANAGEMENT MARKET, BY RISK TYPE, 2021-2030 (USD MILLION)
TABLE 167 NETHERLANDS ENERGY AND UTILITIES IN RISK MANAGEMENT MARKET, BY RISK TYPE, 2021-2030 (USD MILLION)
TABLE 168 SWITZERLAND RISK MANAGEMENT MARKET, BY RISK TYPE, 2021-2030 (USD MILLION)
TABLE 169 SWITZERLAND RISK MANAGEMENT MARKET, BY FIRM TYPE, 2021-2030 (USD MILLION)
TABLE 170 SWITZERLAND RISK MANAGEMENT MARKET, BY ENTERPRISE SIZE, 2021-2030 (USD MILLION)
TABLE 171 SWITZERLAND RISK MANAGEMENT MARKET, BY VERTICAL, 2021-2030 (USD MILLION)
TABLE 172 SWITZERLAND BFSI IN RISK MANAGEMENT MARKET, BY RISK TYPE, 2021-2030 (USD MILLION)
TABLE 173 SWITZERLAND IT & TELECOM IN RISK MANAGEMENT MARKET, BY RISK TYPE, 2021-2030 (USD MILLION)
TABLE 174 SWITZERLAND HEALTHCARE IN RISK MANAGEMENT MARKET, BY RISK TYPE, 2021-2030 (USD MILLION)
TABLE 175 SWITZERLAND RETAIL IN RISK MANAGEMENT MARKET, BY RISK TYPE, 2021-2030 (USD MILLION)
TABLE 176 SWITZERLAND MANUFACTURING IN RISK MANAGEMENT MARKET, BY RISK TYPE, 2021-2030 (USD MILLION)
TABLE 177 SWITZERLAND GOVERNMENT AND DEFENCE IN RISK MANAGEMENT MARKET, BY RISK TYPE, 2021-2030 (USD MILLION)
TABLE 178 SWITZERLAND TRANSPORT AND LOGISTIC IN RISK MANAGEMENT MARKET, BY RISK TYPE, 2021-2030 (USD MILLION)
TABLE 179 SWITZERLAND ENERGY AND UTILITIES IN RISK MANAGEMENT MARKET, BY RISK TYPE, 2021-2030 (USD MILLION)
TABLE 180 TURKEY RISK MANAGEMENT MARKET, BY RISK TYPE, 2021-2030 (USD MILLION)
TABLE 181 TURKEY RISK MANAGEMENT MARKET, BY FIRM TYPE, 2021-2030 (USD MILLION)
TABLE 182 TURKEY RISK MANAGEMENT MARKET, BY ENTERPRISE SIZE, 2021-2030 (USD MILLION)
TABLE 183 TURKEY RISK MANAGEMENT MARKET, BY VERTICAL, 2021-2030 (USD MILLION)
TABLE 184 TURKEY BFSI IN RISK MANAGEMENT MARKET, BY RISK TYPE, 2021-2030 (USD MILLION)
TABLE 185 TURKEY IT & TELECOM IN RISK MANAGEMENT MARKET, BY RISK TYPE, 2021-2030 (USD MILLION)
TABLE 186 TURKEY HEALTHCARE IN RISK MANAGEMENT MARKET, BY RISK TYPE, 2021-2030 (USD MILLION)
TABLE 187 TURKEY RETAIL IN RISK MANAGEMENT MARKET, BY RISK TYPE, 2021-2030 (USD MILLION)
TABLE 188 TURKEY MANUFACTURING IN RISK MANAGEMENT MARKET, BY RISK TYPE, 2021-2030 (USD MILLION)
TABLE 189 TURKEY GOVERNMENT AND DEFENCE IN RISK MANAGEMENT MARKET, BY RISK TYPE, 2021-2030 (USD MILLION)
TABLE 190 TURKEY TRANSPORT AND LOGISTIC IN RISK MANAGEMENT MARKET, BY RISK TYPE, 2021-2030 (USD MILLION)
TABLE 191 TURKEY ENERGY AND UTILITIES IN RISK MANAGEMENT MARKET, BY RISK TYPE, 2021-2030 (USD MILLION)
TABLE 192 RUSSIA RISK MANAGEMENT MARKET, BY RISK TYPE, 2021-2030 (USD MILLION)
TABLE 193 RUSSIA RISK MANAGEMENT MARKET, BY FIRM TYPE, 2021-2030 (USD MILLION)
TABLE 194 RUSSIA RISK MANAGEMENT MARKET, BY ENTERPRISE SIZE, 2021-2030 (USD MILLION)
TABLE 195 RUSSIA RISK MANAGEMENT MARKET, BY VERTICAL, 2021-2030 (USD MILLION)
TABLE 196 RUSSIA BFSI IN RISK MANAGEMENT MARKET, BY RISK TYPE, 2021-2030 (USD MILLION)
TABLE 197 RUSSIA IT & TELECOM IN RISK MANAGEMENT MARKET, BY RISK TYPE, 2021-2030 (USD MILLION)
TABLE 198 RUSSIA HEALTHCARE IN RISK MANAGEMENT MARKET, BY RISK TYPE, 2021-2030 (USD MILLION)
TABLE 199 RUSSIA RETAIL IN RISK MANAGEMENT MARKET, BY RISK TYPE, 2021-2030 (USD MILLION)
TABLE 200 RUSSIA MANUFACTURING IN RISK MANAGEMENT MARKET, BY RISK TYPE, 2021-2030 (USD MILLION)
TABLE 201 RUSSIA GOVERNMENT AND DEFENCE IN RISK MANAGEMENT MARKET, BY RISK TYPE, 2021-2030 (USD MILLION)
TABLE 202 RUSSIA TRANSPORT AND LOGISTIC IN RISK MANAGEMENT MARKET, BY RISK TYPE, 2021-2030 (USD MILLION)
TABLE 203 RUSSIA ENERGY AND UTILITIES IN RISK MANAGEMENT MARKET, BY RISK TYPE, 2021-2030 (USD MILLION)
TABLE 204 BELGIUM RISK MANAGEMENT MARKET, BY RISK TYPE, 2021-2030 (USD MILLION)
TABLE 205 BELGIUM RISK MANAGEMENT MARKET, BY FIRM TYPE, 2021-2030 (USD MILLION)
TABLE 206 BELGIUM RISK MANAGEMENT MARKET, BY ENTERPRISE SIZE, 2021-2030 (USD MILLION)
TABLE 207 BELGIUM RISK MANAGEMENT MARKET, BY VERTICAL, 2021-2030 (USD MILLION)
TABLE 208 BELGIUM BFSI IN RISK MANAGEMENT MARKET, BY RISK TYPE, 2021-2030 (USD MILLION)
TABLE 209 BELGIUM IT & TELECOM IN RISK MANAGEMENT MARKET, BY RISK TYPE, 2021-2030 (USD MILLION)
TABLE 210 BELGIUM HEALTHCARE IN RISK MANAGEMENT MARKET, BY RISK TYPE, 2021-2030 (USD MILLION)
TABLE 211 BELGIUM RETAIL IN RISK MANAGEMENT MARKET, BY RISK TYPE, 2021-2030 (USD MILLION)
TABLE 212 BELGIUM MANUFACTURING IN RISK MANAGEMENT MARKET, BY RISK TYPE, 2021-2030 (USD MILLION)
TABLE 213 BELGIUM GOVERNMENT AND DEFENCE IN RISK MANAGEMENT MARKET, BY RISK TYPE, 2021-2030 (USD MILLION)
TABLE 214 BELGIUM TRANSPORT AND LOGISTIC IN RISK MANAGEMENT MARKET, BY RISK TYPE, 2021-2030 (USD MILLION)
TABLE 215 BELGIUM ENERGY AND UTILITIES IN RISK MANAGEMENT MARKET, BY RISK TYPE, 2021-2030 (USD MILLION)
TABLE 216 DENMARK RISK MANAGEMENT MARKET, BY RISK TYPE, 2021-2030 (USD MILLION)
TABLE 217 DENMARK RISK MANAGEMENT MARKET, BY FIRM TYPE, 2021-2030 (USD MILLION)
TABLE 218 DENMARK RISK MANAGEMENT MARKET, BY ENTERPRISE SIZE, 2021-2030 (USD MILLION)
TABLE 219 DENMARK RISK MANAGEMENT MARKET, BY VERTICAL, 2021-2030 (USD MILLION)
TABLE 220 DENMARK BFSI IN RISK MANAGEMENT MARKET, BY RISK TYPE, 2021-2030 (USD MILLION)
TABLE 221 DENMARK IT & TELECOM IN RISK MANAGEMENT MARKET, BY RISK TYPE, 2021-2030 (USD MILLION)
TABLE 222 DENMARK HEALTHCARE IN RISK MANAGEMENT MARKET, BY RISK TYPE, 2021-2030 (USD MILLION)
TABLE 223 DENMARK RETAIL IN RISK MANAGEMENT MARKET, BY RISK TYPE, 2021-2030 (USD MILLION)
TABLE 224 DENMARK MANUFACTURING IN RISK MANAGEMENT MARKET, BY RISK TYPE, 2021-2030 (USD MILLION)
TABLE 225 DENMARK GOVERNMENT AND DEFENCE IN RISK MANAGEMENT MARKET, BY RISK TYPE, 2021-2030 (USD MILLION)
TABLE 226 DENMARK TRANSPORT AND LOGISTIC IN RISK MANAGEMENT MARKET, BY RISK TYPE, 2021-2030 (USD MILLION)
TABLE 227 DENMARK ENERGY AND UTILITIES IN RISK MANAGEMENT MARKET, BY RISK TYPE, 2021-2030 (USD MILLION)
TABLE 228 SWEDEN RISK MANAGEMENT MARKET, BY RISK TYPE, 2021-2030 (USD MILLION)
TABLE 229 SWEDEN RISK MANAGEMENT MARKET, BY FIRM TYPE, 2021-2030 (USD MILLION)
TABLE 230 SWEDEN RISK MANAGEMENT MARKET, BY ENTERPRISE SIZE, 2021-2030 (USD MILLION)
TABLE 231 SWEDEN RISK MANAGEMENT MARKET, BY VERTICAL, 2021-2030 (USD MILLION)
TABLE 232 SWEDEN BFSI IN RISK MANAGEMENT MARKET, BY RISK TYPE, 2021-2030 (USD MILLION)
TABLE 233 SWEDEN IT & TELECOM IN RISK MANAGEMENT MARKET, BY RISK TYPE, 2021-2030 (USD MILLION)
TABLE 234 SWEDEN HEALTHCARE IN RISK MANAGEMENT MARKET, BY RISK TYPE, 2021-2030 (USD MILLION)
TABLE 235 SWEDEN RETAIL IN RISK MANAGEMENT MARKET, BY RISK TYPE, 2021-2030 (USD MILLION)
TABLE 236 SWEDEN MANUFACTURING IN RISK MANAGEMENT MARKET, BY RISK TYPE, 2021-2030 (USD MILLION)
TABLE 237 SWEDEN GOVERNMENT AND DEFENCE IN RISK MANAGEMENT MARKET, BY RISK TYPE, 2021-2030 (USD MILLION)
TABLE 238 SWEDEN TRANSPORT AND LOGISTIC IN RISK MANAGEMENT MARKET, BY RISK TYPE, 2021-2030 (USD MILLION)
TABLE 239 SWEDEN ENERGY AND UTILITIES IN RISK MANAGEMENT MARKET, BY RISK TYPE, 2021-2030 (USD MILLION)
TABLE 240 POLAND RISK MANAGEMENT MARKET, BY RISK TYPE, 2021-2030 (USD MILLION)
TABLE 241 POLAND RISK MANAGEMENT MARKET, BY FIRM TYPE, 2021-2030 (USD MILLION)
TABLE 242 POLAND RISK MANAGEMENT MARKET, BY ENTERPRISE SIZE, 2021-2030 (USD MILLION)
TABLE 243 POLAND RISK MANAGEMENT MARKET, BY VERTICAL, 2021-2030 (USD MILLION)
TABLE 244 POLAND BFSI IN RISK MANAGEMENT MARKET, BY RISK TYPE, 2021-2030 (USD MILLION)
TABLE 245 POLAND IT & TELECOM IN RISK MANAGEMENT MARKET, BY RISK TYPE, 2021-2030 (USD MILLION)
TABLE 246 POLAND HEALTHCARE IN RISK MANAGEMENT MARKET, BY RISK TYPE, 2021-2030 (USD MILLION)
TABLE 247 POLAND RETAIL IN RISK MANAGEMENT MARKET, BY RISK TYPE, 2021-2030 (USD MILLION)
TABLE 248 POLAND MANUFACTURING IN RISK MANAGEMENT MARKET, BY RISK TYPE, 2021-2030 (USD MILLION)
TABLE 249 POLAND GOVERNMENT AND DEFENCE IN RISK MANAGEMENT MARKET, BY RISK TYPE, 2021-2030 (USD MILLION)
TABLE 250 POLAND TRANSPORT AND LOGISTIC IN RISK MANAGEMENT MARKET, BY RISK TYPE, 2021-2030 (USD MILLION)
TABLE 251 POLAND ENERGY AND UTILITIES IN RISK MANAGEMENT MARKET, BY RISK TYPE, 2021-2030 (USD MILLION)
TABLE 252 NORWAY RISK MANAGEMENT MARKET, BY RISK TYPE, 2021-2030 (USD MILLION)
TABLE 253 NORWAY RISK MANAGEMENT MARKET, BY FIRM TYPE, 2021-2030 (USD MILLION)
TABLE 254 NORWAY RISK MANAGEMENT MARKET, BY ENTERPRISE SIZE, 2021-2030 (USD MILLION)
TABLE 255 NORWAY RISK MANAGEMENT MARKET, BY VERTICAL, 2021-2030 (USD MILLION)
TABLE 256 NORWAY BFSI IN RISK MANAGEMENT MARKET, BY RISK TYPE, 2021-2030 (USD MILLION)
TABLE 257 NORWAY IT & TELECOM IN RISK MANAGEMENT MARKET, BY RISK TYPE, 2021-2030 (USD MILLION)
TABLE 258 NORWAY HEALTHCARE IN RISK MANAGEMENT MARKET, BY RISK TYPE, 2021-2030 (USD MILLION)
TABLE 259 NORWAY RETAIL IN RISK MANAGEMENT MARKET, BY RISK TYPE, 2021-2030 (USD MILLION)
TABLE 260 NORWAY MANUFACTURING IN RISK MANAGEMENT MARKET, BY RISK TYPE, 2021-2030 (USD MILLION)
TABLE 261 NORWAY GOVERNMENT AND DEFENCE IN RISK MANAGEMENT MARKET, BY RISK TYPE, 2021-2030 (USD MILLION)
TABLE 262 NORWAY TRANSPORT AND LOGISTIC IN RISK MANAGEMENT MARKET, BY RISK TYPE, 2021-2030 (USD MILLION)
TABLE 263 NORWAY ENERGY AND UTILITIES IN RISK MANAGEMENT MARKET, BY RISK TYPE, 2021-2030 (USD MILLION)
TABLE 264 FINLAND RISK MANAGEMENT MARKET, BY RISK TYPE, 2021-2030 (USD MILLION)
TABLE 265 FINLAND RISK MANAGEMENT MARKET, BY FIRM TYPE, 2021-2030 (USD MILLION)
TABLE 266 FINLAND RISK MANAGEMENT MARKET, BY ENTERPRISE SIZE, 2021-2030 (USD MILLION)
TABLE 267 FINLAND RISK MANAGEMENT MARKET, BY VERTICAL, 2021-2030 (USD MILLION)
TABLE 268 FINLAND BFSI IN RISK MANAGEMENT MARKET, BY RISK TYPE, 2021-2030 (USD MILLION)
TABLE 269 FINLAND IT & TELECOM IN RISK MANAGEMENT MARKET, BY RISK TYPE, 2021-2030 (USD MILLION)
TABLE 270 FINLAND HEALTHCARE IN RISK MANAGEMENT MARKET, BY RISK TYPE, 2021-2030 (USD MILLION)
TABLE 271 FINLAND RETAIL IN RISK MANAGEMENT MARKET, BY RISK TYPE, 2021-2030 (USD MILLION)
TABLE 272 FINLAND MANUFACTURING IN RISK MANAGEMENT MARKET, BY RISK TYPE, 2021-2030 (USD MILLION)
TABLE 273 FINLAND GOVERNMENT AND DEFENCE IN RISK MANAGEMENT MARKET, BY RISK TYPE, 2021-2030 (USD MILLION)
TABLE 274 FINLAND TRANSPORT AND LOGISTIC IN RISK MANAGEMENT MARKET, BY RISK TYPE, 2021-2030 (USD MILLION)
TABLE 275 FINLAND ENERGY AND UTILITIES IN RISK MANAGEMENT MARKET, BY RISK TYPE, 2021-2030 (USD MILLION)
TABLE 276 REST OF EUROPE RISK MANAGEMENT MARKET, BY RISK TYPE, 2021-2030 (USD MILLION)
TABLE 277 ASIA-PACIFIC RISK MANAGEMENT MARKET, BY COUNTRY, 2021-2030 (USD MILLION)
TABLE 278 ASIA-PACIFIC RISK MANAGEMENT MARKET, BY RISK TYPE, 2021-2030 (USD MILLION)
TABLE 279 ASIA-PACIFIC RISK MANAGEMENT MARKET, BY FIRM TYPE, 2021-2030 (USD MILLION)
TABLE 280 ASIA-PACIFIC RISK MANAGEMENT MARKET, BY ENTERPRISE SIZE, 2021-2030 (USD MILLION)
TABLE 281 ASIA-PACIFIC RISK MANAGEMENT MARKET, BY VERTICAL, 2021-2030 (USD MILLION)
TABLE 282 ASIA-PACIFIC BFSI IN RISK MANAGEMENT MARKET, BY RISK TYPE, 2021-2030 (USD MILLION)
TABLE 283 ASIA-PACIFIC IT & TELECOM IN RISK MANAGEMENT MARKET, BY RISK TYPE, 2021-2030 (USD MILLION)
TABLE 284 ASIA-PACIFIC HEALTHCARE IN RISK MANAGEMENT MARKET, BY RISK TYPE, 2021-2030 (USD MILLION)
TABLE 285 ASIA-PACIFIC RETAIL IN RISK MANAGEMENT MARKET, BY RISK TYPE, 2021-2030 (USD MILLION)
TABLE 286 ASIA-PACIFIC MANUFACTURING IN RISK MANAGEMENT MARKET, BY RISK TYPE, 2021-2030 (USD MILLION)
TABLE 287 ASIA-PACIFIC GOVERNMENT AND DEFENCE IN RISK MANAGEMENT MARKET, BY RISK TYPE, 2021-2030 (USD MILLION)
TABLE 288 ASIA-PACIFIC TRANSPORT AND LOGISTIC IN RISK MANAGEMENT MARKET, BY RISK TYPE, 2021-2030 (USD MILLION)
TABLE 289 ASIA-PACIFIC ENERGY AND UTILITIES IN RISK MANAGEMENT MARKET, BY RISK TYPE, 2021-2030 (USD MILLION)
TABLE 290 CHINA RISK MANAGEMENT MARKET, BY RISK TYPE, 2021-2030 (USD MILLION)
TABLE 291 CHINA RISK MANAGEMENT MARKET, BY FIRM TYPE, 2021-2030 (USD MILLION)
TABLE 292 CHINA RISK MANAGEMENT MARKET, BY ENTERPRISE SIZE, 2021-2030 (USD MILLION)
TABLE 293 CHINA RISK MANAGEMENT MARKET, BY VERTICAL, 2021-2030 (USD MILLION)
TABLE 294 CHINA BFSI IN RISK MANAGEMENT MARKET, BY RISK TYPE, 2021-2030 (USD MILLION)
TABLE 295 CHINA IT & TELECOM IN RISK MANAGEMENT MARKET, BY RISK TYPE, 2021-2030 (USD MILLION)
TABLE 296 CHINA HEALTHCARE IN RISK MANAGEMENT MARKET, BY RISK TYPE, 2021-2030 (USD MILLION)
TABLE 297 CHINA RETAIL IN RISK MANAGEMENT MARKET, BY RISK TYPE, 2021-2030 (USD MILLION)
TABLE 298 CHINA MANUFACTURING IN RISK MANAGEMENT MARKET, BY RISK TYPE, 2021-2030 (USD MILLION)
TABLE 299 CHINA GOVERNMENT AND DEFENCE IN RISK MANAGEMENT MARKET, BY RISK TYPE, 2021-2030 (USD MILLION)
TABLE 300 CHINA TRANSPORT AND LOGISTIC IN RISK MANAGEMENT MARKET, BY RISK TYPE, 2021-2030 (USD MILLION)
TABLE 301 CHINA ENERGY AND UTILITIES IN RISK MANAGEMENT MARKET, BY RISK TYPE, 2021-2030 (USD MILLION)
TABLE 302 JAPAN RISK MANAGEMENT MARKET, BY RISK TYPE, 2021-2030 (USD MILLION)
TABLE 303 JAPAN RISK MANAGEMENT MARKET, BY FIRM TYPE, 2021-2030 (USD MILLION)
TABLE 304 JAPAN RISK MANAGEMENT MARKET, BY ENTERPRISE SIZE, 2021-2030 (USD MILLION)
TABLE 305 JAPAN RISK MANAGEMENT MARKET, BY VERTICAL, 2021-2030 (USD MILLION)
TABLE 306 JAPAN BFSI IN RISK MANAGEMENT MARKET, BY RISK TYPE, 2021-2030 (USD MILLION)
TABLE 307 JAPAN IT & TELECOM IN RISK MANAGEMENT MARKET, BY RISK TYPE, 2021-2030 (USD MILLION)
TABLE 308 JAPAN HEALTHCARE IN RISK MANAGEMENT MARKET, BY RISK TYPE, 2021-2030 (USD MILLION)
TABLE 309 JAPAN RETAIL IN RISK MANAGEMENT MARKET, BY RISK TYPE, 2021-2030 (USD MILLION)
TABLE 310 JAPAN MANUFACTURING IN RISK MANAGEMENT MARKET, BY RISK TYPE, 2021-2030 (USD MILLION)
TABLE 311 JAPAN GOVERNMENT AND DEFENCE IN RISK MANAGEMENT MARKET, BY RISK TYPE, 2021-2030 (USD MILLION)
TABLE 312 JAPAN TRANSPORT AND LOGISTIC IN RISK MANAGEMENT MARKET, BY RISK TYPE, 2021-2030 (USD MILLION)
TABLE 313 JAPAN ENERGY AND UTILITIES IN RISK MANAGEMENT MARKET, BY RISK TYPE, 2021-2030 (USD MILLION)
TABLE 314 SOUTH KOREA RISK MANAGEMENT MARKET, BY RISK TYPE, 2021-2030 (USD MILLION)
TABLE 315 SOUTH KOREA RISK MANAGEMENT MARKET, BY FIRM TYPE, 2021-2030 (USD MILLION)
TABLE 316 SOUTH KOREA RISK MANAGEMENT MARKET, BY ENTERPRISE SIZE, 2021-2030 (USD MILLION)
TABLE 317 SOUTH KOREA RISK MANAGEMENT MARKET, BY VERTICAL, 2021-2030 (USD MILLION)
TABLE 318 SOUTH KOREA BFSI IN RISK MANAGEMENT MARKET, BY RISK TYPE, 2021-2030 (USD MILLION)
TABLE 319 SOUTH KOREA IT & TELECOM IN RISK MANAGEMENT MARKET, BY RISK TYPE, 2021-2030 (USD MILLION)
TABLE 320 SOUTH KOREA HEALTHCARE IN RISK MANAGEMENT MARKET, BY RISK TYPE, 2021-2030 (USD MILLION)
TABLE 321 SOUTH KOREA RETAIL IN RISK MANAGEMENT MARKET, BY RISK TYPE, 2021-2030 (USD MILLION)
TABLE 322 SOUTH KOREA MANUFACTURING IN RISK MANAGEMENT MARKET, BY RISK TYPE, 2021-2030 (USD MILLION)
TABLE 323 SOUTH KOREA GOVERNMENT AND DEFENCE IN RISK MANAGEMENT MARKET, BY RISK TYPE, 2021-2030 (USD MILLION)
TABLE 324 SOUTH KOREA TRANSPORT AND LOGISTIC IN RISK MANAGEMENT MARKET, BY RISK TYPE, 2021-2030 (USD MILLION)
TABLE 325 SOUTH KOREA ENERGY AND UTILITIES IN RISK MANAGEMENT MARKET, BY RISK TYPE, 2021-2030 (USD MILLION)
TABLE 326 INDIA RISK MANAGEMENT MARKET, BY RISK TYPE, 2021-2030 (USD MILLION)
TABLE 327 INDIA RISK MANAGEMENT MARKET, BY FIRM TYPE, 2021-2030 (USD MILLION)
TABLE 328 INDIA RISK MANAGEMENT MARKET, BY ENTERPRISE SIZE, 2021-2030 (USD MILLION)
TABLE 329 INDIA RISK MANAGEMENT MARKET, BY VERTICAL, 2021-2030 (USD MILLION)
TABLE 330 INDIA BFSI IN RISK MANAGEMENT MARKET, BY RISK TYPE, 2021-2030 (USD MILLION)
TABLE 331 INDIA IT & TELECOM IN RISK MANAGEMENT MARKET, BY RISK TYPE, 2021-2030 (USD MILLION)
TABLE 332 INDIA HEALTHCARE IN RISK MANAGEMENT MARKET, BY RISK TYPE, 2021-2030 (USD MILLION)
TABLE 333 INDIA RETAIL IN RISK MANAGEMENT MARKET, BY RISK TYPE, 2021-2030 (USD MILLION)
TABLE 334 INDIA MANUFACTURING IN RISK MANAGEMENT MARKET, BY RISK TYPE, 2021-2030 (USD MILLION)
TABLE 335 INDIA GOVERNMENT AND DEFENCE IN RISK MANAGEMENT MARKET, BY RISK TYPE, 2021-2030 (USD MILLION)
TABLE 336 INDIA TRANSPORT AND LOGISTIC IN RISK MANAGEMENT MARKET, BY RISK TYPE, 2021-2030 (USD MILLION)
TABLE 337 INDIA ENERGY AND UTILITIES IN RISK MANAGEMENT MARKET, BY RISK TYPE, 2021-2030 (USD MILLION)
TABLE 338 AUSTRALIA RISK MANAGEMENT MARKET, BY RISK TYPE, 2021-2030 (USD MILLION)
TABLE 339 AUSTRALIA RISK MANAGEMENT MARKET, BY FIRM TYPE, 2021-2030 (USD MILLION)
TABLE 340 AUSTRALIA RISK MANAGEMENT MARKET, BY ENTERPRISE SIZE, 2021-2030 (USD MILLION)
TABLE 341 AUSTRALIA RISK MANAGEMENT MARKET, BY VERTICAL, 2021-2030 (USD MILLION)
TABLE 342 AUSTRALIA BFSI IN RISK MANAGEMENT MARKET, BY RISK TYPE, 2021-2030 (USD MILLION)
TABLE 343 AUSTRALIA IT & TELECOM IN RISK MANAGEMENT MARKET, BY RISK TYPE, 2021-2030 (USD MILLION)
TABLE 344 AUSTRALIA HEALTHCARE IN RISK MANAGEMENT MARKET, BY RISK TYPE, 2021-2030 (USD MILLION)
TABLE 345 AUSTRALIA RETAIL IN RISK MANAGEMENT MARKET, BY RISK TYPE, 2021-2030 (USD MILLION)
TABLE 346 AUSTRALIA MANUFACTURING IN RISK MANAGEMENT MARKET, BY RISK TYPE, 2021-2030 (USD MILLION)
TABLE 347 AUSTRALIA GOVERNMENT AND DEFENCE IN RISK MANAGEMENT MARKET, BY RISK TYPE, 2021-2030 (USD MILLION)
TABLE 348 AUSTRALIA TRANSPORT AND LOGISTIC IN RISK MANAGEMENT MARKET, BY RISK TYPE, 2021-2030 (USD MILLION)
TABLE 349 AUSTRALIA ENERGY AND UTILITIES IN RISK MANAGEMENT MARKET, BY RISK TYPE, 2021-2030 (USD MILLION)
TABLE 350 TAIWAN RISK MANAGEMENT MARKET, BY RISK TYPE, 2021-2030 (USD MILLION)
TABLE 351 TAIWAN RISK MANAGEMENT MARKET, BY FIRM TYPE, 2021-2030 (USD MILLION)
TABLE 352 TAIWAN RISK MANAGEMENT MARKET, BY ENTERPRISE SIZE, 2021-2030 (USD MILLION)
TABLE 353 TAIWAN RISK MANAGEMENT MARKET, BY VERTICAL, 2021-2030 (USD MILLION)
TABLE 354 TAIWAN BFSI IN RISK MANAGEMENT MARKET, BY RISK TYPE, 2021-2030 (USD MILLION)
TABLE 355 TAIWAN IT & TELECOM IN RISK MANAGEMENT MARKET, BY RISK TYPE, 2021-2030 (USD MILLION)
TABLE 356 TAIWAN HEALTHCARE IN RISK MANAGEMENT MARKET, BY RISK TYPE, 2021-2030 (USD MILLION)
TABLE 357 TAIWAN RETAIL IN RISK MANAGEMENT MARKET, BY RISK TYPE, 2021-2030 (USD MILLION)
TABLE 358 TAIWAN MANUFACTURING IN RISK MANAGEMENT MARKET, BY RISK TYPE, 2021-2030 (USD MILLION)
TABLE 359 TAIWAN GOVERNMENT AND DEFENCE IN RISK MANAGEMENT MARKET, BY RISK TYPE, 2021-2030 (USD MILLION)
TABLE 360 TAIWAN TRANSPORT AND LOGISTIC IN RISK MANAGEMENT MARKET, BY RISK TYPE, 2021-2030 (USD MILLION)
TABLE 361 TAIWAN ENERGY AND UTILITIES IN RISK MANAGEMENT MARKET, BY RISK TYPE, 2021-2030 (USD MILLION)
TABLE 362 THAILAND RISK MANAGEMENT MARKET, BY RISK TYPE, 2021-2030 (USD MILLION)
TABLE 363 THAILAND RISK MANAGEMENT MARKET, BY FIRM TYPE, 2021-2030 (USD MILLION)
TABLE 364 THAILAND RISK MANAGEMENT MARKET, BY ENTERPRISE SIZE, 2021-2030 (USD MILLION)
TABLE 365 THAILAND RISK MANAGEMENT MARKET, BY VERTICAL, 2021-2030 (USD MILLION)
TABLE 366 THAILAND BFSI IN RISK MANAGEMENT MARKET, BY RISK TYPE, 2021-2030 (USD MILLION)
TABLE 367 THAILAND IT & TELECOM IN RISK MANAGEMENT MARKET, BY RISK TYPE, 2021-2030 (USD MILLION)
TABLE 368 THAILAND HEALTHCARE IN RISK MANAGEMENT MARKET, BY RISK TYPE, 2021-2030 (USD MILLION)
TABLE 369 THAILAND RETAIL IN RISK MANAGEMENT MARKET, BY RISK TYPE, 2021-2030 (USD MILLION)
TABLE 370 THAILAND MANUFACTURING IN RISK MANAGEMENT MARKET, BY RISK TYPE, 2021-2030 (USD MILLION)
TABLE 371 THAILAND GOVERNMENT AND DEFENCE IN RISK MANAGEMENT MARKET, BY RISK TYPE, 2021-2030 (USD MILLION)
TABLE 372 THAILAND TRANSPORT AND LOGISTIC IN RISK MANAGEMENT MARKET, BY RISK TYPE, 2021-2030 (USD MILLION)
TABLE 373 THAILAND ENERGY AND UTILITIES IN RISK MANAGEMENT MARKET, BY RISK TYPE, 2021-2030 (USD MILLION)
TABLE 374 INDONESIA RISK MANAGEMENT MARKET, BY RISK TYPE, 2021-2030 (USD MILLION)
TABLE 375 INDONESIA RISK MANAGEMENT MARKET, BY FIRM TYPE, 2021-2030 (USD MILLION)
TABLE 376 INDONESIA RISK MANAGEMENT MARKET, BY ENTERPRISE SIZE, 2021-2030 (USD MILLION)
TABLE 377 INDONESIA RISK MANAGEMENT MARKET, BY VERTICAL, 2021-2030 (USD MILLION)
TABLE 378 INDONESIA BFSI IN RISK MANAGEMENT MARKET, BY RISK TYPE, 2021-2030 (USD MILLION)
TABLE 379 INDONESIA IT & TELECOM IN RISK MANAGEMENT MARKET, BY RISK TYPE, 2021-2030 (USD MILLION)
TABLE 380 INDONESIA HEALTHCARE IN RISK MANAGEMENT MARKET, BY RISK TYPE, 2021-2030 (USD MILLION)
TABLE 381 INDONESIA RETAIL IN RISK MANAGEMENT MARKET, BY RISK TYPE, 2021-2030 (USD MILLION)
TABLE 382 INDONESIA MANUFACTURING IN RISK MANAGEMENT MARKET, BY RISK TYPE, 2021-2030 (USD MILLION)
TABLE 383 INDONESIA GOVERNMENT AND DEFENCE IN RISK MANAGEMENT MARKET, BY RISK TYPE, 2021-2030 (USD MILLION)
TABLE 384 INDONESIA TRANSPORT AND LOGISTIC IN RISK MANAGEMENT MARKET, BY RISK TYPE, 2021-2030 (USD MILLION)
TABLE 385 INDONESIA ENERGY AND UTILITIES IN RISK MANAGEMENT MARKET, BY RISK TYPE, 2021-2030 (USD MILLION)
TABLE 386 MALAYSIA RISK MANAGEMENT MARKET, BY RISK TYPE, 2021-2030 (USD MILLION)
TABLE 387 MALAYSIA RISK MANAGEMENT MARKET, BY FIRM TYPE, 2021-2030 (USD MILLION)
TABLE 388 MALAYSIA RISK MANAGEMENT MARKET, BY ENTERPRISE SIZE, 2021-2030 (USD MILLION)
TABLE 389 MALAYSIA RISK MANAGEMENT MARKET, BY VERTICAL, 2021-2030 (USD MILLION)
TABLE 390 MALAYSIA BFSI IN RISK MANAGEMENT MARKET, BY RISK TYPE, 2021-2030 (USD MILLION)
TABLE 391 MALAYSIA IT & TELECOM IN RISK MANAGEMENT MARKET, BY RISK TYPE, 2021-2030 (USD MILLION)
TABLE 392 MALAYSIA HEALTHCARE IN RISK MANAGEMENT MARKET, BY RISK TYPE, 2021-2030 (USD MILLION)
TABLE 393 MALAYSIA RETAIL IN RISK MANAGEMENT MARKET, BY RISK TYPE, 2021-2030 (USD MILLION)
TABLE 394 MALAYSIA MANUFACTURING IN RISK MANAGEMENT MARKET, BY RISK TYPE, 2021-2030 (USD MILLION)
TABLE 395 MALAYSIA GOVERNMENT AND DEFENCE IN RISK MANAGEMENT MARKET, BY RISK TYPE, 2021-2030 (USD MILLION)
TABLE 396 MALAYSIA TRANSPORT AND LOGISTIC IN RISK MANAGEMENT MARKET, BY RISK TYPE, 2021-2030 (USD MILLION)
TABLE 397 MALAYSIA ENERGY AND UTILITIES IN RISK MANAGEMENT MARKET, BY RISK TYPE, 2021-2030 (USD MILLION)
TABLE 398 SINGAPORE RISK MANAGEMENT MARKET, BY RISK TYPE, 2021-2030 (USD MILLION)
TABLE 399 SINGAPORE RISK MANAGEMENT MARKET, BY FIRM TYPE, 2021-2030 (USD MILLION)
TABLE 400 SINGAPORE RISK MANAGEMENT MARKET, BY ENTERPRISE SIZE, 2021-2030 (USD MILLION)
TABLE 401 SINGAPORE RISK MANAGEMENT MARKET, BY VERTICAL, 2021-2030 (USD MILLION)
TABLE 402 SINGAPORE BFSI IN RISK MANAGEMENT MARKET, BY RISK TYPE, 2021-2030 (USD MILLION)
TABLE 403 SINGAPORE IT & TELECOM IN RISK MANAGEMENT MARKET, BY RISK TYPE, 2021-2030 (USD MILLION)
TABLE 404 SINGAPORE HEALTHCARE IN RISK MANAGEMENT MARKET, BY RISK TYPE, 2021-2030 (USD MILLION)
TABLE 405 SINGAPORE RETAIL IN RISK MANAGEMENT MARKET, BY RISK TYPE, 2021-2030 (USD MILLION)
TABLE 406 SINGAPORE MANUFACTURING IN RISK MANAGEMENT MARKET, BY RISK TYPE, 2021-2030 (USD MILLION)
TABLE 407 SINGAPORE GOVERNMENT AND DEFENCE IN RISK MANAGEMENT MARKET, BY RISK TYPE, 2021-2030 (USD MILLION)
TABLE 408 SINGAPORE TRANSPORT AND LOGISTIC IN RISK MANAGEMENT MARKET, BY RISK TYPE, 2021-2030 (USD MILLION)
TABLE 409 SINGAPORE ENERGY AND UTILITIES IN RISK MANAGEMENT MARKET, BY RISK TYPE, 2021-2030 (USD MILLION)
TABLE 410 NEW ZEALAND RISK MANAGEMENT MARKET, BY RISK TYPE, 2021-2030 (USD MILLION)
TABLE 411 NEW ZEALAND RISK MANAGEMENT MARKET, BY FIRM TYPE, 2021-2030 (USD MILLION)
TABLE 412 NEW ZEALAND RISK MANAGEMENT MARKET, BY ENTERPRISE SIZE, 2021-2030 (USD MILLION)
TABLE 413 NEW ZEALAND RISK MANAGEMENT MARKET, BY VERTICAL, 2021-2030 (USD MILLION)
TABLE 414 NEW ZEALAND BFSI IN RISK MANAGEMENT MARKET, BY RISK TYPE, 2021-2030 (USD MILLION)
TABLE 415 NEW ZEALAND IT & TELECOM IN RISK MANAGEMENT MARKET, BY RISK TYPE, 2021-2030 (USD MILLION)
TABLE 416 NEW ZEALAND HEALTHCARE IN RISK MANAGEMENT MARKET, BY RISK TYPE, 2021-2030 (USD MILLION)
TABLE 417 NEW ZEALAND RETAIL IN RISK MANAGEMENT MARKET, BY RISK TYPE, 2021-2030 (USD MILLION)
TABLE 418 NEW ZEALAND MANUFACTURING IN RISK MANAGEMENT MARKET, BY RISK TYPE, 2021-2030 (USD MILLION)
TABLE 419 NEW ZEALAND GOVERNMENT AND DEFENCE IN RISK MANAGEMENT MARKET, BY RISK TYPE, 2021-2030 (USD MILLION)
TABLE 420 NEW ZEALAND TRANSPORT AND LOGISTIC IN RISK MANAGEMENT MARKET, BY RISK TYPE, 2021-2030 (USD MILLION)
TABLE 421 NEW ZEALAND ENERGY AND UTILITIES IN RISK MANAGEMENT MARKET, BY RISK TYPE, 2021-2030 (USD MILLION)
TABLE 422 PHILIPPINES RISK MANAGEMENT MARKET, BY RISK TYPE, 2021-2030 (USD MILLION)
TABLE 423 PHILIPPINES RISK MANAGEMENT MARKET, BY FIRM TYPE, 2021-2030 (USD MILLION)
TABLE 424 PHILIPPINES RISK MANAGEMENT MARKET, BY ENTERPRISE SIZE, 2021-2030 (USD MILLION)
TABLE 425 PHILIPPINES RISK MANAGEMENT MARKET, BY VERTICAL, 2021-2030 (USD MILLION)
TABLE 426 PHILIPPINES BFSI IN RISK MANAGEMENT MARKET, BY RISK TYPE, 2021-2030 (USD MILLION)
TABLE 427 PHILIPPINES IT & TELECOM IN RISK MANAGEMENT MARKET, BY RISK TYPE, 2021-2030 (USD MILLION)
TABLE 428 PHILIPPINES HEALTHCARE IN RISK MANAGEMENT MARKET, BY RISK TYPE, 2021-2030 (USD MILLION)
TABLE 429 PHILIPPINES RETAIL IN RISK MANAGEMENT MARKET, BY RISK TYPE, 2021-2030 (USD MILLION)
TABLE 430 PHILIPPINES MANUFACTURING IN RISK MANAGEMENT MARKET, BY RISK TYPE, 2021-2030 (USD MILLION)
TABLE 431 PHILIPPINES GOVERNMENT AND DEFENCE IN RISK MANAGEMENT MARKET, BY RISK TYPE, 2021-2030 (USD MILLION)
TABLE 432 PHILIPPINES TRANSPORT AND LOGISTIC IN RISK MANAGEMENT MARKET, BY RISK TYPE, 2021-2030 (USD MILLION)
TABLE 433 PHILIPPINES ENERGY AND UTILITIES IN RISK MANAGEMENT MARKET, BY RISK TYPE, 2021-2030 (USD MILLION)
TABLE 434 VIETNAM RISK MANAGEMENT MARKET, BY RISK TYPE, 2021-2030 (USD MILLION)
TABLE 435 VIETNAM RISK MANAGEMENT MARKET, BY FIRM TYPE, 2021-2030 (USD MILLION)
TABLE 436 VIETNAM RISK MANAGEMENT MARKET, BY ENTERPRISE SIZE, 2021-2030 (USD MILLION)
TABLE 437 VIETNAM RISK MANAGEMENT MARKET, BY VERTICAL, 2021-2030 (USD MILLION)
TABLE 438 VIETNAM BFSI IN RISK MANAGEMENT MARKET, BY RISK TYPE, 2021-2030 (USD MILLION)
TABLE 439 VIETNAM IT & TELECOM IN RISK MANAGEMENT MARKET, BY RISK TYPE, 2021-2030 (USD MILLION)
TABLE 440 VIETNAM HEALTHCARE IN RISK MANAGEMENT MARKET, BY RISK TYPE, 2021-2030 (USD MILLION)
TABLE 441 VIETNAM RETAIL IN RISK MANAGEMENT MARKET, BY RISK TYPE, 2021-2030 (USD MILLION)
TABLE 442 VIETNAM MANUFACTURING IN RISK MANAGEMENT MARKET, BY RISK TYPE, 2021-2030 (USD MILLION)
TABLE 443 VIETNAM GOVERNMENT AND DEFENCE IN RISK MANAGEMENT MARKET, BY RISK TYPE, 2021-2030 (USD MILLION)
TABLE 444 VIETNAM TRANSPORT AND LOGISTIC IN RISK MANAGEMENT MARKET, BY RISK TYPE, 2021-2030 (USD MILLION)
TABLE 445 VIETNAM ENERGY AND UTILITIES IN RISK MANAGEMENT MARKET, BY RISK TYPE, 2021-2030 (USD MILLION)
TABLE 446 REST OF ASIA-PACIFIC RISK MANAGEMENT MARKET, BY RISK TYPE, 2021-2030 (USD MILLION)
TABLE 447 MIDDLE EAST AND AFRICA RISK MANAGEMENT MARKET, BY COUNTRY, 2021-2030 (USD MILLION)
TABLE 448 MIDDLE EAST AND AFRICA RISK MANAGEMENT MARKET, BY RISK TYPE, 2021-2030 (USD MILLION)
TABLE 449 MIDDLE EAST AND AFRICA RISK MANAGEMENT MARKET, BY FIRM TYPE, 2021-2030 (USD MILLION)
TABLE 450 MIDDLE EAST AND AFRICA RISK MANAGEMENT MARKET, BY ENTERPRISE SIZE, 2021-2030 (USD MILLION)
TABLE 451 MIDDLE EAST AND AFRICA RISK MANAGEMENT MARKET, BY VERTICAL, 2021-2030 (USD MILLION)
TABLE 452 MIDDLE EAST AND AFRICA BFSI IN RISK MANAGEMENT MARKET, BY RISK TYPE, 2021-2030 (USD MILLION)
TABLE 453 MIDDLE EAST AND AFRICA IT & TELECOM IN RISK MANAGEMENT MARKET, BY RISK TYPE, 2021-2030 (USD MILLION)
TABLE 454 MIDDLE EAST AND AFRICA HEALTHCARE IN RISK MANAGEMENT MARKET, BY RISK TYPE, 2021-2030 (USD MILLION)
TABLE 455 MIDDLE EAST AND AFRICA RETAIL IN RISK MANAGEMENT MARKET, BY RISK TYPE, 2021-2030 (USD MILLION)
TABLE 456 MIDDLE EAST AND AFRICA MANUFACTURING IN RISK MANAGEMENT MARKET, BY RISK TYPE, 2021-2030 (USD MILLION)
TABLE 457 MIDDLE EAST AND AFRICA GOVERNMENT AND DEFENCE IN RISK MANAGEMENT MARKET, BY RISK TYPE, 2021-2030 (USD MILLION)
TABLE 458 MIDDLE EAST AND AFRICA TRANSPORT AND LOGISTIC IN RISK MANAGEMENT MARKET, BY RISK TYPE, 2021-2030 (USD MILLION)
TABLE 459 MIDDLE EAST AND AFRICA ENERGY AND UTILITIES IN RISK MANAGEMENT MARKET, BY RISK TYPE, 2021-2030 (USD MILLION)
TABLE 460 U.A.E. RISK MANAGEMENT MARKET, BY RISK TYPE, 2021-2030 (USD MILLION)
TABLE 461 U.A.E. RISK MANAGEMENT MARKET, BY FIRM TYPE, 2021-2030 (USD MILLION)
TABLE 462 U.A.E. RISK MANAGEMENT MARKET, BY ENTERPRISE SIZE, 2021-2030 (USD MILLION)
TABLE 463 U.A.E. RISK MANAGEMENT MARKET, BY VERTICAL, 2021-2030 (USD MILLION)
TABLE 464 U.A.E. BFSI IN RISK MANAGEMENT MARKET, BY RISK TYPE, 2021-2030 (USD MILLION)
TABLE 465 U.A.E. IT & TELECOM IN RISK MANAGEMENT MARKET, BY RISK TYPE, 2021-2030 (USD MILLION)
TABLE 466 U.A.E. HEALTHCARE IN RISK MANAGEMENT MARKET, BY RISK TYPE, 2021-2030 (USD MILLION)
TABLE 467 U.A.E. RETAIL IN RISK MANAGEMENT MARKET, BY RISK TYPE, 2021-2030 (USD MILLION)
TABLE 468 U.A.E. MANUFACTURING IN RISK MANAGEMENT MARKET, BY RISK TYPE, 2021-2030 (USD MILLION)
TABLE 469 U.A.E. GOVERNMENT AND DEFENCE IN RISK MANAGEMENT MARKET, BY RISK TYPE, 2021-2030 (USD MILLION)
TABLE 470 U.A.E. TRANSPORT AND LOGISTIC IN RISK MANAGEMENT MARKET, BY RISK TYPE, 2021-2030 (USD MILLION)
TABLE 471 U.A.E. ENERGY AND UTILITIES IN RISK MANAGEMENT MARKET, BY RISK TYPE, 2021-2030 (USD MILLION)
TABLE 472 SAUDI ARABIA RISK MANAGEMENT MARKET, BY RISK TYPE, 2021-2030 (USD MILLION)
TABLE 473 SAUDI ARABIA RISK MANAGEMENT MARKET, BY FIRM TYPE, 2021-2030 (USD MILLION)
TABLE 474 SAUDI ARABIA RISK MANAGEMENT MARKET, BY ENTERPRISE SIZE, 2021-2030 (USD MILLION)
TABLE 475 SAUDI ARABIA RISK MANAGEMENT MARKET, BY VERTICAL, 2021-2030 (USD MILLION)
TABLE 476 SAUDI ARABIA BFSI IN RISK MANAGEMENT MARKET, BY RISK TYPE, 2021-2030 (USD MILLION)
TABLE 477 SAUDI ARABIA IT & TELECOM IN RISK MANAGEMENT MARKET, BY RISK TYPE, 2021-2030 (USD MILLION)
TABLE 478 SAUDI ARABIA HEALTHCARE IN RISK MANAGEMENT MARKET, BY RISK TYPE, 2021-2030 (USD MILLION)
TABLE 479 SAUDI ARABIA RETAIL IN RISK MANAGEMENT MARKET, BY RISK TYPE, 2021-2030 (USD MILLION)
TABLE 480 SAUDI ARABIA MANUFACTURING IN RISK MANAGEMENT MARKET, BY RISK TYPE, 2021-2030 (USD MILLION)
TABLE 481 SAUDI ARABIA GOVERNMENT AND DEFENCE IN RISK MANAGEMENT MARKET, BY RISK TYPE, 2021-2030 (USD MILLION)
TABLE 482 SAUDI ARABIA TRANSPORT AND LOGISTIC IN RISK MANAGEMENT MARKET, BY RISK TYPE, 2021-2030 (USD MILLION)
TABLE 483 SAUDI ARABIA ENERGY AND UTILITIES IN RISK MANAGEMENT MARKET, BY RISK TYPE, 2021-2030 (USD MILLION)
TABLE 484 QATAR RISK MANAGEMENT MARKET, BY RISK TYPE, 2021-2030 (USD MILLION)
TABLE 485 QATAR RISK MANAGEMENT MARKET, BY FIRM TYPE, 2021-2030 (USD MILLION)
TABLE 486 QATAR RISK MANAGEMENT MARKET, BY ENTERPRISE SIZE, 2021-2030 (USD MILLION)
TABLE 487 QATAR RISK MANAGEMENT MARKET, BY VERTICAL, 2021-2030 (USD MILLION)
TABLE 488 QATAR BFSI IN RISK MANAGEMENT MARKET, BY RISK TYPE, 2021-2030 (USD MILLION)
TABLE 489 QATAR IT & TELECOM IN RISK MANAGEMENT MARKET, BY RISK TYPE, 2021-2030 (USD MILLION)
TABLE 490 QATAR HEALTHCARE IN RISK MANAGEMENT MARKET, BY RISK TYPE, 2021-2030 (USD MILLION)
TABLE 491 QATAR RETAIL IN RISK MANAGEMENT MARKET, BY RISK TYPE, 2021-2030 (USD MILLION)
TABLE 492 QATAR MANUFACTURING IN RISK MANAGEMENT MARKET, BY RISK TYPE, 2021-2030 (USD MILLION)
TABLE 493 QATAR GOVERNMENT AND DEFENCE IN RISK MANAGEMENT MARKET, BY RISK TYPE, 2021-2030 (USD MILLION)
TABLE 494 QATAR TRANSPORT AND LOGISTIC IN RISK MANAGEMENT MARKET, BY RISK TYPE, 2021-2030 (USD MILLION)
TABLE 495 QATAR ENERGY AND UTILITIES IN RISK MANAGEMENT MARKET, BY RISK TYPE, 2021-2030 (USD MILLION)
TABLE 496 SOUTH AFRICA RISK MANAGEMENT MARKET, BY RISK TYPE, 2021-2030 (USD MILLION)
TABLE 497 SOUTH AFRICA RISK MANAGEMENT MARKET, BY FIRM TYPE, 2021-2030 (USD MILLION)
TABLE 498 SOUTH AFRICA RISK MANAGEMENT MARKET, BY ENTERPRISE SIZE, 2021-2030 (USD MILLION)
TABLE 499 SOUTH AFRICA RISK MANAGEMENT MARKET, BY VERTICAL, 2021-2030 (USD MILLION)
TABLE 500 SOUTH AFRICA BFSI IN RISK MANAGEMENT MARKET, BY RISK TYPE, 2021-2030 (USD MILLION)
TABLE 501 SOUTH AFRICA IT & TELECOM IN RISK MANAGEMENT MARKET, BY RISK TYPE, 2021-2030 (USD MILLION)
TABLE 502 SOUTH AFRICA RETAIL IN RISK MANAGEMENT MARKET, BY RISK TYPE, 2021-2030 (USD MILLION)
TABLE 503 SOUTH AFRICA MANUFACTURING IN RISK MANAGEMENT MARKET, BY RISK TYPE, 2021-2030 (USD MILLION)
TABLE 504 SOUTH AFRICA GOVERNMENT AND DEFENCE IN RISK MANAGEMENT MARKET, BY RISK TYPE, 2021-2030 (USD MILLION)
TABLE 505 SOUTH AFRICA TRANSPORT AND LOGISTIC IN RISK MANAGEMENT MARKET, BY RISK TYPE, 2021-2030 (USD MILLION)
TABLE 506 SOUTH AFRICA ENERGY AND UTILITIES IN RISK MANAGEMENT MARKET, BY RISK TYPE, 2021-2030 (USD MILLION)
TABLE 507 EGYPT RISK MANAGEMENT MARKET, BY RISK TYPE, 2021-2030 (USD MILLION)
TABLE 508 EGYPT RISK MANAGEMENT MARKET, BY FIRM TYPE, 2021-2030 (USD MILLION)
TABLE 509 EGYPT RISK MANAGEMENT MARKET, BY ENTERPRISE SIZE, 2021-2030 (USD MILLION)
TABLE 510 EGYPT RISK MANAGEMENT MARKET, BY VERTICAL, 2021-2030 (USD MILLION)
TABLE 511 EGYPT BFSI IN RISK MANAGEMENT MARKET, BY RISK TYPE, 2021-2030 (USD MILLION)
TABLE 512 EGYPT IT & TELECOM IN RISK MANAGEMENT MARKET, BY RISK TYPE, 2021-2030 (USD MILLION)
TABLE 513 EGYPT HEALTHCARE IN RISK MANAGEMENT MARKET, BY RISK TYPE, 2021-2030 (USD MILLION)
TABLE 514 EGYPT RETAIL IN RISK MANAGEMENT MARKET, BY RISK TYPE, 2021-2030 (USD MILLION)
TABLE 515 EGYPT MANUFACTURING IN RISK MANAGEMENT MARKET, BY RISK TYPE, 2021-2030 (USD MILLION)
TABLE 516 EGYPT GOVERNMENT AND DEFENCE IN RISK MANAGEMENT MARKET, BY RISK TYPE, 2021-2030 (USD MILLION)
TABLE 517 EGYPT TRANSPORT AND LOGISTIC IN RISK MANAGEMENT MARKET, BY RISK TYPE, 2021-2030 (USD MILLION)
TABLE 518 EGYPT ENERGY AND UTILITIES IN RISK MANAGEMENT MARKET, BY RISK TYPE, 2021-2030 (USD MILLION)
TABLE 519 ISRAEL RISK MANAGEMENT MARKET, BY RISK TYPE, 2021-2030 (USD MILLION)
TABLE 520 ISRAEL RISK MANAGEMENT MARKET, BY FIRM TYPE, 2021-2030 (USD MILLION)
TABLE 521 ISRAEL RISK MANAGEMENT MARKET, BY ENTERPRISE SIZE, 2021-2030 (USD MILLION)
TABLE 522 ISRAEL RISK MANAGEMENT MARKET, BY VERTICAL, 2021-2030 (USD MILLION)
TABLE 523 ISRAEL BFSI IN RISK MANAGEMENT MARKET, BY RISK TYPE, 2021-2030 (USD MILLION)
TABLE 524 ISRAEL IT & TELECOM IN RISK MANAGEMENT MARKET, BY RISK TYPE, 2021-2030 (USD MILLION)
TABLE 525 ISRAEL HEALTHCARE IN RISK MANAGEMENT MARKET, BY RISK TYPE, 2021-2030 (USD MILLION)
TABLE 526 ISRAEL RETAIL IN RISK MANAGEMENT MARKET, BY RISK TYPE, 2021-2030 (USD MILLION)
TABLE 527 ISRAEL MANUFACTURING IN RISK MANAGEMENT MARKET, BY RISK TYPE, 2021-2030 (USD MILLION)
TABLE 528 ISRAEL GOVERNMENT AND DEFENCE IN RISK MANAGEMENT MARKET, BY RISK TYPE, 2021-2030 (USD MILLION)
TABLE 529 ISRAEL TRANSPORT AND LOGISTIC IN RISK MANAGEMENT MARKET, BY RISK TYPE, 2021-2030 (USD MILLION)
TABLE 530 ISRAEL ENERGY AND UTILITIES IN RISK MANAGEMENT MARKET, BY RISK TYPE, 2021-2030 (USD MILLION)
TABLE 531 OMAN RISK MANAGEMENT MARKET, BY RISK TYPE, 2021-2030 (USD MILLION)
TABLE 532 OMAN RISK MANAGEMENT MARKET, BY FIRM TYPE, 2021-2030 (USD MILLION)
TABLE 533 OMAN RISK MANAGEMENT MARKET, BY ENTERPRISE SIZE, 2021-2030 (USD MILLION)
TABLE 534 OMAN RISK MANAGEMENT MARKET, BY VERTICAL, 2021-2030 (USD MILLION)
TABLE 535 OMAN BFSI IN RISK MANAGEMENT MARKET, BY RISK TYPE, 2021-2030 (USD MILLION)
TABLE 536 OMAN IT & TELECOM IN RISK MANAGEMENT MARKET, BY RISK TYPE, 2021-2030 (USD MILLION)
TABLE 537 OMAN HEALTHCARE IN RISK MANAGEMENT MARKET, BY RISK TYPE, 2021-2030 (USD MILLION)
TABLE 538 OMAN RETAIL IN RISK MANAGEMENT MARKET, BY RISK TYPE, 2021-2030 (USD MILLION)
TABLE 539 OMAN MANUFACTURING IN RISK MANAGEMENT MARKET, BY RISK TYPE, 2021-2030 (USD MILLION)
TABLE 540 OMAN GOVERNMENT AND DEFENCE IN RISK MANAGEMENT MARKET, BY RISK TYPE, 2021-2030 (USD MILLION)
TABLE 541 OMAN TRANSPORT AND LOGISTIC IN RISK MANAGEMENT MARKET, BY RISK TYPE, 2021-2030 (USD MILLION)
TABLE 542 OMAN ENERGY AND UTILITIES IN RISK MANAGEMENT MARKET, BY RISK TYPE, 2021-2030 (USD MILLION)
TABLE 543 KUWAIT RISK MANAGEMENT MARKET, BY RISK TYPE, 2021-2030 (USD MILLION)
TABLE 544 KUWAIT RISK MANAGEMENT MARKET, BY FIRM TYPE, 2021-2030 (USD MILLION)
TABLE 545 KUWAIT RISK MANAGEMENT MARKET, BY ENTERPRISE SIZE, 2021-2030 (USD MILLION)
TABLE 546 KUWAIT RISK MANAGEMENT MARKET, BY VERTICAL, 2021-2030 (USD MILLION)
TABLE 547 KUWAIT BFSI IN RISK MANAGEMENT MARKET, BY RISK TYPE, 2021-2030 (USD MILLION)
TABLE 548 KUWAIT IT & TELECOM IN RISK MANAGEMENT MARKET, BY RISK TYPE, 2021-2030 (USD MILLION)
TABLE 549 KUWAIT HEALTHCARE IN RISK MANAGEMENT MARKET, BY RISK TYPE, 2021-2030 (USD MILLION)
TABLE 550 KUWAIT RETAIL IN RISK MANAGEMENT MARKET, BY RISK TYPE, 2021-2030 (USD MILLION)
TABLE 551 KUWAIT MANUFACTURING IN RISK MANAGEMENT MARKET, BY RISK TYPE, 2021-2030 (USD MILLION)
TABLE 552 KUWAIT GOVERNMENT AND DEFENCE IN RISK MANAGEMENT MARKET, BY RISK TYPE, 2021-2030 (USD MILLION)
TABLE 553 KUWAIT TRANSPORT AND LOGISTIC IN RISK MANAGEMENT MARKET, BY RISK TYPE, 2021-2030 (USD MILLION)
TABLE 554 KUWAIT ENERGY AND UTILITIES IN RISK MANAGEMENT MARKET, BY RISK TYPE, 2021-2030 (USD MILLION)
TABLE 555 BAHRAIN RISK MANAGEMENT MARKET, BY RISK TYPE, 2021-2030 (USD MILLION)
TABLE 556 BAHRAIN RISK MANAGEMENT MARKET, BY FIRM TYPE, 2021-2030 (USD MILLION)
TABLE 557 BAHRAIN RISK MANAGEMENT MARKET, BY ENTERPRISE SIZE, 2021-2030 (USD MILLION)
TABLE 558 BAHRAIN RISK MANAGEMENT MARKET, BY VERTICAL, 2021-2030 (USD MILLION)
TABLE 559 BAHRAIN BFSI IN RISK MANAGEMENT MARKET, BY RISK TYPE, 2021-2030 (USD MILLION)
TABLE 560 BAHRAIN IT & TELECOM IN RISK MANAGEMENT MARKET, BY RISK TYPE, 2021-2030 (USD MILLION)
TABLE 561 BAHRAIN HEALTHCARE IN RISK MANAGEMENT MARKET, BY RISK TYPE, 2021-2030 (USD MILLION)
TABLE 562 BAHRAIN RETAIL IN RISK MANAGEMENT MARKET, BY RISK TYPE, 2021-2030 (USD MILLION)
TABLE 563 BAHRAIN MANUFACTURING IN RISK MANAGEMENT MARKET, BY RISK TYPE, 2021-2030 (USD MILLION)
TABLE 564 BAHRAIN GOVERNMENT AND DEFENCE IN RISK MANAGEMENT MARKET, BY RISK TYPE, 2021-2030 (USD MILLION)
TABLE 565 BAHRAIN TRANSPORT AND LOGISTIC IN RISK MANAGEMENT MARKET, BY RISK TYPE, 2021-2030 (USD MILLION)
TABLE 566 BAHRAIN ENERGY AND UTILITIES IN RISK MANAGEMENT MARKET, BY RISK TYPE, 2021-2030 (USD MILLION)
TABLE 567 REST OF MIDDLE EAST AND AFRICA RISK MANAGEMENT MARKET, BY RISK TYPE, 2021-2030 (USD MILLION)
TABLE 568 SOUTH AMERICA RISK MANAGEMENT MARKET, BY COUNTRY, 2021-2030 (USD MILLION)
TABLE 569 SOUTH AMERICA RISK MANAGEMENT MARKET, BY RISK TYPE, 2021-2030 (USD MILLION)
TABLE 570 SOUTH AMERICA RISK MANAGEMENT MARKET, BY FIRM TYPE, 2021-2030 (USD MILLION)
TABLE 571 SOUTH AMERICA RISK MANAGEMENT MARKET, BY ENTERPRISE SIZE, 2021-2030 (USD MILLION)
TABLE 572 SOUTH AMERICA RISK MANAGEMENT MARKET, BY VERTICAL, 2021-2030 (USD MILLION)
TABLE 573 SOUTH AMERICA BFSI IN RISK MANAGEMENT MARKET, BY RISK TYPE, 2021-2030 (USD MILLION)
TABLE 574 SOUTH AMERICA IT & TELECOM IN RISK MANAGEMENT MARKET, BY RISK TYPE, 2021-2030 (USD MILLION)
TABLE 575 SOUTH AMERICA HEALTHCARE IN RISK MANAGEMENT MARKET, BY RISK TYPE, 2021-2030 (USD MILLION)
TABLE 576 SOUTH AMERICA RETAIL IN RISK MANAGEMENT MARKET, BY RISK TYPE, 2021-2030 (USD MILLION)
TABLE 577 SOUTH AMERICA MANUFACTURING IN RISK MANAGEMENT MARKET, BY RISK TYPE, 2021-2030 (USD MILLION)
TABLE 578 SOUTH AMERICA GOVERNMENT AND DEFENCE IN RISK MANAGEMENT MARKET, BY RISK TYPE, 2021-2030 (USD MILLION)
TABLE 579 SOUTH AMERICA TRANSPORT AND LOGISTIC IN RISK MANAGEMENT MARKET, BY RISK TYPE, 2021-2030 (USD MILLION)
TABLE 580 SOUTH AMERICA ENERGY AND UTILITIES IN RISK MANAGEMENT MARKET, BY RISK TYPE, 2021-2030 (USD MILLION)
TABLE 581 BRAZIL RISK MANAGEMENT MARKET, BY RISK TYPE, 2021-2030 (USD MILLION)
TABLE 582 BRAZIL RISK MANAGEMENT MARKET, BY FIRM TYPE, 2021-2030 (USD MILLION)
TABLE 583 BRAZIL RISK MANAGEMENT MARKET, BY ENTERPRISE SIZE, 2021-2030 (USD MILLION)
TABLE 584 BRAZIL RISK MANAGEMENT MARKET, BY VERTICAL, 2021-2030 (USD MILLION)
TABLE 585 BRAZIL BFSI IN RISK MANAGEMENT MARKET, BY RISK TYPE, 2021-2030 (USD MILLION)
TABLE 586 BRAZIL IT & TELECOM IN RISK MANAGEMENT MARKET, BY RISK TYPE, 2021-2030 (USD MILLION)
TABLE 587 BRAZIL HEALTHCARE IN RISK MANAGEMENT MARKET, BY RISK TYPE, 2021-2030 (USD MILLION)
TABLE 588 BRAZIL RETAIL IN RISK MANAGEMENT MARKET, BY RISK TYPE, 2021-2030 (USD MILLION)
TABLE 589 BRAZIL MANUFACTURING IN RISK MANAGEMENT MARKET, BY RISK TYPE, 2021-2030 (USD MILLION)
TABLE 590 BRAZIL GOVERNMENT AND DEFENCE IN RISK MANAGEMENT MARKET, BY RISK TYPE, 2021-2030 (USD MILLION)
TABLE 591 BRAZIL TRANSPORT AND LOGISTIC IN RISK MANAGEMENT MARKET, BY RISK TYPE, 2021-2030 (USD MILLION)
TABLE 592 BRAZIL ENERGY AND UTILITIES IN RISK MANAGEMENT MARKET, BY RISK TYPE, 2021-2030 (USD MILLION)
TABLE 593 ARGENTINA RISK MANAGEMENT MARKET, BY RISK TYPE, 2021-2030 (USD MILLION)
TABLE 594 ARGENTINA RISK MANAGEMENT MARKET, BY FIRM TYPE, 2021-2030 (USD MILLION)
TABLE 595 ARGENTINA RISK MANAGEMENT MARKET, BY ENTERPRISE SIZE, 2021-2030 (USD MILLION)
TABLE 596 ARGENTINA RISK MANAGEMENT MARKET, BY VERTICAL, 2021-2030 (USD MILLION)
TABLE 597 ARGENTINA BFSI IN RISK MANAGEMENT MARKET, BY RISK TYPE, 2021-2030 (USD MILLION)
TABLE 598 ARGENTINA IT & TELECOM IN RISK MANAGEMENT MARKET, BY RISK TYPE, 2021-2030 (USD MILLION)
TABLE 599 ARGENTINA HEALTHCARE IN RISK MANAGEMENT MARKET, BY RISK TYPE, 2021-2030 (USD MILLION)
TABLE 600 ARGENTINA RETAIL IN RISK MANAGEMENT MARKET, BY RISK TYPE, 2021-2030 (USD MILLION)
TABLE 601 ARGENTINA MANUFACTURING IN RISK MANAGEMENT MARKET, BY RISK TYPE, 2021-2030 (USD MILLION)
TABLE 602 ARGENTINA GOVERNMENT AND DEFENCE IN RISK MANAGEMENT MARKET, BY RISK TYPE, 2021-2030 (USD MILLION)
TABLE 603 ARGENTINA TRANSPORT AND LOGISTIC IN RISK MANAGEMENT MARKET, BY RISK TYPE, 2021-2030 (USD MILLION)
TABLE 604 ARGENTINA ENERGY AND UTILITIES IN RISK MANAGEMENT MARKET, BY RISK TYPE, 2021-2030 (USD MILLION)
TABLE 605 REST OF SOUTH AMERICA RISK MANAGEMENT MARKET, BY RISK TYPE, 2021-2030 (USD MILLION)
Lista de figuras
FIGURE 1 GLOBAL RISK MANAGEMENT MARKET: SEGMENTATION
FIGURE 2 GLOBAL RISK MANAGEMENT MARKET: DATA TRIANGULATION
FIGURE 3 GLOBAL RISK MANAGEMENT MARKET: DROC ANALYSIS
FIGURE 4 GLOBAL RISK MANAGEMENT MARKET: GLOBAL VS REGIONAL MARKET ANALYSIS
FIGURE 5 GLOBAL RISK MANAGEMENT MARKET: COMPANY RESEARCH ANALYSIS
FIGURE 6 GLOBAL RISK MANAGEMENT MARKET: INTERVIEW DEMOGRAPHICS
FIGURE 7 GLOBAL RISK MANAGEMENT MARKET: DBMR MARKET POSITION GRID
FIGURE 8 GLOBAL RISK MANAGEMENT MARKET: MARKET APPLICATION COVERAGE GRID
FIGURE 9 GLOBAL RISK MANAGEMENT MARKET: VENDOR SHARE ANALYSIS
FIGURE 10 GLOBAL RISK MANAGEMENT MARKET: MULTIVARIATE MODELLING
FIGURE 11 GLOBAL RISK MANAGEMENT MARKET: RISK TYPE TIMELINE CURVE
FIGURE 12 GLOBAL RISK MANAGEMENT MARKET: SEGMENTATION
FIGURE 13 GROWING AWARENESS TOWARDS RISK MANAGEMENT SERVICES IS EXPECTED TO DRIVE THE GROWTH OF THE GLOBAL RISK MANAGEMENT MARKET IN THE FORECAST PERIOD OF 2023 TO 2030
FIGURE 14 COMPLIANCE RISK SEGMENT IS EXPECTED TO ACCOUNT FOR THE LARGEST SHARE OF GLOBAL RISK MANAGEMENT MARKET IN 2023 TO 2030
FIGURE 15 DRIVERS, RESTRAINTS, OPPORTUNITIES, AND CHALLENGES OF THE GLOBAL RISK MANAGEMENT MARKET
FIGURE 16 RISK MANAGEMENT FRAMEWORK
FIGURE 17 KOF GLOBALIZATION INDEX
FIGURE 18 U.S. ANNUAL INFLATION RATES (2013 TO 2023)
FIGURE 19 GLOBAL RISK MANAGEMENT MARKET: BY RISK TYPE, 2022
FIGURE 20 GLOBAL RISK MANAGEMENT MARKET: BY FIRM TYPE, 2022
FIGURE 21 GLOBAL RISK MANAGEMENT MARKET: BY ENTERPRISE SIZE, 2022
FIGURE 22 GLOBAL RISK MANAGEMENT MARKET: BY VERTICAL, 2022
FIGURE 23 GLOBAL RISK MANAGEMENTS MARKET: SNAPSHOT (2022)
FIGURE 24 GLOBAL RISK MANAGEMENT MARKET: COMPANY SHARE 2022 (%)
FIGURE 25 NORTH AMERICA RISK MANAGEMENT MARKET: COMPANY SHARE 2022 (%)
FIGURE 26 EUROPE RISK MANAGEMENT MARKET: COMPANY SHARE 2022 (%)
FIGURE 27 ASIA-PACIFIC RISK MANAGEMENT MARKET: COMPANY SHARE 2022 (%)
Metodología de investigación
La recopilación de datos y el análisis del año base se realizan utilizando módulos de recopilación de datos con muestras de gran tamaño. La etapa incluye la obtención de información de mercado o datos relacionados a través de varias fuentes y estrategias. Incluye el examen y la planificación de todos los datos adquiridos del pasado con antelación. Asimismo, abarca el examen de las inconsistencias de información observadas en diferentes fuentes de información. Los datos de mercado se analizan y estiman utilizando modelos estadísticos y coherentes de mercado. Además, el análisis de la participación de mercado y el análisis de tendencias clave son los principales factores de éxito en el informe de mercado. Para obtener más información, solicite una llamada de un analista o envíe su consulta.
La metodología de investigación clave utilizada por el equipo de investigación de DBMR es la triangulación de datos, que implica la extracción de datos, el análisis del impacto de las variables de datos en el mercado y la validación primaria (experto en la industria). Los modelos de datos incluyen cuadrícula de posicionamiento de proveedores, análisis de línea de tiempo de mercado, descripción general y guía del mercado, cuadrícula de posicionamiento de la empresa, análisis de patentes, análisis de precios, análisis de participación de mercado de la empresa, estándares de medición, análisis global versus regional y de participación de proveedores. Para obtener más información sobre la metodología de investigación, envíe una consulta para hablar con nuestros expertos de la industria.
Personalización disponible
Data Bridge Market Research es líder en investigación formativa avanzada. Nos enorgullecemos de brindar servicios a nuestros clientes existentes y nuevos con datos y análisis que coinciden y se adaptan a sus objetivos. El informe se puede personalizar para incluir análisis de tendencias de precios de marcas objetivo, comprensión del mercado de países adicionales (solicite la lista de países), datos de resultados de ensayos clínicos, revisión de literatura, análisis de mercado renovado y base de productos. El análisis de mercado de competidores objetivo se puede analizar desde análisis basados en tecnología hasta estrategias de cartera de mercado. Podemos agregar tantos competidores sobre los que necesite datos en el formato y estilo de datos que esté buscando. Nuestro equipo de analistas también puede proporcionarle datos en archivos de Excel sin procesar, tablas dinámicas (libro de datos) o puede ayudarlo a crear presentaciones a partir de los conjuntos de datos disponibles en el informe.

