Image

Mercado global de premezclas listas para beber/de alta resistencia: tendencias de la industria y pronóstico para 2029

Bebida alimenticia

Image

Mercado global de premezclas listas para beber/de alta resistencia: tendencias de la industria y pronóstico para 2029

  • Bebida alimenticia
  • Próximo informe
  • abril de 2022
  • Global
  • 350 páginas
  • Número de mesas: 220
  • Número de figuras: 60

Mercado global de premezclas listas para beber/de alta resistencia: tendencias de la industria y pronóstico para 2029

Tamaño del mercado en miles de millones de dólares

CAGR: % Diagram

Diagram Período de pronóstico 2021-2029
Diagram Tamaño del mercado (año base) USD 35539,62 Millones
Diagram Tamaño del mercado (año previsto) USD 48265,54 Millones
Diagram CAGR %

Mercado global de premezclas listas para beber/de alta resistencia por tipo (RTD a base de malta, RTD a base de bebidas espirituosas, RTD a base de vino, otros), tipo de procesamiento (compuesto único y mezclado), género (masculino y femenino), tipo de embalaje (botella, latas y Otros), Comercio (Off-Trade, On-Trade): Tendencias de la industria y pronóstico hasta 2029

Ready to Drink/High Strength Premixes Market

Análisis y tamaño del mercado

La categoría de bebidas listas para beber (RTD) ha experimentado varios cambios críticos en respuesta a la dinámica cambiante de las preferencias y hábitos de bebida de los consumidores globales. A pesar de las importantes críticas, los grandes avances logrados en la demanda y la comercialización de bebidas alcohólicas se han ganado un lugar respetable en la categoría de RTD. El impulso de la demanda no ha perdido mucho brillo debido al alto nivel de conveniencia brindado a los consumidores, quienes han sido fundamentales para impulsar la popularidad de las bebidas alcohólicas fáciles de preparar.

Data Bridge Market Research analiza que el mercado de premezclas listas para beber/de alta concentración
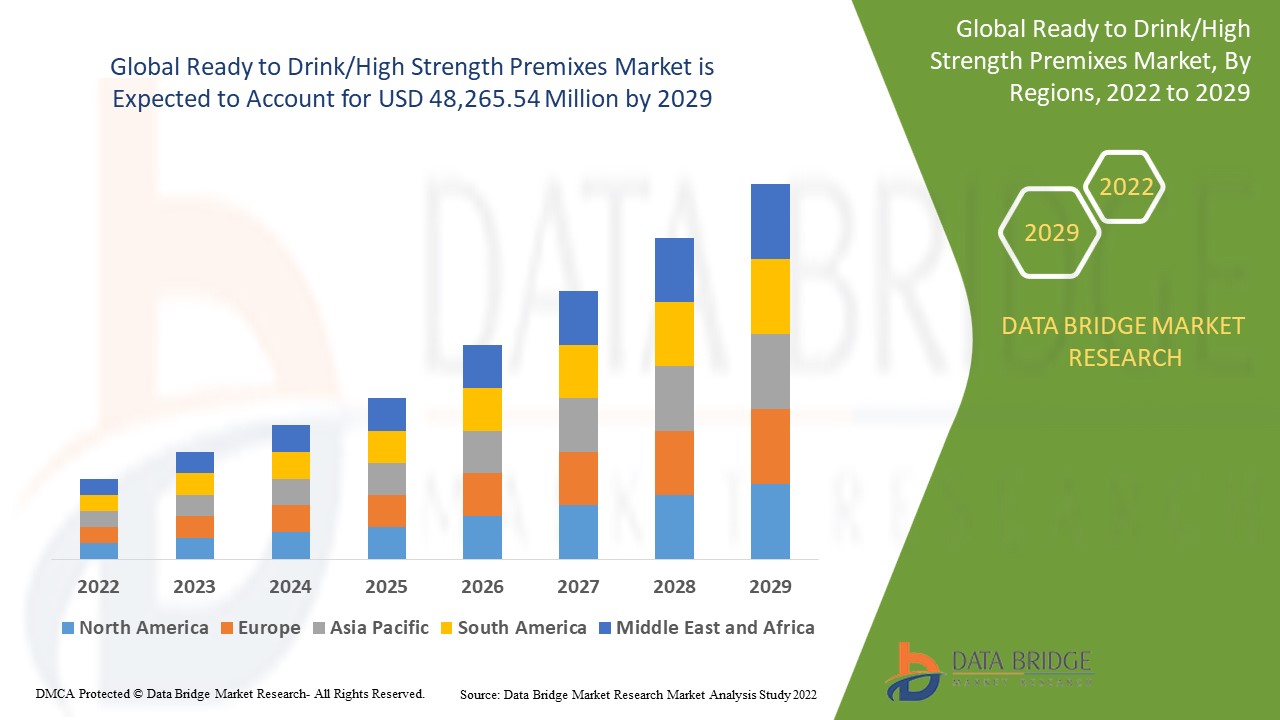
 se valoró en 35.539,62 millones de dólares en 2021 y se espera que alcance el valor de 48.265,54 millones de dólares en 2029, con una tasa compuesta anual del 3,9% durante el período previsto de 2022 para 2029.

Definición de mercado

Las premezclas listas para beber (RTD) son bebidas que han sido premezcladas y están listas para beber en cualquier momento. Hay dos tipos de premezclas listas para beber: RTD y premezclas de alta resistencia. Las bebidas RTD se componen principalmente de bebidas espirituosas, de vino o de malta. bebidas alcohólicas. Las premezclas de alta concentración incluyen bebidas premezcladas a base de alcohol.

Alcance del informe y segmentación del mercado

Métrica de informe

Detalles

Período de pronóstico

2022 a 2029

Año base

2021

Años históricos

2020 (Personalizable para 2019 - 2014)

Unidades Cuantitativas

Ingresos en millones de dólares, volúmenes en unidades, precios en dólares

Segmentos cubiertos

Tipo (RTD a base de malta, RTD a base de bebidas espirituosas, RTD a base de vino, otros), tipo de procesamiento (compuesto único y mezclado), género (masculino y femenino), tipo de embalaje (botella, latas y otros), comercio (fuera de comercio, en -Comercio)

Países cubiertos

EE.UU., Canadá y México en Norteamérica, Alemania, Suecia, Polonia, Dinamarca, Italia, Francia, Reino Unido, Países Bajos, Suiza, Bélgica, Rusia, Italia, España, Turquía, Resto de Europa en Europa, China, Japón, India, Sur Corea, Singapur, Malasia, Australia, Tailandia, Indonesia, Filipinas, Resto de Asia-Pacífico (APAC), Arabia Saudita, Emiratos Árabes Unidos, Sudáfrica, Egipto, Israel, Resto de Medio Oriente y África ( MEA) como parte de Medio Oriente y África (MEA), Brasil, Argentina y Resto de Sudamérica como parte de Sudamérica

Actores del mercado cubiertos

Davide Campari-Milano NV (Países Bajos), Diageo PLC (Reino Unido), Halewood International Limited (Reino Unido), Asahi Group Holdings, Ltd. (Japón), Accolade Wines (Australia), Bacardi Limited (Bermudas), Mike's Hard Lemonade Co. ( EE.UU.), Castel Group (Francia), Suntory Holdings Limited (Japón), Anheuser-Busch InBev SA/NV (Bélgica), The Brown-Forman Corporation (EE.UU.), United Brands Company, Inc. (EE.UU.), PernodRicard SA (Francia) ), The Miller Brewing Company (EE. UU.)

Oportunidades

  • Las economías emergentes facilitarán la expansión del mercado
  • Los consumidores demandan bebidas preparadas
  • Crecientes avances tecnológicos e innovación de productos.

Dinámica del mercado de premezclas listas para beber/de alta resistencia

Conductores

  • Creciente popularidad de las bebidas con sabor a bajo contenido de alcohol

La creciente popularidad de las bebidas con bajo contenido de alcohol y saborizadas entre un número cada vez mayor de adultos jóvenes es un importante impulsor del mercado de RTD alcohólicos/premezclas de alta graduación. La creciente popularidad de las bebidas alcohólicas saludables, particularmente entre los millennials, está impulsando la demanda de premezclas alcohólicas/RTD de alta graduación. La creciente propensión de los consumidores a consumir licores fuertes para sustituir los licores fuertes ha impulsado significativamente la demanda.

  • Estrategias de marketing innovadoras para los consumidores objetivo.

Los estilos de vida cambiantes de los clientes, la mayor demanda de premezclas listas para beber por parte de los jóvenes, la creciente importancia de sabores nuevos y étnicos y los avances innovadores en las actividades de marketing y promoción contribuyen al crecimiento del mercado global de premezclas listas para beber. La penetración del comercio electrónico, precios bajos, fácil acceso, la introducción de cócteles con ingredientes naturales y beneficiosos para la salud en premezclas listas para beber, la creciente inversión en pubs y bares y una variedad de sabores disponibles en listas para beber Las premezclas impulsan el crecimiento del mercado global para este producto.

Oportunidad

Las economías emergentes ofrecen numerosas oportunidades para que los fabricantes de premezclas listas para beber amplíen sus operaciones. Durante el período de pronóstico, se espera que el mercado de premezclas listas para beber crezca a un ritmo exponencial. Sin embargo, los RTD a base de vino y los RTD a base de bebidas espirituosas mostrarán el crecimiento más sólido en la categoría de productos del mercado de premezclas listas para beber. El deseo de conveniencia de los consumidores está impulsando a las empresas a expandir su negocio de premezclas.

Restricciones

Sin embargo, factores como las creencias religiosas o culturales en varios países, los elevados impuestos y aranceles y los efectos negativos del alcohol sobre la salud pueden impedir el crecimiento del mercado. Además, las estrictas normas y reglamentos sobre la publicidad de productos alcohólicos, así como el aumento del número de campañas contra el alcohol, están teniendo un impacto negativo en el crecimiento del mercado de premezclas de alta concentración.

Este informe de mercado de Premezclas listas para beber/de alta resistencia proporciona detalles de nuevos desarrollos recientes, regulaciones comerciales, análisis de importación y exportación, análisis de producción, optimización de la cadena de valor, participación de mercado, impacto de los actores del mercado nacional y localizado, analiza oportunidades en términos de ingresos emergentes. Bolsillos, cambios en las regulaciones del mercado, análisis estratégico del crecimiento del mercado, tamaño del mercado, crecimientos del mercado de categorías, nichos de aplicación y dominio, aprobaciones de productos, lanzamientos de productos, expansiones geográficas, innovaciones tecnológicas en el mercado. Para obtener más información sobre el mercado de premezclas listas para beber/de alta resistencia, comuníquese con Data Bridge Market Research para obtener un resumen del analista, nuestro equipo lo ayudará a tomar una decisión de mercado informada para lograr el crecimiento del mercado.

Impacto de COVID-19 en el mercado de premezclas listas para beber/de alta resistencia

La pandemia de COVID-19 ha tenido un impacto sustancial en el negocio de las premezclas listas para beber. Durante el confinamiento, varios gobiernos no incluyen el alcohol en su lista de artículos esenciales. Todos los canales de distribución han sido cerrados. Los pubs y discotecas, que representaban la mayoría de las ventas de premezclas listas para beber, también cerraron porque el distanciamiento social disuadió a la gente de visitar dichos establecimientos. Además, las actividades de importación y exportación han provocado interrupciones en la cadena de suministro. La pandemia de Corona ha tenido un impacto significativo tanto en la producción como en el consumo.

Alcance del mercado global de premezclas listas para beber/de alta resistencia

El mercado de Premezclas listas para beber/de alta resistencia está segmentado según el tipo, el tipo de procesamiento, el sexo, el tipo de embalaje y el comercio. El crecimiento entre estos segmentos lo ayudará a analizar los segmentos de escaso crecimiento en las industrias y brindará a los usuarios una valiosa descripción general del mercado e información sobre el mercado para ayudarlos a tomar decisiones estratégicas para identificar las aplicaciones principales del mercado.

Tipo

  • RTDS a base de malta
  • Cerveza
  • Bebidas de malta aromatizadas (FMB)
  • RTDS basado en espíritu
  • Vodka
  • Whisky
  • Ron
  • Tequila
  • Otros
  • RTDS a base de vino
  • Otros

Tipo de procesamiento

  • Compuesto único
  • Mezclado

Género

  • Masculino
  • Femenino

Tipo de embalaje

  • Botella
  • Poder
  • Otros

Comercio

  • En el comercio
  • Fuera de comercio

Análisis/Perspectivas regionales del mercado de premezclas listas para beber/de alta resistencia

Se analiza el mercado de premezclas listas para beber/de alta resistencia y se proporcionan conocimientos y tendencias sobre el tamaño del mercado por país, tipo, tipo de procesamiento, género, tipo de embalaje y comercio como se mencionó anteriormente.

Los países cubiertos en el informe de mercado de Premezclas listas para beber/de alta resistencia son EE. UU., Canadá y México en América del Norte, Alemania, Suecia, Polonia, Dinamarca, Italia, Francia, Reino Unido, Países Bajos, Suiza, Bélgica, Rusia, Italia, España. Turquía, Resto de Europa en Europa, China, Japón, India, Corea del Sur, Singapur, Malasia, Australia, Tailandia, Indonesia, Filipinas, Resto de Asia-Pacífico (APAC) en Asia-Pacífico (APAC), Arabia Saudita, Emiratos Árabes Unidos , Sudáfrica, Egipto, Israel, Resto de Medio Oriente y África (MEA) como parte de Medio Oriente y África (MEA), Brasil, Argentina y Resto de Sudamérica como parte de Sudamérica.

China es el país dominante en la región de Asia y el Pacífico debido a su gran población y alto consumo de bebidas alcohólicas. Debido a que es menos dañino para la salud, la gente o los consumidores en China se han inclinado hacia él, lo que ha resultado en una alta generación de ingresos para el producto. Debido a que la gente en los Estados Unidos es muy consciente de los beneficios para la salud de las bebidas bajas en alcohol, los fabricantes han comenzado a vender sus productos en este país. Además, el Reino Unido domina la región europea debido al alto consumo de productos con bajo contenido de alcohol en la región.

La sección de países del informe también proporciona factores que impactan el mercado individual y cambios en la regulación del mercado que impactan las tendencias actuales y futuras del mercado. Puntos de datos como el análisis de la cadena de valor ascendente y descendente, las tendencias técnicas y el análisis de las cinco fuerzas de Porter y los estudios de casos son algunos de los indicadores utilizados para pronosticar el escenario del mercado para países individuales. Además, se consideran la presencia y disponibilidad de marcas globales y los desafíos que enfrentan debido a la competencia grande o escasa de marcas locales y nacionales, el impacto de los aranceles internos y las rutas comerciales, al tiempo que se proporciona un análisis de pronóstico de los datos del país.

Panorama competitivo y cuota de mercado Análisis Listo para beber/Premezclas de alta resistencia

El panorama competitivo del mercado Listo para beber/premezclas de alta resistencia proporciona detalles por competidor. Los detalles incluidos son descripción general de la empresa, finanzas de la empresa, ingresos generados, potencial de mercado, inversión en investigación y desarrollo, nuevas iniciativas de mercado, presencia global, sitios e instalaciones de producción, capacidades de producción, fortalezas y debilidades de la empresa, lanzamiento de producto, ancho y amplitud del producto, aplicación. dominio. Los puntos de datos anteriores proporcionados solo están relacionados con el enfoque de las empresas relacionado con el mercado de Premezclas listas para beber/de alta resistencia.

Algunos de los principales actores que operan en el Mercado Listo para Beber/Premezclas de Alta Resistencia son:

  • Davide Campari-Milano NV (Italia)
  • Diageo PLC (Reino Unido)
  • Halewood International Limited (Reino Unido)
  • Asahi Group Holdings, Ltd. (Japón)
  • Vinos premiados (Australia)
  • Bacardi Limited (Bermudas)
  • Mike's Hard Lemonade Co. (EE. UU.)
  • Grupo Castel (Francia)
  • Suntory Holdings Limited (Japón)
  • Anheuser-Busch InBev SA/NV (Bélgica)
  • La Corporación Brown-Forman (EE.UU.)
  • United Brands Company, Inc. (EE. UU.)
  • PernodRicard SA (Francia)
  • The Miller Brewing Company (EE. UU.)


SKU-

LISTA DE TABLAS

TABLA 1 GLOBAL RTDS A BASE DE MALTA EN EL MERCADO LISTO PARA BEBER/PREMEZCLAS DE ALTA RESISTENCIA, POR REGIÓN, 2018-2027 (MILLONES DE USD)

TABLA 2 MERCADO MUNDIAL DE PREMEZCLAS LISTAS PARA BEBER/ DE ALTA RESISTENCIA, POR TIPO, 2018-2027 (MILLONES DE USD)

TABLA 3 GLOBAL RTDS A BASE DE MALTA EN EL MERCADO LISTO PARA BEBER/PREMEZCLAS DE ALTA FORTALEZA, POR TIPO, 2018-2027 (MILLONES DE USD)

TABLA 4 GLOBAL DE RTDS A BASE DE LICORES EN EL MERCADO LISTO PARA BEBER/PREMEZCLAS DE ALTA CONTENCIÓN, POR REGIÓN, 2018-2027 (MILLONES DE USD)

TABLA 5 GLOBAL DE RTDS A BASE DE LICORES EN EL MERCADO LISTO PARA BEBER/PREMEZCLAS DE ALTA CONTENCIÓN, POR TIPO, 2018-2027 (MILLONES DE USD)

TABLA 6 GLOBAL DE RTDS A BASE DE VINO EN EL MERCADO LISTO PARA BEBER/PREMEZCLAS DE ALTA FORTALEZA, POR REGIÓN, 2018-2027 (MILLONES DE USD)

TABLA 7 MERCADO GLOBAL DE OTROS EN LISTOS PARA BEBER/PREMEZCLAS DE ALTA FORTALEZA, POR REGIÓN, 2018-2027 (MILLONES DE USD)

TABLA 8 MERCADO MUNDIAL DE PREMEZCLAS LISTAS PARA BEBER/DE ALTA FORTALEZA, POR TIPO DE PROCESAMIENTO, 2018-2027 (MILLONES DE USD)

TABLA 9 MERCADO GLOBAL DE COMPUESTOS ÚNICOS EN LISTAS PARA BEBER/PREMEZCLAS DE ALTA RESISTENCIA, POR REGIÓN, 2018-2027 (MILLONES DE USD)

TABLA 10 MERCADO MUNDIAL DE MEZCLAS LISTAS PARA BEBER/PREMEZCLAS DE ALTA FORTALEZA, POR REGIÓN, 2018-2027 (MILLONES DE USD)

TABLA 11 MERCADO MUNDIAL DE PREMEZCLAS LISTAS PARA BEBER/DE ALTA FORTALEZA, POR GÉNERO, 2018-2027 (MILLONES DE USD)

TABLA 12 MERCADO MUNDIAL MASCULINO EN PREMEZCLAS LISTAS PARA BEBER/ALTA POTENCIA, POR REGIÓN, 2018-2027 (MILLONES DE USD)

TABLA 13 MERCADO MUNDIAL FEMENINO EN LISTO PARA BEBER/PREMEZCLAS DE ALTA FORTALEZA, POR REGIÓN, 2018-2027 (MILLONES DE USD)

TABLA 14 MERCADO MUNDIAL DE PREMEZCLAS LISTAS PARA BEBER/DE ALTA FORTALEZA, POR TIPO DE ENVASE, 2018-2027 (MILLONES DE USD)

TABLA 15 MERCADO GLOBAL DE BOTELLA LISTA PARA BEBER/PREMEZCLAS DE ALTA FORTALEZA, POR REGIÓN, 2018-2027 (MILLONES DE USD)

TABLA 16 MERCADO MUNDIAL DE LATAS LISTAS PARA BEBER/PREMEZCLAS DE ALTA FORTALEZA, POR REGIÓN, 2018-2027 (MILLONES DE USD)

TABLA 17 MERCADO GLOBAL DE OTROS EN LISTOS PARA BEBER/PREMEZCLAS DE ALTA FORTALEZA, POR REGIÓN, 2018-2027 (MILLONES DE USD)

TABLA 18 MERCADO MUNDIAL DE PREMEZCLAS LISTAS PARA BEBER/DE ALTA FORTALEZA, POR COMERCIO, 2018-2027 (MILLONES DE USD)

TABLA 19 MERCADO EXTERIOR MUNDIAL DE PREMEZCLAS LISTAS PARA BEBER/DE ALTA FORTALEZA, POR REGIÓN, 2018-2027 (MILLONES DE USD)

CUADRO 20 MERCADO FUERA DEL COMERCIO MUNDIAL DE PREMEZCLAS LISTAS PARA BEBER/DE ALTA FORTALEZA, POR COMERCIO, 2018-2027 (MILLONES DE USD)

TABLA 21 VENTA AL POR MENOR MUNDIAL EN TIENDAS EN EL MERCADO DE PREMEZCLAS LISTAS PARA BEBER/DE ALTA FORTALEZA, POR COMERCIO, 2018-2027 (MILLONES DE USD)

TABLA 22 COMERCIO MINORISTA MUNDIAL SIN TIENDAS EN EL MERCADO LISTO PARA BEBER/PREMEZCLAS DE ALTA FORTALEZA, POR COMERCIO, 2018-2027 (MILLONES DE USD)

CUADRO 23 COMERCIO MUNDIAL DE RESTAURACIÓN EN EL MERCADO DE PREMEZCLAS LISTAS PARA BEBER/DE ALTA FORTALEZA, POR REGIÓN, 2018-2027 (MILLONES DE USD)

CUADRO 24 COMERCIO MUNDIAL DE RESTAURACIÓN EN EL MERCADO DE PREMEZCLAS LISTAS PARA BEBER/DE ALTA FORTALEZA, POR COMERCIO, 2018-2027 (MILLONES DE USD)

TABLA 25 MERCADO MUNDIAL DE PREMEZCLAS LISTAS PARA BEBER/ DE ALTA RESISTENCIA, POR REGIÓN, 2018-2027 (MILLONES DE USD)

TABLA 26 MERCADO EUROPEO DE PREMEZCLAS LISTAS PARA BEBER/ DE ALTA FORTALEZA, POR PAÍS, 2018-2027 (MILLONES DE USD)

TABLA 27 MERCADO EUROPEO DE PREMEZCLAS LISTAS PARA BEBER/ DE ALTA FORTALEZA, POR TIPO, 2018-2027 (MILLONES DE USD)

TABLA 28 RTDS A BASE DE BEBIDAS EN EUROPA EN EL MERCADO LISTO PARA BEBER/PREMEZCLAS DE ALTA CONTENCIÓN, POR TIPO, 2018-2027 (MILLONES DE USD)

TABLA 29 RTDS A BASE DE MALTA EN EL MERCADO EUROPEO DE PREMEZCLAS LISTAS PARA BEBER/DE ALTA RESISTENCIA, POR TIPO, 2018-2027 (MILLONES DE USD)

TABLA 30 MERCADO EUROPEO DE LISTOS PARA BEBER/PREMEZCLAS DE ALTA FORTALEZA, POR TIPO DE PROCESAMIENTO, 2018-2027 (MILLONES DE USD)

TABLA 31 MERCADO EUROPEO DE PREMEZCLAS LISTAS PARA BEBER/DE ALTA FORTALEZA, POR GÉNERO, 2018-2027 (MILLONES DE USD)

TABLA 32 MERCADO EUROPEO DE PREMEZCLAS LISTAS PARA BEBER/ DE ALTA FORTALEZA, POR TIPO DE ENVASE, 2018-2027 (MILLONES DE USD)

CUADRO 33 MERCADO EUROPEO DE PREMEZCLAS LISTAS PARA BEBER/DE ALTA FORTALEZA, POR COMERCIO, 2018-2027 (MILLONES DE USD)

CUADRO 34 COMERCIO DE RESTAURACIÓN EN EUROPA DEL MERCADO DE PREMEZCLAS LISTAS PARA BEBER/PREMEZCLAS DE ALTA FORTALEZA, POR COMERCIO, 2018-2027 (MILLONES DE USD)

TABLA 35 MERCADO EXTERIOR EN EUROPA DE PREMEZCLAS LISTAS PARA BEBER/PREMEZCLAS DE ALTA FORTALEZA, POR COMERCIO, 2018-2027 (MILLONES DE USD)

CUADRO 36 COMERCIO MINORISTA EN TIENDAS EN EUROPA EN EL MERCADO DE PREMEZCLAS LISTAS PARA BEBER/PREMEZCLAS DE ALTA CONTENCIÓN, POR COMERCIO, 2018-2027 (MILLONES DE USD)

TABLA 37 COMERCIO MINORISTA EN EUROPA SIN TIENDAS EN EL MERCADO LISTO PARA BEBER/PREMEZCLAS DE ALTA CONTENCIÓN, POR COMERCIO, 2018-2027 (MILLONES DE USD)

TABLA 38 MERCADO DE PREMEZCLAS LISTAS PARA BEBER/DE ALTA FORTALEZA DEL REINO UNIDO, POR TIPO, 2018-2027 (MILLONES DE USD)

TABLA 39 RTDS A BASE DE BEBIDAS LICORES DEL REINO UNIDO EN EL MERCADO DE PREMEZCLAS LISTAS PARA BEBER/DE ALTA CONTENCIÓN, POR TIPO, 2018-2027 (MILLONES DE USD)

TABLA 40 RTDS A BASE DE MALTA DEL REINO UNIDO EN EL MERCADO DE PREMEZCLAS LISTAS PARA BEBER/DE ALTA RESISTENCIA, POR TIPO, 2018-2027 (MILLONES DE USD)

TABLA 41 MERCADO DEL REINO UNIDO LISTO PARA BEBER/PREMEZCLAS DE ALTA FORTALEZA, POR TIPO DE PROCESAMIENTO, 2018-2027 (MILLONES DE USD)

TABLA 42 MERCADO DE PREMEZCLAS LISTAS PARA BEBER/DE ALTA FORTALEZA DEL REINO UNIDO, POR GÉNERO, 2018-2027 (MILLONES DE USD)

TABLA 43 MERCADO DEL REINO UNIDO LISTO PARA BEBER/PREMEZCLAS DE ALTA FORTALEZA, POR TIPO DE ENVASE, 2018-2027 (MILLONES DE USD)

TABLA 44 MERCADO DE PREMEZCLAS LISTAS PARA BEBER/DE ALTA FORTALEZA DEL REINO UNIDO, POR COMERCIO, 2018-2027 (MILLONES DE USD)

TABLA 45 MERCADO DE RESTAURACIÓN DEL REINO UNIDO EN PREMEZCLAS LISTAS PARA BEBER/DE ALTA FORTALEZA, POR COMERCIO, 2018-2027 (MILLONES DE USD)

TABLA 46 MERCADO EXTERIOR DEL REINO UNIDO EN PREMEZCLAS LISTAS PARA BEBER/DE ALTA FORTALEZA, POR COMERCIO, 2018-2027 (MILLONES DE USD)

TABLA 47 COMERCIO MINORISTA EN TIENDAS DEL REINO UNIDO EN EL MERCADO DE PREMEZCLAS LISTAS PARA BEBER/DE ALTA FORTALEZA, POR COMERCIO, 2018-2027 (MILLONES DE USD)

TABLA 48 MERCADO MINORISTA SIN TIENDAS EN EL REINO UNIDO, EN EL MERCADO DE PREMEZCLAS LISTAS PARA BEBER/DE ALTA CONTENCIÓN, POR COMERCIO, 2018-2027 (MILLONES DE USD)

TABLA 49 MERCADO DE ALEMANIA LISTO PARA BEBER/PREMEZCLAS DE ALTA FORTALEZA, POR TIPO, 2018-2027 (MILLONES DE USD)

TABLA 50 RTDS A BASE DE LICORES EN ALEMANIA EN EL MERCADO DE PREMEZCLAS LISTAS PARA BEBER/DE ALTA FORTALEZA, POR TIPO, 2018-2027 (MILLONES DE USD)

TABLA 51 RTDS A BASE DE MALTA DE ALEMANIA EN EL MERCADO DE PREMEZCLAS LISTAS PARA BEBER/DE ALTA RESISTENCIA, POR TIPO, 2018-2027 (MILLONES DE USD)

TABLA 52 MERCADO DE ALEMANIA LISTOS PARA BEBER/PREMEZCLAS DE ALTA FORTALEZA, POR TIPO DE PROCESAMIENTO, 2018-2027 (MILLONES DE USD)

TABLA 53 MERCADO DE INDIA LISTO PARA BEBER/PREMEZCLAS DE ALTA FORTALEZA, POR GÉNERO, 2018-2027 (MILLONES DE USD)

TABLA 54 MERCADO DE ALEMANIA LISTO PARA BEBER/PREMEZCLAS DE ALTA FORTALEZA, POR TIPO DE ENVASE, 2018-2027 (MILLONES DE USD)

CUADRO 55 MERCADO DE ALEMANIA LISTAS PARA BEBER/PREMEZCLAS DE ALTA FORTALEZA, POR COMERCIO, 2018-2027 (MILLONES DE USD)

CUADRO 56 COMERCIO DE ALEMANIA EN EL MERCADO DE PREMEZCLAS LISTAS PARA BEBER/DE ALTA FORTALEZA, POR COMERCIO, 2018-2027 (MILLONES DE USD)

TABLA 57 MERCADO EXTERIOR DE ALEMANIA EN EL MERCADO DE PREMEZCLAS LISTAS PARA BEBER/DE ALTA FORTALEZA, POR COMERCIO, 2018-2027 (MILLONES DE USD)

TABLA 58 COMERCIO MINORISTA EN TIENDAS EN ALEMANIA EN EL MERCADO DE PREMEZCLAS LISTAS PARA BEBER/DE ALTA FORTALEZA, POR COMERCIO, 2018-2027 (MILLONES DE USD)

TABLA 59 ALEMANIA COMERCIO MINORISTA SIN TIENDAS EN EL MERCADO DE PREMEZCLAS LISTAS PARA BEBER/DE ALTA CONTENCIÓN, POR COMERCIO, 2018-2027 (MILLONES DE USD)

TABLA 60 MERCADO DE ESPAÑA LISTO PARA BEBER/PREMEZCLAS DE ALTA FORTALEZA, POR TIPO, 2018-2027 (MILLONES DE USD)

TABLA 61 ESPAÑA RTDS A BASE DE LICORES EN EL MERCADO LISTO PARA BEBER/PREMEZCLAS DE ALTA POTENCIA, POR TIPO, 2018-2027 (MILLONES DE USD)

TABLA 62 ESPAÑA RTDS A BASE DE MALTA EN EL MERCADO LISTO PARA BEBER/PREMEZCLAS DE ALTA POTENCIA, POR TIPO, 2018-2027 (MILLONES DE USD)

TABLA 63 MERCADO DE ESPAÑA LISTO PARA BEBER/PREMEZCLAS DE ALTA FORTALEZA, POR TIPO DE PROCESAMIENTO, 2018-2027 (MILLONES DE USD)

TABLA 64 MERCADO DE ESPAÑA LISTO PARA BEBER/PREMEZCLAS DE ALTA FORTALEZA, POR GÉNERO, 2018-2027 (MILLONES DE USD)

TABLA 65 MERCADO DE ESPAÑA LISTO PARA BEBER/PREMEZCLAS DE ALTA FORTALEZA, POR TIPO DE ENVASE, 2018-2027 (MILLONES DE USD)

CUADRO 66 MERCADO DE ESPAÑA LISTO PARA BEBER/PREMEZCLAS DE ALTA FORTALEZA, POR COMERCIO, 2018-2027 (MILLONES DE USD)

TABLA 67 MERCADO DE RESTAURACIÓN DE ESPAÑA EN EL MERCADO LISTO PARA BEBER/PREMEZCLAS DE ALTA FORTALEZA, POR COMERCIO, 2018-2027 (MILLONES DE USD)

TABLA 68 ESPAÑA FUERA DEL MERCADO LISTO PARA BEBER/PRMEZCLAS DE ALTA FORTALEZA, POR COMERCIO, 2018-2027 (MILLONES DE USD)

TABLA 69 COMERCIO MINORISTA EN TIENDAS EN ESPAÑA EN EL MERCADO DE PREMEZCLAS LISTAS PARA BEBER/PREMEZCLAS DE ALTA CONTENCIÓN, POR COMERCIO, 2018-2027 (MILLONES DE USD)

TABLA 70 COMERCIO MINORISTA NO TIENDA EN ESPAÑA EN EL MERCADO LISTO PARA BEBER/PREMEZCLAS DE ALTA CONTENCIÓN, POR COMERCIO, 2018-2027 (MILLONES DE USD)

TABLA 71 MERCADO DE ITALIA LISTO PARA BEBER/PREMEZCLAS DE ALTA RESISTENCIA, POR TIPO, 2018-2027 (MILLONES DE USD)

TABLA 72 RTDS A BASE DE LICORES EN ITALIA EN EL MERCADO LISTO PARA BEBER/PREMEZCLAS DE ALTA CONTENCIÓN, POR TIPO, 2018-2027 (MILLONES DE USD)

TABLA 73 ITALIA RTDS A BASE DE MALTA EN EL MERCADO LISTO PARA BEBER/PREMEZCLAS DE ALTA RESISTENCIA, POR TIPO, 2018-2027 (MILLONES DE USD)

TABLA 74 MERCADO DE ITALIA LISTO PARA BEBER/PREMEZCLAS DE ALTA FORTALEZA, POR TIPO DE PROCESAMIENTO, 2018-2027 (MILLONES DE USD)

TABLA 75 MERCADO ITALIA DE LISTOS PARA BEBER/PREMEZCLAS DE ALTA FORTALEZA, POR GÉNERO, 2018-2027 (MILLONES DE USD)

TABLA 76 MERCADO ITALIA DE LISTOS PARA BEBER/PREMEZCLAS DE ALTA FORTALEZA, POR TIPO DE ENVASE, 2018-2027 (MILLONES DE USD)

CUADRO 77 MERCADO ITALIA DE PREMEZCLAS LISTAS PARA BEBER/DE ALTA FORTALEZA, POR COMERCIO, 2018-2027 (MILLONES DE USD)

CUADRO 78 COMERCIO ITALIA EN EL MERCADO DE PREMEZCLAS LISTAS PARA BEBER/DE ALTA FORTALEZA, POR COMERCIO, 2018-2027 (MILLONES DE USD)

TABLA 79 MERCADO EXTERIOR DE ITALIA EN EL MERCADO DE PREMEZCLAS LISTAS PARA BEBER/DE ALTA FORTALEZA, POR COMERCIO, 2018-2027 (MILLONES DE USD)

TABLA 80 COMERCIO MINORISTA EN TIENDAS EN ITALIA EN EL MERCADO DE PREMEZCLAS LISTAS PARA BEBER/PREMEZCLAS DE ALTA FORTALEZA, POR COMERCIO, 2018-2027 (MILLONES DE USD)

TABLA 81 ITALIA COMERCIO MINORISTA SIN TIENDAS EN EL MERCADO LISTO PARA BEBER/PREMEZCLAS DE ALTA CONTENCIÓN, POR COMERCIO, 2018-2027 (MILLONES DE USD)

TABLA 82 MERCADO DE FRANCIA LISTO PARA BEBER/PREMEZCLAS DE ALTA FORTALEZA, POR TIPO, 2018-2027 (MILLONES DE USD)

TABLA 83 FRANCIA RTDS A BASE DE LICORES EN EL MERCADO LISTO PARA BEBER/PREMEZCLAS DE ALTA CONTENCIÓN, POR TIPO, 2018-2027 (MILLONES DE USD)

TABLA 84 FRANCIA RTDS A BASE DE MALTA EN EL MERCADO LISTO PARA BEBER/PREMEZCLAS DE ALTA RESISTENCIA, POR TIPO, 2018-2027 (MILLONES DE USD)

CUADRO 85 MERCADO DE FRANCIA LISTO PARA BEBER/PREMEZCLAS DE ALTA FORTALEZA, POR TIPO DE PROCESAMIENTO, 2018-2027 (MILLONES DE USD)

CUADRO 86 MERCADO DE FRANCIA LISTO PARA BEBER/PREMEZCLAS DE ALTA FORTALEZA, POR GÉNERO, 2018-2027 (MILLONES DE USD)

CUADRO 87 MERCADO DE FRANCIA LISTO PARA BEBER/PREMEZCLAS DE ALTA FORTALEZA, POR TIPO DE ENVASE, 2018-2027 (MILLONES DE USD)

CUADRO 88 MERCADO DE FRANCIA LISTO PARA BEBER/PREMEZCLAS DE ALTA FORTALEZA, POR COMERCIO, 2018-2027 (MILLONES DE USD)

TABLA 89 COMERCIO DE RESTAURACIÓN EN FRANCIA EN EL MERCADO DE PREMEZCLAS LISTAS PARA BEBER/DE ALTA FORTALEZA, POR COMERCIO, 2018-2027 (MILLONES DE USD)

CUADRO 90 FRANCIA EXTERIOR EN EL MERCADO DE PREMEZCLAS LISTAS PARA BEBER/DE ALTA FORTALEZA, POR COMERCIO, 2018-2027 (MILLONES DE USD)

TABLA 91 COMERCIO MINORISTA EN TIENDAS EN FRANCIA EN EL MERCADO DE PREMEZCLAS LISTAS PARA BEBER/PREMEZCLAS DE ALTA FORTALEZA, POR COMERCIO, 2018-2027 (MILLONES DE USD)

CUADRO 92 FRANCIA MINORISTA SIN TIENDAS EN EL MERCADO LISTO PARA BEBER/PREMEZCLAS DE ALTA CONTENCIÓN, POR COMERCIO, 2018-2027 (MILLONES DE USD)

TABLA 93 MERCADO DE PAÍSES BAJOS LISTOS PARA BEBER/PREMEZCLAS DE ALTA FORTALEZA, POR TIPO, 2018-2027 (MILLONES DE USD)

CUADRO 94 RTDS A BASE DE LICORES DE LOS PAÍSES BAJOS EN EL MERCADO DE PREMEZCLAS LISTAS PARA BEBER/DE ALTA CONTENCIÓN, POR TIPO, 2018-2027 (MILLONES DE USD)

TABLA 95 RTDS A BASE DE MALTA DE LOS PAÍSES BAJOS EN EL MERCADO DE PREMEZCLAS LISTAS PARA BEBER/DE ALTA RESISTENCIA, POR TIPO, 2018-2027 (MILLONES DE USD)

CUADRO 96 MERCADO DE PAÍSES BAJOS LISTOS PARA BEBER/PREMEZCLAS DE ALTA FORTALEZA, POR TIPO DE PROCESAMIENTO, 2018-2027 (MILLONES DE USD)

TABLA 97 MERCADO DE PAÍSES BAJOS LISTOS PARA BEBER/PREMEZCLAS DE ALTA FORTALEZA, POR GÉNERO, 2018-2027 (MILLONES DE USD)

TABLA 98 MERCADO DE PAÍSES BAJOS LISTOS PARA BEBER/PREMEZCLAS DE ALTA FORTALEZA, POR TIPO DE ENVASE, 2018-2027 (MILLONES DE USD)

CUADRO 99 MERCADO DE PAÍSES BAJOS LISTOS PARA BEBER/PREMEZCLAS DE ALTA FORTALEZA, POR COMERCIO, 2018-2027 (MILLONES DE USD)

CUADRO 100 COMERCIO DE RESTAURACIÓN DE LOS PAÍSES BAJOS EN EL MERCADO DE PREMEZCLAS LISTAS PARA BEBER/DE ALTA FORTALEZA, POR COMERCIO, 2018-2027 (MILLONES DE USD)

CUADRO 101 PAÍSES BAJOS FUERA DEL COMERCIO EN EL MERCADO DE PREMEZCLAS LISTAS PARA BEBER/DE ALTA FORTALEZA, POR COMERCIO, 2018-2027 (MILLONES DE USD)

CUADRO 102 COMERCIO MINORISTA EN TIENDAS DE LOS PAÍSES BAJOS EN EL MERCADO DE PREMEZCLAS LISTAS PARA BEBER/DE ALTA CONTENCIÓN, POR COMERCIO, 2018-2027 (MILLONES DE USD)

CUADRO 103 PAÍSES BAJOS MINORISTAS SIN TIENDAS EN EL MERCADO DE PREMEZCLAS LISTAS PARA BEBER/DE ALTA FORTALEZA, POR COMERCIO, 2018-2027 (MILLONES DE USD)

TABLA 104 MERCADO DE SUECIA LISTO PARA BEBER/PREMEZCLAS DE ALTA FORTALEZA, POR TIPO, 2018-2027 (MILLONES DE USD)

TABLA 105 RTDS A BASE DE BEBIDAS LICORES EN SUECIA EN EL MERCADO DE PREMEZCLAS LISTAS PARA BEBER/DE ALTA POTENCIA, POR TIPO, 2018-2027 (MILLONES DE USD)

TABLA 106 RTDS A BASE DE MALTA EN EL MERCADO DE PREMEZCLAS LISTAS PARA BEBER/DE ALTA FORTALEZA, POR TIPO, 2018-2027 (MILLONES DE USD)

TABLA 107 MERCADO DE SUECIA LISTO PARA BEBER/PREMEZCLAS DE ALTA FORTALEZA, POR TIPO DE PROCESAMIENTO, 2018-2027 (MILLONES DE USD)

TABLA 108 MERCADO DE SUECIA LISTO PARA BEBER/PREMEZCLAS DE ALTA FORTALEZA, POR GÉNERO, 2018-2027 (MILLONES DE USD)

TABLA 109 MERCADO DE SUECIA LISTO PARA BEBER/PREMEZCLAS DE ALTA FORTALEZA, POR TIPO DE ENVASE, 2018-2027 (MILLONES DE USD)

CUADRO 110 MERCADO DE SUECIA LISTO PARA BEBER/PREMEZCLAS DE ALTA FORTALEZA, POR COMERCIO, 2018-2027 (MILLONES DE USD)

TABLA 111 MERCADO DE RESTAURACIÓN DE SUECIA EN EL MERCADO DE PREMEZCLAS LISTAS PARA BEBER/DE ALTA FORTALEZA, POR COMERCIO, 2018-2027 (MILLONES DE USD)

TABLA 112 MERCADO EXTERIOR DE SUECIA EN EL MERCADO LISTO PARA BEBER/PREMEZCLAS DE ALTA FORTALEZA, POR COMERCIO, 2018-2027 (MILLONES DE USD)

CUADRO 113 COMERCIO MINORISTA EN TIENDAS EN SUECIA EN EL MERCADO DE PREMEZCLAS LISTAS PARA BEBER/PREMEZCLAS DE ALTA FORTALEZA, POR COMERCIO, 2018-2027 (MILLONES DE USD)

CUADRO 114 COMERCIO MINORISTA NO TIENDA EN SUECIA EN EL MERCADO DE PREMEZCLAS LISTAS PARA BEBER/DE ALTA CONTENCIÓN, POR COMERCIO, 2018-2027 (MILLONES DE USD)

TABLA 115 MERCADO DE POLONIA LISTO PARA BEBER/PREMEZCLAS DE ALTA FORTALEZA, POR TIPO, 2018-2027 (MILLONES DE USD)

TABLA 116 RTDS A BASE DE BEBIDAS LICORES DE POLONIA EN EL MERCADO DE PREMEZCLAS LISTAS PARA BEBER/DE ALTA CONTENCIÓN, POR TIPO, 2018-2027 (MILLONES DE USD)

TABLA 117 RTDS A BASE DE MALTA DE POLONIA EN EL MERCADO DE PREMEZCLAS LISTAS PARA BEBER/DE ALTA RESISTENCIA, POR TIPO, 2018-2027 (MILLONES DE USD)

TABLA 118 MERCADO DE POLONIA LISTO PARA BEBER/PREMEZCLAS DE ALTA FORTALEZA, POR TIPO DE PROCESAMIENTO, 2018-2027 (MILLONES DE USD)

TABLA 119 MERCADO DE POLONIA LISTO PARA BEBER/PREMEZCLAS DE ALTA FORTALEZA, POR GÉNERO, 2018-2027 (MILLONES DE USD)

TABLA 120 MERCADO DE POLONIA LISTO PARA BEBER/PREMEZCLAS DE ALTA FORTALEZA, POR TIPO DE ENVASE, 2018-2027 (MILLONES DE USD)

CUADRO 121 MERCADO DE POLONIA LISTO PARA BEBER/PREMEZCLAS DE ALTA FORTALEZA, POR COMERCIO, 2018-2027 (MILLONES DE USD)

CUADRO 122 POLONIA COMERCIO DE RESTAURACIÓN EN EL MERCADO DE PREMEZCLAS LISTAS PARA BEBER/DE ALTA FORTALEZA, POR COMERCIO, 2018-2027 (MILLONES DE USD)

CUADRO 123 POLONIA FUERA DEL MERCADO DE PREMEZCLAS LISTAS PARA BEBER/DE ALTA FORTALEZA, POR COMERCIO, 2018-2027 (MILLONES DE USD)

TABLA 124 COMERCIO MINORISTA EN TIENDAS DE POLONIA EN EL MERCADO DE PREMEZCLAS LISTAS PARA BEBER/PREMEZCLAS DE ALTA CONTENCIÓN, POR COMERCIO, 2018-2027 (MILLONES DE USD)

TABLA 125 POLONIA COMERCIO MINORISTA SIN TIENDAS EN EL MERCADO DE PREMEZCLAS LISTAS PARA BEBER/DE ALTA CONTENCIÓN, POR COMERCIO, 2018-2027 (MILLONES DE USD)

TABLA 126 MERCADO DE BÉLGICA LISTO PARA BEBER/PREMEZCLAS DE ALTA FORTALEZA, POR TIPO, 2018-2027 (MILLONES DE USD)

TABLA 127 RTDS A BASE DE LICORES DE BÉLGICA EN EL MERCADO DE PREMEZCLAS LISTAS PARA BEBER/DE ALTA POTENCIA, POR TIPO, 2018-2027 (MILLONES DE USD)

TABLA 128 RTDS A BASE DE MALTA DE BÉLGICA EN EL MERCADO DE PREMEZCLAS LISTAS PARA BEBER/DE ALTA RESISTENCIA, POR TIPO, 2018-2027 (MILLONES DE USD)

CUADRO 129 MERCADO DE BÉLGICA LISTO PARA BEBER/PREMEZCLAS DE ALTA FORTALEZA, POR TIPO DE PROCESAMIENTO, 2018-2027 (MILLONES DE USD)

TABLA 130 MERCADO DE BÉLGICA LISTO PARA BEBER/PREMEZCLAS DE ALTA FORTALEZA, POR GÉNERO, 2018-2027 (MILLONES DE USD)

CUADRO 131 MERCADO DE BÉLGICA LISTO PARA BEBER/PREMEZCLAS DE ALTA FORTALEZA, POR TIPO DE ENVASE, 2018-2027 (MILLONES DE USD)

CUADRO 132 MERCADO DE BÉLGICA LISTA PARA BEBER/PREMEZCLAS DE ALTA FORTALEZA, POR COMERCIO, 2018-2027 (MILLONES DE USD)

CUADRO 133 COMERCIO INDUSTRIAL DE BÉLGICA EN EL MERCADO DE PREMEZCLAS LISTAS PARA BEBER/DE ALTA FORTALEZA, POR COMERCIO, 2018-2027 (MILLONES DE USD)

CUADRO 134 MERCADO EXTERIOR DE BÉLGICA EN EL MERCADO DE PREMEZCLAS LISTAS PARA BEBER/DE ALTA FORTALEZA, POR COMERCIO, 2018-2027 (MILLONES DE USD)

CUADRO 135 COMERCIO MINORISTA EN TIENDAS DE BÉLGICA EN EL MERCADO DE PREMEZCLAS LISTAS PARA BEBER/DE ALTA CONTENCIÓN, POR COMERCIO, 2018-2027 (MILLONES DE USD)

TABLA 136 COMERCIO MINORISTA SIN TIENDAS EN BÉLGICA EN EL MERCADO DE PREMEZCLAS LISTAS PARA BEBER/DE ALTA FORTALEZA, POR COMERCIO, 2018-2027 (MILLONES DE USD)

TABLA 137 MERCADO DE RUSIA LISTO PARA BEBER/PREMEZCLAS DE ALTA FORTALEZA, POR TIPO, 2018-2027 (MILLONES DE USD)

TABLA 138 RTDS A BASE DE BEBIDAS LICORES DE RUSIA EN EL MERCADO DE PREMEZCLAS LISTAS PARA BEBER/DE ALTA CONTENCIÓN, POR TIPO, 2018-2027 (MILLONES DE USD)

TABLA 139 RTDS A BASE DE MALTA DE RUSIA EN EL MERCADO LISTO PARA BEBER/PREMEZCLAS DE ALTA RESISTENCIA, POR TIPO, 2018-2027 (MILLONES DE USD)

CUADRO 140 MERCADO DE RUSIA LISTO PARA BEBER/PREMEZCLAS DE ALTA FORTALEZA, POR TIPO DE PROCESAMIENTO, 2018-2027 (MILLONES DE USD)

CUADRO 141 MERCADO DE RUSIA LISTO PARA BEBER/PREMEZCLAS DE ALTA FORTALEZA, POR GÉNERO, 2018-2027 (MILLONES DE USD)

TABLA 142 MERCADO DE RUSIA LISTO PARA BEBER/PREMEZCLAS DE ALTA FORTALEZA, POR TIPO DE ENVASE, 2018-2027 (MILLONES DE USD)

CUADRO 143 MERCADO DE RUSIA LISTO PARA BEBER/PREMEZCLAS DE ALTA FORTALEZA, POR COMERCIO, 2018-2027 (MILLONES DE USD)

CUADRO 144 COMERCIO INDUSTRIAL DE RUSIA EN EL MERCADO DE PREMEZCLAS LISTAS PARA BEBER/DE ALTA FORTALEZA, POR COMERCIO, 2018-2027 (MILLONES DE USD)

CUADRO 145 MERCADO EXTERIOR DE RUSIA EN EL MERCADO DE PREMEZCLAS LISTAS PARA BEBER/DE ALTA FORTALEZA, POR COMERCIO, 2018-2027 (MILLONES DE USD)

CUADRO 146 COMERCIO MINORISTA EN TIENDAS DE RUSIA EN EL MERCADO DE PREMEZCLAS LISTAS PARA BEBER/DE ALTA CONTENCIÓN, POR COMERCIO, 2018-2027 (MILLONES DE USD)

CUADRO 147 RUSIA MINORISTA SIN TIENDAS EN EL MERCADO DE PREMEZCLAS LISTAS PARA BEBER/DE ALTA CONTENCIÓN, POR COMERCIO, 2018-2027 (MILLONES DE USD)

TABLA 148 MERCADO DE DINAMARCA LISTO PARA BEBER/PREMEZCLAS DE ALTA FORTALEZA, POR TIPO, 2018-2027 (MILLONES DE USD)

CUADRO 149 DINAMARCA RTDS A BASE DE BEBIDAS EN EL MERCADO DE PREMEZCLAS LISTAS PARA BEBER/DE ALTA CONTENCIÓN, POR TIPO, 2018-2027 (MILLONES DE USD)

TABLA 150 DINAMARCA RTDS A BASE DE MALTA EN EL MERCADO LISTO PARA BEBER/PREMEZCLAS DE ALTA FORTALEZA, POR TIPO, 2018-2027 (MILLONES DE USD)

CUADRO 151 MERCADO DE DINAMARCA LISTO PARA BEBER/PREMEZCLAS DE ALTA FORTALEZA, POR TIPO DE PROCESAMIENTO, 2018-2027 (MILLONES DE USD)

CUADRO 152 MERCADO DE DINAMARCA LISTO PARA BEBER/PREMEZCLAS DE ALTA FORTALEZA, POR GÉNERO, 2018-2027 (MILLONES DE USD)

CUADRO 153 MERCADO DE DINAMARCA LISTO PARA BEBER/PREMEZCLAS DE ALTA FORTALEZA, POR TIPO DE ENVASE, 2018-2027 (MILLONES DE USD)

CUADRO 154 MERCADO DE DINAMARCA LISTO PARA BEBER/PREMEZCLAS DE ALTA FORTALEZA, POR COMERCIO, 2018-2027 (MILLONES DE USD)

CUADRO 155 DINAMARCA COMERCIO INDUSTRIAL EN EL MERCADO DE PREMEZCLAS LISTAS PARA BEBER/DE ALTA FORTALEZA, POR COMERCIO, 2018-2027 (MILLONES DE USD)

CUADRO 156 DINAMARCA FUERA DEL COMERCIO EN EL MERCADO DE PREMEZCLAS LISTAS PARA BEBER/DE ALTA FORTALEZA, POR COMERCIO, 2018-2027 (MILLONES DE USD)

CUADRO 157 DINAMARCA MINORISTA EN TIENDAS EN EL MERCADO DE PREMEZCLAS LISTAS PARA BEBER/DE ALTA FORTALEZA, POR COMERCIO, 2018-2027 (MILLONES DE USD)

CUADRO 158 DINAMARCA MERCADO MINORISTA SIN TIENDAS EN EL MERCADO DE PREMEZCLAS LISTAS PARA BEBER/DE ALTA FORTALEZA, POR COMERCIO, 2018-2027 (MILLONES DE USD)

CUADRO 159 MERCADO DE SUIZA LISTO PARA BEBER/PREMEZCLAS DE ALTA FORTALEZA, POR TIPO, 2018-2027 (MILLONES DE USD)

TABLA 160 RTDS A BASE DE BEBIDAS LICORES EN SUIZA EN EL MERCADO DE PREMEZCLAS LISTAS PARA BEBER/DE ALTA CONTENCIÓN, POR TIPO, 2018-2027 (MILLONES DE USD)

TABLA 161 RTDS A BASE DE MALTA EN SUIZA EN EL MERCADO LISTO PARA BEBER/PREMEZCLAS DE ALTA RESISTENCIA, POR TIPO, 2018-2027 (MILLONES DE USD)

CUADRO 162 MERCADO DE SUIZA LISTOS PARA BEBER/PREMEZCLAS DE ALTA FORTALEZA, POR TIPO DE PROCESAMIENTO, 2018-2027 (MILLONES DE USD)

CUADRO 163 MERCADO DE SUIZA LISTAS PARA BEBER/PREMEZCLAS DE ALTA FORTALEZA, POR GÉNERO, 2018-2027 (MILLONES DE USD)

CUADRO 164 MERCADO DE SUIZA LISTO PARA BEBER/PREMEZCLAS DE ALTA FORTALEZA, POR TIPO DE ENVASE, 2018-2027 (MILLONES DE USD)

CUADRO 165 MERCADO DE SUIZA LISTAS PARA BEBER/PREMEZCLAS DE ALTA FORTALEZA, POR COMERCIO, 2018-2027 (MILLONES DE USD)

CUADRO 166 COMERCIO DE RESTAURACIÓN DE SUIZA EN EL MERCADO DE PREMEZCLAS LISTAS PARA BEBER/DE ALTA FORTALEZA, POR COMERCIO, 2018-2027 (MILLONES DE USD)

TABLA 167 MERCADO EXTERIOR DE SUIZA EN EL MERCADO LISTO PARA BEBER/PREMEZCLAS DE ALTA FORTALEZA, POR COMERCIO, 2018-2027 (MILLONES DE USD)

CUADRO 168 COMERCIO MINORISTA EN TIENDAS EN SUIZA EN EL MERCADO DE PREMEZCLAS LISTAS PARA BEBER/DE ALTA CONTENCIÓN, POR COMERCIO, 2018-2027 (MILLONES DE USD)

CUADRO 169 SUIZA COMERCIO MINORISTA SIN TIENDAS EN EL MERCADO DE PREMEZCLAS LISTAS PARA BEBER/DE ALTA CONTENCIÓN, POR COMERCIO, 2018-2027 (MILLONES DE USD)

TABLA 170 MERCADO DE TURQUÍA LISTO PARA BEBER/PREMEZCLAS DE ALTA FORTALEZA, POR TIPO, 2018-2027 (MILLONES DE USD)

TABLA 171 RTDS A BASE DE LICORES DE TURQUÍA EN EL MERCADO DE PREMEZCLAS LISTAS PARA BEBER/DE ALTA CONTENCIÓN, POR TIPO, 2018-2027 (MILLONES DE USD)

TABLA 172 RTDS A BASE DE MALTA DE TURQUÍA EN EL MERCADO DE PREMEZCLAS LISTAS PARA BEBER/DE ALTA RESISTENCIA, POR TIPO, 2018-2027 (MILLONES DE USD)

CUADRO 173 MERCADO DE TURQUÍA LISTO PARA BEBER/PREMEZCLAS DE ALTA FORTALEZA, POR TIPO DE PROCESAMIENTO, 2018-2027 (MILLONES DE USD)

TABLA 174 MERCADO DE TURQUÍA LISTO PARA BEBER/PREMEZCLAS DE ALTA FORTALEZA, POR GÉNERO, 2018-2027 (MILLONES DE USD)

TABLA 175 MERCADO DE TURQUÍA LISTO PARA BEBER/PREMEZCLAS DE ALTA FORTALEZA, POR TIPO DE ENVASE, 2018-2027 (MILLONES DE USD)

CUADRO 176 MERCADO DE TURQUÍA LISTO PARA BEBER/PREMEZCLAS DE ALTA FORTALEZA, POR COMERCIO, 2018-2027 (MILLONES DE USD)

CUADRO 177 COMERCIO TURQUÍA EN EL MERCADO DE PREMEZCLAS LISTAS PARA BEBER/DE ALTA FORTALEZA, POR COMERCIO, 2018-2027 (MILLONES DE USD)

CUADRO 178 TURQUÍA FUERA DEL COMERCIO EN EL MERCADO DE PREMEZCLAS LISTAS PARA BEBER/DE ALTA FORTALEZA, POR COMERCIO, 2018-2027 (MILLONES DE USD)

CUADRO 179 VENTA MINORISTA EN TIENDAS DE TURQUÍA EN EL MERCADO DE PREMEZCLAS LISTAS PARA BEBER/DE ALTA CONTENCIÓN, POR COMERCIO, 2018-2027 (MILLONES DE USD)

TABLA 180 TURQUÍA COMERCIO MINORISTA SIN TIENDAS EN EL MERCADO DE PREMEZCLAS LISTAS PARA BEBER/DE ALTA CONTENCIÓN, POR COMERCIO, 2018-2027 (MILLONES DE USD)

TABLA 181 RESTO DE EUROPA MERCADO LISTO PARA BEBER/PREMEZCLAS DE ALTA FORTALEZA, POR TIPO, 2018-2027 (MILLONES DE USD)

CUADRO 182 MERCADO DE AMÉRICA DEL NORTE LISTO PARA BEBER/PREMEZCLAS DE ALTA RESISTENCIA, POR PAÍS, 2018-2027 (MILLONES DE USD)

CUADRO 183 MERCADO DE AMÉRICA DEL NORTE LISTO PARA BEBER/PREMEZCLAS DE ALTA RESISTENCIA, POR TIPO, 2018-2027 (MILLONES DE USD)

TABLA 184 RTDS A BASE DE BEBIDAS LICORES EN AMÉRICA DEL NORTE EN EL MERCADO DE PREMEZCLAS LISTAS PARA BEBER/DE ALTA CONTENCIÓN, POR TIPO, 2018-2027 (MILLONES DE USD)

CUADRO 185 RTDS A BASE DE MALTA EN AMÉRICA DEL NORTE EN EL MERCADO LISTO PARA BEBER/PREMEZCLAS DE ALTA RESISTENCIA, POR TIPO, 2018-2027 (MILLONES DE USD)

CUADRO 186 MERCADO DE AMÉRICA DEL NORTE LISTO PARA BEBER/PREMEZCLAS DE ALTA RESISTENCIA, POR TIPO DE PROCESAMIENTO, 2018-2027 (MILLONES DE USD)

CUADRO 187 MERCADO DE AMÉRICA DEL NORTE LISTO PARA BEBER/PREMEZCLAS DE ALTA FORTALEZA, POR GÉNERO, 2018-2027 (MILLONES DE USD)

CUADRO 188 MERCADO DE AMÉRICA DEL NORTE LISTO PARA BEBER/PREMEZCLAS DE ALTA RESISTENCIA, POR TIPO DE ENVASE, 2018-2027 (MILLONES DE USD)

CUADRO 189 MERCADO DE AMÉRICA DEL NORTE LISTO PARA BEBER/PREMEZCLAS DE ALTA RESISTENCIA, POR COMERCIO, 2018-2027 (MILLONES DE USD)

CUADRO 190 COMERCIO NORTEAMERICANO DE MERCADO DE PREMEZCLAS LISTAS PARA BEBER/PREMEZCLAS DE ALTA FORTALEZA, POR COMERCIO, 2018-2027 (MILLONES DE USD)

CUADRO 191 MERCADO EXTERIOR DE AMÉRICA DEL NORTE EN EL MERCADO LISTO PARA BEBER/PREMEZCLAS DE ALTA FORTALEZA, POR COMERCIO, 2018-2027 (MILLONES DE USD)

CUADRO 192 COMERCIO MINORISTA EN TIENDAS DE AMÉRICA DEL NORTE EN EL MERCADO DE PREMEZCLAS LISTAS PARA BEBER/DE ALTA CONTENCIÓN, POR COMERCIO, 2018-2027 (MILLONES DE USD)

CUADRO 193 COMERCIO MINORISTA SIN TIENDAS EN AMÉRICA DEL NORTE EN EL MERCADO DE PREMEZCLAS LISTAS PARA BEBER/DE ALTA CONTENCIÓN, POR COMERCIO, 2018-2027 (MILLONES DE USD)

TABLA 194 MERCADO DE PREMEZCLAS LISTAS PARA BEBER/ DE ALTA FORTALEZA DE EE. UU., POR TIPO, 2018-2027 (MILLONES DE USD)

TABLA 195 RTDS A BASE DE BEBIDAS LICORES DE EE. UU. EN EL MERCADO DE PREMEZCLAS LISTAS PARA BEBER/DE ALTA CONTENCIÓN, POR TIPO, 2018-2027 (MILLONES DE USD)

TABLA 196 RTDS A BASE DE MALTA DE EE. UU. EN EL MERCADO DE PREMEZCLAS LISTAS PARA BEBER/DE ALTA RESISTENCIA, POR TIPO, 2018-2027 (MILLONES DE USD)

TABLA 197 MERCADO DE PREMEZCLAS LISTAS PARA BEBER/ DE ALTA FORTALEZA DE EE. UU., POR TIPO DE PROCESAMIENTO, 2018-2027 (MILLONES DE USD)

TABLA 198 MERCADO DE PREMEZCLAS LISTAS PARA BEBER/ DE ALTA FORTALEZA DE EE. UU., POR GÉNERO, 2018-2027 (MILLONES DE USD)

TABLA 199 MERCADO DE PREMEZCLAS LISTAS PARA BEBER/ DE ALTA FORTALEZA DE EE. UU., POR TIPO DE ENVASE, 2018-2027 (MILLONES DE USD)

TABLA 200 MERCADO DE PREMEZCLAS LISTAS PARA BEBER/ DE ALTA FORTALEZA DE EE. UU., POR COMERCIO, 2018-2027 (MILLONES DE USD)

TABLA 201 MERCADO DE ON-COMER EN EE.UU. DE PREMEZCLAS LISTAS PARA BEBER/DE ALTA FORTALEZA, POR COMERCIO, 2018-2027 (MILLONES DE USD)

TABLA 202 MERCADO EXTERIOR DE ESTADOS UNIDOS EN EL MERCADO DE PREMEZCLAS LISTAS PARA BEBER/DE ALTA FORTALEZA, POR COMERCIO, 2018-2027 (MILLONES DE USD)

TABLA 203 COMERCIO MINORISTA EN TIENDAS DE EE. UU. EN EL MERCADO DE PREMEZCLAS LISTAS PARA BEBER/PREMEZCLAS DE ALTA CONTENCIÓN, POR COMERCIO, 2018-2027 (MILLONES DE USD)

TABLA 204 COMERCIO MINORISTA SIN TIENDAS EN EE. UU. EN EL MERCADO DE PREMEZCLAS LISTAS PARA BEBER/PREMEZCLAS DE ALTA CONTENCIÓN, POR COMERCIO, 2018-2027 (MILLONES DE USD)

TABLA 205 MERCADO DE CANADÁ LISTO PARA BEBER/PREMEZCLAS DE ALTA FORTALEZA, POR TIPO, 2018-2027 (MILLONES DE USD)

TABLA 206 CANADÁ RTDS A BASE DE BEBIDAS EN EL MERCADO DE PREMEZCLAS LISTAS PARA BEBER/DE ALTA CONTENCIÓN, POR TIPO, 2018-2027 (MILLONES DE USD)

TABLA 207 RTDS A BASE DE MALTA DE CANADÁ EN EL MERCADO DE PREMEZCLAS LISTAS PARA BEBER/DE ALTA RESISTENCIA, POR TIPO, 2018-2027 (MILLONES DE USD)

TABLA 208 MERCADO DE CANADÁ LISTO PARA BEBER/PREMEZCLAS DE ALTA FORTALEZA, POR TIPO DE PROCESAMIENTO, 2018-2027 (MILLONES DE USD)

TABLA 209 MERCADO DE CANADÁ LISTO PARA BEBER/PREMEZCLAS DE ALTA FORTALEZA, POR GÉNERO, 2018-2027 (MILLONES DE USD)

TABLA 210 MERCADO DE CANADÁ LISTO PARA BEBER/PREMEZCLAS DE ALTA FORTALEZA, POR TIPO DE ENVASE, 2018-2027 (MILLONES DE USD)

CUADRO 211 MERCADO DE CANADÁ LISTO PARA BEBER/PREMEZCLAS DE ALTA FORTALEZA, POR COMERCIO, 2018-2027 (MILLONES DE USD)

CUADRO 212 COMERCIO ONLINE DE CANADÁ EN EL MERCADO DE PREMEZCLAS LISTAS PARA BEBER/DE ALTA FORTALEZA, POR COMERCIO, 2018-2027 (MILLONES DE USD)

CUADRO 213 CANADÁ FUERA DEL COMERCIO EN EL MERCADO DE PREMEZCLAS LISTAS PARA BEBER/DE ALTA FORTALEZA, POR COMERCIO, 2018-2027 (MILLONES DE USD)

TABLA 214 COMERCIO MINORISTA EN TIENDAS EN CANADÁ EN EL MERCADO DE PREMEZCLAS LISTAS PARA BEBER/PREMEZCLAS DE ALTA FORTALEZA, POR COMERCIO, 2018-2027 (MILLONES DE USD)

CUADRO 215 CANADÁ COMERCIO MINORISTA SIN TIENDAS EN EL MERCADO DE PREMEZCLAS LISTAS PARA BEBER/DE ALTA FORTALEZA, POR COMERCIO, 2018-2027 (MILLONES DE USD)

CUADRO 216 MERCADO DE MÉXICO LISTO PARA BEBER/PREMEZCLAS DE ALTA RESISTENCIA, POR TIPO, 2018-2027 (MILLONES DE USD)

TABLA 217 RTDS A BASE DE BEBIDAS LICORES EN MÉXICO EN EL MERCADO DE PREMEZCLAS LISTAS PARA BEBER/ALTA POTENCIA, POR TIPO, 2018-2027 (MILLONES DE USD)

CUADRO 218 RTDS A BASE DE MALTA DE MÉXICO EN EL MERCADO DE PREMEZCLAS LISTAS PARA BEBER/DE ALTA RESISTENCIA, POR TIPO, 2018-2027 (MILLONES DE USD)

CUADRO 219 MERCADO DE MÉXICO LISTO PARA BEBER/PREMEZCLAS DE ALTA FORTALEZA, POR TIPO DE PROCESAMIENTO, 2018-2027 (MILLONES DE USD)

CUADRO 220 MERCADO DE MÉXICO LISTO PARA BEBER/PREMEZCLAS DE ALTA FORTALEZA, POR GÉNERO, 2018-2027 (MILLONES DE USD)

CUADRO 221 MERCADO DE MÉXICO LISTO PARA BEBER/PREMEZCLAS DE ALTA RESISTENCIA, POR TIPO DE ENVASE, 2018-2027 (MILLONES DE USD)

CUADRO 222 MERCADO DE MÉXICO LISTO PARA BEBER/PREMEZCLAS DE ALTA FORTALEZA, POR COMERCIO, 2018-2027 (MILLONES DE USD)

CUADRO 223 COMERCIO DE RESTAURANTE EN MÉXICO MERCADO DE PREMEZCLAS LISTAS PARA BEBER/PREMEZCLAS DE ALTA FORTALEZA, POR COMERCIO, 2018-2027 (MILLONES DE USD)

CUADRO 224 MERCADO EXTERIOR DE MÉXICO EN EL MERCADO LISTO PARA BEBER/PREMEZCLAS DE ALTA FORTALEZA, POR COMERCIO, 2018-2027 (MILLONES DE USD)

CUADRO 225 COMERCIO MINORISTA EN TIENDAS EN MÉXICO EN EL MERCADO DE PREMEZCLAS LISTAS PARA BEBER/PREMEZCLAS DE ALTA CONTENCIÓN, POR COMERCIO, 2018-2027 (MILLONES DE USD)

CUADRO 226 COMERCIO MINORISTA NO TIENDA EN MÉXICO EN EL MERCADO LISTO PARA BEBER/PREMEZCLAS DE ALTA CONTENCIÓN, POR COMERCIO, 2018-2027 (MILLONES DE USD)

CUADRO 227 MERCADO DE ASIA Y PACÍFICO LISTO PARA BEBER/PREMEZCLAS DE ALTA FORTALEZA, POR PAÍS, 2018-2027 (MILLONES DE USD)

CUADRO 228 MERCADO DE ASIA Y PACÍFICO LISTO PARA BEBER/PREMEZCLAS DE ALTA RESISTENCIA, POR TIPO, 2018-2027 (MILLONES DE USD)

TABLA 229 RTDS A BASE DE BEBIDAS ESPIRITUALES DE ASIA Y EL PACÍFICO EN EL MERCADO DE PREMEZCLAS LISTAS PARA BEBER/DE ALTA FORTALEZA, POR TIPO, 2018-2027 (MILLONES DE USD)

TABLA 230 RTDS A BASE DE MALTA DE ASIA Y EL PACÍFICO EN EL MERCADO DE PREMEZCLAS LISTAS PARA BEBER/DE ALTA RESISTENCIA, POR TIPO, 2018-2027 (MILLONES DE USD)

CUADRO 231 MERCADO DE ASIA Y PACÍFICO LISTOS PARA BEBER/PREMEZCLAS DE ALTA FORTALEZA, POR TIPO DE PROCESAMIENTO, 2018-2027 (MILLONES DE USD)

CUADRO 232 MERCADO DE ASIA Y PACÍFICO LISTOS PARA BEBER/PREMEZCLAS DE ALTA FORTALEZA, POR GÉNERO, 2018-2027 (MILLONES DE USD)

CUADRO 233 MERCADO DE ASIA Y PACÍFICO LISTO PARA BEBER/PREMEZCLAS DE ALTA FORTALEZA, POR TIPO DE ENVASE, 2018-2027 (MILLONES DE USD)

CUADRO 234 MERCADO DE ASIA Y PACÍFICO LISTOS PARA BEBER/PREMEZCLAS DE ALTA FORTALEZA, POR COMERCIO, 2018-2027 (MILLONES DE USD)

CUADRO 235 COMERCIO DE RESTAURACIÓN DE ASIA Y EL PACÍFICO EN EL MERCADO DE PREMEZCLAS LISTAS PARA BEBER/PREMEZCLAS DE ALTA FORTALEZA, POR COMERCIO, 2018-2027 (MILLONES DE USD)

CUADRO 236 ASIA-PACÍFICO NO COMERCIO EN EL MERCADO DE PREMEZCLAS LISTAS PARA BEBER/DE ALTA FORTALEZA, POR COMERCIO, 2018-2027 (MILLONES DE USD)

TABLA 237 COMERCIO MINORISTA EN TIENDAS DE ASIA Y EL PACÍFICO EN EL MERCADO DE PREMEZCLAS LISTAS PARA BEBER/DE ALTA FORTALEZA, POR COMERCIO, 2018-2027 (MILLONES DE USD)

CUADRO 238 COMERCIO MINORISTA SIN TIENDAS EN ASIA Y EL PACÍFICO EN EL MERCADO DE PREMEZCLAS LISTAS PARA BEBER/DE ALTA CONTENCIÓN, POR COMERCIO, 2018-2027 (MILLONES DE USD)

TABLA 239 MERCADO CHINA LISTO PARA BEBER/PREMEZCLAS DE ALTA FORTALEZA, POR TIPO, 2018-2027 (MILLONES DE USD)

TABLA 240 RTDS A BASE DE BEBIDAS LICORES EN CHINA EN EL MERCADO DE PREMEZCLAS LISTAS PARA BEBER/DE ALTA POTENCIA, POR TIPO, 2018-2027 (MILLONES DE USD)

TABLA 241 RTDS A BASE DE MALTA EN CHINA EN EL MERCADO LISTO PARA BEBER/PREMEZCLAS DE ALTA RESISTENCIA, POR TIPO, 2018-2027 (MILLONES DE USD)

CUADRO 242 MERCADO DE CHINA LISTO PARA BEBER/PREMEZCLAS DE ALTA FORTALEZA, POR TIPO DE PROCESAMIENTO, 2018-2027 (MILLONES DE USD)

CUADRO 243 MERCADO CHINA LISTO PARA BEBER/PREMEZCLAS DE ALTA FORTALEZA, POR GÉNERO, 2018-2027 (MILLONES DE USD)

CUADRO 244 MERCADO CHINA LISTO PARA BEBER/PREMEZCLAS DE ALTA FORTALEZA, POR TIPO DE ENVASE, 2018-2027 (MILLONES DE USD)

CUADRO 245 MERCADO DE CHINA LISTO PARA BEBER/PREMEZCLAS DE ALTA FORTALEZA, POR COMERCIO, 2018-2027 (MILLONES DE USD)

CUADRO 246 COMERCIO DE RESTAURACIÓN DE CHINA EN EL MERCADO DE PREMEZCLAS LISTAS PARA BEBER/DE ALTA FORTALEZA, POR COMERCIO, 2018-2027 (MILLONES DE USD)

CUADRO 247 MERCADO EXTERIOR DE CHINA EN EL MERCADO LISTO PARA BEBER/PREMEZCLAS DE ALTA FORTALEZA, POR COMERCIO, 2018-2027 (MILLONES DE USD)

CUADRO 248 COMERCIO MINORISTA EN TIENDAS DE CHINA EN EL MERCADO DE PREMEZCLAS LISTAS PARA BEBER/DE ALTA CONTENCIÓN, POR COMERCIO, 2018-2027 (MILLONES DE USD)

CUADRO 249 COMERCIO MINORISTA SIN TIENDAS EN CHINA EN EL MERCADO DE PREMEZCLAS LISTAS PARA BEBER/PREMEZCLAS DE ALTA CONTENCIÓN, POR COMERCIO, 2018-2027 (MILLONES DE USD)

TABLA 250 MERCADO JAPÓN DE PREMEZCLAS LISTAS PARA BEBER/ DE ALTA FORTALEZA, POR TIPO, 2018-2027 (MILLONES DE USD)

TABLA 251 RTDS A BASE DE LICORES EN JAPÓN EN EL MERCADO DE PREMEZCLAS LISTAS PARA BEBER/DE ALTA POTENCIA, POR TIPO, 2018-2027 (MILLONES DE USD)

TABLA 252 RTDS A BASE DE MALTA DE JAPÓN EN EL MERCADO LISTO PARA BEBER/PREMEZCLAS DE ALTA RESISTENCIA, POR TIPO, 2018-2027 (MILLONES DE USD)

CUADRO 253 MERCADO JAPÓN DE PREMEZCLAS LISTAS PARA BEBER/ DE ALTA FORTALEZA, POR TIPO DE PROCESAMIENTO, 2018-2027 (MILLONES DE USD)

CUADRO 254 MERCADO JAPÓN DE PREMEZCLAS LISTAS PARA BEBER/DE ALTA FORTALEZA, POR GÉNERO, 2018-2027 (MILLONES DE USD)

TABLA 255 MERCADO JAPÓN DE PREMEZCLAS LISTAS PARA BEBER/DE ALTA FORTALEZA, POR TIPO DE ENVASE, 2018-2027 (MILLONES DE USD)

CUADRO 256 MERCADO JAPÓN DE PREMEZCLAS LISTAS PARA BEBER/DE ALTA FORTALEZA, POR COMERCIO, 2018-2027 (MILLONES DE USD)

CUADRO 257 COMERCIO INVERSOR DEL JAPÓN EN EL MERCADO DE PREMEZCLAS LISTAS PARA BEBER/DE ALTA FORTALEZA, POR COMERCIO, 2018-2027 (MILLONES DE USD)

CUADRO 258 MERCADO EXTERIOR DE JAPÓN EN EL MERCADO LISTO PARA BEBER/PREMEZCLAS DE ALTA FORTALEZA, POR COMERCIO, 2018-2027 (MILLONES DE USD)

TABLA 259 COMERCIO MINORISTA EN TIENDAS EN EL MERCADO DE PREMEZCLAS LISTAS PARA BEBER/DE ALTA FORTALEZA EN JAPÓN, POR COMERCIO, 2018-2027 (MILLONES DE USD)

CUADRO 260 COMERCIO MINORISTA SIN TIENDAS EN JAPÓN EN EL MERCADO DE PREMEZCLAS LISTAS PARA BEBER/DE ALTA CONTENCIÓN, POR COMERCIO, 2018-2027 (MILLONES DE USD)

TABLA 261 MERCADO DE INDIA LISTO PARA BEBER / PREMEZCLAS DE ALTA FORTALEZA, POR TIPO, 2018-2027 (MILLONES DE USD)

CUADRO 262 RTDS A BASE DE BEBIDAS LICORES EN LA INDIA EN EL MERCADO DE PREMEZCLAS LISTAS PARA BEBER/DE ALTA POTENCIA, POR TIPO, 2018-2027 (MILLONES DE USD)

TABLA 263 RTDS A BASE DE MALTA DE LA INDIA EN EL MERCADO DE PREMEZCLAS LISTAS PARA BEBER/DE ALTA RESISTENCIA, POR TIPO, 2018-2027 (MILLONES DE USD)

CUADRO 264 MERCADO DE INDIA LISTO PARA BEBER/PREMEZCLAS DE ALTA FORTALEZA, POR TIPO DE PROCESAMIENTO, 2018-2027 (MILLONES DE USD)

CUADRO 265 MERCADO DE INDIA LISTO PARA BEBER/PREMEZCLAS DE ALTA FORTALEZA, POR GÉNERO, 2018-2027 (MILLONES DE USD)

CUADRO 266 MERCADO DE INDIA LISTO PARA BEBER/PREMEZCLAS DE ALTA FORTALEZA, POR TIPO DE ENVASE, 2018-2027 (MILLONES DE USD)

CUADRO 267 MERCADO DE INDIA LISTO PARA BEBER/PREMEZCLAS DE ALTA FORTALEZA, POR COMERCIO, 2018-2027 (MILLONES DE USD)

CUADRO 268 COMERCIO INDIA DE MERCADO DE PREMEZCLAS LISTAS PARA BEBER/DE ALTA FORTALEZA, POR COMERCIO, 2018-2027 (MILLONES DE USD)

CUADRO 269 INDIA FUERA DEL COMERCIO EN EL MERCADO DE PREMEZCLAS LISTAS PARA BEBER/DE ALTA FORTALEZA, POR COMERCIO, 2018-2027 (MILLONES DE USD)

CUADRO 270 INDIA MINORISTA EN TIENDAS EN EL MERCADO DE PREMEZCLAS LISTAS PARA BEBER/DE ALTA FORTALEZA, POR COMERCIO, 2018-2027 (MILLONES DE USD)

CUADRO 271 INDIA COMERCIO MINORISTA SIN TIENDAS EN EL MERCADO DE PREMEZCLAS LISTAS PARA BEBER/DE ALTA FORTALEZA, POR COMERCIO, 2018-2027 (MILLONES DE USD)

TABLA 272 MERCADO DE AUSTRALIA LISTO PARA BEBER/PREMEZCLAS DE ALTA FORTALEZA, POR TIPO, 2018-2027 (MILLONES DE USD)

TABLA 273 RTDS A BASE DE BEBIDAS LICORES EN AUSTRALIA EN EL MERCADO DE PREMEZCLAS LISTAS PARA BEBER/DE ALTA CONTENCIÓN, POR TIPO, 2018-2027 (MILLONES DE USD)

TABLA 274 RTDS A BASE DE MALTA DE AUSTRALIA EN EL MERCADO DE PREMEZCLAS LISTAS PARA BEBER/DE ALTA RESISTENCIA, POR TIPO, 2018-2027 (MILLONES DE USD)

CUADRO 275 MERCADO DE AUSTRALIA LISTO PARA BEBER/PREMEZCLAS DE ALTA FORTALEZA, POR TIPO DE PROCESAMIENTO, 2018-2027 (MILLONES DE USD)

CUADRO 276 MERCADO DE AUSTRALIA LISTO PARA BEBER/PREMEZCLAS DE ALTA FORTALEZA, POR GÉNERO, 2018-2027 (MILLONES DE USD)

TABLA 277 MERCADO DE AUSTRALIA LISTO PARA BEBER/PREMEZCLAS DE ALTA FORTALEZA, POR TIPO DE ENVASE, 2018-2027 (MILLONES DE USD)

CUADRO 278 MERCADO DE AUSTRALIA LISTO PARA BEBER/PREMEZCLAS DE ALTA FORTALEZA, POR COMERCIO, 2018-2027 (MILLONES DE USD)

CUADRO 279 COMERCIO DE AUSTRALIA EN EL MERCADO DE PREMEZCLAS LISTAS PARA BEBER/DE ALTA FORTALEZA, POR COMERCIO, 2018-2027 (MILLONES DE USD)

CUADRO 280 AUSTRALIA FUERA DEL COMERCIO EN EL MERCADO DE PREMEZCLAS LISTAS PARA BEBER/DE ALTA FORTALEZA, POR COMERCIO, 2018-2027 (MILLONES DE USD)

CUADRO 281 COMERCIO MINORISTA EN TIENDAS DE AUSTRALIA EN EL MERCADO DE PREMEZCLAS LISTAS PARA BEBER/PREMEZCLAS DE ALTA CONTENCIÓN, POR COMERCIO, 2018-2027 (MILLONES DE USD)

CUADRO 282 AUSTRALIA COMERCIO MINORISTA SIN TIENDAS EN EL MERCADO DE PREMEZCLAS LISTAS PARA BEBER/DE ALTA CONTENCIÓN, POR COMERCIO, 2018-2027 (MILLONES DE USD)

TABLA 283 MERCADO DE COREA DEL SUR LISTO PARA BEBER/PREMEZCLAS DE ALTA FORTALEZA, POR TIPO, 2018-2027 (MILLONES DE USD)

TABLA 284 RTDS A BASE DE BEBIDAS LICORES DE COREA DEL SUR EN EL MERCADO DE PREMEZCLAS LISTAS PARA BEBER/DE ALTA CONTENCIÓN, POR TIPO, 2018-2027 (MILLONES DE USD)

TABLA 285 RTDS A BASE DE MALTA DE COREA DEL SUR EN EL MERCADO LISTO PARA BEBER/PREMEZCLAS DE ALTA RESISTENCIA, POR TIPO, 2018-2027 (MILLONES DE USD)

CUADRO 286 MERCADO DE COREA DEL SUR LISTO PARA BEBER/PREMEZCLAS DE ALTA FORTALEZA, POR TIPO DE PROCESAMIENTO, 2018-2027 (MILLONES DE USD)

CUADRO 287 MERCADO DE COREA DEL SUR LISTO PARA BEBER/PREMEZCLAS DE ALTA FORTALEZA, POR GÉNERO, 2018-2027 (MILLONES DE USD)

TABLA 288 MERCADO DE COREA DEL SUR LISTO PARA BEBER/PREMEZCLAS DE ALTA FORTALEZA, POR TIPO DE ENVASE, 2018-2027 (MILLONES DE USD)

CUADRO 289 MERCADO DE COREA DEL SUR LISTO PARA BEBER/PREMEZCLAS DE ALTA FORTALEZA, POR COMERCIO, 2018-2027 (MILLONES DE USD)

CUADRO 290 COMERCIO INDUSTRIAL DE COREA DEL SUR EN EL MERCADO DE PREMEZCLAS LISTAS PARA BEBER/PREMEZCLAS DE ALTA FORTALEZA, POR COMERCIO, 2018-2027 (MILLONES DE USD)

CUADRO 291 COREA DEL SUR COMERCIO EXTERIOR EN EL MERCADO DE PREMEZCLAS LISTAS PARA BEBER/DE ALTA FORTALEZA, POR COMERCIO, 2018-2027 (MILLONES DE USD)

CUADRO 292 COMERCIO MINORISTA EN TIENDAS DE COREA DEL SUR EN EL MERCADO DE PREMEZCLAS LISTAS PARA BEBER/DE ALTA CONTENCIÓN, POR COMERCIO, 2018-2027 (MILLONES DE USD)

CUADRO 293 COREA DEL SUR COMERCIO MINORISTA SIN TIENDAS EN EL MERCADO DE PREMEZCLAS LISTAS PARA BEBER/DE ALTA CONTENCIÓN, POR COMERCIO, 2018-2027 (MILLONES DE USD)

TABLA 294 MERCADO DE MALASIA LISTO PARA BEBER/PREMEZCLAS DE ALTA FORTALEZA, POR TIPO, 2018-2027 (MILLONES DE USD)

TABLA 295 RTDS A BASE DE BEBIDAS LICORES DE MALASIA EN EL MERCADO DE PREMEZCLAS LISTAS PARA BEBER/DE ALTA FORTALEZA, POR TIPO, 2018-2027 (MILLONES DE USD)

TABLA 296 RTDS A BASE DE MALTA DE MALASIA EN EL MERCADO DE PREMEZCLAS LISTAS PARA BEBER/DE ALTA RESISTENCIA, POR TIPO, 2018-2027 (MILLONES DE USD)

CUADRO 297 MERCADO DE MALASIA LISTO PARA BEBER/PREMEZCLAS DE ALTA FORTALEZA, POR TIPO DE PROCESAMIENTO, 2018-2027 (MILLONES DE USD)

CUADRO 298 MERCADO DE MALASIA LISTO PARA BEBER/PREMEZCLAS DE ALTA FORTALEZA, POR GÉNERO, 2018-2027 (MILLONES DE USD)

TABLA 299 MERCADO DE MALASIA LISTO PARA BEBER/PREMEZCLAS DE ALTA FORTALEZA, POR TIPO DE ENVASE, 2018-2027 (MILLONES DE USD)

CUADRO 300 MERCADO DE MALASIA LISTO PARA BEBER/PREMEZCLAS DE ALTA FORTALEZA, POR COMERCIO, 2018-2027 (MILLONES DE USD)

CUADRO 301 COMERCIO INDUSTRIAL DE MALASIA EN EL MERCADO DE PREMEZCLAS LISTAS PARA BEBER/DE ALTA FORTALEZA, POR COMERCIO, 2018-2027 (MILLONES DE USD)

TABLA 302 MERCADO EXTERIOR DE MALASIA EN EL MERCADO DE PREMEZCLAS LISTAS PARA BEBER/DE ALTA FORTALEZA, POR COMERCIO, 2018-2027 (MILLONES DE USD)

CUADRO 303 COMERCIO MINORISTA EN TIENDAS DE MALASIA EN EL MERCADO DE PREMEZCLAS LISTAS PARA BEBER/DE ALTA FORTALEZA, POR COMERCIO, 2018-2027 (MILLONES DE USD)

CUADRO 304 MALASIA VENTA MINORISTA SIN TIENDAS EN EL MERCADO DE PREMEZCLAS LISTAS PARA BEBER/DE ALTA CONTENCIÓN, POR COMERCIO, 2018-2027 (MILLONES DE USD)

CUADRO 305 MERCADO DE VIETNAM LISTO PARA BEBER/PREMEZCLAS DE ALTA FORTALEZA, POR TIPO, 2018-2027 (MILLONES DE USD)

TABLA 306 RTDS A BASE DE BEBIDAS LICORES DE VIETNAM EN EL MERCADO DE PREMEZCLAS LISTAS PARA BEBER/DE ALTA FORTALEZA, POR TIPO, 2018-2027 (MILLONES DE USD)

TABLA 307 RTDS A BASE DE MALTA DE VIETNAM EN EL MERCADO DE PREMEZCLAS LISTAS PARA BEBER/DE ALTA RESISTENCIA, POR TIPO, 2018-2027 (MILLONES DE USD)

CUADRO 308 MERCADO DE VIETNAM LISTO PARA BEBER/PREMEZCLAS DE ALTA FORTALEZA, POR TIPO DE PROCESAMIENTO, 2018-2027 (MILLONES DE USD)

CUADRO 309 MERCADO DE VIETNAM LISTO PARA BEBER/PREMEZCLAS DE ALTA FORTALEZA, POR GÉNERO, 2018-2027 (MILLONES DE USD)

TABLA 310 MERCADO DE VIETNAM LISTO PARA BEBER/PREMEZCLAS DE ALTA FORTALEZA, POR TIPO DE ENVASE, 2018-2027 (MILLONES DE USD)

CUADRO 311 MERCADO DE VIETNAM LISTO PARA BEBER/PREMEZCLAS DE ALTA FORTALEZA, POR COMERCIO, 2018-2027 (MILLONES DE USD)

CUADRO 312 COMERCIO INDUSTRIAL DE VIETNAM EN EL MERCADO DE PREMEZCLAS LISTAS PARA BEBER/DE ALTA FORTALEZA, POR COMERCIO, 2018-2027 (MILLONES DE USD)

CUADRO 313 MERCADO EXTERIOR DE VIETNAM EN EL MERCADO DE PREMEZCLAS LISTAS PARA BEBER/DE ALTA FORTALEZA, POR COMERCIO, 2018-2027 (MILLONES DE USD)

CUADRO 314 COMERCIO MINORISTA EN TIENDAS DE VIETNAM EN EL MERCADO DE PREMEZCLAS LISTAS PARA BEBER/DE ALTA FORTALEZA, POR COMERCIO, 2018-2027 (MILLONES DE USD)

CUADRO 315 VIETNAM VENTA AL POR MENOR SIN TIENDAS EN EL MERCADO DE PREMEZCLAS LISTAS PARA BEBER/DE ALTA FORTALEZA, POR COMERCIO, 2018-2027 (MILLONES DE USD)

TABLA 316 MERCADO DE FILIPINAS LISTAS PARA BEBER/PREMEZCLAS DE ALTA FORTALEZA, POR TIPO, 2018-2027 (MILLONES DE USD)

TABLA 317 RTDS A BASE DE BEBIDAS LICORES EN FILIPINAS EN EL MERCADO DE PREMEZCLAS LISTAS PARA BEBER/DE ALTA POTENCIA, POR TIPO, 2018-2027 (MILLONES DE USD)

CUADRO 318 RTDS A BASE DE MALTA DE FILIPINAS EN EL MERCADO DE PREMEZCLAS LISTAS PARA BEBER/DE ALTA RESISTENCIA, POR TIPO, 2018-2027 (MILLONES DE USD)

CUADRO 319 MERCADO DE FILIPINAS LISTAS PARA BEBER/PREMEZCLAS DE ALTA FORTALEZA, POR TIPO DE PROCESAMIENTO, 2018-2027 (MILLONES DE USD)

CUADRO 320 MERCADO DE FILIPINAS LISTAS PARA BEBER/PREMEZCLAS DE ALTA FORTALEZA, POR GÉNERO, 2018-2027 (MILLONES DE USD)

TABLA 321 MERCADO DE FILIPINAS LISTAS PARA BEBER/PREMEZCLAS DE ALTA FORTALEZA, POR TIPO DE ENVASE, 2018-2027 (MILLONES DE USD)

CUADRO 322 MERCADO DE FILIPINAS LISTAS PARA BEBER/PREMEZCLAS DE ALTA FORTALEZA, POR COMERCIO, 2018-2027 (MILLONES DE USD)

CUADRO 323 FILIPINAS COMERCIO DE RESTAURACIÓN EN EL MERCADO DE PREMEZCLAS LISTAS PARA BEBER/DE ALTA FORTALEZA, POR COMERCIO, 2018-2027 (MILLONES DE USD)

CUADRO 324 FILIPINAS FUERA DEL COMERCIO EN EL MERCADO DE PREMEZCLAS LISTAS PARA BEBER/DE ALTA FORTALEZA, POR COMERCIO, 2018-2027 (MILLONES DE USD)

CUADRO 325 FILIPINAS COMERCIO MINORISTA EN TIENDAS EN EL MERCADO DE PREMEZCLAS LISTAS PARA BEBER/DE ALTA CONTENCIÓN, POR COMERCIO, 2018-2027 (MILLONES DE USD)

CUADRO 326 FILIPINAS COMERCIO MINORISTA SIN TIENDAS EN EL MERCADO DE PREMEZCLAS LISTAS PARA BEBER/DE ALTA CONTENCIÓN, POR COMERCIO, 2018-2027 (MILLONES DE USD)

TABLA 327 MERCADO DE SINGAPUR LISTO PARA BEBER/PREMEZCLAS DE ALTA RESISTENCIA, POR TIPO, 2018-2027 (MILLONES DE USD)

TABLA 328 RTDS A BASE DE BEBIDAS LICORES DE SINGAPUR EN EL MERCADO DE PREMEZCLAS LISTAS PARA BEBER/DE ALTA POTENCIA, POR TIPO, 2018-2027 (MILLONES DE USD)

TABLA 329 RTDS A BASE DE MALTA DE SINGAPUR EN EL MERCADO DE PREMEZCLAS LISTAS PARA BEBER/DE ALTA RESISTENCIA, POR TIPO, 2018-2027 (MILLONES DE USD)

TABLA 330 MERCADO DE SINGAPUR LISTO PARA BEBER/PREMEZCLAS DE ALTA FORTALEZA, POR TIPO DE PROCESAMIENTO, 2018-2027 (MILLONES DE USD)

TABLA 331 MERCADO DE SINGAPUR LISTO PARA BEBER/PREMEZCLAS DE ALTA FORTALEZA, POR GÉNERO, 2018-2027 (MILLONES DE USD)

TABLA 332 MERCADO DE SINGAPUR LISTO PARA BEBER/PREMEZCLAS DE ALTA FORTALEZA, POR TIPO DE ENVASE, 2018-2027 (MILLONES DE USD)

CUADRO 333 MERCADO DE SINGAPUR LISTO PARA BEBER/PREMEZCLAS DE ALTA FORTALEZA, POR COMERCIO, 2018-2027 (MILLONES DE USD)

CUADRO 334 SINGAPUR COMERCIO DE RESTAURACIÓN EN EL MERCADO DE PREMEZCLAS LISTAS PARA BEBER/DE ALTA FORTALEZA, POR COMERCIO, 2018-2027 (MILLONES DE USD)

TABLA 335 MERCADO EXTERIOR DE SINGAPUR EN EL MERCADO DE PREMEZCLAS LISTAS PARA BEBER/DE ALTA FORTALEZA, POR COMERCIO, 2018-2027 (MILLONES DE USD)

CUADRO 336 COMERCIO MINORISTA EN TIENDAS DE SINGAPUR EN EL MERCADO DE PREMEZCLAS LISTAS PARA BEBER/DE ALTA FORTALEZA, POR COMERCIO, 2018-2027 (MILLONES DE USD)

CUADRO 337 SINGAPUR COMERCIO MINORISTA SIN TIENDAS EN EL MERCADO DE PREMEZCLAS LISTAS PARA BEBER/DE ALTA CONTENCIÓN, POR COMERCIO, 2018-2027 (MILLONES DE USD)

TABLA 338 MERCADO DE MYANMAR LISTO PARA BEBER/PREMEZCLAS DE ALTA FORTALEZA, POR TIPO, 2018-2027 (MILLONES DE USD)

CUADRO 339 RTDS A BASE DE BEBIDAS LICORES DE MYANMAR EN EL MERCADO DE PREMEZCLAS LISTAS PARA BEBER/DE ALTA POTENCIA, POR TIPO, 2018-2027 (MILLONES DE USD)

TABLA 340 RTDS A BASE DE MALTA DE MYANMAR EN EL MERCADO DE PREMEZCLAS LISTAS PARA BEBER/DE ALTA RESISTENCIA, POR TIPO, 2018-2027 (MILLONES DE USD)

TABLA 341 MERCADO DE MYANMAR LISTO PARA BEBER/PREMEZCLAS DE ALTA FORTALEZA, POR TIPO DE PROCESAMIENTO, 2018-2027 (MILLONES DE USD)

TABLA 342 MERCADO DE MYANMAR LISTO PARA BEBER/PREMEZCLAS DE ALTA FORTALEZA, POR GÉNERO, 2018-2027 (MILLONES DE USD)

TABLA 343 MERCADO DE MYANMAR LISTO PARA BEBER/PREMEZCLAS DE ALTA FORTALEZA, POR TIPO DE ENVASE, 2018-2027 (MILLONES DE USD)

CUADRO 344 MERCADO DE MYANMAR LISTO PARA BEBER/PREMEZCLAS DE ALTA FORTALEZA, POR COMERCIO, 2018-2027 (MILLONES DE USD)

CUADRO 345 COMERCIO INDUSTRIAL DE MYANMAR EN EL MERCADO DE PREMEZCLAS LISTAS PARA BEBER/DE ALTA FORTALEZA, POR COMERCIO, 2018-2027 (MILLONES DE USD)

CUADRO 346 MYANMAR FUERA DEL COMERCIO EN EL MERCADO DE PREMEZCLAS LISTAS PARA BEBER/DE ALTA FORTALEZA, POR COMERCIO, 2018-2027 (MILLONES DE USD)

TABLA 347 MINORISTA EN TIENDAS DE MYANMAR EN EL MERCADO DE PREMEZCLAS LISTAS PARA BEBER/PREMEZCLAS DE ALTA CONTENCIÓN, POR COMERCIO, 2018-2027 (MILLONES DE USD)

CUADRO 348 MYANMAR VENTA AL POR MENOR SIN TIENDAS EN EL MERCADO DE PREMEZCLAS LISTAS PARA BEBER/DE ALTA CONTENCIÓN, POR COMERCIO, 2018-2027 (MILLONES DE USD)

TABLA 349 MERCADO DE MALASIA LISTO PARA BEBER/PREMEZCLAS DE ALTA FORTALEZA, POR TIPO, 2018-2027 (MILLONES DE USD)

TABLA 350 RTDS A BASE DE BEBIDAS LICORES DE MALASIA EN EL MERCADO DE PREMEZCLAS LISTAS PARA BEBER/DE ALTA POTENCIA, POR TIPO, 2018-2027 (MILLONES DE USD)

TABLA 351 RTDS A BASE DE MALTA DE MALASIA EN EL MERCADO DE PREMEZCLAS LISTAS PARA BEBER/DE ALTA RESISTENCIA, POR TIPO, 2018-2027 (MILLONES DE USD)

CUADRO 352 MERCADO DE MALASIA LISTO PARA BEBER/PREMEZCLAS DE ALTA FORTALEZA, POR TIPO DE PROCESAMIENTO, 2018-2027 (MILLONES DE USD)

CUADRO 353 MERCADO DE MALASIA LISTO PARA BEBER/PREMEZCLAS DE ALTA FORTALEZA, POR GÉNERO, 2018-2027 (MILLONES DE USD)

TABLA 354 MERCADO DE MALASIA LISTO PARA BEBER/PREMEZCLAS DE ALTA FORTALEZA, POR TIPO DE ENVASE, 2018-2027 (MILLONES DE USD)

CUADRO 355 MERCADO DE MALASIA LISTO PARA BEBER/PREMEZCLAS DE ALTA FORTALEZA, POR COMERCIO, 2018-2027 (MILLONES DE USD)

CUADRO 356 MALASIA COMERCIO INDUSTRIAL EN EL MERCADO DE PREMEZCLAS LISTAS PARA BEBER/DE ALTA FORTALEZA, POR COMERCIO, 2018-2027 (MILLONES DE USD)

TABLA 357 MERCADO EXTERIOR DE MALASIA EN EL MERCADO DE PREMEZCLAS LISTAS PARA BEBER/DE ALTA FORTALEZA, POR COMERCIO, 2018-2027 (MILLONES DE USD)

CUADRO 358 COMERCIO MINORISTA EN TIENDAS DE MALASIA EN EL MERCADO DE PREMEZCLAS LISTAS PARA BEBER/DE ALTA FORTALEZA, POR COMERCIO, 2018-2027 (MILLONES DE USD)

CUADRO 359 MALASIA MINORISTA SIN TIENDAS EN EL MERCADO DE PREMEZCLAS LISTAS PARA BEBER/DE ALTA CONTENCIÓN, POR COMERCIO, 2018-2027 (MILLONES DE USD)

TABLA 360 MERCADO DE INDONESIA LISTO PARA BEBER/PREMEZCLAS DE ALTA RESISTENCIA, POR TIPO, 2018-2027 (MILLONES DE USD)

TABLA 361 RTDS A BASE DE BEBIDAS LICORES DE INDONESIA EN EL MERCADO DE PREMEZCLAS LISTAS PARA BEBER/DE ALTA CONTENCIÓN, POR TIPO, 2018-2027 (MILLONES DE USD)

TABLA 362 RTDS A BASE DE MALTA DE INDONESIA EN EL MERCADO DE PREMEZCLAS LISTAS PARA BEBER/DE ALTA RESISTENCIA, POR TIPO, 2018-2027 (MILLONES DE USD)

CUADRO 363 MERCADO DE INDONESIA LISTO PARA BEBER/PREMEZCLAS DE ALTA FORTALEZA, POR TIPO DE PROCESAMIENTO, 2018-2027 (MILLONES DE USD)

CUADRO 364 MERCADO DE INDONESIA LISTO PARA BEBER/PREMEZCLAS DE ALTA FORTALEZA, POR GÉNERO, 2018-2027 (MILLONES DE USD)

TABLA 365 MERCADO DE INDONESIA LISTO PARA BEBER/PREMEZCLAS DE ALTA RESISTENCIA, POR TIPO DE ENVASE, 2018-2027 (MILLONES DE USD)

CUADRO 366 MERCADO DE INDONESIA LISTO PARA BEBER/PREMEZCLAS DE ALTA FORTALEZA, POR COMERCIO, 2018-2027 (MILLONES DE USD)

CUADRO 367 COMERCIO DE RESTAURACIÓN DE INDONESIA EN EL MERCADO DE PREMEZCLAS LISTAS PARA BEBER/DE ALTA FORTALEZA, POR COMERCIO, 2018-2027 (MILLONES DE USD)

CUADRO 368 MERCADO EXTERIOR DE INDONESIA EN EL MERCADO DE PREMEZCLAS LISTAS PARA BEBER/DE ALTA FORTALEZA, POR COMERCIO, 2018-2027 (MILLONES DE USD)

CUADRO 369 TIENDAS MINORISTAS EN INDONESIA EN EL MERCADO DE PREMEZCLAS LISTAS PARA BEBER/DE ALTA CONTENCIÓN, POR COMERCIO, 2018-2027 (MILLONES DE USD)

CUADRO 370 INDONESIA VENTA AL POR MENOR SIN TIENDAS EN EL MERCADO DE PREMEZCLAS LISTAS PARA BEBER/DE ALTA CONTENCIÓN, POR COMERCIO, 2018-2027 (MILLONES DE USD)

TABLA 371 RESTO DEL MERCADO DE ASIA Y PACÍFICO LISTOS PARA BEBER/PREMEZCLAS DE ALTA CONTENCIÓN, POR TIPO, 2018-2027 (MILLONES DE USD)

CUADRO 372 MERCADO DE SUDAMÉRICA LISTO PARA BEBER/PREMEZCLAS DE ALTA RESISTENCIA, POR PAÍS, 2018-2027 (MILLONES DE USD)

TABLA 373 MERCADO DE SUDAMÉRICA LISTO PARA BEBER/PREMEZCLAS DE ALTA RESISTENCIA, POR TIPO, 2018-2027 (MILLONES DE USD)

CUADRO 374 RTDS A BASE DE BEBIDAS LICORES EN AMÉRICA DEL SUR EN EL MERCADO DE PREMEZCLAS LISTAS PARA BEBER/DE ALTA CONTENCIÓN, POR TIPO, 2018-2027 (MILLONES DE USD)

TABLA 375 RTDS A BASE DE MALTA EN AMÉRICA DEL SUR EN EL MERCADO LISTO PARA BEBER/PREMEZCLAS DE ALTA RESISTENCIA, POR TIPO, 2018-2027 (MILLONES DE USD)

CUADRO 376 MERCADO DE SUDAMÉRICA LISTO PARA BEBER/PREMEZCLAS DE ALTA FORTALEZA, POR TIPO DE PROCESAMIENTO, 2018-2027 (MILLONES DE USD)

CUADRO 377 MERCADO DE SUDAMÉRICA LISTO PARA BEBER/PREMEZCLAS DE ALTA CONTENCIÓN, POR GÉNERO, 2018-2027 (MILLONES DE USD)

CUADRO 378 MERCADO DE SUDAMÉRICA LISTO PARA BEBER/PREMEZCLAS DE ALTA FORTALEZA, POR TIPO DE ENVASE, 2018-2027 (MILLONES DE USD)

CUADRO 379 MERCADO DE SUDAMÉRICA LISTO PARA BEBER/PREMEZCLAS DE ALTA RESISTENCIA, POR COMERCIO, 2018-2027 (MILLONES DE USD)

CUADRO 380 COMERCIO DE RESTAURACIÓN DE AMÉRICA DEL SUR EN EL MERCADO DE PREMEZCLAS LISTAS PARA BEBER/PREMEZCLAS DE ALTA FORTALEZA, POR COMERCIO, 2018-2027 (MILLONES DE USD)

TABLA 381 MERCADO EXTERIOR DE AMÉRICA DEL SUR EN EL MERCADO LISTO PARA BEBER/PREMEZCLAS DE ALTA FORTALEZA, POR COMERCIO, 2018-2027 (MILLONES DE USD)

CUADRO 382 COMERCIO MINORISTA EN TIENDAS EN AMÉRICA DEL SUR EN EL MERCADO DE PREMEZCLAS LISTAS PARA BEBER/DE ALTA CONTENCIÓN, POR COMERCIO, 2018-2027 (MILLONES DE USD)

CUADRO 383 COMERCIO MINORISTA SIN TIENDAS EN AMÉRICA DEL SUR EN EL MERCADO DE PREMEZCLAS LISTAS PARA BEBER/DE ALTA CONTENCIÓN, POR COMERCIO, 2018-2027 (MILLONES DE USD)

CUADRO 384 MERCADO DE BRASIL LISTO PARA BEBER/PREMEZCLAS DE ALTA FORTALEZA, POR TIPO, 2018-2027 (MILLONES DE USD)

TABLA 385 RTDS A BASE DE LICORES EN BRASIL EN EL MERCADO DE PREMEZCLAS LISTAS PARA BEBER/DE ALTA CONTENCIÓN, POR TIPO, 2018-2027 (MILLONES DE USD)

CUADRO 386 RTDS A BASE DE MALTA DE BRASIL EN EL MERCADO DE PREMEZCLAS LISTAS PARA BEBER/DE ALTA CONTENCIÓN, POR TIPO, 2018-2027 (MILLONES DE USD)

CUADRO 387 MERCADO DE BRASIL LISTOS PARA BEBER/PREMEZCLAS DE ALTA FORTALEZA, POR TIPO DE PROCESAMIENTO, 2018-2027 (MILLONES DE USD)

CUADRO 388 MERCADO DE BRASIL LISTOS PARA BEBER/PREMEZCLAS DE ALTA FORTALEZA, POR GÉNERO, 2018-2027 (MILLONES DE USD)

CUADRO 389 MERCADO DE BRASIL LISTO PARA BEBER/PREMEZCLAS DE ALTA FORTALEZA, POR TIPO DE ENVASE, 2018-2027 (MILLONES DE USD)

CUADRO 390 MERCADO DE BRASIL LISTO PARA BEBER/PREMEZCLAS DE ALTA FORTALEZA, POR COMERCIO, 2018-2027 (MILLONES DE USD)

CUADRO 391 COMERCIO BRASIL EN EL MERCADO DE PREMEZCLAS LISTAS PARA BEBER/PREMEZCLAS DE ALTA FORTALEZA, POR COMERCIO, 2018-2027 (MILLONES DE USD)

CUADRO 392 MERCADO EXTERIOR DE BRASIL EN EL MERCADO LISTO PARA BEBER/PREMEZCLAS DE ALTA FORTALEZA, POR COMERCIO, 2018-2027 (MILLONES DE USD)

CUADRO 393 COMERCIO MINORISTA EN TIENDAS EN BRASIL EN EL MERCADO DE PREMEZCLAS LISTAS PARA BEBER/PREMEZCLAS DE ALTA FORTALEZA, POR COMERCIO, 2018-2027 (MILLONES DE USD)

CUADRO 394 BRASIL COMERCIO MINORISTA SIN TIENDAS EN EL MERCADO DE PREMEZCLAS LISTAS PARA BEBER/DE ALTA CONTENCIÓN, POR COMERCIO, 2018-2027 (MILLONES DE USD)

CUADRO 395 MERCADO ARGENTINA LISTO PARA BEBER/PREMEZCLAS DE ALTA FORTALEZA, POR TIPO, 2018-2027 (MILLONES DE USD)

CUADRO 396 RTDS A BASE DE LICORES EN ARGENTINA EN EL MERCADO LISTOS PARA BEBER/PREMEZCLAS DE ALTA POTENCIA, POR TIPO, 2018-2027 (MILLONES DE USD)

CUADRO 397 RTDS A BASE DE MALTA ARGENTINA EN EL MERCADO LISTOS PARA BEBER/PREMEZCLAS DE ALTA RESISTENCIA, POR TIPO, 2018-2027 (MILLONES DE USD)

CUADRO 398 MERCADO ARGENTINA LISTO PARA BEBER/PREMEZCLAS DE ALTA FORTALEZA, POR TIPO DE PROCESAMIENTO, 2018-2027 (MILLONES DE USD)

CUADRO 399 MERCADO ARGENTINA LISTO PARA BEBER/PREMEZCLAS DE ALTA FORTALEZA, POR GÉNERO, 2018-2027 (MILLONES DE USD)

TABLA 400 MERCADO ARGENTINA LISTO PARA BEBER/PREMEZCLAS DE ALTA FORTALEZA, POR TIPO DE ENVASE, 2018-2027 (MILLONES DE USD)

CUADRO 401 MERCADO ARGENTINA LISTO PARA BEBER/PREMEZCLAS DE ALTA FORTALEZA, POR COMERCIO, 2018-2027 (MILLONES DE USD)

CUADRO 402 ARGENTINA ON COMERCIO EN EL MERCADO DE PREMEZCLAS LISTAS PARA BEBER / ALTA FORTALEZA, POR COMERCIO, 2018-2027 (MILLONES DE USD)

CUADRO 403 ARGENTINA OFF-COMER MERCADO LISTO PARA BEBER / PREMEZCLAS DE ALTA FORTALEZA, POR COMERCIO, 2018-2027 (MILLONES DE USD)

CUADRO 404 COMERCIO MINORISTA EN TIENDAS EN ARGENTINA EN EL MERCADO DE PREMEZCLAS LISTAS PARA BEBER/PREMEZCLAS DE ALTA FORTALEZA, POR COMERCIO, 2018-2027 (MILLONES DE USD)

CUADRO 405 ARGENTINA COMERCIO MINORISTA SIN TIENDAS EN EL MERCADO LISTO PARA BEBER/PREMEZCLAS DE ALTA CONTENCIÓN, POR COMERCIO, 2018-2027 (MILLONES DE USD)

TABLA 406 RESTO DE SUDAMÉRICA MERCADO LISTO PARA BEBER/PREMEZCLAS DE ALTA CONTENCIÓN, POR TIPO, 2018-2027 (MILLONES DE USD)

CUADRO 407 MERCADO DE ORIENTE MEDIO Y ÁFRICA LISTO PARA BEBER/PREMEZCLAS DE ALTA FORTALEZA, POR PAÍS, 2018-2027 (MILLONES DE USD)

TABLA 408 MERCADO DE ORIENTE MEDIO Y ÁFRICA LISTO PARA BEBER/PREMEZCLAS DE ALTA RESISTENCIA, POR TIPO, 2018-2027 (MILLONES DE USD)

TABLA 409 RTDS A BASE DE BEBIDAS LICORES EN ORIENTE MEDIO Y ÁFRICA EN EL MERCADO DE PREMEZCLAS LISTAS PARA BEBER/DE ALTA POTENCIA, POR TIPO, 2018-2027 (MILLONES DE USD)

TABLA 410 RTDS A BASE DE MALTA DE ORIENTE MEDIO Y ÁFRICA EN EL MERCADO DE PREMEZCLAS LISTAS PARA BEBER/DE ALTA RESISTENCIA, POR TIPO, 2018-2027 (MILLONES DE USD)

TABLA 411 MERCADO DE ORIENTE MEDIO Y ÁFRICA LISTOS PARA BEBER/PREMEZCLAS DE ALTA FORTALEZA, POR TIPO DE PROCESAMIENTO, 2018-2027 (MILLONES DE USD)

CUADRO 412 MERCADO DE ORIENTE MEDIO Y ÁFRICA LISTO PARA BEBER/PREMEZCLAS DE ALTA CONTENCIÓN, POR GÉNERO, 2018-2027 (MILLONES DE USD)

TABLA 413 MERCADO DE ORIENTE MEDIO Y ÁFRICA LISTO PARA BEBER/PREMEZCLAS DE ALTA FORTALEZA, POR TIPO DE ENVASE, 2018-2027 (MILLONES DE USD)

CUADRO 414 MERCADO DE ORIENTE MEDIO Y ÁFRICA LISTOS PARA BEBER/PREMEZCLAS DE ALTA FORTALEZA, POR COMERCIO, 2018-2027 (MILLONES DE USD)

CUADRO 415 ORIENTE MEDIO Y ÁFRICA COMERCIO DE RESTAURACIÓN EN EL MERCADO DE PREMEZCLAS LISTAS PARA BEBER/DE ALTA FORTALEZA, POR COMERCIO, 2018-2027 (MILLONES DE USD)

CUADRO 416 ORIENTE MEDIO Y ÁFRICA FUERA DEL MERCADO DE PREMEZCLAS LISTAS PARA BEBER/DE ALTA FORTALEZA, POR COMERCIO, 2018-2027 (MILLONES DE USD)

CUADRO 417 ORIENTE MEDIO Y ÁFRICA COMERCIO MINORISTA EN TIENDAS EN EL MERCADO DE PREMEZCLAS LISTAS PARA BEBER/DE ALTA CONTENCIÓN, POR COMERCIO, 2018-2027 (MILLONES DE USD)

CUADRO 418 ORIENTE MEDIO Y ÁFRICA COMERCIO MINORISTA SIN TIENDAS EN EL MERCADO DE PREMEZCLAS LISTAS PARA BEBER/DE ALTA CONTENCIÓN, POR COMERCIO, 2018-2027 (MILLONES DE USD)

TABLA 419 MERCADO DE SUDÁFRICA LISTO PARA BEBER/PREMEZCLAS DE ALTA RESISTENCIA, POR TIPO, 2018-2027 (MILLONES DE USD)

TABLA 420 RTDS A BASE DE BEBIDAS LICORES EN SUDÁFRICA EN EL MERCADO DE PREMEZCLAS LISTAS PARA BEBER/DE ALTA CONTENCIÓN, POR TIPO, 2018-2027 (MILLONES DE USD)

TABLA 421 RTDS A BASE DE MALTA DE SUDÁFRICA EN EL MERCADO DE PREMEZCLAS LISTAS PARA BEBER/DE ALTA RESISTENCIA, POR TIPO, 2018-2027 (MILLONES DE USD)

CUADRO 422 MERCADO DE SUDÁFRICA LISTO PARA BEBER/PREMEZCLAS DE ALTA FORTALEZA, POR TIPO DE PROCESAMIENTO, 2018-2027 (MILLONES DE USD)

TABLA 423 MERCADO DE SUDÁFRICA LISTO PARA BEBER/PREMEZCLAS DE ALTA FORTALEZA, POR GÉNERO, 2018-2027 (MILLONES DE USD)

TABLA 424 MERCADO DE SUDÁFRICA LISTO PARA BEBER/PREMEZCLAS DE ALTA RESISTENCIA, POR TIPO DE ENVASE, 2018-2027 (MILLONES DE USD)

CUADRO 425 MERCADO DE SUDÁFRICA LISTO PARA BEBER/PREMEZCLAS DE ALTA FORTALEZA, POR COMERCIO, 2018-2027 (MILLONES DE USD)

CUADRO 426 COMERCIO DE RESTAURACIÓN DE SUDÁFRICA EN EL MERCADO DE PREMEZCLAS LISTAS PARA BEBER/PREMEZCLAS DE ALTA FORTALEZA, POR COMERCIO, 2018-2027 (MILLONES DE USD)

TABLA 427 MERCADO EXTERIOR DE SUDÁFRICA EN EL MERCADO DE PREMEZCLAS LISTAS PARA BEBER/DE ALTA FORTALEZA, POR COMERCIO, 2018-2027 (MILLONES DE USD)

CUADRO 428 COMERCIO MINORISTA EN TIENDAS DE SUDÁFRICA EN EL MERCADO DE PREMEZCLAS LISTAS PARA BEBER/DE ALTA CONTENCIÓN, POR COMERCIO, 2018-2027 (MILLONES DE USD)

CUADRO 429 SUDÁFRICA COMERCIO MINORISTA NO DISPONIBLE EN TIENDAS EN EL MERCADO DE PREMEZCLAS LISTAS PARA BEBER/DE ALTA CONTENCIÓN, POR COMERCIO, 2018-2027 (MILLONES DE USD)

TABLA 430 MERCADO DE PREMEZCLAS DE ALTA RESISTENCIA/LISTOS PARA BEBER DE LOS EAU, POR TIPO, 2018-2027 (MILLONES DE USD)

TABLA 431 RTDS A BASE DE BEBIDAS LICORES DE LOS EAU EN EL MERCADO DE PREMEZCLAS LISTAS PARA BEBER/DE ALTA CONTENCIÓN, POR TIPO, 2018-2027 (MILLONES DE USD)

TABLA 432 RTDS A BASE DE MALTA DE LOS EAU EN EL MERCADO DE PREMEZCLAS LISTAS PARA BEBER/DE ALTA RESISTENCIA, POR TIPO, 2018-2027 (MILLONES DE USD)

TABLA 433 MERCADO DE PREMEZCLAS LISTAS PARA BEBER/DE ALTA FORTALEZA DE LOS EAU, POR TIPO DE PROCESAMIENTO, 2018-2027 (MILLONES DE USD)

TABLA 434 MERCADO DE PREMEZCLAS LISTAS PARA BEBER/DE ALTA FORTALEZA DE LOS EAU, POR GÉNERO, 2018-2027 (MILLONES DE USD)

TABLA 435 MERCADO DE PREMEZCLAS LISTAS PARA BEBER/DE ALTA FORTALEZA DE LOS EAU, POR TIPO DE ENVASE, 2018-2027 (MILLONES DE USD)

CUADRO 436 MERCADO DE PREMEZCLAS LISTAS PARA BEBER/DE ALTA FORTALEZA DE LOS EAU, POR COMERCIO, 2018-2027 (MILLONES DE USD)

CUADRO 437 COMERCIO DE RESTAURACIÓN DE LOS EAU EN EL MERCADO DE PREMEZCLAS LISTAS PARA BEBER/DE ALTA FORTALEZA, POR COMERCIO, 2018-2027 (MILLONES DE USD)

CUADRO 438 MERCADO FUERA DEL COMERCIO DE LOS EAU EN EL MERCADO DE PREMEZCLAS LISTAS PARA BEBER/ DE ALTA FORTALEZA, POR COMERCIO, 2018-2027 (MILLONES DE USD)

TABLA 439 COMERCIO MINORISTA EN TIENDAS DE LOS EAU EN EL MERCADO DE PREMEZCLAS LISTAS PARA BEBER/DE ALTA FORTALEZA, POR COMERCIO, 2018-2027 (MILLONES DE USD)

TABLA 440 COMERCIO MINORISTA NO ESTABLECIDO EN TIENDAS DE LOS EAU EN EL MERCADO DE PREMEZCLAS LISTAS PARA BEBER/DE ALTA CONTENCIÓN, POR COMERCIO, 2018-2027 (MILLONES DE USD)

TABLA 441 MERCADO DE QATAR LISTO PARA BEBER / PREMEZCLAS DE ALTA FORTALEZA, POR TIPO, 2018-2027 (MILLONES DE USD)

TABLA 442 RTDS A BASE DE ALCOHOL DE QATAR EN EL MERCADO DE PREMEZCLAS LISTAS PARA BEBER/DE ALTA POTENCIA, POR TIPO, 2018-2027 (MILLONES DE USD)

TABLA 443 RTDS A BASE DE MALTA DE QATAR EN EL MERCADO DE PREMEZCLAS LISTAS PARA BEBER/DE ALTA RESISTENCIA, POR TIPO, 2018-2027 (MILLONES DE USD)

TABLA 444 MERCADO DE QATAR LISTO PARA BEBER/PREMEZCLAS DE ALTA FORTALEZA, POR TIPO DE PROCESAMIENTO, 2018-2027 (MILLONES DE USD)

TABLA 445 MERCADO DE QATAR LISTO PARA BEBER/PREMEZCLAS DE ALTA FORTALEZA, POR GÉNERO, 2018-2027 (MILLONES DE USD)

TABLA 446 MERCADO DE QATAR LISTO PARA BEBER/PREMEZCLAS DE ALTA FORTALEZA, POR TIPO DE ENVASE, 2018-2027 (MILLONES DE USD)

CUADRO 447 MERCADO DE QATAR LISTO PARA BEBER/PREMEZCLAS DE ALTA FORTALEZA, POR COMERCIO, 2018-2027 (MILLONES DE USD)

CUADRO 448 QATAR ON COMERCIO EN EL MERCADO DE PREMEZCLAS LISTAS PARA BEBER/DE ALTA FORTALEZA, POR COMERCIO, 2018-2027 (MILLONES DE USD)

TABLA 449 MERCADO EXTERIOR DE QATAR EN EL MERCADO DE PREMEZCLAS LISTAS PARA BEBER/DE ALTA FORTALEZA, POR COMERCIO, 2018-2027 (MILLONES DE USD)

TABLA 450 COMERCIO MINORISTA EN TIENDAS DE QATAR EN EL MERCADO DE PREMEZCLAS LISTAS PARA BEBER/DE ALTA CONTENCIÓN, POR COMERCIO, 2018-2027 (MILLONES DE USD)

CUADRO 451 QATAR COMERCIO MINORISTA SIN TIENDAS EN EL MERCADO DE PREMEZCLAS LISTAS PARA BEBER/DE ALTA CONTENCIÓN, POR COMERCIO, 2018-2027 (MILLONES DE USD)

TABLA 452 MERCADO DE OMÁN LISTO PARA BEBER / PREMEZCLAS DE ALTA FORTALEZA, POR TIPO, 2018-2027 (MILLONES DE USD)

CUADRO 453 RTDS A BASE DE BEBIDAS LICORES DE OMÁN EN EL MERCADO DE PREMEZCLAS LISTAS PARA BEBER/DE ALTA FORTALEZA, POR TIPO, 2018-2027 (MILLONES DE USD)

TABLA 454 RTDS A BASE DE MALTA DE OMÁN EN EL MERCADO DE PREMEZCLAS LISTAS PARA BEBER/DE ALTA FORTALEZA, POR TIPO, 2018-2027 (MILLONES DE USD)

CUADRO 455 MERCADO OMÁN DE PREMEZCLAS LISTAS PARA BEBER/ DE ALTA FORTALEZA, POR TIPO DE PROCESAMIENTO, 2018-2027 (MILLONES DE USD)

CUADRO 456 MERCADO DE OMÁN LISTO PARA BEBER/PREMEZCLAS DE ALTA FORTALEZA, POR GÉNERO, 2018-2027 (MILLONES DE USD)

TABLA 457 MERCADO OMÁN DE PREMEZCLAS LISTAS PARA BEBER/DE ALTA FORTALEZA, POR TIPO DE ENVASE, 2018-2027 (MILLONES DE USD)

CUADRO 458 MERCADO DE OMÁN LISTO PARA BEBER/PREMEZCLAS DE ALTA FORTALEZA, POR COMERCIO, 2018-2027 (MILLONES DE USD)

CUADRO 459 COMERCIO OMÁN DE RESTAURACIÓN EN EL MERCADO DE PREMEZCLAS LISTAS PARA BEBER/DE ALTA FORTALEZA, POR COMERCIO, 2018-2027 (MILLONES DE USD)

CUADRO 460 MERCADO EXTERIOR DE OMÁN EN EL MERCADO DE PREMEZCLAS LISTAS PARA BEBER/DE ALTA FORTALEZA, POR COMERCIO, 2018-2027 (MILLONES DE USD)

CUADRO 461 COMERCIO MINORISTA EN TIENDAS DE OMÁN EN EL MERCADO DE PREMEZCLAS LISTAS PARA BEBER/DE ALTA FORTALEZA, POR COMERCIO, 2018-2027 (MILLONES DE USD)

CUADRO 462 OMÁN COMERCIO MINORISTA SIN TIENDAS EN EL MERCADO DE PREMEZCLAS LISTAS PARA BEBER/DE ALTA CONTENCIÓN, POR COMERCIO, 2018-2027 (MILLONES DE USD)

TABLA 463 RESTO DE ORIENTE MEDIO Y ÁFRICA MERCADO DE PREMEZCLAS LISTAS PARA BEBER/DE ALTA RESISTENCIA, POR TIPO, 2018-2027 (MILLONES DE USD)


Por favor complete el siguiente formulario para Infografías

Al hacer clic en el botón "Enviar", usted acepta la investigación de mercado de Data Bridge. política de privacidad y Términos y condiciones

Metodología de investigación:

La recopilación de datos y el análisis del año base se realizan mediante módulos de recopilación de datos con muestras de gran tamaño. La etapa incluye la obtención de información de mercado o datos relacionados a través de diversas fuentes y estrategias. Incluye examinar y planificar de antemano todos los datos adquiridos del pasado. Asimismo, abarca el examen de las inconsistencias de la información observadas en diferentes fuentes de información. Los datos de mercado se analizan y estiman utilizando modelos estadísticos y coherentes de mercado. Además, el análisis de la cuota de mercado y el análisis de tendencias clave son los principales factores de éxito en el informe de mercado. Para saber más, solicite una llamada de analista o envíe su consulta.

La metodología de investigación clave utilizada por el equipo de investigación de DBMR es la triangulación de datos, que implica extracción de datos, análisis del impacto de las variables de datos en el mercado y validación primaria (experto de la industria). Los modelos de datos incluyen cuadrícula de posicionamiento de proveedores, análisis de la línea de tiempo del mercado, descripción general y guía del mercado, cuadrícula de posicionamiento de la empresa, análisis de patentes, análisis de precios, análisis de participación de mercado de la empresa, estándares de medición, análisis global versus regional y de participación de proveedores. Para saber más sobre la metodología de investigación, envíe una consulta para hablar con nuestros expertos de la industria.

Por favor complete el siguiente formulario para Metodología de Investigación

Al hacer clic en el botón "Enviar", usted acepta la investigación de mercado de Data Bridge. política de privacidad y Términos y condiciones

Personalización disponible:

Data Bridge Market Research es líder en investigación formativa avanzada. Estamos orgullosos de brindar servicios a nuestros clientes nuevos y existentes con datos y análisis que coinciden y se adaptan a sus objetivos. El informe se puede personalizar para incluir análisis de tendencias de precios de marcas objetivo que comprendan el mercado de países adicionales (solicite la lista de países), datos de resultados de ensayos clínicos, revisión de la literatura, mercado renovado y análisis de la base de productos. El análisis de mercado de los competidores objetivo se puede analizar desde análisis basados ​​en tecnología hasta estrategias de cartera de mercado. Podemos agregar tantos competidores sobre los que necesite datos en el formato y estilo de datos que esté buscando. Nuestro equipo de analistas también puede proporcionarle datos en tablas dinámicas de archivos de Excel sin procesar (libro de datos) o puede ayudarlo a crear presentaciones a partir de los conjuntos de datos disponibles en el informe.

Complete el siguiente formulario para personalizar disponible

Al hacer clic en el botón "Enviar", usted acepta la investigación de mercado de Data Bridge. política de privacidad y Términos y condiciones

HAGA PREGUNTAS FRECUENTES

El mercado de premezclas listas para beber/de alta resistencia crecerá a una tasa compuesta anual del 3,9% para el año previsto 2029.
El valor de mercado de premezclas listas para beber/alta resistencia alcanzará los 48.265,54 millones de dólares según las previsiones para 2029.
Los principales actores que operan en el mercado de premezclas listas para beber/de alta resistencia son Davide Campari-Milano NV (Países Bajos), Diageo PLC (Reino Unido), Halewood International Limited (Reino Unido), Asahi Group Holdings, Ltd. (Japón), Accolade Wines ( Australia), Bacardi Limited (Bermudas), Mike's Hard Lemonade Co. (EE.UU.), Castel Group (Francia), Suntory Holdings Limited (Japón), Anheuser-Busch InBev SA/NV (Bélgica), The Brown-Forman Corporation (EE.UU.) , United Brands Company, Inc. (EE.UU.), PernodRicard SA (Francia), The Miller Brewing Company (EE.UU.).
Los factores importantes que hacen florecer el crecimiento del mercado de premezclas listas para beber/de alta resistencia son la creciente popularidad de las bebidas con sabor a bajo contenido de alcohol y las estrategias de marketing innovadoras para los consumidores objetivo.
Informe de muestra gratuito

ELEGIR TIPO DE LICENCIA

  • 7000.00
  • 4800.00
  • 3000.00
  • 8000.00
  • 12000.00

Por qué elegirnos

Cobertura de la industria

DBMR trabaja en todo el mundo en múltiples industrias, lo que nos brinda conocimiento en todos los sectores verticales y brinda a nuestros clientes información no solo de su industria sino también de cómo otras industrias afectarán su ecosistema.

Cobertura Regional

La cobertura de Data Bridge no se limita a las economías desarrolladas o emergentes. Trabajamos en todo el mundo cubriendo la mayor variedad de países donde ninguna otra firma de investigación de mercado o consultoría de negocios ha realizado investigaciones; creando oportunidades de crecimiento para nuestros clientes en áreas aún desconocidas.

Cobertura Tecnológica

En el mundo actual, la tecnología impulsa el sentimiento del mercado, por lo que nuestra visión es brindarles a nuestros clientes información no solo sobre las tecnologías desarrolladas, sino también sobre los próximos y disruptivos cambios tecnológicos a lo largo del ciclo de vida del producto, brindándoles oportunidades imprevistas en el mercado que crearán disrupciones en su industria. . Esto lleva a la innovación y a que nuestros clientes salgan ganadores.

Soluciones orientadas a objetivos

El objetivo de DBMR es ayudar a nuestros clientes a alcanzar sus objetivos a través de nuestras soluciones; por lo tanto, creamos de manera formativa las soluciones más adecuadas para las necesidades de nuestros clientes, ahorrándoles tiempo y esfuerzos para impulsar sus grandes estrategias.

Soporte de analista incomparable

Nuestros analistas se enorgullecen del éxito de nuestros clientes. A diferencia de otros, creemos en trabajar junto a nuestros clientes para lograr sus objetivos con soporte de analistas las 24 horas para determinar las necesidades correctas e inspirar la innovación a través del servicio.

Banner

testimonios de clientes