

Mercado mundial de pasas, por tipo de producto (natural sin semillas, grosella negra, grosella de Nemea, grosella dorada sin semillas, moscatel, sultana, monukka y otras), método de secado (secado al sol y secado mecánico), naturaleza (orgánica y convencional), usuario final (hogar/venta minorista, sector de procesamiento de alimentos, sector de servicios de alimentos, nutracéuticos y otros), canal de distribución (directo e indirecto) - Tendencias de la industria y pronóstico hasta 2030.
Análisis y perspectivas del mercado de las pasas
Las pasas son uvas secas. Los tres pasos para la producción comercial de pasas incluyen procesos de pretratamiento, secado y possecado. Las variedades de pasas dependen del tipo de uva y se presentan en una variedad de tamaños y colores, incluidos verde, negro, marrón, morado, azul y amarillo.
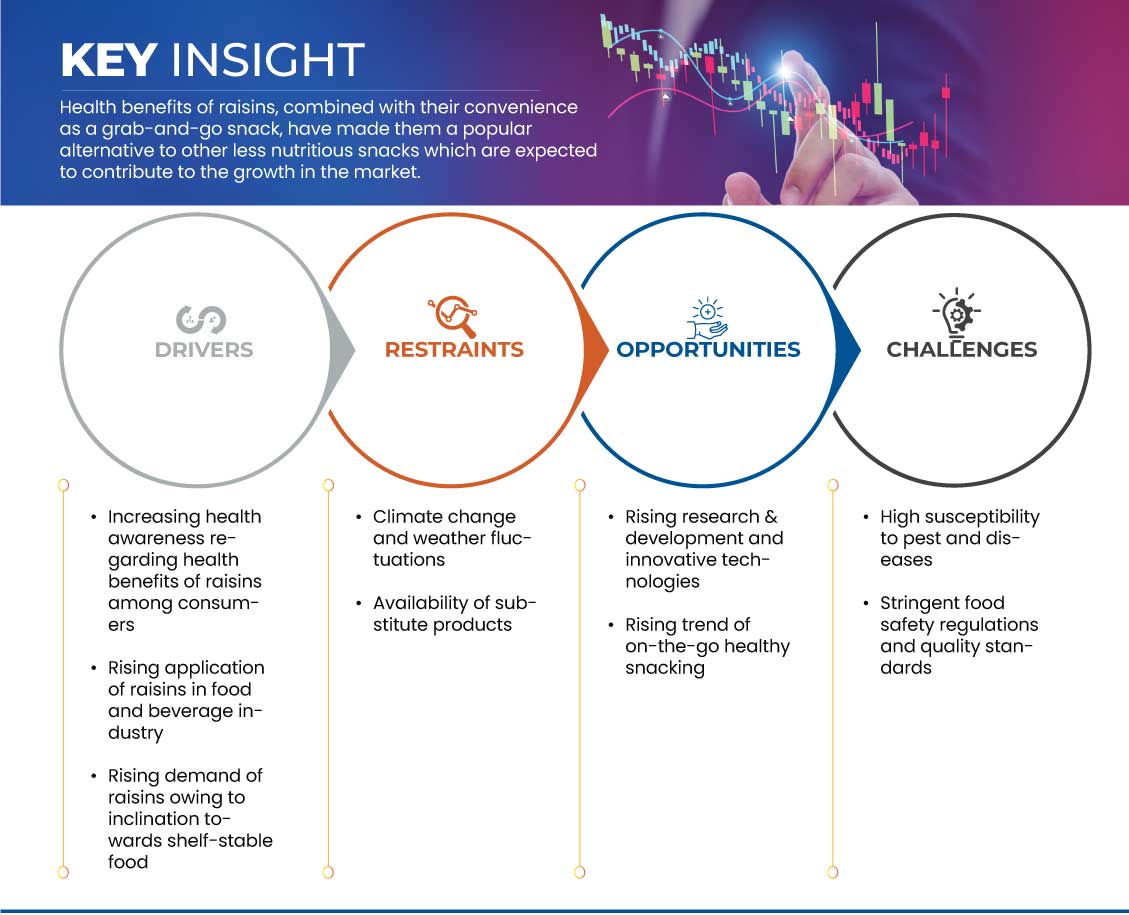
Los principales factores que se espera que impulsen el crecimiento del mercado mundial de pasas en el período de pronóstico son la creciente demanda de pasas en las industrias de alimentos y bebidas y la creciente conciencia sobre los beneficios para la salud de las pasas entre los consumidores. Además, la adopción de tecnologías y soluciones innovadoras y la creciente tendencia de los snacks para llevar están impulsando aún más el mercado mundial de pasas. Por otro lado, se prevé que la disponibilidad de productos sustitutos descarrile el crecimiento del mercado mundial de pasas. Además, la alta susceptibilidad a las plagas y enfermedades crea más obstrucciones en el mercado mundial de pasas en el futuro cercano.
La demanda de pasas está aumentando, por lo que los fabricantes ahora están más concentrados y participan en el lanzamiento de nuevos productos, la promoción, los premios, la certificación y la participación en eventos en el mercado. Estas decisiones, en última instancia, están mejorando el crecimiento del mercado.
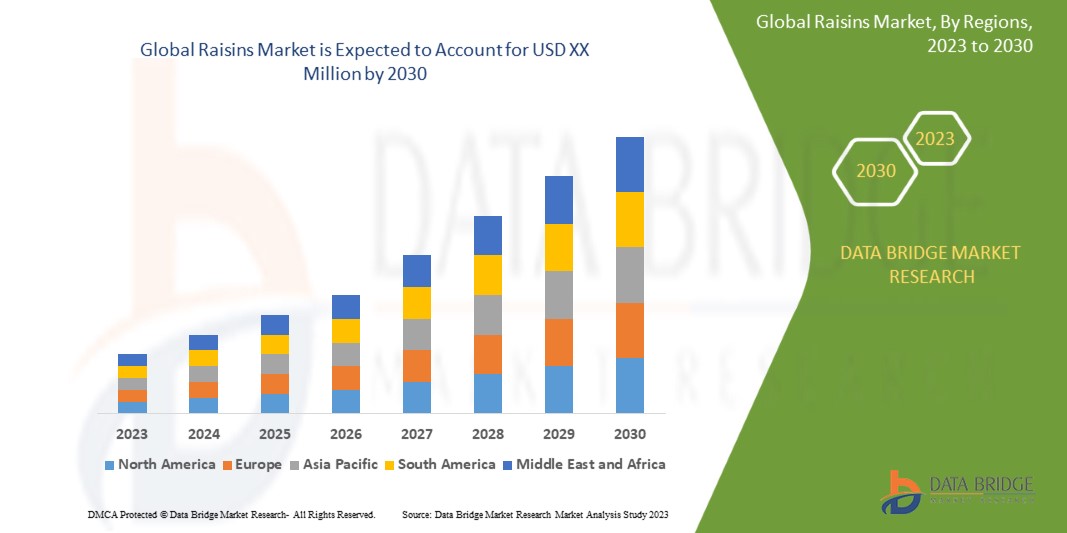
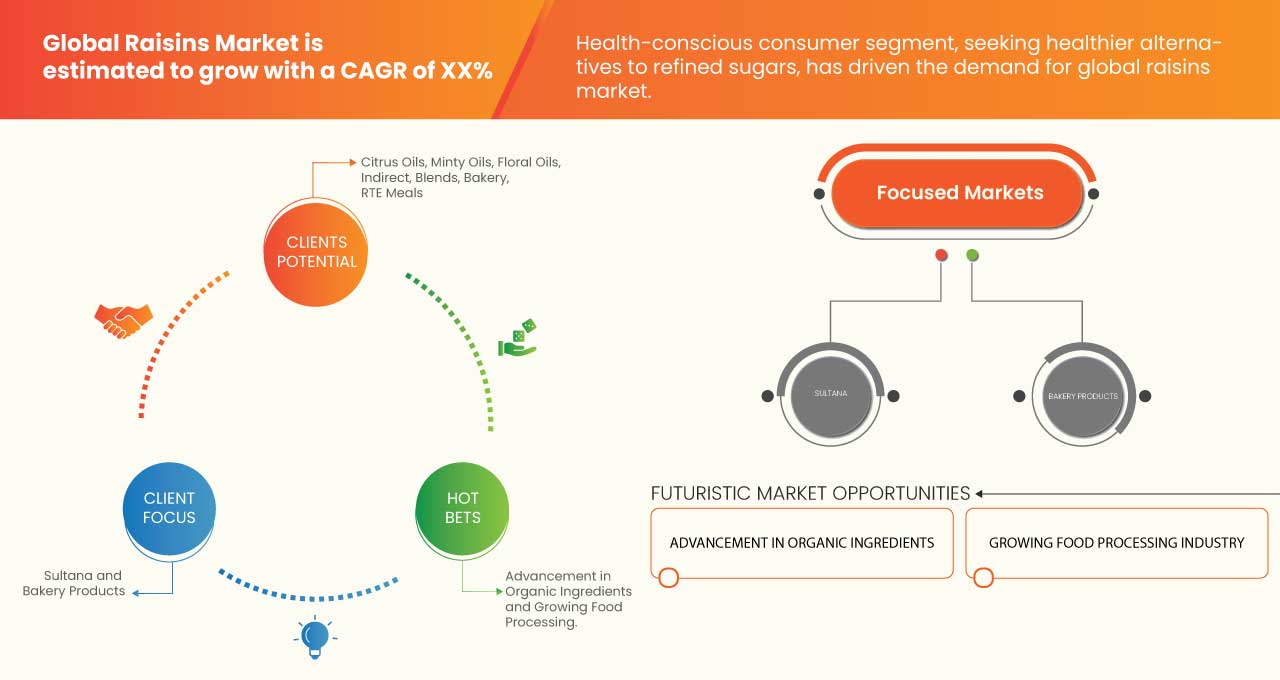
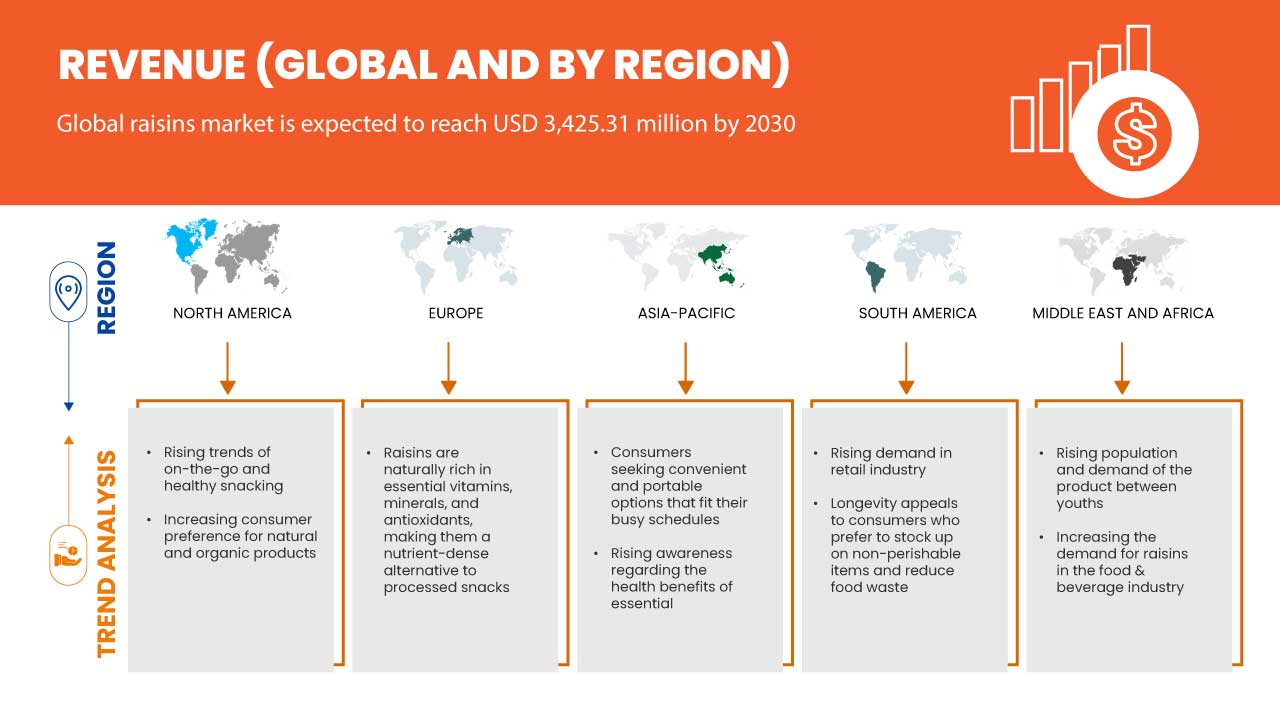
Data Bridge Market Research analiza que el mercado mundial de pasas crecerá a una CAGR del 5,5% durante el período de pronóstico de 2023 a 2030.
|
Métrica del informe |
Detalles |
|
Período de pronóstico |
2023 a 2030 |
|
Año base |
2022 |
|
Años históricos |
2021 (Personalizable para 2015 - 2020) |
|
Unidades cuantitativas |
Ingresos en millones de USD, volumen en unidades, precios en USD |
|
Segmentos cubiertos |
Tipo de producto (grosella negra, grosella de Nemea, grosella dorada sin semillas, moscatel, sultana, monukka y otras), método de secado (secado al sol y secado mecánico), naturaleza (orgánica y convencional), usuario final (hogar/venta minorista, sector de procesamiento de alimentos, sector de servicios de alimentos, nutracéuticos y otros), canal de distribución (directo e indirecto) |
|
Regiones cubiertas |
EE. UU., Canadá, México, Alemania, Francia, Reino Unido, Italia, España, Rusia, Turquía, Bélgica, Países Bajos, Suiza y el resto de Europa, Japón, China, Corea del Sur, India, Australia, Singapur, Nueva Zelanda, Malasia, Indonesia, Filipinas y el resto de Asia-Pacífico, Brasil, Argentina y el resto de América del Sur, Sudáfrica, Arabia Saudita, Emiratos Árabes Unidos, Egipto, Israel y el resto de Medio Oriente y África. |
|
Actores del mercado cubiertos |
Arimex, Del Monte Foods, Inc., Dole Packaged Foods, LLC, NationalRaisin Company, Sun-Maid Growers of California, Akrodria, Montagu Snacks, Gauri Farm, Geobres, ROYAL NUT COMPANY, Fruits of Turkey, SUNBEAM FOOD, Lion Raisins, Traina Home Grown, Bergin.com, SUN VALLEY RAISINS, River Ranch Raisins, VARSHA INDUSTRIES PVT. LTD., Royal Nuts, frutos secos y especias y arav Agro Industries. |
Definición de mercado
Las pasas son uvas secas. Las pasas se cultivan en muchas partes del mundo y se pueden comer crudas o cocidas, horneadas o fermentadas. Los tipos de uva varían según la variedad y vienen en una variedad de tamaños y colores, como verde, negro, marrón, morado, azul y amarillo. Las pasas se producen comercialmente secando las bayas de uva cosechadas. Para secar una baya de uva, el agua dentro de la uva debe eliminarse por completo del interior de las células y transferirse a la superficie de la uva, donde las gotas de agua pueden evaporarse. Sin embargo, este proceso de difusión es difícil porque la cutícula de la piel de la uva incluye cera, que impide que el agua fluya a través de ella.
Dinámica del mercado mundial de las pasas
Conductores
- Aumentar la concienciación sobre los múltiples beneficios de las pasas entre los consumidores
En los últimos años, el mercado mundial de pasas ha experimentado un crecimiento significativo, impulsado principalmente por la creciente conciencia de sus numerosos beneficios para la salud entre los consumidores. Las pasas están siendo reconocidas como una opción natural y nutritiva, lo que contribuye a un aumento de la demanda en varios grupos demográficos. A medida que los consumidores de todo el mundo se vuelven más conscientes de la salud, existe un énfasis creciente en la adopción de opciones alimentarias más saludables. Las pasas, al ser un producto natural sin azúcares añadidos ni conservantes artificiales, se alinean perfectamente con esta tendencia. Los beneficios para la salud de las pasas, combinados con su conveniencia como un refrigerio para llevar, las han convertido en una alternativa popular a otros refrigerios menos nutritivos. Las pasas están repletas de vitaminas esenciales , minerales y antioxidantes, lo que las convierte en un alimento rico en nutrientes. Son una excelente fuente de fibras dietéticas , hierro, potasio y vitaminas del complejo B. Además, las pasas contienen compuestos naturales como polifenoles y fitoquímicos, que están asociados con varios beneficios para la salud, como una mejor salud cardíaca y un menor riesgo de enfermedades crónicas.
Por ejemplo,
- En julio de 2023, según un artículo publicado en HealthifyMe, las pasas ayudan con la digestión, mejoran la vista, regulan la presión arterial, fortalecen los huesos, apoyan los objetivos de pérdida de peso, aumentan la inmunidad, previenen la anemia, alivian la hinchazón y la acidez, previenen la caries dental, regulan los niveles de colesterol y promueven el cuidado de la piel y el cabello saludable.
El uso creciente de las pasas en la industria de alimentos y bebidas
Las pasas, uvas secas conocidas por su dulzura natural y su rico perfil nutricional, han sido parte integral de las cocinas tradicionales durante siglos. Sin embargo, en los últimos años, el mercado mundial de pasas ha sido testigo de un crecimiento notable, impulsado en gran medida por las crecientes aplicaciones de las pasas en la industria de alimentos y bebidas. Las pasas se utilizan ampliamente en la industria de la panadería para agregar dulzura natural, textura y sabor a una variedad de productos. Se incorporan comúnmente al pan, muffins, pasteles y galletas , mejorando su sabor y valor nutricional. El segmento de consumidores conscientes de la salud, que busca alternativas más saludables a los azúcares refinados, ha impulsado la demanda de productos de panadería con infusión de pasas. Además, las pasas son un complemento popular para los cereales y los alimentos para el desayuno, como las barras de granola , la avena y el muesli. Su dulzura natural y su textura masticable las convierten en una opción atractiva para mejorar el sabor y el contenido nutricional de estos productos.
Por ejemplo,
- En junio de 2021, según un artículo publicado en Bakery&Snacks, las pasas se incorporan en gran medida a productos horneados como pasteles, muffins y brownies, entre otros. Además, se ha demostrado que las pasas son más efectivas cuando se usan como sustituto de los huevos y la grasa en productos de panadería.
Además, la industria de alimentos y bebidas también ha sido testigo del surgimiento de bebidas a base de pasas, incluidos batidos, jugos y bebidas alcohólicas con infusión de pasas . Estas bebidas ofrecen un perfil de sabor único y se perciben como opciones más saludables en comparación con las bebidas con azúcares agregados y saborizantes artificiales. La versatilidad de las pasas permite incorporarlas fácilmente en platos étnicos y de fusión, atendiendo a diversos paladares y preferencias culinarias. A medida que los consumidores exploran nuevos sabores y experiencias culinarias, la demanda de platos con infusión de pasas continúa aumentando.
El aumento de las aplicaciones de las pasas en la industria de alimentos y bebidas se ha convertido en un factor clave del crecimiento del mercado mundial de pasas. La versatilidad, la dulzura natural y los beneficios nutricionales de las pasas las han convertido en un ingrediente muy buscado en diversas categorías de alimentos, desde productos de panadería y confitería hasta bebidas y platos salados. A medida que aumenta la demanda de los consumidores de ingredientes más saludables y naturales, se espera que continúe la tendencia de utilizar pasas en fórmulas innovadoras de alimentos y bebidas, lo que impulsará aún más el crecimiento del mercado de pasas en todo el mundo.
Oportunidades
- Investigación y desarrollo en aumento y tecnologías innovadoras
El mercado mundial de las pasas de uva está experimentando importantes oportunidades de crecimiento e innovación, impulsadas principalmente por el aumento de los esfuerzos de investigación y desarrollo (I+D) y la adopción de tecnologías innovadoras. A medida que la demanda de snacks saludables y naturales sigue aumentando, las partes interesadas en la industria de las pasas de uva están invirtiendo en investigación, desarrollo de productos y tecnologías avanzadas para mejorar la eficiencia, la calidad y la diversificación de la producción. Las iniciativas de I+D se centran en el desarrollo de nuevas variedades de uva optimizadas para la producción de pasas de uva. Esto implica programas de mejoramiento que tienen como objetivo mejorar características como el sabor, el tamaño y el contenido de azúcar, que en última instancia afectan la calidad de las pasas de uva. Además, la investigación sobre prácticas agronómicas, incluidos los métodos de riego y el manejo de plagas, ayuda a maximizar los rendimientos de las uvas y mejorar la salud general de los cultivos, lo que conduce a pasas de uva de mayor calidad. Las tecnologías innovadoras de poscosecha desempeñan un papel crucial en la producción de pasas de uva.
Las técnicas avanzadas de secado, como el secado por infrarrojos, el secado por microondas y el secado al vacío, ayudan a preservar el sabor, el color y el contenido nutricional naturales de las uvas, lo que da como resultado pasas de uva de calidad superior. Estas tecnologías también contribuyen a reducir el consumo de energía y el tiempo de procesamiento, lo que hace que el proceso de producción sea más sostenible y rentable.
Por ejemplo,
- En septiembre de 2022, según un artículo de Eurofruit, los productores sudafricanos comenzaron a utilizar un procedimiento de secado con redes, en el que las uvas pasas se secan al sol en redes altas. La estrategia, según la asociación del sector, permite que el viento natural circule por la fruta mientras que el agua de lluvia se riega a través de la red para evitar daños. Las pasas se secan además en placas de piedra de 19 mm, lo que evita que el producto se destruya durante las fuertes lluvias.
Los crecientes esfuerzos de investigación y desarrollo y las tecnologías innovadoras en el mercado mundial de las pasas de uva presentan importantes oportunidades de crecimiento y avance. La mejora de los cultivos, las tecnologías poscosecha, la diversificación de productos, el envasado sostenible , el control de calidad, la automatización de procesos y las soluciones de trazabilidad contribuyen a la modernización y la sostenibilidad de la industria de las pasas de uva.
Restricciones/Desafíos
- Cambio climático y fluctuaciones meteorológicas
El cambio climático, impulsado por diversos factores antropogénicos, ha provocado alteraciones significativas en los patrones climáticos en todo el mundo. Los fenómenos meteorológicos extremos, el aumento de las temperaturas y las precipitaciones erráticas tienen un profundo impacto en la agricultura y la producción de alimentos, incluido el cultivo de pasas. Las uvas son la principal materia prima para la producción de pasas. El cambio climático ha alterado las regiones tradicionales de cultivo de uvas al alterar los patrones de temperatura y precipitación, lo que genera condiciones de cultivo impredecibles. Las olas de calor prolongadas, las heladas inesperadas y las lluvias irregulares pueden dañar las vides, reduciendo su rendimiento y calidad generales. Las fluctuaciones meteorológicas relacionadas con el cambio climático se han relacionado con la disminución de los rendimientos de los cultivos en las regiones de cultivo de uvas. Las altas temperaturas pueden causar estrés térmico en las vides, lo que afecta el desarrollo de la fruta y reduce la cosecha general de uvas.
Por ejemplo,
- En diciembre de 2022, según un artículo de investigación publicado en Frontiers, las tormentas, la sequía y las fuentes de agua inestables, junto con el calor extremo, no solo reducen el rendimiento de la vid a través de cambios en la fisiología, sino que también pueden tener un impacto directo en las uvas. Las quemaduras solares, el marchitamiento y el cambio en el equilibrio azúcar-sabor-aroma son más comunes, y los incendios forestales pueden generar un sabor a humo.
El cambio climático y las fluctuaciones meteorológicas suponen un gran desafío para el mercado mundial de las pasas. Los efectos adversos en el cultivo de la uva, la reducción del rendimiento de los cultivos y los problemas relacionados con los procesos de maduración alterados son factores que obstaculizan el crecimiento y la estabilidad del mercado de las pasas.
Impacto del COVID-19 en el mercado mundial de pasas
El COVID-19 ha afectado al mercado en cierta medida. Debido al confinamiento, el comercio de materias primas y pasas en todo el mundo se vio gravemente afectado por las medidas de cuarentena, lo que influyó en el mercado. Debido al cambio en muchos mandatos y regulaciones, los fabricantes pueden diseñar y lanzar nuevos productos al mercado, lo que ayudará al crecimiento del mercado.
Desarrollo reciente
- En mayo de 2021, según el artículo publicado por SOSLAND PUBLISHING COMPANY, Sun-Maid Growers of California está incorporando nuevas variedades de pasas con sabor a ponche tropical y melocotón a su línea de productos. Los productos se suman a una línea de snacks de pasas ácidas que también incluye sabores como frambuesa azul, fresa, frutos del bosque y sandía. La empresa afirma que están elaborados con pasas doradas, no tienen colorantes ni sabores artificiales y son una alternativa más saludable que sabe a caramelo. El Non-GMO Project ha certificado los productos como libres de gluten. Este tipo de expansión de la línea de productos ayudará a la empresa a ganar una nueva base de consumidores en el mercado.
Alcance del mercado mundial de pasas
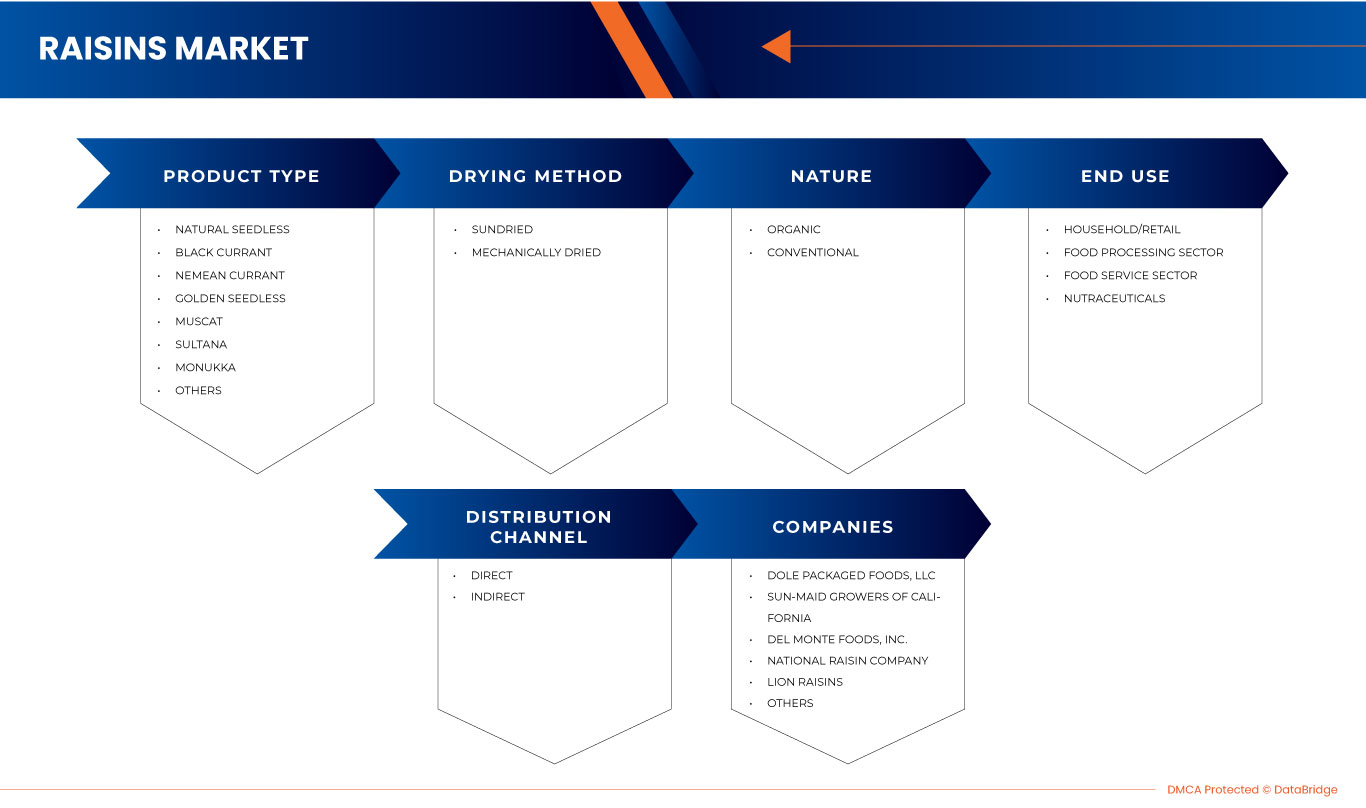
El mercado mundial de pasas se divide en cinco segmentos importantes, que se basan en el tipo de producto, el método de secado, la naturaleza, el usuario final y el canal de distribución. El crecimiento entre estos segmentos le ayudará a analizar los principales segmentos de crecimiento en las industrias y brindará a los usuarios una valiosa descripción general del mercado y conocimientos del mercado para tomar decisiones estratégicas para identificar las principales aplicaciones del mercado.
Tipo de producto
- Natural sin semillas
- Corriente negra
- Grosella de Nemea
- Dorado sin semillas
- Moscatel
- Sultana
- Monukka
- Otros
Según el tipo de producto, el mercado de pasas se segmenta en pasas naturales sin semillas, grosellas negras, grosellas de Nemea, grosellas doradas sin semillas, moscatel, pasas sultana, monukka y otras.
Método de secado
- Secado al sol
- Secado mecánicamente
Sobre la base del método de secado, el mercado de pasas se segmenta en secadas al sol y secadas mecánicamente.
Naturaleza
- Orgánico
- Convencional
En función de la naturaleza, el mercado de pasas se segmenta en orgánico y convencional.
Usuario final
- Hogar/venta al por menor
- Sector de procesamiento de alimentos
- Sector de servicios de alimentación
- Nutracéuticos
- Otros
Sobre la base del usuario final, el mercado de pasas se segmenta en hogares/venta minorista, sector de procesamiento de alimentos, sector de servicios de alimentos, nutracéuticos y otros.
Canal de distribución
- Directo
- Indirecto
Sobre la base del canal de distribución, el mercado de pasas se segmenta en directo e indirecto.
Análisis y perspectivas regionales del mercado mundial de pasas
Se analiza el mercado global de pasas y se proporcionan información y tendencias del tamaño del mercado según lo mencionado anteriormente.
Los países cubiertos en el informe del mercado global de pasas son EE. UU., Canadá, México, Alemania, Francia, Reino Unido, Italia, España, Rusia, Turquía, Bélgica, Países Bajos, Suiza y el resto de Europa, Japón, China, Corea del Sur, India, Australia, Singapur, Nueva Zelanda, Malasia, Indonesia, Filipinas y el resto de Asia-Pacífico, Brasil, Argentina y el resto de América del Sur, Sudáfrica, Arabia Saudita, Emiratos Árabes Unidos, Egipto, Israel y el resto de Medio Oriente y África.
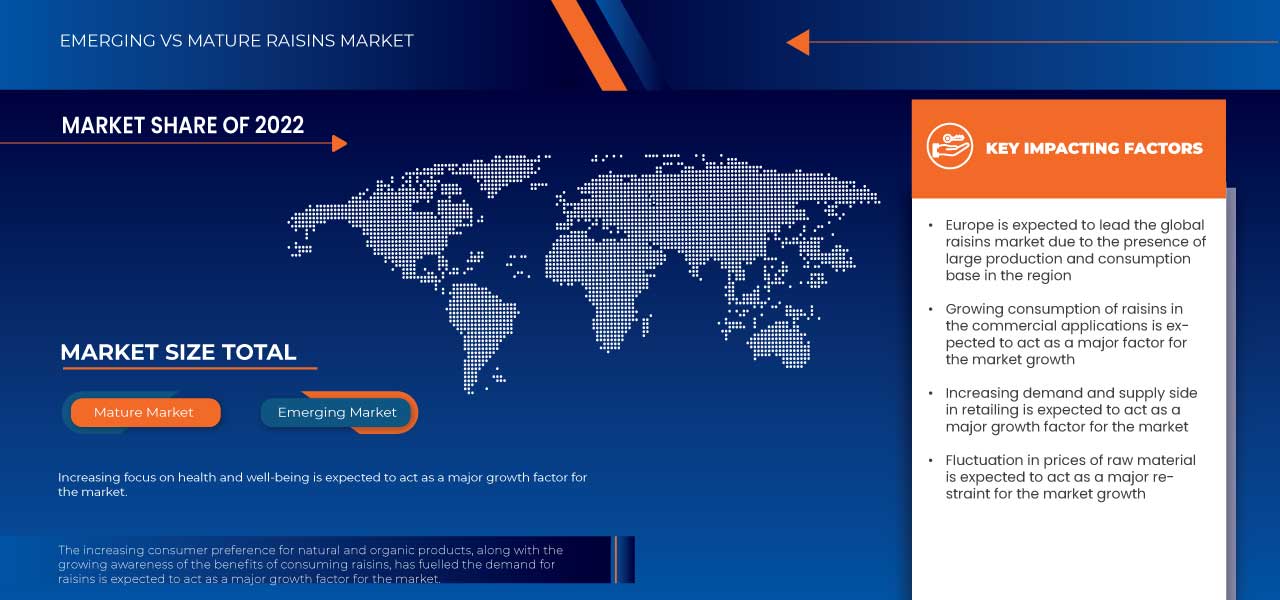
Se espera que Europa domine el mercado mundial de pasas en términos de participación de mercado e ingresos de mercado. Se estima que mantendrá su dominio durante el período de pronóstico debido al aumento creciente de las pasas en varias industrias y la creciente demanda de los consumidores finales.
La sección de regiones del informe también proporciona factores individuales que impactan en el mercado y cambios en las regulaciones del mercado que afectan las tendencias actuales y futuras del mercado. Los puntos de datos, como las ventas nuevas y de reemplazo, la demografía del país, la epidemiología de las enfermedades y los aranceles de importación y exportación, son algunos de los principales indicadores utilizados para pronosticar el escenario del mercado para países individuales. Además, la presencia y disponibilidad de marcas globales y sus desafíos enfrentados debido a la alta competencia de las marcas locales y nacionales, y el impacto de los canales de venta se consideran al proporcionar un análisis de pronóstico de los datos del país.
Análisis del panorama competitivo y de la cuota de mercado mundial de las pasas
El panorama competitivo del mercado global de pasas proporciona detalles sobre los competidores. Los detalles incluyen una descripción general de la empresa, las finanzas de la empresa, los ingresos generados, el potencial de mercado, la inversión en investigación y desarrollo, las nuevas iniciativas de mercado, la presencia global, los sitios e instalaciones de producción, las capacidades de producción, las fortalezas y debilidades de la empresa, el lanzamiento del producto, la amplitud y la variedad del producto y el dominio de la aplicación. Los puntos de datos anteriores solo están relacionados con el enfoque de las empresas en el mercado global de pasas.
Algunos de los principales actores que operan en el mercado de pasas son Arimex, Del Monte Foods, Inc., Dole Packaged Foods, LLC, NationalRaisin Company, Sun-Maid Growers of California, Akrodria, Montagu Snacks, Gauri Farm, Geobres, ROYAL NUT COMPANY, Fruits of Turkey, SUNBEAM FOOD, Lion Raisins, Traina Home Grown, Bergin.com, SUN VALLEY RAISINS, River Ranch Raisins, VARSHA INDUSTRIES PVT. LTD., Royal Nuts, Dryfruits & Spices y arav Agro Industries, entre otros.
SKU-
Obtenga acceso en línea al informe sobre la primera nube de inteligencia de mercado del mundo

- Panel de análisis de datos interactivo
- Panel de análisis de empresas para oportunidades con alto potencial de crecimiento
- Acceso de analista de investigación para personalización y consultas
- Análisis de la competencia con panel interactivo
- Últimas noticias, actualizaciones y análisis de tendencias
- Aproveche el poder del análisis de referencia para un seguimiento integral de la competencia
Tabla de contenido
1 INTRODUCTION
1.1 OBJECTIVES OF THE STUDY
1.2 MARKET DEFINITION
1.3 OVERVIEW OF GLOBAL RAISINS MARKET
1.4 LIMITATIONS
1.5 MARKETS COVERED
2 MARKET SEGMENTATION
2.1 MARKETS COVERED
2.2 GEOGRAPHICAL SCOPE
2.3 YEARS CONSIDERED FOR THE STUDY
2.4 CURRENCY AND PRICING
2.5 DBMR TRIPOD DATA VALIDATION MODEL
2.6 PRODUCT TYPE LIFE LINE CURVE
2.7 MULTIVARIATE MODELLING
2.8 PRIMARY INTERVIEWS WITH KEY OPINION LEADERS
2.9 DBMR MARKET POSITION GRID
2.1 MARKET END USE COVERAGE GRID
2.11 VENDOR SHARE ANALYSIS
2.12 SECONDARY SOURCES
2.13 ASSUMPTIONS
3 EXECUTIVE SUMMARY
4 PREMIUM INSIGHTS
4.1 BRAND COMPARATIVE ANALYSIS
4.2 CONSUMER DISPOSABLE INCOME
4.2.1 OVERVIEW
4.2.2 CULTURAL FACTORS
4.2.3 SOCIAL FACTORS
4.2.4 PERSONAL FACTORS
4.2.5 PSYCHOLOGICAL FACTORS
4.2.6 ECONOMIC FACTORS
4.2.7 CONCLUSION
4.3 CONSUMER LEVEL TRENDS
4.4 FACTORS INFLUENCING PURCHASING DECISION OF CUSTOMERS
4.4.1 ORGANIC AND NATURAL
4.4.2 PRODUCT PRICING
4.4.3 MARKETING CAMPAIGNS
4.4.4 ECONOMIC CONDITIONS
4.4.5 AUTHENTICITY OF PRODUCTS
4.4.6 NUTRITIONAL CONTENT
4.5 IMPACT OF ECONOMIC SLOWDOWN ON THE MARKET
4.5.1 IMPACT ON PRICE
4.5.2 IMPACT ON SUPPLY CHAIN
4.5.3 IMPACT ON SHIPMENT
4.5.4 IMPACT ON COMPANY’S STRATEGIC DECISIONS
4.6 INDUSTRY TRENDS AND FUTURE PERSPECTIVE
4.6.1 RISING DEMAND FOR ORGANIC AND NATURAL PRODUCTS
4.6.2 INCREASING USE OF RAISINS IN CONFECTIONERY FOOD ITEMS
4.6.3 RISING USE OF AUTOMATION AND TECHNOLOGY IN RAISIN PRODUCTION
4.7 IMPORT-EXPORT ANALYSIS
4.8 MEETING CONSUMER REQUIREMENT
4.9 NEW PRODUCT LAUNCH STRATEGY
4.1 PRICE ANALYSIS
4.11 PRIVATE LABEL VS BRAND LABEL
4.11.1 BRAND LABEL
4.11.2 PRIVATE LABEL
4.12 PROMOTIONAL ACTIVITIES
4.13 SHOPPING BEHAVIOR AND DYNAMICS
4.13.1 RECOMMENDATIONS FROM FAMILY AND FRIENDS
4.13.2 RESEARCH
4.13.3 IMPULSIVE
4.13.4 ADVERTISEMENT
4.14 SUPPLY CHAIN ANALYSIS
4.14.1 CULTIVATION & RAW MATERIAL PROCUREMENT
4.14.2 PROCESSING AND PACKAGING
4.14.3 DISTRIBUTION
4.14.4 END-USERS
5 REGULATORY FRAMEWORK AND GUIDELINES
6 MARKET OVERVIEW
6.1 DRIVERS
6.1.1 INCREASING HEALTH AWARENESS REGARDING HEALTH BENEFITS OF RAISINS AMONG CONSUMERS
6.1.2 RISING APPLICATION OF RAISINS IN THE FOOD AND BEVERAGE INDUSTRY
6.1.3 RISING DEMAND FOR RAISINS OWING TO INCLINATION TOWARDS SHELF-STABLE FOOD
6.2 RESTRAINTS
6.2.1 CLIMATE CHANGE AND WEATHER FLUCTUATIONS
6.2.2 AVAILABILITY OF SUBSTITUTE PRODUCTS
6.2.3 FLUCTUATION IN PRICES OF GRAPES
6.3 OPPORTUNITIES
6.3.1 RISING RESEARCH & DEVELOPMENT AND INNOVATIVE TECHNOLOGIES
6.3.2 RISING TREND OF ON-THE-GO HEALTHY SNACKING
6.4 CHALLENGES
6.4.1 HIGH SUSCEPTIBILITY TO PEST AND DISEASES
6.4.2 STRINGENT FOOD SAFETY REGULATIONS AND QUALITY STANDARDS
7 GLOBAL RAISINS MARKET, BY REGION
7.1 OVERVIEW
7.2 EUROPE
7.2.1 U.K.
7.2.2 TURKEY
7.2.3 GERMANY
7.2.4 NETHERLANDS
7.2.5 FRANCE
7.2.6 ITALY
7.2.7 POLAND
7.2.8 SPAIN
7.2.9 RUSSIA
7.2.10 BELGIUM
7.2.11 SWEDEN
7.2.12 SWITZERLAND
7.2.13 DENMARK
7.2.14 REST OF EUROPE
7.3 ASIA-PACIFIC
7.3.1 CHINA
7.3.2 INDIA
7.3.3 JAPAN
7.3.4 AUSTRALIA
7.3.5 INDONESIA
7.3.6 SOUTH KOREA
7.3.7 THAILAND
7.3.8 PHILIPPINES
7.3.9 VIETNAM
7.3.10 NEW ZEALAND
7.3.11 MALAYSIA
7.3.12 SINGAPORE
7.3.13 REST OF ASIA-PACIFIC
7.4 NORTH AMERICA
7.4.1 U.S.
7.4.2 CANADA
7.4.3 MEXICO
7.5 MIDDLE EAST AND AFRICA
7.5.1 SOUTH AFRICA
7.5.2 SAUDI ARABIA
7.5.3 UAE
7.5.4 KUWAIT
7.5.5 OMAN
7.5.6 QATAR
7.5.7 REST OF MIDDLE EAST AND AFRICA
7.6 SOUTH AMERICA
7.6.1 BRAZIL
7.6.2 ARGENTINA
7.6.3 REST OF SOUTH AMERICA
8 COMPANY LANDSCAPE
8.1 COMPANY SHARE ANALYSIS: GLOBAL
8.2 COMPANY SHARE ANALYSIS: NORTH AMERICA
8.3 COMPANY SHARE ANALYSIS: EUROPE
8.4 COMPANY SHARE ANALYSIS: ASIA-PACIFIC
9 SWOT ANALYSIS
10 COMPANY PROFILES
10.1 DOLE PLC (2022)
10.1.1 COMPANY SNAPSHOT
10.1.2 REVENUE ANALYSIS
10.1.3 COMPANY SHARE ANALYSIS
10.1.4 PRODUCT PORTFOLIO
10.1.5 RECENT DEVELOPMENT
10.2 SUN-MAID GROWERS OF CALIFORNIA
10.2.1 COMPANY SNAPSHOT
10.2.2 COMPANY SHARE ANALYSIS
10.2.3 PRODUCT PORTFOLIO
10.2.4 RECENT DEVELOPMENT
10.3 DEL MONTE FOODS, INC (2022)
10.3.1 COMPANY SNAPSHOT
10.3.2 REVENUE ANALYSIS
10.3.3 COMPANY SHARE ANALYSIS
10.3.4 PRODUCT PORTFOLIO
10.3.5 RECENT DEVELOPMENT
10.4 NATIONALRAISIN COMPANY
10.4.1 COMPANY SNAPSHOT
10.4.2 COMPANY SHARE ANALYSIS
10.4.3 PRODUCT PORTFOLIO
10.4.4 RECENT DEVELOPMENT
10.5 LION RAISINS
10.5.1 COMPANY SNAPSHOT
10.5.2 COMPANY SHARE ANALYSIS
10.5.3 PRODUCT PORTFOLIO
10.5.4 RECENT DEVELOPMENT
10.6 AARAV AGRO INDUSTRIES
10.6.1 COMPANY SNAPSHOT
10.6.2 PRODUCT PORTFOLIO
10.6.3 RECENT DEVELOPMENT
10.7 AKRODRIA
10.7.1 COMPANY SNAPSHOT
10.7.2 PRODUCT PORTFOLIO
10.7.3 RECENT DEVELOPMENT
10.8 ARIMEX
10.8.1 COMPANY SNAPSHOT
10.8.2 PRODUCT PORTFOLIO
10.8.3 RECENT DEVELOPMENT
10.9 BERGIN.COM
10.9.1 COMPANY SNAPSHOT
10.9.2 PRODUCT PORTFOLIO
10.9.3 RECENT DEVELOPMENT
10.1 FRUITS OF TURKEY
10.10.1 COMPANY SNAPSHOT
10.10.2 PRODUCT PORTFOLIO
10.10.3 RECENT DEVELOPMENT
10.11 GAURI FARM
10.11.1 COMPANY SNAPSHOT
10.11.2 PRODUCT PORTFOLIO
10.11.3 RECENT DEVELOPMENTS
10.12 GEOBRES
10.12.1 COMPANY SNAPSHOT
10.12.2 PRODUCT PORTFOLIO
10.12.3 RECENT DEVELOPMENT
10.13 MONTAGU SNACKS
10.13.1 COMPANY SNAPSHOT
10.13.2 PRODUCT PORTFOLIO
10.13.3 RECENT DEVELOPMENT
10.14 RIVER RANCH RAISINS
10.14.1 COMPANY SNAPSHOT
10.14.2 PRODUCT PORTFOLIO
10.14.3 RECENT DEVELOPMENT
10.15 ROYAL NUT COMPANY
10.15.1 COMPANY SNAPSHOT
10.15.2 PRODUCT PORTFOLIO
10.15.3 RECENT DEVELOPMENT
10.16 ROYAL NUTS, DRYFRUITS & SPICES
10.16.1 COMPANY SNAPSHOT
10.16.2 PRODUCT PORTFOLIO
10.16.3 RECENT DEVELOPMENT
10.17 SUN VALLEY RAISINS
10.17.1 COMPANY SNAPSHOT
10.17.2 PRODUCT PORTFOLIO
10.17.3 RECENT DEVELOPMENT
10.18 SUNBEAM FOODS
10.18.1 COMPANY SNAPSHOT
10.18.2 PRODUCT PORTFOLIO
10.18.3 RECENT DEVELOPMENT
10.19 TRAINA HOME GROWN
10.19.1 COMPANY SNAPSHOT
10.19.2 PRODUCT PORTFOLIO
10.19.3 RECENT DEVELOPMENT
10.2 VARSHA INDUSTRIES PVT. LTD.
10.20.1 COMPANY SNAPSHOT
10.20.2 PRODUCT PORTFOLIO
10.20.3 RECENT DEVELOPMENT
11 QUESTIONNAIRE
12 RELATED REPORTS
Lista de Tablas
TABLE 1 IMPORT DATA OF WORLD AND TOP 10 COUNTRIES (2022) FOR " DRIED GRAPES "; HS CODE OF PRODUCT: 080620
TABLE 2 IMPORT DATA OF WORLD AND TOP 10 COUNTRIES (2022) FOR " DRIED GRAPES "; HS CODE OF PRODUCT: 080620
TABLE 3 EXPORT DATA OF WORLD AND TOP 10 COUNTRIES (2022) FOR " DRIED GRAPES "; HS CODE OF PRODUCT: 080620
TABLE 4 EXPORT DATA OF WORLD AND TOP 10 COUNTRIES (2022) FOR " DRIED GRAPES "; HS CODE OF PRODUCT: 080620
TABLE 5 PRICE ANALYSIS FOR GLOBAL RAISINS MARKET (USD/KG)
TABLE 6 GLOBAL RAISINS MARKET, BY REGION, 2021-2030 (USD MILLION)
TABLE 7 GLOBAL RAISINS MARKET, BY PRODUCT TYPE, 2021-2030 (USD MILLION)
TABLE 8 GLOBAL RAISINS MARKET, BY DRYING METHOD, 2021-2030 (USD MILLION)
TABLE 9 GLOBAL RAISINS MARKET, BY NATURE, 2021-2030 (USD MILLION)
TABLE 10 GLOBAL RAISINS MARKET, BY END USE, 2021-2030 (USD MILLION)
TABLE 11 GLOBAL HOUSEHOLD/RETAIL IN RAISINS MARKET, BY PRODUCT TYPE, 2021-2030 (USD MILLION)
TABLE 12 GLOBAL FOOD PROCESSING SECTOR IN RAISINS MARKET, BY APPLICATION, 2021-2030 (USD MILLION)
TABLE 13 GLOBAL BAKERY PRODUCTS IN RAISINS MARKET, BY TYPE, 2021-2030 (USD MILLION)
TABLE 14 GLOBAL CONFECTIONARY IN RAISINS MARKET, BY TYPE, 2021-2030 (USD MILLION)
TABLE 15 GLOBAL SPORTS NUTRITION IN RAISINS MARKET, BY TYPE, 2021-2030 (USD MILLION)
TABLE 16 GLOBAL DAIRY PRODUCTS IN RAISINS MARKET, BY TYPE, 2021-2030 (USD MILLION)
TABLE 17 GLOBAL BEVERAGES IN RAISINS MARKET, BY TYPE, 2021-2030 (USD MILLION)
TABLE 18 GLOBAL FOOD PROCESSING SECTOR IN RAISINS MARKET, BY PRODUCT TYPE, 2021-2030 (USD MILLION)
TABLE 19 GLOBAL FOOD SERVICE SECTOR IN RAISINS MARKET, BY APPLICATION, 2021-2030 (USD MILLION)
TABLE 20 GLOBAL FOOD SERVICE SECTOR IN RAISINS MARKET, BY PRODUCT TYPE, 2021-2030 (USD MILLION)
TABLE 21 GLOBAL NUTRACEUTICALS IN RAISINS MARKET, BY PRODUCT TYPE, 2021-2030 (USD MILLION)
TABLE 22 GLOBAL RAISINS MARKET, BY DISTRIBUTION CHANNEL, 2021-2030 (USD MILLION)
TABLE 23 GLOBAL INDIRECT IN RAISINS MARKET, BY DISTRIBUTION CHANNEL, 2021-2030 (USD MILLION)
TABLE 24 GLOBAL STORE BASED IN RAISINS MARKET, BY DISTRIBUTION CHANNEL, 2021-2030 (USD MILLION)
TABLE 25 GLOBAL NON-STORE BASED IN RAISINS MARKET, BY DISTRIBUTION CHANNEL, 2021-2030 (USD MILLION)
TABLE 26 EUROPE RAISINS MARKET, BY COUNTRY, 2021-2030 (USD MILLION)
TABLE 27 EUROPE RAISINS MARKET, BY PRODUCT TYPE, 2021-2030 (USD MILLION)
TABLE 28 EUROPE RAISINS MARKET, BY DRYING METHOD, 2021-2030 (USD MILLION)
TABLE 29 EUROPE RAISINS MARKET, BY NATURE, 2021-2030 (USD MILLION)
TABLE 30 EUROPE RAISINS MARKET, BY END USE, 2021-2030 (USD MILLION)
TABLE 31 EUROPE HOUSEHOLD/RETAIL IN RAISINS MARKET, BY PRODUCT TYPE, 2021-2030 (USD MILLION)
TABLE 32 EUROPE FOOD PROCESSING SECTOR IN RAISINS MARKET, BY APPLICATION, 2021-2030 (USD MILLION)
TABLE 33 EUROPE BAKERY PRODUCTS IN RAISINS MARKET, BY TYPE, 2021-2030 (USD MILLION)
TABLE 34 EUROPE CONFECTIONARY IN RAISINS MARKET, BY TYPE, 2021-2030 (USD MILLION)
TABLE 35 EUROPE SPORTS NUTRITION IN RAISINS MARKET, BY TYPE, 2021-2030 (USD MILLION)
TABLE 36 EUROPE DAIRY PRODUCTS IN RAISINS MARKET, BY TYPE, 2021-2030 (USD MILLION)
TABLE 37 EUROPE BEVERAGES IN RAISINS MARKET, BY TYPE, 2021-2030 (USD MILLION)
TABLE 38 EUROPE FOOD PROCESSING SECTOR IN RAISINS MARKET, BY PRODUCT TYPE, 2021-2030 (USD MILLION)
TABLE 39 EUROPE FOOD SERVICE SECTOR IN RAISINS MARKET, BY APPLICATION, 2021-2030 (USD MILLION)
TABLE 40 EUROPE FOOD SERVICE SECTOR IN RAISINS MARKET, BY PRODUCT TYPE, 2021-2030 (USD MILLION)
TABLE 41 EUROPE NUTRACEUTICALS IN RAISINS MARKET, BY PRODUCT TYPE, 2021-2030 (USD MILLION)
TABLE 42 EUROPE RAISINS MARKET, BY DISTRIBUTION CHANNEL, 2021-2030 (USD MILLION)
TABLE 43 EUROPE INDIRECT IN RAISINS MARKET, BY DISTRIBUTION CHANNEL, 2021-2030 (USD MILLION)
TABLE 44 EUROPE STORE BASED IN RAISINS MARKET, BY DISTRIBUTION CHANNEL, 2021-2030 (USD MILLION)
TABLE 45 EUROPE NON-STORE BASED IN RAISINS MARKET, BY DISTRIBUTION CHANNEL, 2021-2030 (USD MILLION)
TABLE 46 U.K. RAISINS MARKET, BY PRODUCT TYPE, 2021-2030 (USD MILLION)
TABLE 47 U.K. RAISINS MARKET, BY DRYING METHOD, 2021-2030 (USD MILLION)
TABLE 48 U.K. RAISINS MARKET, BY NATURE, 2021-2030 (USD MILLION)
TABLE 49 U.K. RAISINS MARKET, BY END USE, 2021-2030 (USD MILLION)
TABLE 50 U.K. HOUSEHOLD/RETAIL IN RAISINS MARKET, BY PRODUCT TYPE, 2021-2030 (USD MILLION)
TABLE 51 U.K. FOOD PROCESSING SECTOR IN RAISINS MARKET, BY APPLICATION, 2021-2030 (USD MILLION)
TABLE 52 U.K. BAKERY PRODUCTS IN RAISINS MARKET, BY TYPE, 2021-2030 (USD MILLION)
TABLE 53 U.K. CONFECTIONARY IN RAISINS MARKET, BY TYPE, 2021-2030 (USD MILLION)
TABLE 54 U.K. SPORTS NUTRITION IN RAISINS MARKET, BY TYPE, 2021-2030 (USD MILLION)
TABLE 55 U.K. DAIRY PRODUCTS IN RAISINS MARKET, BY TYPE, 2021-2030 (USD MILLION)
TABLE 56 U.K. BEVERAGES IN RAISINS MARKET, BY TYPE, 2021-2030 (USD MILLION)
TABLE 57 U.K. FOOD PROCESSING SECTOR IN RAISINS MARKET, BY PRODUCT TYPE, 2021-2030 (USD MILLION)
TABLE 58 U.K. FOOD SERVICE SECTOR IN RAISINS MARKET, BY APPLICATION, 2021-2030 (USD MILLION)
TABLE 59 U.K. FOOD SERVICE SECTOR IN RAISINS MARKET, BY PRODUCT TYPE, 2021-2030 (USD MILLION)
TABLE 60 U.K. NUTRACEUTICALS IN RAISINS MARKET, BY PRODUCT TYPE, 2021-2030 (USD MILLION)
TABLE 61 U.K. RAISINS MARKET, BY DISTRIBUTION CHANNEL, 2021-2030 (USD MILLION)
TABLE 62 U.K. INDIRECT IN RAISINS MARKET, BY DISTRIBUTION CHANNEL, 2021-2030 (USD MILLION)
TABLE 63 U.K. STORE BASED IN RAISINS MARKET, BY DISTRIBUTION CHANNEL, 2021-2030 (USD MILLION)
TABLE 64 U.K. NON-STORE BASED IN RAISINS MARKET, BY DISTRIBUTION CHANNEL, 2021-2030 (USD MILLION)
TABLE 65 TURKEY RAISINS MARKET, BY PRODUCT TYPE, 2021-2030 (USD MILLION)
TABLE 66 TURKEY RAISINS MARKET, BY DRYING METHOD, 2021-2030 (USD MILLION)
TABLE 67 TURKEY RAISINS MARKET, BY NATURE, 2021-2030 (USD MILLION)
TABLE 68 TURKEY RAISINS MARKET, BY END USE, 2021-2030 (USD MILLION)
TABLE 69 TURKEY HOUSEHOLD/RETAIL IN RAISINS MARKET, BY PRODUCT TYPE, 2021-2030 (USD MILLION)
TABLE 70 TURKEY FOOD PROCESSING SECTOR IN RAISINS MARKET, BY APPLICATION, 2021-2030 (USD MILLION)
TABLE 71 TURKEY BAKERY PRODUCTS IN RAISINS MARKET, BY TYPE, 2021-2030 (USD MILLION)
TABLE 72 TURKEY CONFECTIONARY IN RAISINS MARKET, BY TYPE, 2021-2030 (USD MILLION)
TABLE 73 TURKEY SPORTS NUTRITION IN RAISINS MARKET, BY TYPE, 2021-2030 (USD MILLION)
TABLE 74 TURKEY DAIRY PRODUCTS IN RAISINS MARKET, BY TYPE, 2021-2030 (USD MILLION)
TABLE 75 TURKEY BEVERAGES IN RAISINS MARKET, BY TYPE, 2021-2030 (USD MILLION)
TABLE 76 TURKEY FOOD PROCESSING SECTOR IN RAISINS MARKET, BY PRODUCT TYPE, 2021-2030 (USD MILLION)
TABLE 77 TURKEY FOOD SERVICE SECTOR IN RAISINS MARKET, BY APPLICATION, 2021-2030 (USD MILLION)
TABLE 78 TURKEY FOOD SERVICE SECTOR IN RAISINS MARKET, BY PRODUCT TYPE, 2021-2030 (USD MILLION)
TABLE 79 TURKEY NUTRACEUTICALS IN RAISINS MARKET, BY PRODUCT TYPE, 2021-2030 (USD MILLION)
TABLE 80 TURKEY RAISINS MARKET, BY DISTRIBUTION CHANNEL, 2021-2030 (USD MILLION)
TABLE 81 TURKEY INDIRECT IN RAISINS MARKET, BY DISTRIBUTION CHANNEL, 2021-2030 (USD MILLION)
TABLE 82 TURKEY STORE BASED IN RAISINS MARKET, BY DISTRIBUTION CHANNEL, 2021-2030 (USD MILLION)
TABLE 83 TURKEY NON-STORE BASED IN RAISINS MARKET, BY DISTRIBUTION CHANNEL, 2021-2030 (USD MILLION)
TABLE 84 GERMANY RAISINS MARKET, BY PRODUCT TYPE, 2021-2030 (USD MILLION)
TABLE 85 GERMANY RAISINS MARKET, BY DRYING METHOD, 2021-2030 (USD MILLION)
TABLE 86 GERMANY RAISINS MARKET, BY NATURE, 2021-2030 (USD MILLION)
TABLE 87 GERMANY RAISINS MARKET, BY END USE, 2021-2030 (USD MILLION)
TABLE 88 GERMANY HOUSEHOLD/RETAIL IN RAISINS MARKET, BY PRODUCT TYPE, 2021-2030 (USD MILLION)
TABLE 89 GERMANY FOOD PROCESSING SECTOR IN RAISINS MARKET, BY APPLICATION, 2021-2030 (USD MILLION)
TABLE 90 GERMANY BAKERY PRODUCTS IN RAISINS MARKET, BY TYPE, 2021-2030 (USD MILLION)
TABLE 91 GERMANY CONFECTIONARY IN RAISINS MARKET, BY TYPE, 2021-2030 (USD MILLION)
TABLE 92 GERMANY SPORTS NUTRITION IN RAISINS MARKET, BY TYPE, 2021-2030 (USD MILLION)
TABLE 93 GERMANY DAIRY PRODUCTS IN RAISINS MARKET, BY TYPE, 2021-2030 (USD MILLION)
TABLE 94 GERMANY BEVERAGES IN RAISINS MARKET, BY TYPE, 2021-2030 (USD MILLION)
TABLE 95 GERMANY FOOD PROCESSING SECTOR IN RAISINS MARKET, BY PRODUCT TYPE, 2021-2030 (USD MILLION)
TABLE 96 GERMANY FOOD SERVICE SECTOR IN RAISINS MARKET, BY APPLICATION, 2021-2030 (USD MILLION)
TABLE 97 GERMANY FOOD SERVICE SECTOR IN RAISINS MARKET, BY PRODUCT TYPE, 2021-2030 (USD MILLION)
TABLE 98 GERMANY NUTRACEUTICALS IN RAISINS MARKET, BY PRODUCT TYPE, 2021-2030 (USD MILLION)
TABLE 99 GERMANY RAISINS MARKET, BY DISTRIBUTION CHANNEL, 2021-2030 (USD MILLION)
TABLE 100 GERMANY INDIRECT IN RAISINS MARKET, BY DISTRIBUTION CHANNEL, 2021-2030 (USD MILLION)
TABLE 101 GERMANY STORE BASED IN RAISINS MARKET, BY DISTRIBUTION CHANNEL, 2021-2030 (USD MILLION)
TABLE 102 GERMANY NON-STORE BASED IN RAISINS MARKET, BY DISTRIBUTION CHANNEL, 2021-2030 (USD MILLION)
TABLE 103 NETHERLANDS RAISINS MARKET, BY PRODUCT TYPE, 2021-2030 (USD MILLION)
TABLE 104 NETHERLANDS RAISINS MARKET, BY DRYING METHOD, 2021-2030 (USD MILLION)
TABLE 105 NETHERLANDS RAISINS MARKET, BY NATURE, 2021-2030 (USD MILLION)
TABLE 106 NETHERLANDS RAISINS MARKET, BY END USE, 2021-2030 (USD MILLION)
TABLE 107 NETHERLANDS HOUSEHOLD/RETAIL IN RAISINS MARKET, BY PRODUCT TYPE, 2021-2030 (USD MILLION)
TABLE 108 NETHERLANDS FOOD PROCESSING SECTOR IN RAISINS MARKET, BY APPLICATION, 2021-2030 (USD MILLION)
TABLE 109 NETHERLANDS BAKERY PRODUCTS IN RAISINS MARKET, BY TYPE, 2021-2030 (USD MILLION)
TABLE 110 NETHERLANDS CONFECTIONARY IN RAISINS MARKET, BY TYPE, 2021-2030 (USD MILLION)
TABLE 111 NETHERLANDS SPORTS NUTRITION IN RAISINS MARKET, BY TYPE, 2021-2030 (USD MILLION)
TABLE 112 NETHERLANDS DAIRY PRODUCTS IN RAISINS MARKET, BY TYPE, 2021-2030 (USD MILLION)
TABLE 113 NETHERLANDS BEVERAGES IN RAISINS MARKET, BY TYPE, 2021-2030 (USD MILLION)
TABLE 114 NETHERLANDS FOOD PROCESSING SECTOR IN RAISINS MARKET, BY PRODUCT TYPE, 2021-2030 (USD MILLION)
TABLE 115 NETHERLANDS FOOD SERVICE SECTOR IN RAISINS MARKET, BY APPLICATION, 2021-2030 (USD MILLION)
TABLE 116 NETHERLANDS FOOD SERVICE SECTOR IN RAISINS MARKET, BY PRODUCT TYPE, 2021-2030 (USD MILLION)
TABLE 117 NETHERLANDS NUTRACEUTICALS IN RAISINS MARKET, BY PRODUCT TYPE, 2021-2030 (USD MILLION)
TABLE 118 NETHERLANDS RAISINS MARKET, BY DISTRIBUTION CHANNEL, 2021-2030 (USD MILLION)
TABLE 119 NETHERLANDS INDIRECT IN RAISINS MARKET, BY DISTRIBUTION CHANNEL, 2021-2030 (USD MILLION)
TABLE 120 NETHERLANDS STORE BASED IN RAISINS MARKET, BY DISTRIBUTION CHANNEL, 2021-2030 (USD MILLION)
TABLE 121 NETHERLANDS NON-STORE BASED IN RAISINS MARKET, BY DISTRIBUTION CHANNEL, 2021-2030 (USD MILLION)
TABLE 122 FRANCE RAISINS MARKET, BY PRODUCT TYPE, 2021-2030 (USD MILLION)
TABLE 123 FRANCE RAISINS MARKET, BY DRYING METHOD, 2021-2030 (USD MILLION)
TABLE 124 FRANCE RAISINS MARKET, BY NATURE, 2021-2030 (USD MILLION)
TABLE 125 FRANCE RAISINS MARKET, BY END USE, 2021-2030 (USD MILLION)
TABLE 126 FRANCE HOUSEHOLD/RETAIL IN RAISINS MARKET, BY PRODUCT TYPE, 2021-2030 (USD MILLION)
TABLE 127 FRANCE FOOD PROCESSING SECTOR IN RAISINS MARKET, BY APPLICATION, 2021-2030 (USD MILLION)
TABLE 128 FRANCE BAKERY PRODUCTS IN RAISINS MARKET, BY TYPE, 2021-2030 (USD MILLION)
TABLE 129 FRANCE CONFECTIONARY IN RAISINS MARKET, BY TYPE, 2021-2030 (USD MILLION)
TABLE 130 FRANCE SPORTS NUTRITION IN RAISINS MARKET, BY TYPE, 2021-2030 (USD MILLION)
TABLE 131 FRANCE DAIRY PRODUCTS IN RAISINS MARKET, BY TYPE, 2021-2030 (USD MILLION)
TABLE 132 FRANCE BEVERAGES IN RAISINS MARKET, BY TYPE, 2021-2030 (USD MILLION)
TABLE 133 FRANCE FOOD PROCESSING SECTOR IN RAISINS MARKET, BY PRODUCT TYPE, 2021-2030 (USD MILLION)
TABLE 134 FRANCE FOOD SERVICE SECTOR IN RAISINS MARKET, BY APPLICATION, 2021-2030 (USD MILLION)
TABLE 135 FRANCE FOOD SERVICE SECTOR IN RAISINS MARKET, BY PRODUCT TYPE, 2021-2030 (USD MILLION)
TABLE 136 FRANCE NUTRACEUTICALS IN RAISINS MARKET, BY PRODUCT TYPE, 2021-2030 (USD MILLION)
TABLE 137 FRANCE RAISINS MARKET, BY DISTRIBUTION CHANNEL, 2021-2030 (USD MILLION)
TABLE 138 FRANCE INDIRECT IN RAISINS MARKET, BY DISTRIBUTION CHANNEL, 2021-2030 (USD MILLION)
TABLE 139 FRANCE STORE BASED IN RAISINS MARKET, BY DISTRIBUTION CHANNEL, 2021-2030 (USD MILLION)
TABLE 140 FRANCE NON-STORE BASED IN RAISINS MARKET, BY DISTRIBUTION CHANNEL, 2021-2030 (USD MILLION)
TABLE 141 ITALY RAISINS MARKET, BY PRODUCT TYPE, 2021-2030 (USD MILLION)
TABLE 142 ITALY RAISINS MARKET, BY DRYING METHOD, 2021-2030 (USD MILLION)
TABLE 143 ITALY RAISINS MARKET, BY NATURE, 2021-2030 (USD MILLION)
TABLE 144 ITALY RAISINS MARKET, BY END USE, 2021-2030 (USD MILLION)
TABLE 145 ITALY HOUSEHOLD/RETAIL IN RAISINS MARKET, BY PRODUCT TYPE, 2021-2030 (USD MILLION)
TABLE 146 ITALY FOOD PROCESSING SECTOR IN RAISINS MARKET, BY APPLICATION, 2021-2030 (USD MILLION)
TABLE 147 ITALY BAKERY PRODUCTS IN RAISINS MARKET, BY TYPE, 2021-2030 (USD MILLION)
TABLE 148 ITALY CONFECTIONARY IN RAISINS MARKET, BY TYPE, 2021-2030 (USD MILLION)
TABLE 149 ITALY SPORTS NUTRITION IN RAISINS MARKET, BY TYPE, 2021-2030 (USD MILLION)
TABLE 150 ITALY DAIRY PRODUCTS IN RAISINS MARKET, BY TYPE, 2021-2030 (USD MILLION)
TABLE 151 ITALY BEVERAGES IN RAISINS MARKET, BY TYPE, 2021-2030 (USD MILLION)
TABLE 152 ITALY FOOD PROCESSING SECTOR IN RAISINS MARKET, BY PRODUCT TYPE, 2021-2030 (USD MILLION)
TABLE 153 ITALY FOOD SERVICE SECTOR IN RAISINS MARKET, BY APPLICATION, 2021-2030 (USD MILLION)
TABLE 154 ITALY FOOD SERVICE SECTOR IN RAISINS MARKET, BY PRODUCT TYPE, 2021-2030 (USD MILLION)
TABLE 155 ITALY NUTRACEUTICALS IN RAISINS MARKET, BY PRODUCT TYPE, 2021-2030 (USD MILLION)
TABLE 156 ITALY RAISINS MARKET, BY DISTRIBUTION CHANNEL, 2021-2030 (USD MILLION)
TABLE 157 ITALY INDIRECT IN RAISINS MARKET, BY DISTRIBUTION CHANNEL, 2021-2030 (USD MILLION)
TABLE 158 ITALY STORE BASED IN RAISINS MARKET, BY DISTRIBUTION CHANNEL, 2021-2030 (USD MILLION)
TABLE 159 ITALY NON-STORE BASED IN RAISINS MARKET, BY DISTRIBUTION CHANNEL, 2021-2030 (USD MILLION)
TABLE 160 POLAND RAISINS MARKET, BY PRODUCT TYPE, 2021-2030 (USD MILLION)
TABLE 161 POLAND RAISINS MARKET, BY DRYING METHOD, 2021-2030 (USD MILLION)
TABLE 162 POLAND RAISINS MARKET, BY NATURE, 2021-2030 (USD MILLION)
TABLE 163 POLAND RAISINS MARKET, BY END USE, 2021-2030 (USD MILLION)
TABLE 164 POLAND HOUSEHOLD/RETAIL IN RAISINS MARKET, BY PRODUCT TYPE, 2021-2030 (USD MILLION)
TABLE 165 POLAND FOOD PROCESSING SECTOR IN RAISINS MARKET, BY APPLICATION, 2021-2030 (USD MILLION)
TABLE 166 POLAND BAKERY PRODUCTS IN RAISINS MARKET, BY TYPE, 2021-2030 (USD MILLION)
TABLE 167 POLAND CONFECTIONARY IN RAISINS MARKET, BY TYPE, 2021-2030 (USD MILLION)
TABLE 168 POLAND SPORTS NUTRITION IN RAISINS MARKET, BY TYPE, 2021-2030 (USD MILLION)
TABLE 169 POLAND DAIRY PRODUCTS IN RAISINS MARKET, BY TYPE, 2021-2030 (USD MILLION)
TABLE 170 POLAND BEVERAGES IN RAISINS MARKET, BY TYPE, 2021-2030 (USD MILLION)
TABLE 171 POLAND FOOD PROCESSING SECTOR IN RAISINS MARKET, BY PRODUCT TYPE, 2021-2030 (USD MILLION)
TABLE 172 POLAND FOOD SERVICE SECTOR IN RAISINS MARKET, BY APPLICATION, 2021-2030 (USD MILLION)
TABLE 173 POLAND FOOD SERVICE SECTOR IN RAISINS MARKET, BY PRODUCT TYPE, 2021-2030 (USD MILLION)
TABLE 174 POLAND NUTRACEUTICALS IN RAISINS MARKET, BY PRODUCT TYPE, 2021-2030 (USD MILLION)
TABLE 175 POLAND RAISINS MARKET, BY DISTRIBUTION CHANNEL, 2021-2030 (USD MILLION)
TABLE 176 POLAND INDIRECT IN RAISINS MARKET, BY DISTRIBUTION CHANNEL, 2021-2030 (USD MILLION)
TABLE 177 POLAND STORE BASED IN RAISINS MARKET, BY DISTRIBUTION CHANNEL, 2021-2030 (USD MILLION)
TABLE 178 POLAND NON-STORE BASED IN RAISINS MARKET, BY DISTRIBUTION CHANNEL, 2021-2030 (USD MILLION)
TABLE 179 SPAIN RAISINS MARKET, BY PRODUCT TYPE, 2021-2030 (USD MILLION)
TABLE 180 SPAIN RAISINS MARKET, BY DRYING METHOD, 2021-2030 (USD MILLION)
TABLE 181 SPAIN RAISINS MARKET, BY NATURE, 2021-2030 (USD MILLION)
TABLE 182 SPAIN RAISINS MARKET, BY END USE, 2021-2030 (USD MILLION)
TABLE 183 SPAIN HOUSEHOLD/RETAIL IN RAISINS MARKET, BY PRODUCT TYPE, 2021-2030 (USD MILLION)
TABLE 184 SPAIN FOOD PROCESSING SECTOR IN RAISINS MARKET, BY APPLICATION, 2021-2030 (USD MILLION)
TABLE 185 SPAIN BAKERY PRODUCTS IN RAISINS MARKET, BY TYPE, 2021-2030 (USD MILLION)
TABLE 186 SPAIN CONFECTIONARY IN RAISINS MARKET, BY TYPE, 2021-2030 (USD MILLION)
TABLE 187 SPAIN SPORTS NUTRITION IN RAISINS MARKET, BY TYPE, 2021-2030 (USD MILLION)
TABLE 188 SPAIN DAIRY PRODUCTS IN RAISINS MARKET, BY TYPE, 2021-2030 (USD MILLION)
TABLE 189 SPAIN BEVERAGES IN RAISINS MARKET, BY TYPE, 2021-2030 (USD MILLION)
TABLE 190 SPAIN FOOD PROCESSING SECTOR IN RAISINS MARKET, BY PRODUCT TYPE, 2021-2030 (USD MILLION)
TABLE 191 SPAIN FOOD SERVICE SECTOR IN RAISINS MARKET, BY APPLICATION, 2021-2030 (USD MILLION)
TABLE 192 SPAIN FOOD SERVICE SECTOR IN RAISINS MARKET, BY PRODUCT TYPE, 2021-2030 (USD MILLION)
TABLE 193 SPAIN NUTRACEUTICALS IN RAISINS MARKET, BY PRODUCT TYPE, 2021-2030 (USD MILLION)
TABLE 194 SPAIN RAISINS MARKET, BY DISTRIBUTION CHANNEL, 2021-2030 (USD MILLION)
TABLE 195 SPAIN INDIRECT IN RAISINS MARKET, BY DISTRIBUTION CHANNEL, 2021-2030 (USD MILLION)
TABLE 196 SPAIN STORE BASED IN RAISINS MARKET, BY DISTRIBUTION CHANNEL, 2021-2030 (USD MILLION)
TABLE 197 SPAIN NON-STORE BASED IN RAISINS MARKET, BY DISTRIBUTION CHANNEL, 2021-2030 (USD MILLION)
TABLE 198 RUSSIA RAISINS MARKET, BY PRODUCT TYPE, 2021-2030 (USD MILLION)
TABLE 199 RUSSIA RAISINS MARKET, BY DRYING METHOD, 2021-2030 (USD MILLION)
TABLE 200 RUSSIA RAISINS MARKET, BY NATURE, 2021-2030 (USD MILLION)
TABLE 201 RUSSIA RAISINS MARKET, BY END USE, 2021-2030 (USD MILLION)
TABLE 202 RUSSIA HOUSEHOLD/RETAIL IN RAISINS MARKET, BY PRODUCT TYPE, 2021-2030 (USD MILLION)
TABLE 203 RUSSIA FOOD PROCESSING SECTOR IN RAISINS MARKET, BY APPLICATION, 2021-2030 (USD MILLION)
TABLE 204 RUSSIA BAKERY PRODUCTS IN RAISINS MARKET, BY TYPE, 2021-2030 (USD MILLION)
TABLE 205 RUSSIA CONFECTIONARY IN RAISINS MARKET, BY TYPE, 2021-2030 (USD MILLION)
TABLE 206 RUSSIA SPORTS NUTRITION IN RAISINS MARKET, BY TYPE, 2021-2030 (USD MILLION)
TABLE 207 RUSSIA FOOD PROCESSING SECTOR IN RAISINS MARKET, BY PRODUCT TYPE, 2021-2030 (USD MILLION)
TABLE 208 RUSSIA FOOD SERVICE SECTOR IN RAISINS MARKET, BY APPLICATION, 2021-2030 (USD MILLION)
TABLE 209 RUSSIA FOOD SERVICE SECTOR IN RAISINS MARKET, BY PRODUCT TYPE, 2021-2030 (USD MILLION)
TABLE 210 RUSSIA NUTRACEUTICALS IN RAISINS MARKET, BY PRODUCT TYPE, 2021-2030 (USD MILLION)
TABLE 211 RUSSIA RAISINS MARKET, BY DISTRIBUTION CHANNEL, 2021-2030 (USD MILLION)
TABLE 212 RUSSIA INDIRECT IN RAISINS MARKET, BY DISTRIBUTION CHANNEL, 2021-2030 (USD MILLION)
TABLE 213 RUSSIA STORE BASED IN RAISINS MARKET, BY DISTRIBUTION CHANNEL, 2021-2030 (USD MILLION)
TABLE 214 RUSSIA NON-STORE BASED IN RAISINS MARKET, BY DISTRIBUTION CHANNEL, 2021-2030 (USD MILLION)
TABLE 215 BELGIUM RAISINS MARKET, BY PRODUCT TYPE, 2021-2030 (USD MILLION)
TABLE 216 BELGIUM RAISINS MARKET, BY DRYING METHOD, 2021-2030 (USD MILLION)
TABLE 217 BELGIUM RAISINS MARKET, BY NATURE, 2021-2030 (USD MILLION)
TABLE 218 BELGIUM RAISINS MARKET, BY END USE, 2021-2030 (USD MILLION)
TABLE 219 BELGIUM HOUSEHOLD/RETAIL IN RAISINS MARKET, BY PRODUCT TYPE, 2021-2030 (USD MILLION)
TABLE 220 BELGIUM FOOD PROCESSING SECTOR IN RAISINS MARKET, BY APPLICATION, 2021-2030 (USD MILLION)
TABLE 221 BELGIUM BAKERY PRODUCTS IN RAISINS MARKET, BY TYPE, 2021-2030 (USD MILLION)
TABLE 222 BELGIUM CONFECTIONARY IN RAISINS MARKET, BY TYPE, 2021-2030 (USD MILLION)
TABLE 223 BELGIUM SPORTS NUTRITION IN RAISINS MARKET, BY TYPE, 2021-2030 (USD MILLION)
TABLE 224 BELGIUM DAIRY PRODUCTS IN RAISINS MARKET, BY TYPE, 2021-2030 (USD MILLION)
TABLE 225 BELGIUM BEVERAGES IN RAISINS MARKET, BY TYPE, 2021-2030 (USD MILLION)
TABLE 226 BELGIUM FOOD PROCESSING SECTOR IN RAISINS MARKET, BY PRODUCT TYPE, 2021-2030 (USD MILLION)
TABLE 227 BELGIUM FOOD SERVICE SECTOR IN RAISINS MARKET, BY APPLICATION, 2021-2030 (USD MILLION)
TABLE 228 BELGIUM FOOD SERVICE SECTOR IN RAISINS MARKET, BY PRODUCT TYPE, 2021-2030 (USD MILLION)
TABLE 229 BELGIUM NUTRACEUTICALS IN RAISINS MARKET, BY PRODUCT TYPE, 2021-2030 (USD MILLION)
TABLE 230 BELGIUM RAISINS MARKET, BY DISTRIBUTION CHANNEL, 2021-2030 (USD MILLION)
TABLE 231 BELGIUM INDIRECT IN RAISINS MARKET, BY DISTRIBUTION CHANNEL, 2021-2030 (USD MILLION)
TABLE 232 BELGIUM STORE BASED IN RAISINS MARKET, BY DISTRIBUTION CHANNEL, 2021-2030 (USD MILLION)
TABLE 233 BELGIUM NON-STORE BASED IN RAISINS MARKET, BY DISTRIBUTION CHANNEL, 2021-2030 (USD MILLION)
TABLE 234 SWEDEN RAISINS MARKET, BY PRODUCT TYPE, 2021-2030 (USD MILLION)
TABLE 235 SWEDEN RAISINS MARKET, BY DRYING METHOD, 2021-2030 (USD MILLION)
TABLE 236 SWEDEN RAISINS MARKET, BY NATURE, 2021-2030 (USD MILLION)
TABLE 237 SWEDEN RAISINS MARKET, BY END USE, 2021-2030 (USD MILLION)
TABLE 238 SWEDEN HOUSEHOLD/RETAIL IN RAISINS MARKET, BY PRODUCT TYPE, 2021-2030 (USD MILLION)
TABLE 239 SWEDEN FOOD PROCESSING SECTOR IN RAISINS MARKET, BY APPLICATION, 2021-2030 (USD MILLION)
TABLE 240 SWEDEN BAKERY PRODUCTS IN RAISINS MARKET, BY TYPE, 2021-2030 (USD MILLION)
TABLE 241 SWEDEN CONFECTIONARY IN RAISINS MARKET, BY TYPE, 2021-2030 (USD MILLION)
TABLE 242 SWEDEN SPORTS NUTRITION IN RAISINS MARKET, BY TYPE, 2021-2030 (USD MILLION)
TABLE 243 SWEDEN DAIRY PRODUCTS IN RAISINS MARKET, BY TYPE, 2021-2030 (USD MILLION)
TABLE 244 SWEDEN BEVERAGES IN RAISINS MARKET, BY TYPE, 2021-2030 (USD MILLION)
TABLE 245 SWEDEN FOOD PROCESSING SECTOR IN RAISINS MARKET, BY PRODUCT TYPE, 2021-2030 (USD MILLION)
TABLE 246 SWEDEN FOOD SERVICE SECTOR IN RAISINS MARKET, BY APPLICATION, 2021-2030 (USD MILLION)
TABLE 247 SWEDEN FOOD SERVICE SECTOR IN RAISINS MARKET, BY PRODUCT TYPE, 2021-2030 (USD MILLION)
TABLE 248 SWEDEN NUTRACEUTICALS IN RAISINS MARKET, BY PRODUCT TYPE, 2021-2030 (USD MILLION)
TABLE 249 SWEDEN RAISINS MARKET, BY DISTRIBUTION CHANNEL, 2021-2030 (USD MILLION)
TABLE 250 SWEDEN INDIRECT IN RAISINS MARKET, BY DISTRIBUTION CHANNEL, 2021-2030 (USD MILLION)
TABLE 251 SWEDEN STORE BASED IN RAISINS MARKET, BY DISTRIBUTION CHANNEL, 2021-2030 (USD MILLION)
TABLE 252 SWEDEN NON-STORE BASED IN RAISINS MARKET, BY DISTRIBUTION CHANNEL, 2021-2030 (USD MILLION)
TABLE 253 SWITZERLAND RAISINS MARKET, BY PRODUCT TYPE, 2021-2030 (USD MILLION)
TABLE 254 SWITZERLAND RAISINS MARKET, BY DRYING METHOD, 2021-2030 (USD MILLION)
TABLE 255 SWITZERLAND RAISINS MARKET, BY NATURE, 2021-2030 (USD MILLION)
TABLE 256 SWITZERLAND RAISINS MARKET, BY END USE, 2021-2030 (USD MILLION)
TABLE 257 SWITZERLAND HOUSEHOLD/RETAIL IN RAISINS MARKET, BY PRODUCT TYPE, 2021-2030 (USD MILLION)
TABLE 258 SWITZERLAND FOOD PROCESSING SECTOR IN RAISINS MARKET, BY APPLICATION, 2021-2030 (USD MILLION)
TABLE 259 SWITZERLAND BAKERY PRODUCTS IN RAISINS MARKET, BY TYPE, 2021-2030 (USD MILLION)
TABLE 260 SWITZERLAND CONFECTIONARY IN RAISINS MARKET, BY TYPE, 2021-2030 (USD MILLION)
TABLE 261 SWITZERLAND SPORTS NUTRITION IN RAISINS MARKET, BY TYPE, 2021-2030 (USD MILLION)
TABLE 262 SWITZERLAND DAIRY PRODUCTS IN RAISINS MARKET, BY TYPE, 2021-2030 (USD MILLION)
TABLE 263 SWITZERLAND BEVERAGES IN RAISINS MARKET, BY TYPE, 2021-2030 (USD MILLION)
TABLE 264 SWITZERLAND FOOD PROCESSING SECTOR IN RAISINS MARKET, BY PRODUCT TYPE, 2021-2030 (USD MILLION)
TABLE 265 SWITZERLAND FOOD SERVICE SECTOR IN RAISINS MARKET, BY APPLICATION, 2021-2030 (USD MILLION)
TABLE 266 SWITZERLAND FOOD SERVICE SECTOR IN RAISINS MARKET, BY PRODUCT TYPE, 2021-2030 (USD MILLION)
TABLE 267 SWITZERLAND NUTRACEUTICALS IN RAISINS MARKET, BY PRODUCT TYPE, 2021-2030 (USD MILLION)
TABLE 268 SWITZERLAND RAISINS MARKET, BY DISTRIBUTION CHANNEL, 2021-2030 (USD MILLION)
TABLE 269 SWITZERLAND INDIRECT IN RAISINS MARKET, BY DISTRIBUTION CHANNEL, 2021-2030 (USD MILLION)
TABLE 270 SWITZERLAND STORE BASED IN RAISINS MARKET, BY DISTRIBUTION CHANNEL, 2021-2030 (USD MILLION)
TABLE 271 SWITZERLAND NON-STORE BASED IN RAISINS MARKET, BY DISTRIBUTION CHANNEL, 2021-2030 (USD MILLION)
TABLE 272 DENMARK RAISINS MARKET, BY PRODUCT TYPE, 2021-2030 (USD MILLION)
TABLE 273 DENMARK RAISINS MARKET, BY DRYING METHOD, 2021-2030 (USD MILLION)
TABLE 274 DENMARK RAISINS MARKET, BY NATURE, 2021-2030 (USD MILLION)
TABLE 275 DENMARK RAISINS MARKET, BY END USE, 2021-2030 (USD MILLION)
TABLE 276 DENMARK HOUSEHOLD/RETAIL IN RAISINS MARKET, BY PRODUCT TYPE, 2021-2030 (USD MILLION)
TABLE 277 DENMARK FOOD PROCESSING SECTOR IN RAISINS MARKET, BY APPLICATION, 2021-2030 (USD MILLION)
TABLE 278 DENMARK BAKERY PRODUCTS IN RAISINS MARKET, BY TYPE, 2021-2030 (USD MILLION)
TABLE 279 DENMARK CONFECTIONARY IN RAISINS MARKET, BY TYPE, 2021-2030 (USD MILLION)
TABLE 280 DENMARK SPORTS NUTRITION IN RAISINS MARKET, BY TYPE, 2021-2030 (USD MILLION)
TABLE 281 DENMARK DAIRY PRODUCTS IN RAISINS MARKET, BY TYPE, 2021-2030 (USD MILLION)
TABLE 282 DENMARK BEVERAGES IN RAISINS MARKET, BY TYPE, 2021-2030 (USD MILLION)
TABLE 283 DENMARK FOOD PROCESSING SECTOR IN RAISINS MARKET, BY PRODUCT TYPE, 2021-2030 (USD MILLION)
TABLE 284 DENMARK FOOD SERVICE SECTOR IN RAISINS MARKET, BY APPLICATION, 2021-2030 (USD MILLION)
TABLE 285 DENMARK FOOD SERVICE SECTOR IN RAISINS MARKET, BY PRODUCT TYPE, 2021-2030 (USD MILLION)
TABLE 286 DENMARK NUTRACEUTICALS IN RAISINS MARKET, BY PRODUCT TYPE, 2021-2030 (USD MILLION)
TABLE 287 DENMARK RAISINS MARKET, BY DISTRIBUTION CHANNEL, 2021-2030 (USD MILLION)
TABLE 288 DENMARK INDIRECT IN RAISINS MARKET, BY DISTRIBUTION CHANNEL, 2021-2030 (USD MILLION)
TABLE 289 DENMARK STORE BASED IN RAISINS MARKET, BY DISTRIBUTION CHANNEL, 2021-2030 (USD MILLION)
TABLE 290 DENMARK NON-STORE BASED IN RAISINS MARKET, BY DISTRIBUTION CHANNEL, 2021-2030 (USD MILLION)
TABLE 291 REST OF EUROPE RAISINS MARKET, BY PRODUCT TYPE, 2021-2030 (USD MILLION)
TABLE 292 ASIA-PACIFIC RAISINS MARKET, BY COUNTRY, 2021-2030 (USD MILLION)
TABLE 293 ASIA-PACIFIC RAISINS MARKET, BY PRODUCT TYPE, 2021-2030 (USD MILLION)
TABLE 294 ASIA-PACIFIC RAISINS MARKET, BY DRYING METHOD, 2021-2030 (USD MILLION)
TABLE 295 ASIA-PACIFIC RAISINS MARKET, BY NATURE, 2021-2030 (USD MILLION)
TABLE 296 ASIA-PACIFIC RAISINS MARKET, BY END USE, 2021-2030 (USD MILLION)
TABLE 297 ASIA-PACIFIC HOUSEHOLD/RETAIL IN RAISINS MARKET, BY PRODUCT TYPE, 2021-2030 (USD MILLION)
TABLE 298 ASIA-PACIFIC FOOD PROCESSING SECTOR IN RAISINS MARKET, BY APPLICATION, 2021-2030 (USD MILLION)
TABLE 299 ASIA-PACIFIC BAKERY PRODUCTS IN RAISINS MARKET, BY TYPE, 2021-2030 (USD MILLION)
TABLE 300 ASIA-PACIFIC CONFECTIONARY IN RAISINS MARKET, BY TYPE, 2021-2030 (USD MILLION)
TABLE 301 ASIA-PACIFIC SPORTS NUTRITION IN RAISINS MARKET, BY TYPE, 2021-2030 (USD MILLION)
TABLE 302 ASIA-PACIFIC DAIRY PRODUCTS IN RAISINS MARKET, BY TYPE, 2021-2030 (USD MILLION)
TABLE 303 ASIA-PACIFIC BEVERAGES IN RAISINS MARKET, BY TYPE, 2021-2030 (USD MILLION)
TABLE 304 ASIA-PACIFIC FOOD PROCESSING SECTOR IN RAISINS MARKET, BY PRODUCT TYPE, 2021-2030 (USD MILLION)
TABLE 305 ASIA-PACIFIC FOOD SERVICE SECTOR IN RAISINS MARKET, BY APPLICATION, 2021-2030 (USD MILLION)
TABLE 306 ASIA-PACIFIC FOOD SERVICE SECTOR IN RAISINS MARKET, BY PRODUCT TYPE, 2021-2030 (USD MILLION)
TABLE 307 ASIA-PACIFIC NUTRACEUTICALS IN RAISINS MARKET, BY PRODUCT TYPE, 2021-2030 (USD MILLION)
TABLE 308 ASIA-PACIFIC RAISINS MARKET, BY DISTRIBUTION CHANNEL, 2021-2030 (USD MILLION)
TABLE 309 ASIA-PACIFIC INDIRECT IN RAISINS MARKET, BY DISTRIBUTION CHANNEL, 2021-2030 (USD MILLION)
TABLE 310 ASIA-PACIFIC STORE BASED IN RAISINS MARKET, BY DISTRIBUTION CHANNEL, 2021-2030 (USD MILLION)
TABLE 311 ASIA-PACIFIC NON-STORE BASED IN RAISINS MARKET, BY DISTRIBUTION CHANNEL, 2021-2030 (USD MILLION)
TABLE 312 CHINA RAISINS MARKET, BY PRODUCT TYPE, 2021-2030 (USD MILLION)
TABLE 313 CHINA RAISINS MARKET, BY DRYING METHOD, 2021-2030 (USD MILLION)
TABLE 314 CHINA RAISINS MARKET, BY NATURE, 2021-2030 (USD MILLION)
TABLE 315 CHINA RAISINS MARKET, BY END USE, 2021-2030 (USD MILLION)
TABLE 316 CHINA HOUSEHOLD/RETAIL IN RAISINS MARKET, BY PRODUCT TYPE, 2021-2030 (USD MILLION)
TABLE 317 CHINA FOOD PROCESSING SECTOR IN RAISINS MARKET, BY APPLICATION, 2021-2030 (USD MILLION)
TABLE 318 CHINA BAKERY PRODUCTS IN RAISINS MARKET, BY TYPE, 2021-2030 (USD MILLION)
TABLE 319 CHINA CONFECTIONARY IN RAISINS MARKET, BY TYPE, 2021-2030 (USD MILLION)
TABLE 320 CHINA SPORTS NUTRITION IN RAISINS MARKET, BY TYPE, 2021-2030 (USD MILLION)
TABLE 321 CHINA DAIRY PRODUCTS IN RAISINS MARKET, BY TYPE, 2021-2030 (USD MILLION)
TABLE 322 CHINA BEVERAGES IN RAISINS MARKET, BY TYPE, 2021-2030 (USD MILLION)
TABLE 323 CHINA FOOD PROCESSING SECTOR IN RAISINS MARKET, BY PRODUCT TYPE, 2021-2030 (USD MILLION)
TABLE 324 CHINA FOOD SERVICE SECTOR IN RAISINS MARKET, BY APPLICATION, 2021-2030 (USD MILLION)
TABLE 325 CHINA FOOD SERVICE SECTOR IN RAISINS MARKET, BY PRODUCT TYPE, 2021-2030 (USD MILLION)
TABLE 326 CHINA NUTRACEUTICALS IN RAISINS MARKET, BY PRODUCT TYPE, 2021-2030 (USD MILLION)
TABLE 327 CHINA RAISINS MARKET, BY DISTRIBUTION CHANNEL, 2021-2030 (USD MILLION)
TABLE 328 CHINA INDIRECT IN RAISINS MARKET, BY DISTRIBUTION CHANNEL, 2021-2030 (USD MILLION)
TABLE 329 CHINA STORE BASED IN RAISINS MARKET, BY DISTRIBUTION CHANNEL, 2021-2030 (USD MILLION)
TABLE 330 CHINA NON-STORE BASED IN RAISINS MARKET, BY DISTRIBUTION CHANNEL, 2021-2030 (USD MILLION)
TABLE 331 INDIA RAISINS MARKET, BY PRODUCT TYPE, 2021-2030 (USD MILLION)
TABLE 332 INDIA RAISINS MARKET, BY DRYING METHOD, 2021-2030 (USD MILLION)
TABLE 333 INDIA RAISINS MARKET, BY NATURE, 2021-2030 (USD MILLION)
TABLE 334 INDIA RAISINS MARKET, BY END USE, 2021-2030 (USD MILLION)
TABLE 335 INDIA HOUSEHOLD/RETAIL IN RAISINS MARKET, BY PRODUCT TYPE, 2021-2030 (USD MILLION)
TABLE 336 INDIA FOOD PROCESSING SECTOR IN RAISINS MARKET, BY APPLICATION, 2021-2030 (USD MILLION)
TABLE 337 INDIA BAKERY PRODUCTS IN RAISINS MARKET, BY TYPE, 2021-2030 (USD MILLION)
TABLE 338 INDIA CONFECTIONARY IN RAISINS MARKET, BY TYPE, 2021-2030 (USD MILLION)
TABLE 339 INDIA SPORTS NUTRITION IN RAISINS MARKET, BY TYPE, 2021-2030 (USD MILLION)
TABLE 340 INDIA DAIRY PRODUCTS IN RAISINS MARKET, BY TYPE, 2021-2030 (USD MILLION)
TABLE 341 INDIA BEVERAGES IN RAISINS MARKET, BY TYPE, 2021-2030 (USD MILLION)
TABLE 342 INDIA FOOD PROCESSING SECTOR IN RAISINS MARKET, BY PRODUCT TYPE, 2021-2030 (USD MILLION)
TABLE 343 INDIA FOOD SERVICE SECTOR IN RAISINS MARKET, BY APPLICATION, 2021-2030 (USD MILLION)
TABLE 344 INDIA FOOD SERVICE SECTOR IN RAISINS MARKET, BY PRODUCT TYPE, 2021-2030 (USD MILLION)
TABLE 345 INDIA NUTRACEUTICALS IN RAISINS MARKET, BY PRODUCT TYPE, 2021-2030 (USD MILLION)
TABLE 346 INDIA RAISINS MARKET, BY DISTRIBUTION CHANNEL, 2021-2030 (USD MILLION)
TABLE 347 INDIA INDIRECT IN RAISINS MARKET, BY DISTRIBUTION CHANNEL, 2021-2030 (USD MILLION)
TABLE 348 INDIA STORE BASED IN RAISINS MARKET, BY DISTRIBUTION CHANNEL, 2021-2030 (USD MILLION)
TABLE 349 INDIA NON-STORE BASED IN RAISINS MARKET, BY DISTRIBUTION CHANNEL, 2021-2030 (USD MILLION)
TABLE 350 JAPAN RAISINS MARKET, BY PRODUCT TYPE, 2021-2030 (USD MILLION)
TABLE 351 JAPAN RAISINS MARKET, BY DRYING METHOD, 2021-2030 (USD MILLION)
TABLE 352 JAPAN RAISINS MARKET, BY NATURE, 2021-2030 (USD MILLION)
TABLE 353 JAPAN RAISINS MARKET, BY END USE, 2021-2030 (USD MILLION)
TABLE 354 JAPAN HOUSEHOLD/RETAIL IN RAISINS MARKET, BY PRODUCT TYPE, 2021-2030 (USD MILLION)
TABLE 355 JAPAN FOOD PROCESSING SECTOR IN RAISINS MARKET, BY APPLICATION, 2021-2030 (USD MILLION)
TABLE 356 JAPAN BAKERY PRODUCTS IN RAISINS MARKET, BY TYPE, 2021-2030 (USD MILLION)
TABLE 357 JAPAN CONFECTIONARY IN RAISINS MARKET, BY TYPE, 2021-2030 (USD MILLION)
TABLE 358 JAPAN SPORTS NUTRITION IN RAISINS MARKET, BY TYPE, 2021-2030 (USD MILLION)
TABLE 359 JAPAN DAIRY PRODUCTS IN RAISINS MARKET, BY TYPE, 2021-2030 (USD MILLION)
TABLE 360 JAPAN BEVERAGES IN RAISINS MARKET, BY TYPE, 2021-2030 (USD MILLION)
TABLE 361 JAPAN FOOD PROCESSING SECTOR IN RAISINS MARKET, BY PRODUCT TYPE, 2021-2030 (USD MILLION)
TABLE 362 JAPAN FOOD SERVICE SECTOR IN RAISINS MARKET, BY APPLICATION, 2021-2030 (USD MILLION)
TABLE 363 JAPAN FOOD SERVICE SECTOR IN RAISINS MARKET, BY PRODUCT TYPE, 2021-2030 (USD MILLION)
TABLE 364 JAPAN NUTRACEUTICALS IN RAISINS MARKET, BY PRODUCT TYPE, 2021-2030 (USD MILLION)
TABLE 365 JAPAN RAISINS MARKET, BY DISTRIBUTION CHANNEL, 2021-2030 (USD MILLION)
TABLE 366 JAPAN INDIRECT IN RAISINS MARKET, BY DISTRIBUTION CHANNEL, 2021-2030 (USD MILLION)
TABLE 367 JAPAN STORE BASED IN RAISINS MARKET, BY DISTRIBUTION CHANNEL, 2021-2030 (USD MILLION)
TABLE 368 JAPAN NON-STORE BASED IN RAISINS MARKET, BY DISTRIBUTION CHANNEL, 2021-2030 (USD MILLION)
TABLE 369 AUSTRALIA RAISINS MARKET, BY PRODUCT TYPE, 2021-2030 (USD MILLION)
TABLE 370 AUSTRALIA RAISINS MARKET, BY DRYING METHOD, 2021-2030 (USD MILLION)
TABLE 371 AUSTRALIA RAISINS MARKET, BY NATURE, 2021-2030 (USD MILLION)
TABLE 372 AUSTRALIA RAISINS MARKET, BY END USE, 2021-2030 (USD MILLION)
TABLE 373 AUSTRALIA HOUSEHOLD/RETAIL IN RAISINS MARKET, BY PRODUCT TYPE, 2021-2030 (USD MILLION)
TABLE 374 AUSTRALIA FOOD PROCESSING SECTOR IN RAISINS MARKET, BY APPLICATION, 2021-2030 (USD MILLION)
TABLE 375 AUSTRALIA BAKERY PRODUCTS IN RAISINS MARKET, BY TYPE, 2021-2030 (USD MILLION)
TABLE 376 AUSTRALIA CONFECTIONARY IN RAISINS MARKET, BY TYPE, 2021-2030 (USD MILLION)
TABLE 377 AUSTRALIA SPORTS NUTRITION IN RAISINS MARKET, BY TYPE, 2021-2030 (USD MILLION)
TABLE 378 AUSTRALIA DAIRY PRODUCTS IN RAISINS MARKET, BY TYPE, 2021-2030 (USD MILLION)
TABLE 379 AUSTRALIA BEVERAGES IN RAISINS MARKET, BY TYPE, 2021-2030 (USD MILLION)
TABLE 380 AUSTRALIA FOOD PROCESSING SECTOR IN RAISINS MARKET, BY PRODUCT TYPE, 2021-2030 (USD MILLION)
TABLE 381 AUSTRALIA FOOD SERVICE SECTOR IN RAISINS MARKET, BY APPLICATION, 2021-2030 (USD MILLION)
TABLE 382 AUSTRALIA FOOD SERVICE SECTOR IN RAISINS MARKET, BY PRODUCT TYPE, 2021-2030 (USD MILLION)
TABLE 383 AUSTRALIA NUTRACEUTICALS IN RAISINS MARKET, BY PRODUCT TYPE, 2021-2030 (USD MILLION)
TABLE 384 AUSTRALIA RAISINS MARKET, BY DISTRIBUTION CHANNEL, 2021-2030 (USD MILLION)
TABLE 385 AUSTRALIA INDIRECT IN RAISINS MARKET, BY DISTRIBUTION CHANNEL, 2021-2030 (USD MILLION)
TABLE 386 AUSTRALIA STORE BASED IN RAISINS MARKET, BY DISTRIBUTION CHANNEL, 2021-2030 (USD MILLION)
TABLE 387 AUSTRALIA NON-STORE BASED IN RAISINS MARKET, BY DISTRIBUTION CHANNEL, 2021-2030 (USD MILLION)
TABLE 388 INDONESIA RAISINS MARKET, BY PRODUCT TYPE, 2021-2030 (USD MILLION)
TABLE 389 INDONESIA RAISINS MARKET, BY DRYING METHOD, 2021-2030 (USD MILLION)
TABLE 390 INDONESIA RAISINS MARKET, BY NATURE, 2021-2030 (USD MILLION)
TABLE 391 INDONESIA RAISINS MARKET, BY END USE, 2021-2030 (USD MILLION)
TABLE 392 INDONESIA HOUSEHOLD/RETAIL IN RAISINS MARKET, BY PRODUCT TYPE, 2021-2030 (USD MILLION)
TABLE 393 INDONESIA FOOD PROCESSING SECTOR IN RAISINS MARKET, BY APPLICATION, 2021-2030 (USD MILLION)
TABLE 394 INDONESIA BAKERY PRODUCTS IN RAISINS MARKET, BY TYPE, 2021-2030 (USD MILLION)
TABLE 395 INDONESIA CONFECTIONARY IN RAISINS MARKET, BY TYPE, 2021-2030 (USD MILLION)
TABLE 396 INDONESIA SPORTS NUTRITION IN RAISINS MARKET, BY TYPE, 2021-2030 (USD MILLION)
TABLE 397 INDONESIA DAIRY PRODUCTS IN RAISINS MARKET, BY TYPE, 2021-2030 (USD MILLION)
TABLE 398 INDONESIA BEVERAGES IN RAISINS MARKET, BY TYPE, 2021-2030 (USD MILLION)
TABLE 399 INDONESIA FOOD PROCESSING SECTOR IN RAISINS MARKET, BY PRODUCT TYPE, 2021-2030 (USD MILLION)
TABLE 400 INDONESIA FOOD SERVICE SECTOR IN RAISINS MARKET, BY APPLICATION, 2021-2030 (USD MILLION)
TABLE 401 INDONESIA FOOD SERVICE SECTOR IN RAISINS MARKET, BY PRODUCT TYPE, 2021-2030 (USD MILLION)
TABLE 402 INDONESIA NUTRACEUTICALS IN RAISINS MARKET, BY PRODUCT TYPE, 2021-2030 (USD MILLION)
TABLE 403 INDONESIA RAISINS MARKET, BY DISTRIBUTION CHANNEL, 2021-2030 (USD MILLION)
TABLE 404 INDONESIA INDIRECT IN RAISINS MARKET, BY DISTRIBUTION CHANNEL, 2021-2030 (USD MILLION)
TABLE 405 INDONESIA STORE BASED IN RAISINS MARKET, BY DISTRIBUTION CHANNEL, 2021-2030 (USD MILLION)
TABLE 406 INDONESIA NON-STORE BASED IN RAISINS MARKET, BY DISTRIBUTION CHANNEL, 2021-2030 (USD MILLION)
TABLE 407 SOUTH KOREA RAISINS MARKET, BY PRODUCT TYPE, 2021-2030 (USD MILLION)
TABLE 408 SOUTH KOREA RAISINS MARKET, BY DRYING METHOD, 2021-2030 (USD MILLION)
TABLE 409 SOUTH KOREA RAISINS MARKET, BY NATURE, 2021-2030 (USD MILLION)
TABLE 410 SOUTH KOREA RAISINS MARKET, BY END USE, 2021-2030 (USD MILLION)
TABLE 411 SOUTH KOREA HOUSEHOLD/RETAIL IN RAISINS MARKET, BY PRODUCT TYPE, 2021-2030 (USD MILLION)
TABLE 412 SOUTH KOREA FOOD PROCESSING SECTOR IN RAISINS MARKET, BY APPLICATION, 2021-2030 (USD MILLION)
TABLE 413 SOUTH KOREA BAKERY PRODUCTS IN RAISINS MARKET, BY TYPE, 2021-2030 (USD MILLION)
TABLE 414 SOUTH KOREA CONFECTIONARY IN RAISINS MARKET, BY TYPE, 2021-2030 (USD MILLION)
TABLE 415 SOUTH KOREA SPORTS NUTRITION IN RAISINS MARKET, BY TYPE, 2021-2030 (USD MILLION)
TABLE 416 SOUTH KOREA DAIRY PRODUCTS IN RAISINS MARKET, BY TYPE, 2021-2030 (USD MILLION)
TABLE 417 SOUTH KOREA BEVERAGES IN RAISINS MARKET, BY TYPE, 2021-2030 (USD MILLION)
TABLE 418 SOUTH KOREA FOOD PROCESSING SECTOR IN RAISINS MARKET, BY PRODUCT TYPE, 2021-2030 (USD MILLION)
TABLE 419 SOUTH KOREA FOOD SERVICE SECTOR IN RAISINS MARKET, BY APPLICATION, 2021-2030 (USD MILLION)
TABLE 420 SOUTH KOREA FOOD SERVICE SECTOR IN RAISINS MARKET, BY PRODUCT TYPE, 2021-2030 (USD MILLION)
TABLE 421 SOUTH KOREA NUTRACEUTICALS IN RAISINS MARKET, BY PRODUCT TYPE, 2021-2030 (USD MILLION)
TABLE 422 SOUTH KOREA RAISINS MARKET, BY DISTRIBUTION CHANNEL, 2021-2030 (USD MILLION)
TABLE 423 SOUTH KOREA INDIRECT IN RAISINS MARKET, BY DISTRIBUTION CHANNEL, 2021-2030 (USD MILLION)
TABLE 424 SOUTH KOREA STORE BASED IN RAISINS MARKET, BY DISTRIBUTION CHANNEL, 2021-2030 (USD MILLION)
TABLE 425 SOUTH KOREA NON-STORE BASED IN RAISINS MARKET, BY DISTRIBUTION CHANNEL, 2021-2030 (USD MILLION)
TABLE 426 THAILAND RAISINS MARKET, BY PRODUCT TYPE, 2021-2030 (USD MILLION)
TABLE 427 THAILAND RAISINS MARKET, BY DRYING METHOD, 2021-2030 (USD MILLION)
TABLE 428 THAILAND RAISINS MARKET, BY NATURE, 2021-2030 (USD MILLION)
TABLE 429 THAILAND RAISINS MARKET, BY END USE, 2021-2030 (USD MILLION)
TABLE 430 THAILAND HOUSEHOLD/RETAIL IN RAISINS MARKET, BY PRODUCT TYPE, 2021-2030 (USD MILLION)
TABLE 431 THAILAND FOOD PROCESSING SECTOR IN RAISINS MARKET, BY APPLICATION, 2021-2030 (USD MILLION)
TABLE 432 THAILAND BAKERY PRODUCTS IN RAISINS MARKET, BY TYPE, 2021-2030 (USD MILLION)
TABLE 433 THAILAND CONFECTIONARY IN RAISINS MARKET, BY TYPE, 2021-2030 (USD MILLION)
TABLE 434 THAILAND SPORTS NUTRITION IN RAISINS MARKET, BY TYPE, 2021-2030 (USD MILLION)
TABLE 435 THAILAND DAIRY PRODUCTS IN RAISINS MARKET, BY TYPE, 2021-2030 (USD MILLION)
TABLE 436 THAILAND BEVERAGES IN RAISINS MARKET, BY TYPE, 2021-2030 (USD MILLION)
TABLE 437 THAILAND FOOD PROCESSING SECTOR IN RAISINS MARKET, BY PRODUCT TYPE, 2021-2030 (USD MILLION)
TABLE 438 THAILAND FOOD SERVICE SECTOR IN RAISINS MARKET, BY APPLICATION, 2021-2030 (USD MILLION)
TABLE 439 THAILAND FOOD SERVICE SECTOR IN RAISINS MARKET, BY PRODUCT TYPE, 2021-2030 (USD MILLION)
TABLE 440 THAILAND NUTRACEUTICALS IN RAISINS MARKET, BY PRODUCT TYPE, 2021-2030 (USD MILLION)
TABLE 441 THAILAND RAISINS MARKET, BY DISTRIBUTION CHANNEL, 2021-2030 (USD MILLION)
TABLE 442 THAILAND INDIRECT IN RAISINS MARKET, BY DISTRIBUTION CHANNEL, 2021-2030 (USD MILLION)
TABLE 443 THAILAND STORE BASED IN RAISINS MARKET, BY DISTRIBUTION CHANNEL, 2021-2030 (USD MILLION)
TABLE 444 THAILAND NON-STORE BASED IN RAISINS MARKET, BY DISTRIBUTION CHANNEL, 2021-2030 (USD MILLION)
TABLE 445 PHILIPPINES RAISINS MARKET, BY PRODUCT TYPE, 2021-2030 (USD MILLION)
TABLE 446 PHILIPPINES RAISINS MARKET, BY DRYING METHOD, 2021-2030 (USD MILLION)
TABLE 447 PHILIPPINES RAISINS MARKET, BY NATURE, 2021-2030 (USD MILLION)
TABLE 448 PHILIPPINES RAISINS MARKET, BY END USE, 2021-2030 (USD MILLION)
TABLE 449 PHILIPPINES HOUSEHOLD/RETAIL IN RAISINS MARKET, BY PRODUCT TYPE, 2021-2030 (USD MILLION)
TABLE 450 PHILIPPINES FOOD PROCESSING SECTOR IN RAISINS MARKET, BY APPLICATION, 2021-2030 (USD MILLION)
TABLE 451 PHILIPPINES BAKERY PRODUCTS IN RAISINS MARKET, BY TYPE, 2021-2030 (USD MILLION)
TABLE 452 PHILIPPINES CONFECTIONARY IN RAISINS MARKET, BY TYPE, 2021-2030 (USD MILLION)
TABLE 453 PHILIPPINES SPORTS NUTRITION IN RAISINS MARKET, BY TYPE, 2021-2030 (USD MILLION)
TABLE 454 PHILIPPINES DAIRY PRODUCTS IN RAISINS MARKET, BY TYPE, 2021-2030 (USD MILLION)
TABLE 455 PHILIPPINES BEVERAGES IN RAISINS MARKET, BY TYPE, 2021-2030 (USD MILLION)
TABLE 456 PHILIPPINES FOOD PROCESSING SECTOR IN RAISINS MARKET, BY PRODUCT TYPE, 2021-2030 (USD MILLION)
TABLE 457 PHILIPPINES FOOD SERVICE SECTOR IN RAISINS MARKET, BY APPLICATION, 2021-2030 (USD MILLION)
TABLE 458 PHILIPPINES FOOD SERVICE SECTOR IN RAISINS MARKET, BY PRODUCT TYPE, 2021-2030 (USD MILLION)
TABLE 459 PHILIPPINES NUTRACEUTICALS IN RAISINS MARKET, BY PRODUCT TYPE, 2021-2030 (USD MILLION)
TABLE 460 PHILIPPINES RAISINS MARKET, BY DISTRIBUTION CHANNEL, 2021-2030 (USD MILLION)
TABLE 461 PHILIPPINES INDIRECT IN RAISINS MARKET, BY DISTRIBUTION CHANNEL, 2021-2030 (USD MILLION)
TABLE 462 PHILIPPINES STORE BASED IN RAISINS MARKET, BY DISTRIBUTION CHANNEL, 2021-2030 (USD MILLION)
TABLE 463 PHILIPPINES NON-STORE BASED IN RAISINS MARKET, BY DISTRIBUTION CHANNEL, 2021-2030 (USD MILLION)
TABLE 464 VIETNAM RAISINS MARKET, BY PRODUCT TYPE, 2021-2030 (USD MILLION)
TABLE 465 VIETNAM RAISINS MARKET, BY DRYING METHOD, 2021-2030 (USD MILLION)
TABLE 466 VIETNAM RAISINS MARKET, BY NATURE, 2021-2030 (USD MILLION)
TABLE 467 VIETNAM RAISINS MARKET, BY END USE, 2021-2030 (USD MILLION)
TABLE 468 VIETNAM HOUSEHOLD/RETAIL IN RAISINS MARKET, BY PRODUCT TYPE, 2021-2030 (USD MILLION)
TABLE 469 VIETNAM FOOD PROCESSING SECTOR IN RAISINS MARKET, BY APPLICATION, 2021-2030 (USD MILLION)
TABLE 470 VIETNAM BAKERY PRODUCTS IN RAISINS MARKET, BY TYPE, 2021-2030 (USD MILLION)
TABLE 471 VIETNAM CONFECTIONARY IN RAISINS MARKET, BY TYPE, 2021-2030 (USD MILLION)
TABLE 472 VIETNAM SPORTS NUTRITION IN RAISINS MARKET, BY TYPE, 2021-2030 (USD MILLION)
TABLE 473 VIETNAM DAIRY PRODUCTS IN RAISINS MARKET, BY TYPE, 2021-2030 (USD MILLION)
TABLE 474 VIETNAM BEVERAGES IN RAISINS MARKET, BY TYPE, 2021-2030 (USD MILLION)
TABLE 475 VIETNAM FOOD PROCESSING SECTOR IN RAISINS MARKET, BY PRODUCT TYPE, 2021-2030 (USD MILLION)
TABLE 476 VIETNAM FOOD SERVICE SECTOR IN RAISINS MARKET, BY APPLICATION, 2021-2030 (USD MILLION)
TABLE 477 VIETNAM FOOD SERVICE SECTOR IN RAISINS MARKET, BY PRODUCT TYPE, 2021-2030 (USD MILLION)
TABLE 478 VIETNAM NUTRACEUTICALS IN RAISINS MARKET, BY PRODUCT TYPE, 2021-2030 (USD MILLION)
TABLE 479 VIETNAM RAISINS MARKET, BY DISTRIBUTION CHANNEL, 2021-2030 (USD MILLION)
TABLE 480 VIETNAM INDIRECT IN RAISINS MARKET, BY DISTRIBUTION CHANNEL, 2021-2030 (USD MILLION)
TABLE 481 VIETNAM STORE BASED IN RAISINS MARKET, BY DISTRIBUTION CHANNEL, 2021-2030 (USD MILLION)
TABLE 482 VIETNAM NON-STORE BASED IN RAISINS MARKET, BY DISTRIBUTION CHANNEL, 2021-2030 (USD MILLION)
TABLE 483 NEW ZEALAND RAISINS MARKET, BY PRODUCT TYPE, 2021-2030 (USD MILLION)
TABLE 484 NEW ZEALAND RAISINS MARKET, BY DRYING METHOD, 2021-2030 (USD MILLION)
TABLE 485 NEW ZEALAND RAISINS MARKET, BY NATURE, 2021-2030 (USD MILLION)
TABLE 486 NEW ZEALAND RAISINS MARKET, BY END USE, 2021-2030 (USD MILLION)
TABLE 487 NEW ZEALAND HOUSEHOLD/RETAIL IN RAISINS MARKET, BY PRODUCT TYPE, 2021-2030 (USD MILLION)
TABLE 488 NEW ZEALAND FOOD PROCESSING SECTOR IN RAISINS MARKET, BY APPLICATION, 2021-2030 (USD MILLION)
TABLE 489 NEW ZEALAND BAKERY PRODUCTS IN RAISINS MARKET, BY TYPE, 2021-2030 (USD MILLION)
TABLE 490 NEW ZEALAND CONFECTIONARY IN RAISINS MARKET, BY TYPE, 2021-2030 (USD MILLION)
TABLE 491 NEW ZEALAND SPORTS NUTRITION IN RAISINS MARKET, BY TYPE, 2021-2030 (USD MILLION)
TABLE 492 NEW ZEALAND DAIRY PRODUCTS IN RAISINS MARKET, BY TYPE, 2021-2030 (USD MILLION)
TABLE 493 NEW ZEALAND BEVERAGES IN RAISINS MARKET, BY TYPE, 2021-2030 (USD MILLION)
TABLE 494 NEW ZEALAND FOOD PROCESSING SECTOR IN RAISINS MARKET, BY PRODUCT TYPE, 2021-2030 (USD MILLION)
TABLE 495 NEW ZEALAND FOOD SERVICE SECTOR IN RAISINS MARKET, BY APPLICATION, 2021-2030 (USD MILLION)
TABLE 496 NEW ZEALAND FOOD SERVICE SECTOR IN RAISINS MARKET, BY PRODUCT TYPE, 2021-2030 (USD MILLION)
TABLE 497 NEW ZEALAND NUTRACEUTICALS IN RAISINS MARKET, BY PRODUCT TYPE, 2021-2030 (USD MILLION)
TABLE 498 NEW ZEALAND RAISINS MARKET, BY DISTRIBUTION CHANNEL, 2021-2030 (USD MILLION)
TABLE 499 NEW ZEALAND INDIRECT IN RAISINS MARKET, BY DISTRIBUTION CHANNEL, 2021-2030 (USD MILLION)
TABLE 500 NEW ZEALAND STORE BASED IN RAISINS MARKET, BY DISTRIBUTION CHANNEL, 2021-2030 (USD MILLION)
TABLE 501 NEW ZEALAND NON-STORE BASED IN RAISINS MARKET, BY DISTRIBUTION CHANNEL, 2021-2030 (USD MILLION)
TABLE 502 MALAYSIA RAISINS MARKET, BY PRODUCT TYPE, 2021-2030 (USD MILLION)
TABLE 503 MALAYSIA RAISINS MARKET, BY DRYING METHOD, 2021-2030 (USD MILLION)
TABLE 504 MALAYSIA RAISINS MARKET, BY NATURE, 2021-2030 (USD MILLION)
TABLE 505 MALAYSIA RAISINS MARKET, BY END USE, 2021-2030 (USD MILLION)
TABLE 506 MALAYSIA HOUSEHOLD/RETAIL IN RAISINS MARKET, BY PRODUCT TYPE, 2021-2030 (USD MILLION)
TABLE 507 MALAYSIA FOOD PROCESSING SECTOR IN RAISINS MARKET, BY APPLICATION, 2021-2030 (USD MILLION)
TABLE 508 MALAYSIA BAKERY PRODUCTS IN RAISINS MARKET, BY TYPE, 2021-2030 (USD MILLION)
TABLE 509 MALAYSIA CONFECTIONARY IN RAISINS MARKET, BY TYPE, 2021-2030 (USD MILLION)
TABLE 510 MALAYSIA SPORTS NUTRITION IN RAISINS MARKET, BY TYPE, 2021-2030 (USD MILLION)
TABLE 511 MALAYSIA DAIRY PRODUCTS IN RAISINS MARKET, BY TYPE, 2021-2030 (USD MILLION)
TABLE 512 MALAYSIA BEVERAGES IN RAISINS MARKET, BY TYPE, 2021-2030 (USD MILLION)
TABLE 513 MALAYSIA FOOD PROCESSING SECTOR IN RAISINS MARKET, BY PRODUCT TYPE, 2021-2030 (USD MILLION)
TABLE 514 MALAYSIA FOOD SERVICE SECTOR IN RAISINS MARKET, BY APPLICATION, 2021-2030 (USD MILLION)
TABLE 515 MALAYSIA FOOD SERVICE SECTOR IN RAISINS MARKET, BY PRODUCT TYPE, 2021-2030 (USD MILLION)
TABLE 516 MALAYSIA NUTRACEUTICALS IN RAISINS MARKET, BY PRODUCT TYPE, 2021-2030 (USD MILLION)
TABLE 517 MALAYSIA RAISINS MARKET, BY DISTRIBUTION CHANNEL, 2021-2030 (USD MILLION)
TABLE 518 MALAYSIA INDIRECT IN RAISINS MARKET, BY DISTRIBUTION CHANNEL, 2021-2030 (USD MILLION)
TABLE 519 MALAYSIA STORE BASED IN RAISINS MARKET, BY DISTRIBUTION CHANNEL, 2021-2030 (USD MILLION)
TABLE 520 MALAYSIA NON-STORE BASED IN RAISINS MARKET, BY DISTRIBUTION CHANNEL, 2021-2030 (USD MILLION)
TABLE 521 SINGAPORE RAISINS MARKET, BY PRODUCT TYPE, 2021-2030 (USD MILLION)
TABLE 522 SINGAPORE RAISINS MARKET, BY DRYING METHOD, 2021-2030 (USD MILLION)
TABLE 523 SINGAPORE RAISINS MARKET, BY NATURE, 2021-2030 (USD MILLION)
TABLE 524 SINGAPORE RAISINS MARKET, BY END USE, 2021-2030 (USD MILLION)
TABLE 525 SINGAPORE HOUSEHOLD/RETAIL IN RAISINS MARKET, BY PRODUCT TYPE, 2021-2030 (USD MILLION)
TABLE 526 SINGAPORE FOOD PROCESSING SECTOR IN RAISINS MARKET, BY APPLICATION, 2021-2030 (USD MILLION)
TABLE 527 SINGAPORE BAKERY PRODUCTS IN RAISINS MARKET, BY TYPE, 2021-2030 (USD MILLION)
TABLE 528 SINGAPORE CONFECTIONARY IN RAISINS MARKET, BY TYPE, 2021-2030 (USD MILLION)
TABLE 529 SINGAPORE SPORTS NUTRITION IN RAISINS MARKET, BY TYPE, 2021-2030 (USD MILLION)
TABLE 530 SINGAPORE DAIRY PRODUCTS IN RAISINS MARKET, BY TYPE, 2021-2030 (USD MILLION)
TABLE 531 SINGAPORE BEVERAGES IN RAISINS MARKET, BY TYPE, 2021-2030 (USD MILLION)
TABLE 532 SINGAPORE FOOD PROCESSING SECTOR IN RAISINS MARKET, BY PRODUCT TYPE, 2021-2030 (USD MILLION)
TABLE 533 SINGAPORE FOOD SERVICE SECTOR IN RAISINS MARKET, BY APPLICATION, 2021-2030 (USD MILLION)
TABLE 534 SINGAPORE FOOD SERVICE SECTOR IN RAISINS MARKET, BY PRODUCT TYPE, 2021-2030 (USD MILLION)
TABLE 535 SINGAPORE NUTRACEUTICALS IN RAISINS MARKET, BY PRODUCT TYPE, 2021-2030 (USD MILLION)
TABLE 536 SINGAPORE RAISINS MARKET, BY DISTRIBUTION CHANNEL, 2021-2030 (USD MILLION)
TABLE 537 SINGAPORE INDIRECT IN RAISINS MARKET, BY DISTRIBUTION CHANNEL, 2021-2030 (USD MILLION)
TABLE 538 SINGAPORE STORE BASED IN RAISINS MARKET, BY DISTRIBUTION CHANNEL, 2021-2030 (USD MILLION)
TABLE 539 SINGAPORE NON-STORE BASED IN RAISINS MARKET, BY DISTRIBUTION CHANNEL, 2021-2030 (USD MILLION)
TABLE 540 REST OF ASIA-PACIFIC RAISINS MARKET, BY PRODUCT TYPE, 2021-2030 (USD MILLION)
TABLE 541 NORTH AMERICA RAISINS MARKET, BY COUNTRY, 2021-2030 (USD MILLION)
TABLE 542 NORTH AMERICA RAISINS MARKET, BY PRODUCT TYPE, 2021-2030 (USD MILLION)
TABLE 543 NORTH AMERICA RAISINS MARKET, BY DRYING METHOD, 2021-2030 (USD MILLION)
TABLE 544 NORTH AMERICA RAISINS MARKET, BY NATURE, 2021-2030 (USD MILLION)
TABLE 545 NORTH AMERICA RAISINS MARKET, BY END USE, 2021-2030 (USD MILLION)
TABLE 546 NORTH AMERICA HOUSEHOLD/RETAIL IN RAISINS MARKET, BY PRODUCT TYPE, 2021-2030 (USD MILLION)
TABLE 547 NORTH AMERICA FOOD PROCESSING SECTOR IN RAISINS MARKET, BY APPLICATION, 2021-2030 (USD MILLION)
TABLE 548 NORTH AMERICA BAKERY PRODUCTS IN RAISINS MARKET, BY TYPE, 2021-2030 (USD MILLION)
TABLE 549 NORTH AMERICA CONFECTIONARY IN RAISINS MARKET, BY TYPE, 2021-2030 (USD MILLION)
TABLE 550 NORTH AMERICA SPORTS NUTRITION IN RAISINS MARKET, BY TYPE, 2021-2030 (USD MILLION)
TABLE 551 NORTH AMERICA DAIRY PRODUCTS IN RAISINS MARKET, BY TYPE, 2021-2030 (USD MILLION)
TABLE 552 NORTH AMERICA BEVERAGES IN RAISINS MARKET, BY TYPE, 2021-2030 (USD MILLION)
TABLE 553 NORTH AMERICA FOOD PROCESSING SECTOR IN RAISINS MARKET, BY PRODUCT TYPE, 2021-2030 (USD MILLION)
TABLE 554 NORTH AMERICA FOOD SERVICE SECTOR IN RAISINS MARKET, BY APPLICATION, 2021-2030 (USD MILLION)
TABLE 555 NORTH AMERICA FOOD SERVICE SECTOR IN RAISINS MARKET, BY PRODUCT TYPE, 2021-2030 (USD MILLION)
TABLE 556 NORTH AMERICA NUTRACEUTICALS IN RAISINS MARKET, BY PRODUCT TYPE, 2021-2030 (USD MILLION)
TABLE 557 NORTH AMERICA RAISINS MARKET, BY DISTRIBUTION CHANNEL, 2021-2030 (USD MILLION)
TABLE 558 NORTH AMERICA INDIRECT IN RAISINS MARKET, BY DISTRIBUTION CHANNEL, 2021-2030 (USD MILLION)
TABLE 559 NORTH AMERICA STORE BASED IN RAISINS MARKET, BY DISTRIBUTION CHANNEL, 2021-2030 (USD MILLION)
TABLE 560 NORTH AMERICA NON-STORE BASED IN RAISINS MARKET, BY DISTRIBUTION CHANNEL, 2021-2030 (USD MILLION)
TABLE 561 U.S. RAISINS MARKET, BY PRODUCT TYPE, 2021-2030 (USD MILLION)
TABLE 562 U.S. RAISINS MARKET, BY DRYING METHOD, 2021-2030 (USD MILLION)
TABLE 563 U.S. RAISINS MARKET, BY NATURE, 2021-2030 (USD MILLION)
TABLE 564 U.S. RAISINS MARKET, BY END USE, 2021-2030 (USD MILLION)
TABLE 565 U.S. HOUSEHOLD/RETAIL IN RAISINS MARKET, BY PRODUCT TYPE, 2021-2030 (USD MILLION)
TABLE 566 U.S. FOOD PROCESSING SECTOR IN RAISINS MARKET, BY APPLICATION, 2021-2030 (USD MILLION)
TABLE 567 U.S. BAKERY PRODUCTS IN RAISINS MARKET, BY TYPE, 2021-2030 (USD MILLION)
TABLE 568 U.S. CONFECTIONARY IN RAISINS MARKET, BY TYPE, 2021-2030 (USD MILLION)
TABLE 569 U.S. SPORTS NUTRITION IN RAISINS MARKET, BY TYPE, 2021-2030 (USD MILLION)
TABLE 570 U.S. DAIRY PRODUCTS IN RAISINS MARKET, BY TYPE, 2021-2030 (USD MILLION)
TABLE 571 U.S. BEVERAGES IN RAISINS MARKET, BY TYPE, 2021-2030 (USD MILLION)
TABLE 572 U.S. FOOD PROCESSING SECTOR IN RAISINS MARKET, BY PRODUCT TYPE, 2021-2030 (USD MILLION)
TABLE 573 U.S. FOOD SERVICE SECTOR IN RAISINS MARKET, BY APPLICATION, 2021-2030 (USD MILLION)
TABLE 574 U.S. FOOD SERVICE SECTOR IN RAISINS MARKET, BY PRODUCT TYPE, 2021-2030 (USD MILLION)
TABLE 575 U.S. NUTRACEUTICALS IN RAISINS MARKET, BY PRODUCT TYPE, 2021-2030 (USD MILLION)
TABLE 576 U.S. RAISINS MARKET, BY DISTRIBUTION CHANNEL, 2021-2030 (USD MILLION)
TABLE 577 U.S. INDIRECT IN RAISINS MARKET, BY DISTRIBUTION CHANNEL, 2021-2030 (USD MILLION)
TABLE 578 U.S. STORE BASED IN RAISINS MARKET, BY DISTRIBUTION CHANNEL, 2021-2030 (USD MILLION)
TABLE 579 U.S. NON-STORE BASED IN RAISINS MARKET, BY DISTRIBUTION CHANNEL, 2021-2030 (USD MILLION)
TABLE 580 CANADA RAISINS MARKET, BY PRODUCT TYPE, 2021-2030 (USD MILLION)
TABLE 581 CANADA RAISINS MARKET, BY DRYING METHOD, 2021-2030 (USD MILLION)
TABLE 582 CANADA RAISINS MARKET, BY NATURE, 2021-2030 (USD MILLION)
TABLE 583 CANADA RAISINS MARKET, BY END USE, 2021-2030 (USD MILLION)
TABLE 584 CANADA HOUSEHOLD/RETAIL IN RAISINS MARKET, BY PRODUCT TYPE, 2021-2030 (USD MILLION)
TABLE 585 CANADA FOOD PROCESSING SECTOR IN RAISINS MARKET, BY APPLICATION, 2021-2030 (USD MILLION)
TABLE 586 CANADA BAKERY PRODUCTS IN RAISINS MARKET, BY TYPE, 2021-2030 (USD MILLION)
TABLE 587 CANADA CONFECTIONARY IN RAISINS MARKET, BY TYPE, 2021-2030 (USD MILLION)
TABLE 588 CANADA SPORTS NUTRITION IN RAISINS MARKET, BY TYPE, 2021-2030 (USD MILLION)
TABLE 589 CANADA DAIRY PRODUCTS IN RAISINS MARKET, BY TYPE, 2021-2030 (USD MILLION)
TABLE 590 CANADA BEVERAGES IN RAISINS MARKET, BY TYPE, 2021-2030 (USD MILLION)
TABLE 591 CANADA FOOD PROCESSING SECTOR IN RAISINS MARKET, BY PRODUCT TYPE, 2021-2030 (USD MILLION)
TABLE 592 CANADA FOOD SERVICE SECTOR IN RAISINS MARKET, BY APPLICATION, 2021-2030 (USD MILLION)
TABLE 593 CANADA FOOD SERVICE SECTOR IN RAISINS MARKET, BY PRODUCT TYPE, 2021-2030 (USD MILLION)
TABLE 594 CANADA NUTRACEUTICALS IN RAISINS MARKET, BY PRODUCT TYPE, 2021-2030 (USD MILLION)
TABLE 595 CANADA RAISINS MARKET, BY DISTRIBUTION CHANNEL, 2021-2030 (USD MILLION)
TABLE 596 CANADA INDIRECT IN RAISINS MARKET, BY DISTRIBUTION CHANNEL, 2021-2030 (USD MILLION)
TABLE 597 CANADA STORE BASED IN RAISINS MARKET, BY DISTRIBUTION CHANNEL, 2021-2030 (USD MILLION)
TABLE 598 CANADA NON-STORE BASED IN RAISINS MARKET, BY DISTRIBUTION CHANNEL, 2021-2030 (USD MILLION)
TABLE 599 MEXICO RAISINS MARKET, BY PRODUCT TYPE, 2021-2030 (USD MILLION)
TABLE 600 MEXICO RAISINS MARKET, BY DRYING METHOD, 2021-2030 (USD MILLION)
TABLE 601 MEXICO RAISINS MARKET, BY NATURE, 2021-2030 (USD MILLION)
TABLE 602 MEXICO RAISINS MARKET, BY END USE, 2021-2030 (USD MILLION)
TABLE 603 MEXICO HOUSEHOLD/RETAIL IN RAISINS MARKET, BY PRODUCT TYPE, 2021-2030 (USD MILLION)
TABLE 604 MEXICO FOOD PROCESSING SECTOR IN RAISINS MARKET, BY APPLICATION, 2021-2030 (USD MILLION)
TABLE 605 MEXICO BAKERY PRODUCTS IN RAISINS MARKET, BY TYPE, 2021-2030 (USD MILLION)
TABLE 606 MEXICO CONFECTIONARY IN RAISINS MARKET, BY TYPE, 2021-2030 (USD MILLION)
TABLE 607 MEXICO SPORTS NUTRITION IN RAISINS MARKET, BY TYPE, 2021-2030 (USD MILLION)
TABLE 608 MEXICO DAIRY PRODUCTS IN RAISINS MARKET, BY TYPE, 2021-2030 (USD MILLION)
TABLE 609 MEXICO BEVERAGES IN RAISINS MARKET, BY TYPE, 2021-2030 (USD MILLION)
TABLE 610 MEXICO FOOD PROCESSING SECTOR IN RAISINS MARKET, BY PRODUCT TYPE, 2021-2030 (USD MILLION)
TABLE 611 MEXICO FOOD SERVICE SECTOR IN RAISINS MARKET, BY APPLICATION, 2021-2030 (USD MILLION)
TABLE 612 MEXICO FOOD SERVICE SECTOR IN RAISINS MARKET, BY PRODUCT TYPE, 2021-2030 (USD MILLION)
TABLE 613 MEXICO NUTRACEUTICALS IN RAISINS MARKET, BY PRODUCT TYPE, 2021-2030 (USD MILLION)
TABLE 614 MEXICO RAISINS MARKET, BY DISTRIBUTION CHANNEL, 2021-2030 (USD MILLION)
TABLE 615 MEXICO INDIRECT IN RAISINS MARKET, BY DISTRIBUTION CHANNEL, 2021-2030 (USD MILLION)
TABLE 616 MEXICO STORE BASED IN RAISINS MARKET, BY DISTRIBUTION CHANNEL, 2021-2030 (USD MILLION)
TABLE 617 MEXICO NON-STORE BASED IN RAISINS MARKET, BY DISTRIBUTION CHANNEL, 2021-2030 (USD MILLION)
TABLE 618 MIDDLE EAST AND AFRICA RAISINS MARKET, BY COUNTRY, 2021-2030 (USD MILLION)
TABLE 619 MIDDLE EAST AND AFRICA RAISINS MARKET, BY PRODUCT TYPE, 2021-2030 (USD MILLION)
TABLE 620 MIDDLE EAST AND AFRICA RAISINS MARKET, BY DRYING METHOD, 2021-2030 (USD MILLION)
TABLE 621 MIDDLE EAST AND AFRICA RAISINS MARKET, BY NATURE, 2021-2030 (USD MILLION)
TABLE 622 MIDDLE EAST AND AFRICA RAISINS MARKET, BY END USE, 2021-2030 (USD MILLION)
TABLE 623 MIDDLE EAST AND AFRICA HOUSEHOLD/RETAIL IN RAISINS MARKET, BY PRODUCT TYPE, 2021-2030 (USD MILLION)
TABLE 624 MIDDLE EAST AND AFRICA FOOD PROCESSING SECTOR IN RAISINS MARKET, BY APPLICATION, 2021-2030 (USD MILLION)
TABLE 625 MIDDLE EAST AND AFRICA BAKERY PRODUCTS IN RAISINS MARKET, BY TYPE, 2021-2030 (USD MILLION)
TABLE 626 MIDDLE EAST AND AFRICA CONFECTIONARY IN RAISINS MARKET, BY TYPE, 2021-2030 (USD MILLION)
TABLE 627 MIDDLE EAST AND AFRICA SPORTS NUTRITION IN RAISINS MARKET, BY TYPE, 2021-2030 (USD MILLION)
TABLE 628 MIDDLE EAST AND AFRICA DAIRY PRODUCTS IN RAISINS MARKET, BY TYPE, 2021-2030 (USD MILLION)
TABLE 629 MIDDLE EAST AND AFRICA BEVERAGES IN RAISINS MARKET, BY TYPE, 2021-2030 (USD MILLION)
TABLE 630 MIDDLE EAST AND AFRICA FOOD PROCESSING SECTOR IN RAISINS MARKET, BY PRODUCT TYPE, 2021-2030 (USD MILLION)
TABLE 631 MIDDLE EAST AND AFRICA FOOD SERVICE SECTOR IN RAISINS MARKET, BY APPLICATION, 2021-2030 (USD MILLION)
TABLE 632 MIDDLE EAST AND AFRICA FOOD SERVICE SECTOR IN RAISINS MARKET, BY PRODUCT TYPE, 2021-2030 (USD MILLION)
TABLE 633 MIDDLE EAST AND AFRICA NUTRACEUTICALS IN RAISINS MARKET, BY PRODUCT TYPE, 2021-2030 (USD MILLION)
TABLE 634 MIDDLE EAST AND AFRICA RAISINS MARKET, BY DISTRIBUTION CHANNEL, 2021-2030 (USD MILLION)
TABLE 635 MIDDLE EAST AND AFRICA INDIRECT IN RAISINS MARKET, BY DISTRIBUTION CHANNEL, 2021-2030 (USD MILLION)
TABLE 636 MIDDLE EAST AND AFRICA STORE BASED IN RAISINS MARKET, BY DISTRIBUTION CHANNEL, 2021-2030 (USD MILLION)
TABLE 637 MIDDLE EAST AND AFRICA NON-STORE BASED IN RAISINS MARKET, BY DISTRIBUTION CHANNEL, 2021-2030 (USD MILLION)
TABLE 638 SOUTH AFRICA RAISINS MARKET, BY PRODUCT TYPE, 2021-2030 (USD MILLION)
TABLE 639 SOUTH AFRICA RAISINS MARKET, BY DRYING METHOD, 2021-2030 (USD MILLION)
TABLE 640 SOUTH AFRICA RAISINS MARKET, BY NATURE, 2021-2030 (USD MILLION)
TABLE 641 SOUTH AFRICA RAISINS MARKET, BY END USE, 2021-2030 (USD MILLION)
TABLE 642 SOUTH AFRICA HOUSEHOLD/RETAIL IN RAISINS MARKET, BY PRODUCT TYPE, 2021-2030 (USD MILLION)
TABLE 643 SOUTH AFRICA FOOD PROCESSING SECTOR IN RAISINS MARKET, BY APPLICATION, 2021-2030 (USD MILLION)
TABLE 644 SOUTH AFRICA BAKERY PRODUCTS IN RAISINS MARKET, BY TYPE, 2021-2030 (USD MILLION)
TABLE 645 SOUTH AFRICA CONFECTIONARY IN RAISINS MARKET, BY TYPE, 2021-2030 (USD MILLION)
TABLE 646 SOUTH AFRICA SPORTS NUTRITION IN RAISINS MARKET, BY TYPE, 2021-2030 (USD MILLION)
TABLE 647 SOUTH AFRICA DAIRY PRODUCTS IN RAISINS MARKET, BY TYPE, 2021-2030 (USD MILLION)
TABLE 648 SOUTH AFRICA BEVERAGES IN RAISINS MARKET, BY TYPE, 2021-2030 (USD MILLION)
TABLE 649 SOUTH AFRICA FOOD PROCESSING SECTOR IN RAISINS MARKET, BY PRODUCT TYPE, 2021-2030 (USD MILLION)
TABLE 650 SOUTH AFRICA FOOD SERVICE SECTOR IN RAISINS MARKET, BY APPLICATION, 2021-2030 (USD MILLION)
TABLE 651 SOUTH AFRICA FOOD SERVICE SECTOR IN RAISINS MARKET, BY PRODUCT TYPE, 2021-2030 (USD MILLION)
TABLE 652 SOUTH AFRICA NUTRACEUTICALS IN RAISINS MARKET, BY PRODUCT TYPE, 2021-2030 (USD MILLION)
TABLE 653 SOUTH AFRICA RAISINS MARKET, BY DISTRIBUTION CHANNEL, 2021-2030 (USD MILLION)
TABLE 654 SOUTH AFRICA INDIRECT IN RAISINS MARKET, BY DISTRIBUTION CHANNEL, 2021-2030 (USD MILLION)
TABLE 655 SOUTH AFRICA STORE BASED IN RAISINS MARKET, BY DISTRIBUTION CHANNEL, 2021-2030 (USD MILLION)
TABLE 656 SOUTH AFRICA NON-STORE BASED IN RAISINS MARKET, BY DISTRIBUTION CHANNEL, 2021-2030 (USD MILLION)
TABLE 657 SAUDI ARABIA RAISINS MARKET, BY PRODUCT TYPE, 2021-2030 (USD MILLION)
TABLE 658 SAUDI ARABIA RAISINS MARKET, BY DRYING METHOD, 2021-2030 (USD MILLION)
TABLE 659 SAUDI ARABIA RAISINS MARKET, BY NATURE, 2021-2030 (USD MILLION)
TABLE 660 SAUDI ARABIA RAISINS MARKET, BY END USE, 2021-2030 (USD MILLION)
TABLE 661 SAUDI ARABIA HOUSEHOLD/RETAIL IN RAISINS MARKET, BY PRODUCT TYPE, 2021-2030 (USD MILLION)
TABLE 662 SAUDI ARABIA FOOD PROCESSING SECTOR IN RAISINS MARKET, BY APPLICATION, 2021-2030 (USD MILLION)
TABLE 663 SAUDI ARABIA BAKERY PRODUCTS IN RAISINS MARKET, BY TYPE, 2021-2030 (USD MILLION)
TABLE 664 SAUDI ARABIA CONFECTIONARY IN RAISINS MARKET, BY TYPE, 2021-2030 (USD MILLION)
TABLE 665 SAUDI ARABIA SPORTS NUTRITION IN RAISINS MARKET, BY TYPE, 2021-2030 (USD MILLION)
TABLE 666 SAUDI ARABIA DAIRY PRODUCTS IN RAISINS MARKET, BY TYPE, 2021-2030 (USD MILLION)
TABLE 667 SAUDI ARABIA BEVERAGES IN RAISINS MARKET, BY TYPE, 2021-2030 (USD MILLION)
TABLE 668 SAUDI ARABIA FOOD PROCESSING SECTOR IN RAISINS MARKET, BY PRODUCT TYPE, 2021-2030 (USD MILLION)
TABLE 669 SAUDI ARABIA FOOD SERVICE SECTOR IN RAISINS MARKET, BY APPLICATION, 2021-2030 (USD MILLION)
TABLE 670 SAUDI ARABIA FOOD SERVICE SECTOR IN RAISINS MARKET, BY PRODUCT TYPE, 2021-2030 (USD MILLION)
TABLE 671 SAUDI ARABIA NUTRACEUTICALS IN RAISINS MARKET, BY PRODUCT TYPE, 2021-2030 (USD MILLION)
TABLE 672 SAUDI ARABIA RAISINS MARKET, BY DISTRIBUTION CHANNEL, 2021-2030 (USD MILLION)
TABLE 673 SAUDI ARABIA INDIRECT IN RAISINS MARKET, BY DISTRIBUTION CHANNEL, 2021-2030 (USD MILLION)
TABLE 674 SAUDI ARABIA STORE BASED IN RAISINS MARKET, BY DISTRIBUTION CHANNEL, 2021-2030 (USD MILLION)
TABLE 675 SAUDI ARABIA NON-STORE BASED IN RAISINS MARKET, BY DISTRIBUTION CHANNEL, 2021-2030 (USD MILLION)
TABLE 676 UAE RAISINS MARKET, BY PRODUCT TYPE, 2021-2030 (USD MILLION)
TABLE 677 UAE RAISINS MARKET, BY DRYING METHOD, 2021-2030 (USD MILLION)
TABLE 678 UAE RAISINS MARKET, BY NATURE, 2021-2030 (USD MILLION)
TABLE 679 UAE RAISINS MARKET, BY END USE, 2021-2030 (USD MILLION)
TABLE 680 UAE HOUSEHOLD/RETAIL IN RAISINS MARKET, BY PRODUCT TYPE, 2021-2030 (USD MILLION)
TABLE 681 UAE FOOD PROCESSING SECTOR IN RAISINS MARKET, BY APPLICATION, 2021-2030 (USD MILLION)
TABLE 682 UAE BAKERY PRODUCTS IN RAISINS MARKET, BY TYPE, 2021-2030 (USD MILLION)
TABLE 683 UAE CONFECTIONARY IN RAISINS MARKET, BY TYPE, 2021-2030 (USD MILLION)
TABLE 684 UAE SPORTS NUTRITION IN RAISINS MARKET, BY TYPE, 2021-2030 (USD MILLION)
TABLE 685 UAE DAIRY PRODUCTS IN RAISINS MARKET, BY TYPE, 2021-2030 (USD MILLION)
TABLE 686 UAE BEVERAGES IN RAISINS MARKET, BY TYPE, 2021-2030 (USD MILLION)
TABLE 687 UAE FOOD PROCESSING SECTOR IN RAISINS MARKET, BY PRODUCT TYPE, 2021-2030 (USD MILLION)
TABLE 688 UAE FOOD SERVICE SECTOR IN RAISINS MARKET, BY APPLICATION, 2021-2030 (USD MILLION)
TABLE 689 UAE FOOD SERVICE SECTOR IN RAISINS MARKET, BY PRODUCT TYPE, 2021-2030 (USD MILLION)
TABLE 690 UAE NUTRACEUTICALS IN RAISINS MARKET, BY PRODUCT TYPE, 2021-2030 (USD MILLION)
TABLE 691 UAE RAISINS MARKET, BY DISTRIBUTION CHANNEL, 2021-2030 (USD MILLION)
TABLE 692 UAE INDIRECT IN RAISINS MARKET, BY DISTRIBUTION CHANNEL, 2021-2030 (USD MILLION)
TABLE 693 UAE STORE BASED IN RAISINS MARKET, BY DISTRIBUTION CHANNEL, 2021-2030 (USD MILLION)
TABLE 694 UAE NON-STORE BASED IN RAISINS MARKET, BY DISTRIBUTION CHANNEL, 2021-2030 (USD MILLION)
TABLE 695 KUWAIT RAISINS MARKET, BY PRODUCT TYPE, 2021-2030 (USD MILLION)
TABLE 696 KUWAIT RAISINS MARKET, BY DRYING METHOD, 2021-2030 (USD MILLION)
TABLE 697 KUWAIT RAISINS MARKET, BY NATURE, 2021-2030 (USD MILLION)
TABLE 698 KUWAIT RAISINS MARKET, BY END USE, 2021-2030 (USD MILLION)
TABLE 699 KUWAIT HOUSEHOLD/RETAIL IN RAISINS MARKET, BY PRODUCT TYPE, 2021-2030 (USD MILLION)
TABLE 700 KUWAIT FOOD PROCESSING SECTOR IN RAISINS MARKET, BY APPLICATION, 2021-2030 (USD MILLION)
TABLE 701 KUWAIT BAKERY PRODUCTS IN RAISINS MARKET, BY TYPE, 2021-2030 (USD MILLION)
TABLE 702 KUWAIT CONFECTIONARY IN RAISINS MARKET, BY TYPE, 2021-2030 (USD MILLION)
TABLE 703 KUWAIT SPORTS NUTRITION IN RAISINS MARKET, BY TYPE, 2021-2030 (USD MILLION)
TABLE 704 KUWAIT DAIRY PRODUCTS IN RAISINS MARKET, BY TYPE, 2021-2030 (USD MILLION)
TABLE 705 KUWAIT BEVERAGES IN RAISINS MARKET, BY TYPE, 2021-2030 (USD MILLION)
TABLE 706 KUWAIT FOOD PROCESSING SECTOR IN RAISINS MARKET, BY PRODUCT TYPE, 2021-2030 (USD MILLION)
TABLE 707 KUWAIT FOOD SERVICE SECTOR IN RAISINS MARKET, BY APPLICATION, 2021-2030 (USD MILLION)
TABLE 708 KUWAIT FOOD SERVICE SECTOR IN RAISINS MARKET, BY PRODUCT TYPE, 2021-2030 (USD MILLION)
TABLE 709 KUWAIT NUTRACEUTICALS IN RAISINS MARKET, BY PRODUCT TYPE, 2021-2030 (USD MILLION)
TABLE 710 KUWAIT RAISINS MARKET, BY DISTRIBUTION CHANNEL, 2021-2030 (USD MILLION)
TABLE 711 KUWAIT INDIRECT IN RAISINS MARKET, BY DISTRIBUTION CHANNEL, 2021-2030 (USD MILLION)
TABLE 712 KUWAIT STORE BASED IN RAISINS MARKET, BY DISTRIBUTION CHANNEL, 2021-2030 (USD MILLION)
TABLE 713 KUWAIT NON-STORE BASED IN RAISINS MARKET, BY DISTRIBUTION CHANNEL, 2021-2030 (USD MILLION)
TABLE 714 OMAN RAISINS MARKET, BY PRODUCT TYPE, 2021-2030 (USD MILLION)
TABLE 715 OMAN RAISINS MARKET, BY DRYING METHOD, 2021-2030 (USD MILLION)
TABLE 716 OMAN RAISINS MARKET, BY NATURE, 2021-2030 (USD MILLION)
TABLE 717 OMAN RAISINS MARKET, BY END USE, 2021-2030 (USD MILLION)
TABLE 718 OMAN HOUSEHOLD/RETAIL IN RAISINS MARKET, BY PRODUCT TYPE, 2021-2030 (USD MILLION)
TABLE 719 OMAN FOOD PROCESSING SECTOR IN RAISINS MARKET, BY APPLICATION, 2021-2030 (USD MILLION)
TABLE 720 OMAN BAKERY PRODUCTS IN RAISINS MARKET, BY TYPE, 2021-2030 (USD MILLION)
TABLE 721 OMAN CONFECTIONARY IN RAISINS MARKET, BY TYPE, 2021-2030 (USD MILLION)
TABLE 722 OMAN SPORTS NUTRITION IN RAISINS MARKET, BY TYPE, 2021-2030 (USD MILLION)
TABLE 723 OMAN DAIRY PRODUCTS IN RAISINS MARKET, BY TYPE, 2021-2030 (USD MILLION)
TABLE 724 OMAN BEVERAGES IN RAISINS MARKET, BY TYPE, 2021-2030 (USD MILLION)
TABLE 725 OMAN FOOD PROCESSING SECTOR IN RAISINS MARKET, BY PRODUCT TYPE, 2021-2030 (USD MILLION)
TABLE 726 OMAN FOOD SERVICE SECTOR IN RAISINS MARKET, BY APPLICATION, 2021-2030 (USD MILLION)
TABLE 727 OMAN FOOD SERVICE SECTOR IN RAISINS MARKET, BY PRODUCT TYPE, 2021-2030 (USD MILLION)
TABLE 728 OMAN NUTRACEUTICALS IN RAISINS MARKET, BY PRODUCT TYPE, 2021-2030 (USD MILLION)
TABLE 729 OMAN RAISINS MARKET, BY DISTRIBUTION CHANNEL, 2021-2030 (USD MILLION)
TABLE 730 OMAN INDIRECT IN RAISINS MARKET, BY DISTRIBUTION CHANNEL, 2021-2030 (USD MILLION)
TABLE 731 OMAN STORE BASED IN RAISINS MARKET, BY DISTRIBUTION CHANNEL, 2021-2030 (USD MILLION)
TABLE 732 OMAN NON-STORE BASED IN RAISINS MARKET, BY DISTRIBUTION CHANNEL, 2021-2030 (USD MILLION)
TABLE 733 QATAR RAISINS MARKET, BY PRODUCT TYPE, 2021-2030 (USD MILLION)
TABLE 734 QATAR RAISINS MARKET, BY DRYING METHOD, 2021-2030 (USD MILLION)
TABLE 735 QATAR RAISINS MARKET, BY NATURE, 2021-2030 (USD MILLION)
TABLE 736 QATAR RAISINS MARKET, BY END USE, 2021-2030 (USD MILLION)
TABLE 737 QATAR HOUSEHOLD/RETAIL IN RAISINS MARKET, BY PRODUCT TYPE, 2021-2030 (USD MILLION)
TABLE 738 QATAR FOOD PROCESSING SECTOR IN RAISINS MARKET, BY APPLICATION, 2021-2030 (USD MILLION)
TABLE 739 QATAR BAKERY PRODUCTS IN RAISINS MARKET, BY TYPE, 2021-2030 (USD MILLION)
TABLE 740 QATAR CONFECTIONARY IN RAISINS MARKET, BY TYPE, 2021-2030 (USD MILLION)
TABLE 741 QATAR SPORTS NUTRITION IN RAISINS MARKET, BY TYPE, 2021-2030 (USD MILLION)
TABLE 742 QATAR DAIRY PRODUCTS IN RAISINS MARKET, BY TYPE, 2021-2030 (USD MILLION)
TABLE 743 QATAR BEVERAGES IN RAISINS MARKET, BY TYPE, 2021-2030 (USD MILLION)
TABLE 744 QATAR FOOD PROCESSING SECTOR IN RAISINS MARKET, BY PRODUCT TYPE, 2021-2030 (USD MILLION)
TABLE 745 QATAR FOOD SERVICE SECTOR IN RAISINS MARKET, BY APPLICATION, 2021-2030 (USD MILLION)
TABLE 746 QATAR FOOD SERVICE SECTOR IN RAISINS MARKET, BY PRODUCT TYPE, 2021-2030 (USD MILLION)
TABLE 747 QATAR NUTRACEUTICALS IN RAISINS MARKET, BY PRODUCT TYPE, 2021-2030 (USD MILLION)
TABLE 748 QATAR RAISINS MARKET, BY DISTRIBUTION CHANNEL, 2021-2030 (USD MILLION)
TABLE 749 QATAR INDIRECT IN RAISINS MARKET, BY DISTRIBUTION CHANNEL, 2021-2030 (USD MILLION)
TABLE 750 QATAR STORE BASED IN RAISINS MARKET, BY DISTRIBUTION CHANNEL, 2021-2030 (USD MILLION)
TABLE 751 QATAR NON-STORE BASED IN RAISINS MARKET, BY DISTRIBUTION CHANNEL, 2021-2030 (USD MILLION)
TABLE 752 REST OF MIDDLE EAST AND AFRICA RAISINS MARKET, BY PRODUCT TYPE, 2021-2030 (USD MILLION)
TABLE 753 SOUTH AMERICA RAISINS MARKET, BY COUNTRY, 2021-2030 (USD MILLION)
TABLE 754 SOUTH AMERICA RAISINS MARKET, BY PRODUCT TYPE, 2021-2030 (USD MILLION)
TABLE 755 SOUTH AMERICA RAISINS MARKET, BY DRYING METHOD, 2021-2030 (USD MILLION)
TABLE 756 SOUTH AMERICA RAISINS MARKET, BY NATURE, 2021-2030 (USD MILLION)
TABLE 757 SOUTH AMERICA RAISINS MARKET, BY END USE, 2021-2030 (USD MILLION)
TABLE 758 SOUTH AMERICA HOUSEHOLD/RETAIL IN RAISINS MARKET, BY PRODUCT TYPE, 2021-2030 (USD MILLION)
TABLE 759 SOUTH AMERICA FOOD PROCESSING SECTOR IN RAISINS MARKET, BY APPLICATION, 2021-2030 (USD MILLION)
TABLE 760 SOUTH AMERICA BAKERY PRODUCTS IN RAISINS MARKET, BY TYPE, 2021-2030 (USD MILLION)
TABLE 761 SOUTH AMERICA CONFECTIONARY IN RAISINS MARKET, BY TYPE, 2021-2030 (USD MILLION)
TABLE 762 SOUTH AMERICA SPORTS NUTRITION IN RAISINS MARKET, BY TYPE, 2021-2030 (USD MILLION)
TABLE 763 SOUTH AMERICA DAIRY PRODUCTS IN RAISINS MARKET, BY TYPE, 2021-2030 (USD MILLION)
TABLE 764 SOUTH AMERICA BEVERAGES IN RAISINS MARKET, BY TYPE, 2021-2030 (USD MILLION)
TABLE 765 SOUTH AMERICA FOOD PROCESSING SECTOR IN RAISINS MARKET, BY PRODUCT TYPE, 2021-2030 (USD MILLION)
TABLE 766 SOUTH AMERICA FOOD SERVICE SECTOR IN RAISINS MARKET, BY APPLICATION, 2021-2030 (USD MILLION)
TABLE 767 SOUTH AMERICA FOOD SERVICE SECTOR IN RAISINS MARKET, BY PRODUCT TYPE, 2021-2030 (USD MILLION)
TABLE 768 SOUTH AMERICA NUTRACEUTICALS IN RAISINS MARKET, BY PRODUCT TYPE, 2021-2030 (USD MILLION)
TABLE 769 SOUTH AMERICA RAISINS MARKET, BY DISTRIBUTION CHANNEL, 2021-2030 (USD MILLION)
TABLE 770 SOUTH AMERICA INDIRECT IN RAISINS MARKET, BY DISTRIBUTION CHANNEL, 2021-2030 (USD MILLION)
TABLE 771 SOUTH AMERICA STORE BASED IN RAISINS MARKET, BY DISTRIBUTION CHANNEL, 2021-2030 (USD MILLION)
TABLE 772 SOUTH AMERICA NON-STORE BASED IN RAISINS MARKET, BY DISTRIBUTION CHANNEL, 2021-2030 (USD MILLION)
TABLE 773 BRAZIL RAISINS MARKET, BY PRODUCT TYPE, 2021-2030 (USD MILLION)
TABLE 774 BRAZIL RAISINS MARKET, BY DRYING METHOD, 2021-2030 (USD MILLION)
TABLE 775 BRAZIL RAISINS MARKET, BY NATURE, 2021-2030 (USD MILLION)
TABLE 776 BRAZIL RAISINS MARKET, BY END USE, 2021-2030 (USD MILLION)
TABLE 777 BRAZIL HOUSEHOLD/RETAIL IN RAISINS MARKET, BY PRODUCT TYPE, 2021-2030 (USD MILLION)
TABLE 778 BRAZIL FOOD PROCESSING SECTOR IN RAISINS MARKET, BY APPLICATION, 2021-2030 (USD MILLION)
TABLE 779 BRAZIL BAKERY PRODUCTS IN RAISINS MARKET, BY TYPE, 2021-2030 (USD MILLION)
TABLE 780 BRAZIL CONFECTIONARY IN RAISINS MARKET, BY TYPE, 2021-2030 (USD MILLION)
TABLE 781 BRAZIL SPORTS NUTRITION IN RAISINS MARKET, BY TYPE, 2021-2030 (USD MILLION)
TABLE 782 BRAZIL DAIRY PRODUCTS IN RAISINS MARKET, BY TYPE, 2021-2030 (USD MILLION)
TABLE 783 BRAZIL BEVERAGES IN RAISINS MARKET, BY TYPE, 2021-2030 (USD MILLION)
TABLE 784 BRAZIL FOOD PROCESSING SECTOR IN RAISINS MARKET, BY PRODUCT TYPE, 2021-2030 (USD MILLION)
TABLE 785 BRAZIL FOOD SERVICE SECTOR IN RAISINS MARKET, BY APPLICATION, 2021-2030 (USD MILLION)
TABLE 786 BRAZIL FOOD SERVICE SECTOR IN RAISINS MARKET, BY PRODUCT TYPE, 2021-2030 (USD MILLION)
TABLE 787 BRAZIL NUTRACEUTICALS IN RAISINS MARKET, BY PRODUCT TYPE, 2021-2030 (USD MILLION)
TABLE 788 BRAZIL RAISINS MARKET, BY DISTRIBUTION CHANNEL, 2021-2030 (USD MILLION)
TABLE 789 BRAZIL INDIRECT IN RAISINS MARKET, BY DISTRIBUTION CHANNEL, 2021-2030 (USD MILLION)
TABLE 790 BRAZIL STORE BASED IN RAISINS MARKET, BY DISTRIBUTION CHANNEL, 2021-2030 (USD MILLION)
TABLE 791 BRAZIL NON-STORE BASED IN RAISINS MARKET, BY DISTRIBUTION CHANNEL, 2021-2030 (USD MILLION)
TABLE 792 ARGENTINA RAISINS MARKET, BY PRODUCT TYPE, 2021-2030 (USD MILLION)
TABLE 793 ARGENTINA RAISINS MARKET, BY DRYING METHOD, 2021-2030 (USD MILLION)
TABLE 794 ARGENTINA RAISINS MARKET, BY NATURE, 2021-2030 (USD MILLION)
TABLE 795 ARGENTINA RAISINS MARKET, BY END USE, 2021-2030 (USD MILLION)
TABLE 796 ARGENTINA HOUSEHOLD/RETAIL IN RAISINS MARKET, BY PRODUCT TYPE, 2021-2030 (USD MILLION)
TABLE 797 ARGENTINA FOOD PROCESSING SECTOR IN RAISINS MARKET, BY APPLICATION, 2021-2030 (USD MILLION)
TABLE 798 ARGENTINA BAKERY PRODUCTS IN RAISINS MARKET, BY TYPE, 2021-2030 (USD MILLION)
TABLE 799 ARGENTINA CONFECTIONARY IN RAISINS MARKET, BY TYPE, 2021-2030 (USD MILLION)
TABLE 800 ARGENTINA SPORTS NUTRITION IN RAISINS MARKET, BY TYPE, 2021-2030 (USD MILLION)
TABLE 801 ARGENTINA DAIRY PRODUCTS IN RAISINS MARKET, BY TYPE, 2021-2030 (USD MILLION)
TABLE 802 ARGENTINA BEVERAGES IN RAISINS MARKET, BY TYPE, 2021-2030 (USD MILLION)
TABLE 803 ARGENTINA FOOD PROCESSING SECTOR IN RAISINS MARKET, BY PRODUCT TYPE, 2021-2030 (USD MILLION)
TABLE 804 ARGENTINA FOOD SERVICE SECTOR IN RAISINS MARKET, BY APPLICATION, 2021-2030 (USD MILLION)
TABLE 805 ARGENTINA FOOD SERVICE SECTOR IN RAISINS MARKET, BY PRODUCT TYPE, 2021-2030 (USD MILLION)
TABLE 806 ARGENTINA NUTRACEUTICALS IN RAISINS MARKET, BY PRODUCT TYPE, 2021-2030 (USD MILLION)
TABLE 807 ARGENTINA RAISINS MARKET, BY DISTRIBUTION CHANNEL, 2021-2030 (USD MILLION)
TABLE 808 ARGENTINA INDIRECT IN RAISINS MARKET, BY DISTRIBUTION CHANNEL, 2021-2030 (USD MILLION)
TABLE 809 ARGENTINA STORE BASED IN RAISINS MARKET, BY DISTRIBUTION CHANNEL, 2021-2030 (USD MILLION)
TABLE 810 ARGENTINA NON-STORE BASED IN RAISINS MARKET, BY DISTRIBUTION CHANNEL, 2021-2030 (USD MILLION)
TABLE 811 REST OF SOUTH AMERICA RAISINS MARKET, BY PRODUCT TYPE, 2021-2030 (USD MILLION)
Lista de figuras
FIGURE 1 GLOBAL RAISINS MARKET: SEGMENTATION
FIGURE 2 GLOBAL RAISINS MARKET: DATA TRIANGULATION
FIGURE 3 GLOBAL RAISINS MARKET : DROC ANALYSIS
FIGURE 4 GLOBAL RAISINS MARKET: GLOBAL VS REGIONAL MARKET ANALYSIS
FIGURE 5 GLOBAL RAISINS MARKET: COMPANY RESEARCH ANALYSIS
FIGURE 6 GLOBAL RAISINS MARKET: PRODUCT TYPE LIFELINE CURVE
FIGURE 7 GLOBAL RAISINS MARKET: MULTIVARIATE MODELLING
FIGURE 8 GLOBAL RAISINS MARKET: INTERVIEW DEMOGRAPHICS
FIGURE 9 GLOBAL RAISINS MARKET: DBMR MARKET POSITION GRID
FIGURE 10 GLOBAL RAISINS MARKET: MARKET END USE COVERAGE GRID
FIGURE 11 GLOBAL RAISINS MARKET VENDOR SHARE ANALYSIS
FIGURE 12 GLOBAL RAISINS MARKET: SEGMENTATION
FIGURE 13 EUROPE REGION IS EXPECTED TO DOMINATE THE GLOBAL RAISINS MARKET AND NORTH AMERICA REGION IS GROWING WITH THE HIGHEST CAGR IN THE FORECAST PERIOD OF 2023 TO 2030
FIGURE 14 RISING APPLICATION OF RAISINS IN FOOD AND BEVERAGE INDUSTRY IS DRIVING THE GROWTH OF THE GLOBAL RAISINS MARKET IN THE FORECAST PERIOD OF 2023 TO 2030
FIGURE 15 NATURAL SEEDLESS SUB-SEGMENT IN PRODUCT SEGMENT IS EXPECTED TO ACCOUNT FOR THE LARGEST SHARE OF THE GLOBAL RAISINS MARKET IN 2023 & 2030
FIGURE 16 NORTH AMERICA REGION IS THE FASTEST GROWING MARKET FOR RAISINS MANUFACTURERS IN THE FORECAST PERIOD OF 2023 TO 2030
FIGURE 17 GLOBAL RAISINS MARKET: FACTORS AFFECTING DISPOSABLE INCOME OR SPEND DYNAMICS OF THE CONSUMERS
FIGURE 18 SUPPLY CHAIN OF GLOBAL RAISINS MARKET
FIGURE 19 DRIVERS, RESTRAINTS, OPPORTUNITIES, AND CHALLENGES OF GLOBAL RAISINS MARKET
FIGURE 20 GLOBAL RAISINS MARKET: SNAPSHOT (2022)
FIGURE 21 GLOBAL RAISINS MARKET: BY REGION (2022)
FIGURE 22 GLOBAL RAISINS MARKET: BY REGION (2023 & 2030)
FIGURE 23 GLOBAL RAISINS MARKET: BY REGION (2022 & 2030)
FIGURE 24 GLOBAL RAISINS MARKET: BY PRODUCT TYPE (2023-2030)
FIGURE 25 EUROPE RAISINS MARKET: SNAPSHOT (2022)
FIGURE 26 EUROPE RAISINS MARKET: BY COUNTRY (2022)
FIGURE 27 EUROPE RAISINS MARKET: BY COUNTRY (2023 & 2030)
FIGURE 28 EUROPE RAISINS MARKET: BY COUNTRY (2022 & 2030)
FIGURE 29 EUROPE RAISINS MARKET: BY PRODUCT TYPE (2023-2030)
FIGURE 30 ASIA-PACIFIC RAISINS MARKET: SNAPSHOT (2022)
FIGURE 31 ASIA-PACIFIC RAISINS MARKET: BY COUNTRY (2022)
FIGURE 32 ASIA-PACIFIC RAISINS MARKET: BY COUNTRY (2023 & 2030)
FIGURE 33 ASIA-PACIFIC RAISINS MARKET: BY COUNTRY (2022 & 2030)
FIGURE 34 ASIA-PACIFIC RAISINS MARKET: BY PRODUCT TYPE (2023-2030)
FIGURE 35 NORTH AMERICA RAISINS MARKET: SNAPSHOT (2022)
FIGURE 36 NORTH AMERICA RAISINS MARKET: BY COUNTRY (2022)
FIGURE 37 NORTH AMERICA RAISINS MARKET: BY COUNTRY (2023 & 2030)
FIGURE 38 NORTH AMERICA RAISINS MARKET: BY COUNTRY (2022 & 2030)
FIGURE 39 NORTH AMERICA RAISINS MARKET: BY PRODUCT TYPE (2023-2030)
FIGURE 40 MIDDLE EAST AND AFRICA RAISINS MARKET: SNAPSHOT (2022)
FIGURE 41 MIDDLE EAST AND AFRICA RAISINS MARKET: BY COUNTRY (2022)
FIGURE 42 MIDDLE EAST AND AFRICA RAISINS MARKET: BY COUNTRY (2023 & 2030)
FIGURE 43 MIDDLE EAST AND AFRICA RAISINS MARKET: BY COUNTRY (2022 & 2030)
FIGURE 44 MIDDLE EAST AND AFRICA RAISINS MARKET: BY PRODUCT TYPE (2023-2030)
FIGURE 45 SOUTH AMERICA RAISINS MARKET: SNAPSHOT (2022)
FIGURE 46 SOUTH AMERICA RAISINS MARKET: BY COUNTRY (2022)
FIGURE 47 SOUTH AMERICA RAISINS MARKET: BY COUNTRY (2023 & 2030)
FIGURE 48 SOUTH AMERICA RAISINS MARKET: BY COUNTRY (2022 & 2030)
FIGURE 49 SOUTH AMERICA RAISINS MARKET: BY PRODUCT TYPE (2023-2030)
FIGURE 50 GLOBAL RAISINS MARKET: COMPANY SHARE 2022 (%)
FIGURE 51 NORTH AMERICA RAISINS MARKET: COMPANY SHARE 2022 (%)
FIGURE 52 EUROPE RAISINS MARKET: COMPANY SHARE 2022 (%)
FIGURE 53 ASIA-PACIFIC RAISINS MARKET: COMPANY SHARE 2022 (%)
Metodología de investigación
La recopilación de datos y el análisis del año base se realizan utilizando módulos de recopilación de datos con muestras de gran tamaño. La etapa incluye la obtención de información de mercado o datos relacionados a través de varias fuentes y estrategias. Incluye el examen y la planificación de todos los datos adquiridos del pasado con antelación. Asimismo, abarca el examen de las inconsistencias de información observadas en diferentes fuentes de información. Los datos de mercado se analizan y estiman utilizando modelos estadísticos y coherentes de mercado. Además, el análisis de la participación de mercado y el análisis de tendencias clave son los principales factores de éxito en el informe de mercado. Para obtener más información, solicite una llamada de un analista o envíe su consulta.
La metodología de investigación clave utilizada por el equipo de investigación de DBMR es la triangulación de datos, que implica la extracción de datos, el análisis del impacto de las variables de datos en el mercado y la validación primaria (experto en la industria). Los modelos de datos incluyen cuadrícula de posicionamiento de proveedores, análisis de línea de tiempo de mercado, descripción general y guía del mercado, cuadrícula de posicionamiento de la empresa, análisis de patentes, análisis de precios, análisis de participación de mercado de la empresa, estándares de medición, análisis global versus regional y de participación de proveedores. Para obtener más información sobre la metodología de investigación, envíe una consulta para hablar con nuestros expertos de la industria.
Personalización disponible
Data Bridge Market Research es líder en investigación formativa avanzada. Nos enorgullecemos de brindar servicios a nuestros clientes existentes y nuevos con datos y análisis que coinciden y se adaptan a sus objetivos. El informe se puede personalizar para incluir análisis de tendencias de precios de marcas objetivo, comprensión del mercado de países adicionales (solicite la lista de países), datos de resultados de ensayos clínicos, revisión de literatura, análisis de mercado renovado y base de productos. El análisis de mercado de competidores objetivo se puede analizar desde análisis basados en tecnología hasta estrategias de cartera de mercado. Podemos agregar tantos competidores sobre los que necesite datos en el formato y estilo de datos que esté buscando. Nuestro equipo de analistas también puede proporcionarle datos en archivos de Excel sin procesar, tablas dinámicas (libro de datos) o puede ayudarlo a crear presentaciones a partir de los conjuntos de datos disponibles en el informe.

