
Mercado mundial de fitomejoramiento y plantas CRISPR, por tipo (método convencional, método biotecnológico e ingeniería genética), característica (tolerancia a herbicidas, resistencia a enfermedades, mejora del rendimiento, tolerancia a la temperatura, mejora del tamaño del grano, tolerancia al estrés, resistencia a la sequía y otros), aplicación (cereales y granos, semillas oleaginosas y legumbres, frutas y verduras, cultivos comerciales, césped y plantas ornamentales, hierbas y microvegetales, cultivos medicinales y otros): tendencias de la industria y pronóstico hasta 2029.
Análisis y perspectivas del mercado de plantas con CRISPR y mejoramiento vegetal
El fitomejoramiento y las plantas CRISPR son importantes para crear nuevas variedades de plantas con mejor germoplasma y que ofrezcan características superiores como alto rendimiento, mejor calidad de cultivo, resistencia a enfermedades y otros. El fitomejoramiento y las plantas CRISPR son importantes para los agricultores de América Latina con el fin de producir cultivos de alto rendimiento para satisfacer la creciente demanda de la población. Además, el fitomejoramiento y las plantas CRISPR son necesarias para satisfacer la creciente demanda de la creciente población en América Latina, que es el principal factor que impulsa el mercado. Por lo tanto, muchas empresas están ampliando sus instalaciones de fabricación para satisfacer la mayor demanda de productos de nuevas variedades entre los agricultores de América Latina.
Los factores que impulsan el crecimiento del mercado son la creciente conciencia sobre los beneficios del fitomejoramiento y las plantas CRISPR en el sector agrícola y también la alta tasa de adopción de cultivos fitomejorados en la región de América Latina. Los factores que restringen el crecimiento del fitomejoramiento y las plantas CRISPR son el aumento de la conciencia sobre la presencia de toxinas no deseadas presentes en los cultivos fitomejorados que pueden ser potencialmente peligrosas para la salud humana.
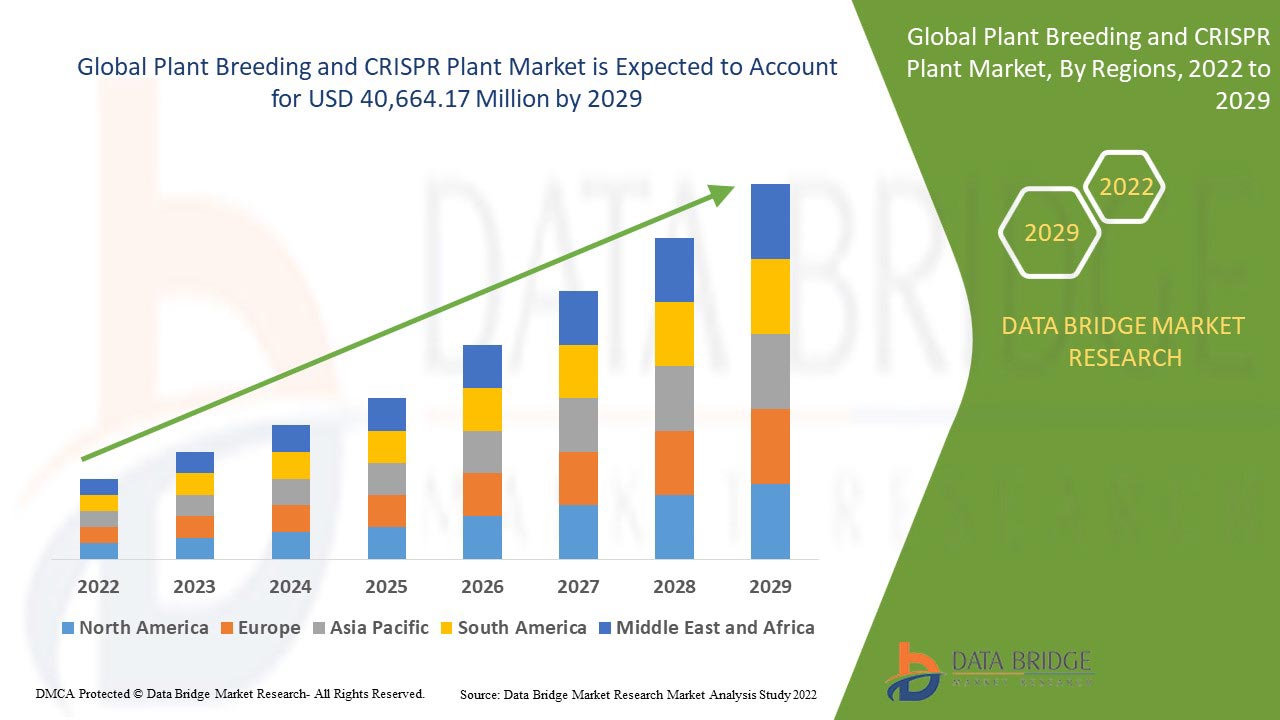
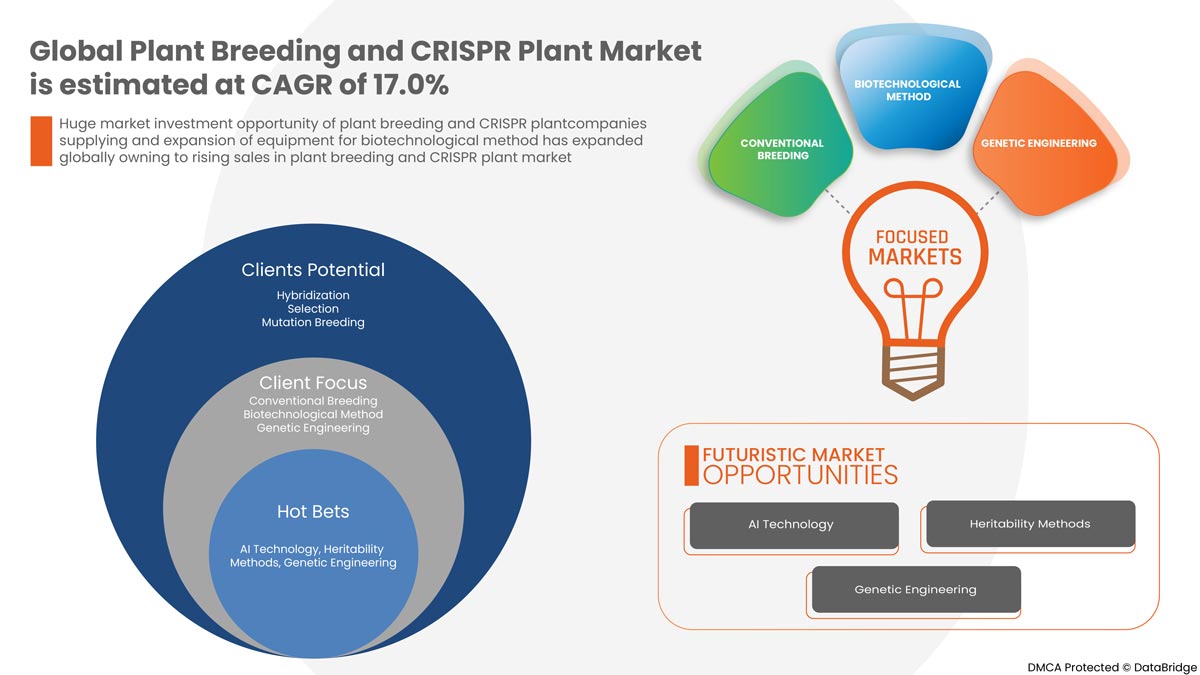
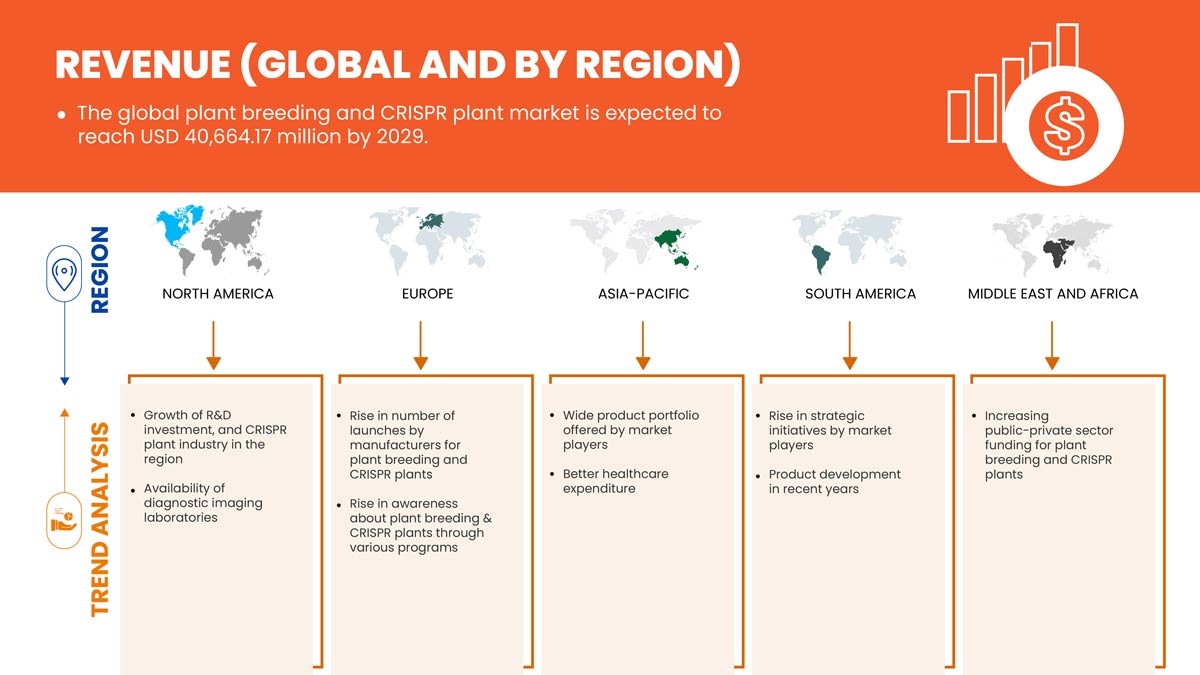
Data Bridge Market Research analiza que se espera que el mercado mundial de fitomejoramiento y CRISPR alcance un valor de USD 40.664,17 millones para 2029, con una CAGR del 17,0 % durante el período de pronóstico. Este informe de mercado también cubre en profundidad el análisis de precios, el análisis de patentes y los avances tecnológicos.
|
Métrica del informe |
Detalles |
|
Período de pronóstico |
2022 a 2029 |
|
Año base |
2021 |
|
Años históricos |
2020 (Personalizable para 2019-2014) |
|
Unidades cuantitativas |
Ingresos en millones de USD, precios en USD |
|
Segmentos cubiertos |
Por tipo (método convencional, método biotecnológico e ingeniería genética), característica (tolerancia a herbicidas, resistencia a enfermedades, mejora del rendimiento, tolerancia a la temperatura, mejora del tamaño del grano, tolerancia al estrés, resistencia a la sequía y otros), aplicación (cereales y granos, semillas oleaginosas y legumbres, frutas y verduras, cultivos comerciales, césped y plantas ornamentales, hierbas y microvegetales, cultivos medicinales y otros) |
|
Países cubiertos |
Estados Unidos, Canadá, México, Alemania, Francia, Reino Unido, Italia, España, Rusia, Turquía, Bélgica, Países Bajos, Suiza, Dinamarca, Polonia, Suecia y el resto de Europa, China, Japón, India, Corea del Sur, Singapur, Tailandia, Malasia, Australia, Filipinas, Indonesia, Vietnam y el resto de Asia-Pacífico, Sudáfrica, Arabia Saudita, Emiratos Árabes Unidos, Omán, Qatar, Kuwait y el resto de Oriente Medio y África, Brasil, Argentina y el resto de Sudamérica. |
|
Actores del mercado cubiertos |
BAYER AG, Syngenta Crop Protection AG, Corteva, BASF SE, Limagrain, DLF, Bioceres Crop Solutions, KWS SAAT SE & Co. KGaA, Stine Seed Company. (Una subsidiaria de Stine Seed Farm, Inc), RAGT, InVivo, pairwise, TMG Tropical Improvement & Genetics SA, SAKATA SEED CORPORATION, DONMARIO, UPL, Benson Hill Inc., Yield10 Bioscience, Inc., Tropic entre otros. |
Definición del mercado mundial de plantas con CRISPR y mejoramiento vegetal
El fitomejoramiento es una técnica utilizada por los cultivadores para desarrollar o mejorar la variedad de cultivos y aumentar su rendimiento mediante la manipulación del genoma de la planta con la ayuda de herramientas moleculares o de conservación para obtener el gen o rasgo deseado. La técnica de fitomejoramiento utiliza nucleasas dirigidas al sitio para transformar o dirigir el ADN en el ADN deseado con extrema perfección. CRISPR es una tecnología utilizada en el fitomejoramiento, donde un gen CRISPR-Cas derivado del procariota se utiliza para alterar el genoma de la planta con el fin de crear el germoplasma con rasgos superiores y beneficiosos. El cultivo producido por el fitomejoramiento o la tecnología CRISPR posee rasgos como alto rendimiento, mejor calidad que el cultivo tradicional, resistencia a enfermedades, tolerancia a herbicidas, tolerancia climática y otros. Además, los métodos de fitomejoramiento se utilizan para crear cultivos que ofrecen una variedad de beneficios como, mayor rendimiento, mejor calidad, resistencia a enfermedades y otros. Además, el fitomejoramiento y la técnica CRISPR son la mejor opción para la producción de cultivos sostenibles.
Dinámica del mercado mundial de fitomejoramiento y CRISPR
En esta sección se aborda la comprensión de los factores impulsores, las ventajas, las oportunidades, las limitaciones y los desafíos del mercado. Todo esto se analiza en detalle a continuación:
Conductores
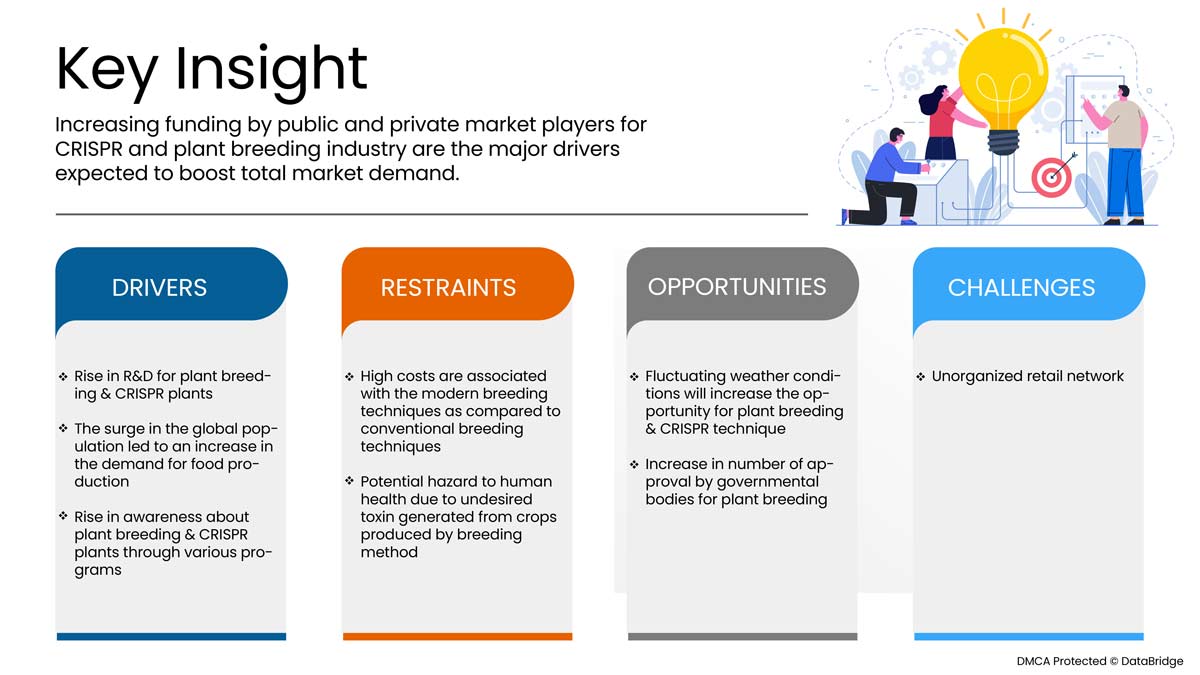
- Aumento de la I+D para el mejoramiento de plantas y plantas CRISPR
El fitomejoramiento es una técnica para cambiar los rasgos de las plantas introduciendo los rasgos deseados en ellas mediante la selección y transformación del ADN con extrema perfección. El fitomejoramiento se utiliza para mejorar la producción de cultivos y la calidad nutricional de los mismos para el consumo humano o animal. CRISPR es una de las principales e importantes tecnologías utilizadas en el fitomejoramiento, ya que ofrece aplicaciones como la mejora de la calidad y el rendimiento, y proporciona resistencia a enfermedades y herbicidas. Con el aumento de la demanda de cultivos modificados para aumentar el rendimiento y mejorar la calidad de los cultivos y reducir los daños a los mismos, se ha producido un aumento de la investigación y el desarrollo de fitomejoramiento y de plantas CRISPR en la región. La creciente demanda de cultivos o plantas producidas mediante fitomejoramiento o técnica CRISPR entre los agricultores para producir cultivos de alta calidad está dando lugar al crecimiento de la investigación y el desarrollo de fitomejoramiento y de plantas CRISPR.
El aumento de la actividad de investigación y desarrollo para el mejoramiento vegetal y las plantas CRISPR está incrementando el crecimiento del mejoramiento vegetal y de las plantas CRISPR en la región.
- El aumento de la población en Oriente Medio y África provoca un aumento de la demanda de producción de alimentos
El crecimiento de la población es uno de los principales factores impulsores del cultivo de plantas y de las plantas CRISPR. Al igual que con el crecimiento de la población, la demanda de alimentos está aumentando y hay más personas a las que alimentar, lo que aumenta la necesidad de nuevas tecnologías, es decir, el cultivo de plantas. La mayor demanda de alimentos se puede satisfacer aumentando el rendimiento de los cultivos y también mejorando la calidad, lo que solo es posible con el cultivo de plantas y la tecnología CRISPR. La demanda de variedades de plantas mejoradas está aumentando entre los agricultores, así como entre las personas, para eliminar el problema de la escasez de alimentos con el crecimiento de la población mundial. El cultivo de plantas y las plantas CRISPR son la única forma de aumentar la producción de cultivos con mejor calidad para alimentar a un mayor número de bocas en todo el mundo. Por lo tanto, el aumento de la población está aumentando la demanda del mercado de cultivo de plantas y plantas CRISPR.
Por lo tanto, el aumento de la población está creando la demanda de una mayor producción de cultivos, lo que conduce al crecimiento del mercado de mejoramiento de plantas y plantas CRISPR a nivel mundial.
Restricción
- Los altos costos asociados con las técnicas de crianza modernas en comparación con las técnicas de crianza convencionales
El mejoramiento convencional se basa en la mezcla de rasgos de diferentes poblaciones dentro de una especie y luego en la selección de toda la planta natural para obtener elementos genéticos. Los métodos de mejoramiento modernos a menudo implican técnicas in vitro y/o biología molecular en una o más etapas del proceso de mejoramiento. Este artículo describe varias técnicas, entre ellas el rescate de embriones, la selección in vitro, la variación somaclonal, los haploides dobles y la eliminación de cromosomas, y la transformación/ingeniería genética. El mejoramiento de plantas a menudo se considera un juego de números, y los principales programas de productos básicos competitivos invierten mucho en métodos eficientes de tratamiento de semillas, plantación, clasificación y cosecha. A medida que se acumulan las ganancias genéticas, el listón se eleva gradualmente y se requiere una inversión cada vez mayor para mantener estable el desarrollo genético.
Oportunidad
-
La fluctuación de si las condiciones aumentarán las oportunidades para el mejoramiento de plantas y la técnica CRISPR
La fluctuación de las condiciones climáticas daña los cultivos y da como resultado una pérdida importante de los mismos, lo que crea oportunidades para el fitomejoramiento y la aplicación de técnicas CRISPR en todo el mundo. Con la ayuda del fitomejoramiento y la técnica CRISPR, se puede desarrollar tolerancia a las condiciones climáticas, como la sequía, las fuertes lluvias y otras, lo que ayudará a resistir las pérdidas climáticas de los cultivos. La demanda de nuevas variedades de cultivos que ofrezcan resistencia a las duras condiciones climáticas está en aumento, lo que está creando oportunidades para el fitomejoramiento y la aplicación de técnicas CRISPR en todo el mundo. El aumento de las pérdidas de cultivos debido a las duras condiciones climáticas está creando importantes oportunidades para el mercado.
Por lo tanto, el aumento en el número de daños a los cultivos debido a las duras condiciones climáticas está incrementando la demanda de plantas de mejoramiento vegetal y CRISPR y creando la oportunidad para el mercado de plantas de mejoramiento vegetal y CRISPR.
Desafío
- Red de venta minorista no organizada
La red minorista de la agricultura ha sido testigo de una transformación drástica a lo largo del tiempo. Ha pasado de ser un ciclo corto a una cadena complicada y compleja. Con su rápido crecimiento en el sector minorista agrícola, se han creado brechas en la cadena de suministro y se han vuelto ineficaces. La red minorista desorganizada incluye
- Mala calidad de gestión
- Proceso de contratación agotador
- Tecnologías altamente desarrolladas
- Surtido deficiente y precios elevados
- Falta de comprensión de los instrumentos de alta tecnología.
La red minorista contribuye a un segmento más amplio de la agricultura y este sector minorista desorganizado y altamente desarrollado está afectando a los pequeños agricultores y también a los agricultores locales. El equipo altamente desarrollado y la falta de conocimiento sobre él dificultan la situación de los pequeños agricultores.
Impacto posterior a la COVID-19 en el mercado mundial de fitomejoramiento y CRISPR
La pandemia de COVID-19 ha tenido poco impacto en el mercado de fitomejoramiento y plantas CRISPR, debido principalmente a las limitaciones de transporte. El gobierno ha eximido todo tipo de actividades agrícolas del impacto de los cierres o interrupciones, por lo que no ha habido tal efecto del brote de coronavirus. De hecho, las empresas agroquímicas han obtenido ganancias de dos dígitos en comparación con el año pasado, debido a las compras de pánico de los agricultores. La creciente conciencia de los agricultores sobre los beneficios del fitomejoramiento ha dado como resultado el apoyo del gobierno. Los gobiernos de los países en desarrollo administran múltiples bancos de semillas a nivel nacional y de aldea para almacenar semillas que han sido tratadas adecuadamente con productos químicos para el tratamiento de semillas, lo que evita que se pudran.
Acontecimientos recientes
- En agosto de 2022, Bayer amplió la inversión existente para adquirir una participación mayoritaria en el productor de semillas oleaginosas sostenibles con bajas emisiones de carbono CoverCress Inc. Esta inversión cumplió con los compromisos de sostenibilidad de Bayer y puede ayudar a reducir las emisiones de carbono agrícola y reducir la dependencia de los fertilizantes nitrogenados al aprovechar la experiencia de los inversores existentes, Bunge y Chevron/agricultores para obtener nuevas fuentes de ingresos a través de la posible comercialización de semillas oleaginosas en combustibles renovables y alimentos para animales que brindan beneficios al ecosistema a través de cultivos de cobertura, aprovechando la inversión existente de Bayer en CoverCress Inc. Esto ha ayudado a la empresa a expandir su negocio.
Alcance del mercado mundial de fitomejoramiento y CRISPR
El mercado mundial de fitomejoramiento y CRISPR de plantas está segmentado por tipo, característica y aplicación. El crecimiento entre segmentos le ayuda a analizar nichos de crecimiento y estrategias para abordar el mercado y determinar sus áreas de aplicación principales y la diferencia en sus mercados objetivo.
MERCADO MUNDIAL DE FITOMEJORAMIENTO VEGETAL Y PLANTAS CRISPR, POR TIPO
- CRIANZA CONVENCIONAL
- MÉTODO BIOTECNOLÓGICO
- INGENIERÍA GENÉTICA
Según el tipo, el mercado mundial de mejoramiento vegetal y de plantas CRISPR se segmenta en mejoramiento convencional, método biotecnológico e ingeniería genética.
MERCADO MUNDIAL DE MEJORAMIENTO DE PLANTAS Y PLANTAS CRISPR, POR CARACTERÍSTICAS
- TOLERANCIA A LOS HERBICIDAS
- MEJORA DEL RENDIMIENTO
- RESISTENCIA A LAS ENFERMEDADES
- TOLERANCIA DE TEMPERATURA
- MEJORA DEL TAMAÑO DEL GRANO
- TOLERANCIA AL ESTRÉS
- RESISTENCIA A LA SEQUÍA
- OTROS
Sobre la base de las características, el mercado de plantas CRISPR y de mejoramiento vegetal se segmenta en tolerancia a herbicidas, resistencia a enfermedades, mejora del rendimiento, tolerancia a la temperatura, mejora del tamaño del grano, tolerancia al estrés, resistencia a la sequía, otros.
MERCADO MUNDIAL DE MEJORAMIENTO DE PLANTAS Y PLANTAS CRISPR, POR APLICACIÓN
- CEREALES Y GRANOS
- SEMILLAS OLEAGINOSAS Y LEGUMBRES
- FRUTAS Y VERDURAS
- CULTIVOS COMERCIALES
- CÉSPED Y ORNAMENTALES
- HIERBAS Y MICROVERDURAS
- CULTIVOS MEDICINALES
- OTROS TIPOS DE CULTIVOS
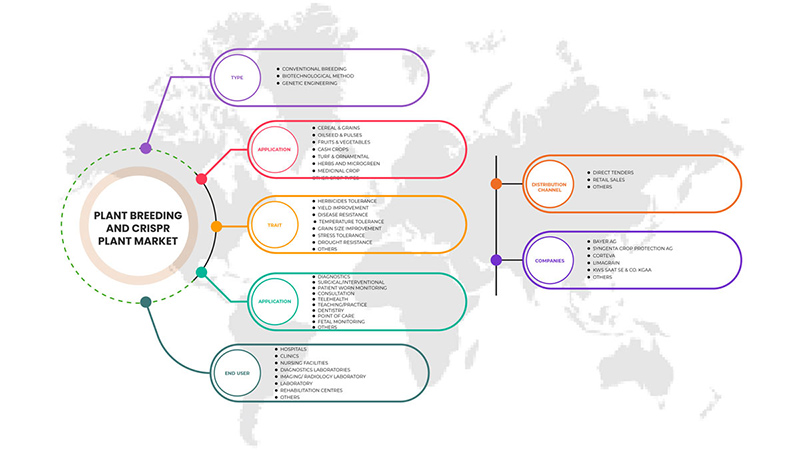
Sobre la base de la aplicación, el mercado de mejoramiento vegetal y plantas CRISPR se segmenta en cereales y granos, semillas oleaginosas y legumbres, frutas y verduras, cultivos comerciales, césped y plantas ornamentales, hierbas y microvegetales, cultivos medicinales y otros.
Análisis y perspectivas regionales del mercado mundial de fitomejoramiento y CRISPR
The Global plant breeding and CRISPR plant market is analyzed and market size information is provided type, trait and application.
The countries covered in this market report are U.S., Canada, Mexico, Germany, France, U.K., Italy, Spain, Russia, Turkey, Belgium, Netherlands, Switzerland, Denmark, Poland, Sweden and the rest of Europe, China, Japan, India, South Korea, Singapore, Thailand, Malaysia, Australia, Philippines, Indonesia, Vietnam, and rest of Asia-Pacific, South Africa, Saudi Arabia, UAE, Oman, Qatar, Kuwait and rest of the Middle East and Africa, Brazil, Argentina and the rest of South America.
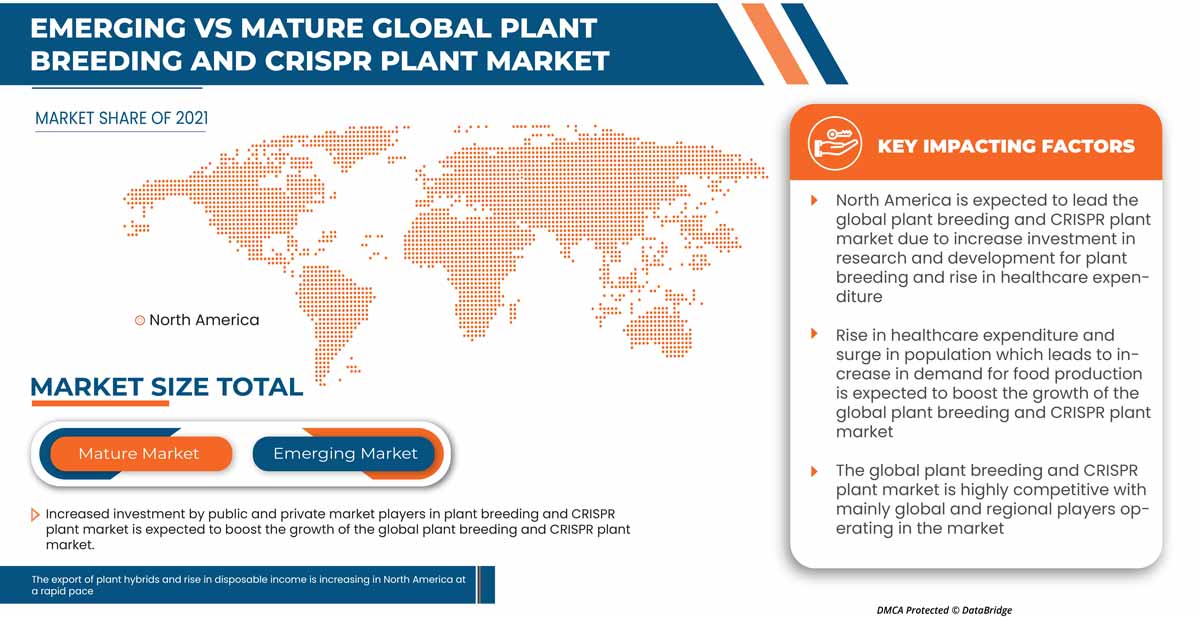
In 2022, North America is dominating due to the presence of key market players in the largest consumer market with high GDP. U.S. is expected to grow due to rise in technological advancement in agriculture sector.
The country section of the report also provides individual market impacting factors and changes in regulation in the market domestically that impact the current and future trends of the market. Data points such as new sales, replacement sales, country demographics, regulatory acts, and import-export tariffs are some of the major pointers used to forecast the market scenario for individual countries. Also, presence and availability of global brands and their challenges faced due to large or scarce competition from local and domestic brands, and impact of sales channels are considered while providing forecast analysis of the country data.
Competitive Landscape and Global Plant Breeding and CRISPR Plant Market Share Analysis
Global plant breeding and CRISPR plant market competitive landscape provides details by competitor. Details included are company overview, company financials, revenue generated, market potential, investment in R&D, new market initiatives, production sites and facilities, company strengths and weaknesses, product launch, product trials pipelines, product approvals, patents, product width and breath, application dominance, technology lifeline curve. The above data points provided are only related to the company’s focus on the Global plant breeding and CRISPR plant market.
Some of the key players operating in the global plant breeding and CRISPR plant market are BAYER AG, Syngenta Crop Protection AG, Corteva, BASF SE, Limagrain, DLF, Bioceres Crop Solutions, KWS SAAT SE & Co. KGaA, Stine Seed Company. (A subsidiary of Stine Seed Farm, Inc), RAGT, InVivo, pairwise, TMG Tropical Improvement & Genetics SA, SAKATA SEED CORPORATION, DONMARIO, UPL, Benson Hill Inc. , Yield10 Bioscience, Inc., Tropic among others.
Research Methodology: Global Plant Breeding and CRISPR Plant Market
La recopilación de datos y el análisis del año base se realizan utilizando módulos de recopilación de datos con tamaños de muestra grandes. Los datos del mercado se analizan y estiman utilizando modelos estadísticos y coherentes del mercado. Además, el análisis de la participación de mercado y el análisis de tendencias clave son los principales factores de éxito en el informe de mercado. La metodología de investigación clave utilizada por el equipo de investigación de DBMR es la triangulación de datos que implica la extracción de datos, el análisis del impacto de las variables de datos en el mercado y la validación primaria (experto en la industria). Aparte de esto, los modelos de datos incluyen la cuadrícula de posicionamiento de proveedores, el análisis de la línea de tiempo del mercado, la descripción general y la guía del mercado, la cuadrícula de posicionamiento de la empresa, el análisis de la participación de mercado de la empresa, los estándares de medición, el análisis global frente al regional y el análisis de la participación de los proveedores. Solicite una llamada de un analista en caso de tener más consultas.
SKU-
Obtenga acceso en línea al informe sobre la primera nube de inteligencia de mercado del mundo

- Panel de análisis de datos interactivo
- Panel de análisis de empresas para oportunidades con alto potencial de crecimiento
- Acceso de analista de investigación para personalización y consultas
- Análisis de la competencia con panel interactivo
- Últimas noticias, actualizaciones y análisis de tendencias
- Aproveche el poder del análisis de referencia para un seguimiento integral de la competencia
Tabla de contenido
1 INTRODUCTION
1.1 OBJECTIVES OF THE STUDY
1.2 MARKET DEFINITION
1.3 OVERVIEW OF THE GLOBAL PLANT BREEDING AND CRISPR PLANT MARKET
1.4 CURRENCY AND PRICING
1.5 LIMITATIONS
1.6 MARKETS COVERED
2 MARKET SEGMENTATION
2.1 MARKETS COVERED
2.2 GEOGRAPHICAL SCOPE
2.3 YEARS CONSIDERED FOR THE STUDY
2.4 DBMR TRIPOD DATA VALIDATION MODEL
2.5 PRIMARY INTERVIEWS WITH KEY OPINION LEADERS
2.6 MULTIVARIATE MODELLING
2.7 MARKET APPLICATION COVERAGE GRID
2.8 SOURCE LIFELINE CURVE
2.9 DBMR MARKET POSITION GRID
2.1 VENDOR SHARE ANALYSIS
2.11 SECONDARY SOURCES
2.12 ASSUMPTIONS
3 EXECUTIVE SUMMARY
3.1 GLOBAL PLANT BREEDING AND CRISPR PLANTS MARKET: CONSUMER BUYING BEHAVIOUR
3.1.1 RECOMMENDATIONS FROM FAMILY & FRIENDS-
3.1.2 RESEARCH
3.1.3 IMPULSIVE
3.1.4 ADVERTISEMENT:
3.1.5 TELEVISION ADVERTISEMENT
3.1.6 ONLINE ADVERTISEMENT
3.1.7 IN-STORE ADVERTISEMENT
3.1.8 OUTDOOR ADVERTISEMENT
4 SUPPLY CHAIN OF GLOBAL PLANT BREEDING AND CRISPR PLANTS MARKET
4.1 BAYER
4.1.1 PROCUREMENT
4.1.2 SUSTAINABILITY IN THE SUPPLY CHAIN
4.1.3 BAYER TRANSPORTATION AND ENVIRONMENT SAFETY IN SUPPLY CHAIN-
4.2 SYNGENTA GROUP
4.2.1 WORKING WITH SUPPLIERS
4.2.2 KEY PERFORMANCE INDICATORS AND BASIS OF PREPARATION-
4.3 UPCOMING TRENDS
5 BRAND COMPETITIVE ANALYSIS GLOBAL PLANT BREEDING AND CRISPR PLANTS MARKET
6 GLOBAL PLANT BREEDING AND CRISPR PLANT MARKET: REGULATIONS
7 MARKET OVERVIEW
7.1 DRIVERS
7.1.1 RISE IN R&D FOR PLANT BREEDING & CRISPR PLANTS
7.1.2 THE SURGE IN THE GLOBAL POPULATION LED TO AN INCREASE IN THE DEMAND FOR FOOD PRODUCTION
7.1.3 RISE IN AWARENESS ABOUT PLANT BREEDING & CRISPR PLANTS THROUGH VARIOUS PROGRAMMES
7.1.4 RISING IN NUMBER OF LAUNCHES BY MANUFACTURERS FOR PLANT BREEDING & CRISPR PLANTS
7.2 RESTRAINTS
7.2.1 HIGH COSTS ARE ASSOCIATED WITH THE MODERN BREEDING TECHNIQUES AS COMPARED TO CONVENTIONAL BREEDING TECHNIQUES
7.2.2 POTENTIAL HAZARD TO HUMAN HEALTH DUE TO UNDESIRED TOXIN GENERATED FROM CROPS PRODUCED BY BREEDING METHOD
7.3 OPPORTUNITIES
7.3.1 FLUCTUATING WEATHER CONDITIONS WILL INCREASE THE OPPORTUNITY FOR PLANT BREEDING & CRISPR TECHNIQUE
7.3.2 INCREASE IN NUMBER OF APPROVAL BY GOVERNMENTAL BODIES FOR PLANT BREEDING
7.4 CHALLENGE
7.4.1 UNORGANIZED RETAIL NETWORK
8 GLOBAL PLANT BREEDING AND CRISPR PLANTS MARKET, BY TYPE
8.1 OVERVIEW
8.2 CONVENTIONAL BREEDING
8.2.1 HYBRIDIZATION
8.2.2 SELECTION
8.2.3 MUTATION BREEDING
8.3 BIOTECHNOLOGICAL METHOD
8.3.1 CELL AND TISSUE CULTURE
8.3.2 MOLECULAR MARKERS
8.3.3 PHENO TYPING
8.4 GENETIC ENGINEERING
8.4.1 RFLP
8.4.2 GENE TRANSFER
8.4.3 TRANSGENE EXPRESSION
8.4.4 SELECTION AND PLANT REGENERATION
9 GLOBAL PLANT BREEDING & CRISPR PLANT MARKET, BY TRAIT
9.1 OVERVIEW
9.2 HERBICIDES TOLERANCE
9.3 YIELD IMPROVEMENT
9.4 DISEASE RESISTANCE
9.5 TEMPERATURE TOLERANCE
9.6 GRAIN SIZE IMPROVEMENT
9.7 STRESS TOLERANCE
9.8 DROUGHT RESISTANCE
9.9 OTHERS
10 GLOBAL PLANT BREEDING AND CRISPR PLANT MARKET, BY APPLICATION
10.1 OVERVIEW
10.2 CEREAL & GRAINS
10.2.1 MAIZE
10.2.2 WHEAT
10.2.3 RICE
10.2.4 OATS
10.2.5 OTHERS
10.3 OILSEED & PULSES
10.3.1 SOYBEAN
10.3.2 SUNFLOWER
10.3.3 PEA
10.3.4 GRAM
10.3.5 OTHERS
10.4 FRUITS & VEGETABLES
10.4.1 BANANA
10.4.2 POTATO
10.4.3 TOMATO
10.4.4 APPLE
10.4.5 ORANGE
10.4.6 GRAPEFRUIT
10.4.7 BERRIES
10.4.8 CUCUMBERS
10.4.9 CARROTS
10.4.10 EGGPLANT
10.4.11 BROCCOLI
10.4.12 LEAFY GREEN
10.4.12.1 SPINACH
10.4.12.2 LETTUCE
10.4.12.3 CABBAGE
10.4.12.4 KALE
10.4.12.5 OTHERS
10.4.13 OTHERS
10.5 CASH CROPS
10.5.1 COFFEE & TEA
10.5.2 COTTON
10.5.3 SUGARCANE
10.5.4 OTHERS
10.6 TURF & ORNAMENTAL
10.7 HERBS AND MICROGREENS
10.7.1 HERBS
10.7.2 BASIL
10.7.3 WHEATGRASS
10.8 MEDICINAL CROP
10.9 OTHER CROP TYPES
11 GLOBAL PLANT BREEDING AND CRISPR PLANTS MARKET, BY GEOGRAPHY
11.1 OVERVIEW
11.2 NORTH AMERICA
11.2.1 U.S.
11.2.2 CANADA
11.2.3 MEXICO
11.3 EUROPE
11.3.1 GERMANY
11.3.2 FRANCE
11.3.3 U.K.
11.3.4 RUSSIA
11.3.5 ITALY
11.3.6 SPAIN
11.3.7 NETHERLANDS
11.3.8 SWITZERLAND
11.3.9 BELGIUM
11.3.10 POLAND
11.3.11 TURKEY
11.3.12 SWEDEN
11.3.13 IRELAND
11.3.14 REST OF EUROPE
11.4 ASIA-PACIFIC
11.4.1 CHINA
11.4.2 JAPAN
11.4.3 INDIA
11.4.4 SOUTH KOREA
11.4.5 AUSTRALIA
11.4.6 SINGAPORE
11.4.7 THAILAND
11.4.8 INDONESIA
11.4.9 PHILIPPINES
11.4.10 MALAYSIA
11.4.11 VIETNAM
11.4.12 REST OF ASIA-PACIFIC
11.5 SOUTH AMERICA
11.5.1 BRAZIL
11.5.2 ARGENTINA
11.5.3 REST OF SOUTH AMERICA
11.6 MIDDLE EAST & AFRICA
11.6.1 SOUTH AFRICA
11.6.2 SAUDI ARABIA
11.6.3 UAE
11.6.4 OMAN
11.6.5 QATAR
11.6.6 KUWAIT
11.6.7 REST OF MIDDLE EAST AND AFRICA
12 GLOBAL PLANT BREEDING AND CSIPR PLANT MARKET: COMPANY LANDSCAPE
12.1 COMPANY SHARE ANALYSIS: GLOBAL
12.2 COMPANY SHARE ANALYSIS: NORTH AMERICA
12.3 COMPANY SHARE ANALYSIS: EUROPE
12.4 COMPANY SHARE ANALYSIS: ASIA-PACIFIC
13 SWOT ANALYSIS
14 COMPANY PROFILE
14.1 BAYER AG
14.1.1 COMPANY SNAPSHOT
14.1.2 REVENUE ANALYSIS
14.1.3 COMPANY SHARE ANALYSIS
14.1.4 PRODUCT PORTFOLIO
14.1.5 RECENT DEVELOPMENTS
14.2 SYNGENTA CROP PROTECTION AG
14.2.1 COMPANY SNAPSHOT
14.2.2 REVENUE ANALYSIS
14.2.3 COMPANY SHARE ANALYSIS
14.2.4 PRODUCT PORTFOLIO
14.2.5 RECENT DEVELOPMENTS
14.3 CORTEVA (2021)
14.3.1 COMPANY SNAPSHOT
14.3.2 REVENUE ANALYSIS
14.3.3 COMPANY SHARE ANALYSIS
14.3.4 PRODUCT PORTFOLIO
14.3.5 RECENT DEVELOPMENTS
14.4 LIMAGRAIN
14.4.1 COMPANY SNAPSHOT
14.4.2 COMPANY SHARE ANALYSIS
14.4.3 PRODUCT PORTFOLIO
14.4.4 RECENT DEVELOPMENTS
14.5 KWS SAAT SE & CO. KGAA (2021)
14.5.1 COMPANY SNAPSHOT
14.5.2 REVENUE ANALYSIS
14.5.3 COMPANY SHARE ANALYSIS
14.5.4 PRODUCT PORTFOLIO
14.5.5 RECENT DEVELOPMENTS
14.6 BASF SE
14.6.1 COMPANY SNAPSHOT
14.6.2 REVENUE ANALYSIS
14.6.3 PRODUCT PORTFOLIO
14.6.4 RECENT DEVELOPMENT
14.7 BENSON HILL INC.
14.7.1 COMPANY SNAPSHOT
14.7.2 REVENUE ANALYSIS
14.7.3 PRODUCT PORTFOLIO
14.7.4 RECENT DEVELOPMENTS
14.8 BIOCERES CROP SOLUTIONS
14.8.1 COMPANY SNAPSHOT
14.8.2 PRODUCT PORTFOLIO
14.8.3 RECENT DEVELOPMENT
14.9 DLF
14.9.1 COMPANY SNAPSHOT
14.9.2 PRODUCT PORTFOLIO
14.9.3 RECENT DEVELOPMENTS
14.1 DONMARIO ( 2021)
14.10.1 COMPANY SNAPSHOT
14.10.2 PRODUCT PORTFOLIO
14.10.3 RECENT DEVELOPMENTS
14.11 INVIVO.( 2021)
14.11.1 COMPANY SNAPSHOT
14.11.2 PRODUCT PORTFOLIO
14.11.3 RECENT DEVELOPMENT
14.12 PAIRWISE ( 2021)
14.12.1 COMPANY SNAPSHOT
14.12.2 PRODUCT PORTFOLIO
14.12.3 RECENT DEVELOPMENTS
14.13 PLANASA ( 2021)
14.13.1 COMPANY SNAPSHOT
14.13.2 PRODUCT PORTFOLIO
14.13.3 RECENT DEVELOPMENTS
14.14 RAGT (2021)
14.14.1 COMPANY SNAPSHOT
14.14.2 PRODUCT PORTFOLIO
14.14.3 RECENT DEVELOPMENTS
14.15 SAKATA SEED CORPORATION ( 2021)
14.15.1 COMPANY SNAPSHOT
14.15.2 REVENUE ANALYSIS
14.15.3 PRODUCT PORTFOLIO
14.15.4 RECENT DEVELOPMENT
14.16 STINE SEED COMPANY. (A SUBSIDIARY OF STINE SEED FARM, INC) (2021)
14.16.1 COMPANY SNAPSHOT
14.16.2 PRODUCT PORTFOLIO
14.16.3 RECENT DEVELOPMENTS
14.17 TMG TROPICAL IMPROVEMENT & GENETICS SA ( 2021)
14.17.1 COMPANY SNAPSHOT
14.17.2 PRODUCT PORTFOLIO
14.17.3 RECENT DEVELOPMENTS
14.18 TROPIC
14.18.1 COMPANY SNAPSHOT
14.18.2 PRODUCT PORTFOLIO
14.18.3 RECENT DEVELOPMENTS
14.19 UPL (2021)
14.19.1 COMPANY SNAPSHOT
14.19.2 REVENUE ANALYSIS
14.19.3 PRODUCT PORTFOLIO
14.19.4 RECENT DEVELOPMENT
14.2 YIELD10 BIOSCIENCE, INC.
14.20.1 COMPANY SNAPSHOT
14.20.2 REVENUE ANALYSIS
14.20.3 PRODUCT PORTFOLIO
14.20.4 RECENT DEVELOPMENT
15 QUESTIONNAIRE
16 RELATED REPORTS
Lista de Tablas
TABLE 1 LABELING REQUIREMENTS FOR GMOS IN THE EUROPEAN UNION
TABLE 2 GLOBAL PLANT BREEDING & CRISPR PLANT MARKET, BY TYPE, 2020-2029 (USD MILLION)
TABLE 3 GLOBAL CONVENTIONAL BREEDING IN PLANT BREEDING & CRISPR PLANT MARKET, BY REGION, 2020-2029 (USD MILLION)
TABLE 4 GLOBAL CONVENTIONAL BREEDING IN PLANT BREEDING & CRISPR PLANT MARKET, BY TYPE, 2020-2029 (USD MILLION)
TABLE 5 GLOBAL BIOTECHNOLOGICAL METHOD IN PLANT BREEDING & CRISPR PLANT MARKET, BY REGION, 2020-2029 (USD MILLION)
TABLE 6 GLOBAL BIOTECHNOLOGICAL METHOD IN PLANT BREEDING & CRISPR PLANT MARKET, BY TYPE, 2020-2029 (USD MILLION)
TABLE 7 GLOBAL GENETIC ENGINEERING IN PLANT BREEDING & CRISPR PLANT MARKET, BY REGION, 2020-2029 (USD MILLION)
TABLE 8 GLOBAL GENETIC ENGINEERING IN PLANT BREEDING & CRISPR PLANT MARKET, BY TYPE, 2020-2029 (USD MILLION)
TABLE 9 GLOBAL PLANT BREEDING & CRISPR PLANT MARKET, BY TRAIT, 2020-2029 (USD MILLION)
TABLE 10 GLOBAL HERBICIDES TOLERANCE IN PLANT BREEDING & CRISPR PLANT MARKET, BY REGION, 2020-2029 (USD MILLION)
TABLE 11 GLOBAL YIELD IMPROVEMENT IN PLANT BREEDING & CRISPR PLANT MARKET, BY REGION, 2020-2029 (USD MILLION)
TABLE 12 GLOBAL DISEASE RESISTANCE IN PLANT BREEDING & CRISPR PLANT MARKET, BY REGION, 2020-2029 (USD MILLION)
TABLE 13 GLOBAL TEMPERATURE TOLERANCE IN PLANT BREEDING & CRISPR PLANT MARKET, BY REGION, 2020-2029 (USD MILLION)
TABLE 14 GLOBAL GRAIN SIZE IMPROVEMENT IN PLANT BREEDING & CRISPR PLANT MARKET, BY REGION, 2020-2029 (USD MILLION)
TABLE 15 GLOBAL STRESS TOLERANCE IN PLANT BREEDING & CRISPR PLANT MARKET, BY REGION, 2020-2029 (USD MILLION)
TABLE 16 GLOBAL DROUGHT RESISTANCE IN PLANT BREEDING & CRISPR PLANT MARKET, BY REGION, 2020-2029 (USD MILLION)
TABLE 17 GLOBAL OTHERS IN PLANT BREEDING & CRISPR PLANT MARKET, BY REGION, 2020-2029 (USD MILLION)
TABLE 18 GLOBAL PLANT BREEDING AND CRISPR PLANT MARKET, BY APPLICATION, 2020-2029 (USD MILLION)
TABLE 19 GLOBAL CEREALS & GRAINS IN PLANT BREEDING AND CRISPR PLANT MARKET, BY REGION, 2020-2029 (USD MILLION)
TABLE 20 GLOBAL CEREALS & GRAINS IN PLANT BREEDING AND CRISPR PLANT MARKET, BY APPLICATION, 2020-2029 (USD MILLION)
TABLE 21 GLOBAL OILSEED & PULSES IN PLANT BREEDING AND CRISPR PLANT MARKET, BY REGION, 2020-2029 (USD MILLION)
TABLE 22 GLOBAL OILSEEDS & PULSES IN PLANT BREEDING AND CRISPR PLANT MARKET, BY APPLICATION, 2020-2029 (USD MILLION)
TABLE 23 GLOBAL FRUITS & VEGETABLES IN PLANT BREEDING AND CRISPR PLANT MARKET, BY REGION, 2020-2029 (USD MILLION)
TABLE 24 GLOBAL FRUITS & VEGETABLES IN PLANT BREEDING AND CRISPR PLANT MARKET, BY APPLICATION, 2020-2029 (USD MILLION)
TABLE 25 GLOBAL LEAFY GREEN IN PLANT BREEDING AND CRISPR PLANT MARKET, BY APPLICATION, 2020-2029 (USD MILLION)
TABLE 26 GLOBAL CASH CROPS IN PLANT BREEDING AND CRISPR PLANT MARKET, BY REGION, 2020-2029 (USD MILLION)
TABLE 27 GLOBAL CASH CROPS IN PLANT BREEDING AND CRISPR PLANT MARKET, BY APPLICATION, 2020-2029 (USD MILLION)
TABLE 28 GLOBAL TURF & ORNAMENTAL IN PLANT BREEDING AND CRISPR PLANT MARKET, BY REGION, 2020-2029 (USD MILLION)
TABLE 29 GLOBAL HERBS AND MICROGREENS IN PLANT BREEDING AND CRISPR PLANT MARKET, BY REGION, 2020-2029 (USD MILLION)
TABLE 30 GLOBAL HERBS AND MICROGREENS IN PLANT BREEDING AND CRISPR PLANT MARKET, BY APPLICATION, 2020-2029 (USD MILLION)
TABLE 31 GLOBAL MEDICINAL CROP IN PLANT BREEDING AND CRISPR PLANT MARKET, BY REGION, 2020-2029 (USD MILLION)
TABLE 32 GLOBAL OTHER CROP TYPES IN PLANT BREEDING AND CRISPR PLANT MARKET, BY REGION, 2020-2029 (USD MILLION)
TABLE 33 GLOBAL PLANT BREEDING AND CRISPR PLANT MARKET, BY REGION, 2020-2029 (USD MILLION)
TABLE 34 NORTH AMERICA PLANT BREEDING & CRISPR PLANT MARKET, BY COUNTRY, 2020-2029 (USD MILLION)
TABLE 35 NORTH AMERICA PLANT BREEDING & CRISPR PLANT MARKET, BY TYPE, 2020-2029 (USD MILLION)
TABLE 36 NORTH AMERICA BIOTECHNOLOGICAL METHOD IN PLANT BREEDING & CRISPR PLANT MARKET, BY TYPE, 2020-2029 (USD MILLION)
TABLE 37 NORTH AMERICA CONVENTIONAL BREEDING IN PLANT BREEDING & CRISPR PLANT MARKET, BY TYPE, 2020-2029 (USD MILLION)
TABLE 38 NORTH AMERICA GENETIC ENGINEERING IN PLANT BREEDING & CRISPR PLANT MARKET, BY TYPE, 2020-2029 (USD MILLION)
TABLE 39 NORTH AMERICA PLANT BREEDING & CRISPR PLANT MARKET, BY TRAIT, 2020-2029 (USD MILLION)
TABLE 40 NORTH AMERICA PLANT BREEDING & CRISPR PLANT MARKET, BY APPLICATION, 2020-2029 (USD MILLION)
TABLE 41 NORTH AMERICA CEREAL & GRAIN IN PLANT BREEDING & CRISPR PLANT MARKET, BY APPLICATION, 2020-2029 (USD MILLION)
TABLE 42 NORTH AMERICA OILSEED & PULSES IN PLANT BREEDING & CRISPR PLANT MARKET, BY APPLICATION, 2020-2029 (USD MILLION)
TABLE 43 NORTH AMERICA FRUITS & VEGETABLES IN PLANT BREEDING & CRISPR PLANT MARKET, BY APPLICATION, 2020-2029 (USD MILLION)
TABLE 44 NORTH AMERICA LEAFY GREEN IN PLANT BREEDING & CRISPR PLANT MARKET, BY APPLICATION, 2020-2029 (USD MILLION)
TABLE 45 NORTH AMERICA CASH CROPS IN PLANT BREEDING & CRISPR PLANT MARKET, BY APPLICATION, 2020-2029 (USD MILLION)
TABLE 46 NORTH AMERICA HERBS AND MICROGREEN IN PLANT BREEDING & CRISPR PLANT MARKET, BY APPLICATION, 2020-2029 (USD MILLION)
TABLE 47 U.S. PLANT BREEDING & CRISPR PLANT MARKET, BY TYPE, 2020-2029 (USD MILLION)
TABLE 48 U.S. BIOTECHNOLOGICAL METHOD IN PLANT BREEDING & CRISPR PLANT MARKET, BY TYPE, 2020-2029 (USD MILLION)
TABLE 49 U.S. CONVENTIONAL BREEDING IN PLANT BREEDING & CRISPR PLANT MARKET, BY TYPE, 2020-2029 (USD MILLION)
TABLE 50 U.S. GENETIC ENGINEERING IN PLANT BREEDING & CRISPR PLANT MARKET, BY TYPE, 2020-2029 (USD MILLION)
TABLE 51 U.S. PLANT BREEDING & CRISPR PLANT MARKET, BY TRAIT, 2020-2029 (USD MILLION)
TABLE 52 U.S. PLANT BREEDING & CRISPR PLANT MARKET, BY APPLICATION, 2020-2029 (USD MILLION)
TABLE 53 U.S. CEREAL & GRAIN IN PLANT BREEDING & CRISPR PLANT MARKET, BY APPLICATION, 2020-2029 (USD MILLION)
TABLE 54 U.S. OILSEED & PULSES IN PLANT BREEDING & CRISPR PLANT MARKET, BY APPLICATION, 2020-2029 (USD MILLION)
TABLE 55 U.S. FRUITS & VEGETABLES IN PLANT BREEDING & CRISPR PLANT MARKET, BY APPLICATION, 2020-2029 (USD MILLION)
TABLE 56 U.S. LEAFY GREEN IN PLANT BREEDING & CRISPR PLANT MARKET, BY APPLICATION, 2020-2029 (USD MILLION)
TABLE 57 U.S. CASH CROPS IN PLANT BREEDING & CRISPR PLANT MARKET, BY APPLICATION, 2020-2029 (USD MILLION)
TABLE 58 U.S. HERBS AND MICROGREEN IN PLANT BREEDING & CRISPR PLANT MARKET, BY APPLICATION, 2020-2029 (USD MILLION)
TABLE 59 CANADA PLANT BREEDING & CRISPR PLANT MARKET, BY TYPE, 2020-2029 (USD MILLION)
TABLE 60 CANADA BIOTECHNOLOGICAL METHOD IN PLANT BREEDING & CRISPR PLANT MARKET, BY TYPE, 2020-2029 (USD MILLION)
TABLE 61 CANADA CONVENTIONAL BREEDING IN PLANT BREEDING & CRISPR PLANT MARKET, BY TYPE, 2020-2029 (USD MILLION)
TABLE 62 CANADA GENETIC ENGINEERING IN PLANT BREEDING & CRISPR PLANT MARKET, BY TYPE, 2020-2029 (USD MILLION)
TABLE 63 CANADA PLANT BREEDING & CRISPR PLANT MARKET, BY TRAIT, 2020-2029 (USD MILLION)
TABLE 64 CANADA PLANT BREEDING & CRISPR PLANT MARKET, BY APPLICATION, 2020-2029 (USD MILLION)
TABLE 65 CANADA CEREAL & GRAIN IN PLANT BREEDING & CRISPR PLANT MARKET, BY APPLICATION, 2020-2029 (USD MILLION)
TABLE 66 CANADA OILSEED & PULSES IN PLANT BREEDING & CRISPR PLANT MARKET, BY APPLICATION, 2020-2029 (USD MILLION)
TABLE 67 CANADA FRUITS & VEGETABLES IN PLANT BREEDING & CRISPR PLANT MARKET, BY APPLICATION, 2020-2029 (USD MILLION)
TABLE 68 CANADA LEAFY GREEN IN PLANT BREEDING & CRISPR PLANT MARKET, BY APPLICATION, 2020-2029 (USD MILLION)
TABLE 69 CANADA CASH CROPS IN PLANT BREEDING & CRISPR PLANT MARKET, BY APPLICATION, 2020-2029 (USD MILLION)
TABLE 70 CANADA HERBS AND MICROGREEN IN PLANT BREEDING & CRISPR PLANT MARKET, BY APPLICATION, 2020-2029 (USD MILLION)
TABLE 71 MEXICO PLANT BREEDING & CRISPR PLANT MARKET, BY TYPE, 2020-2029 (USD MILLION)
TABLE 72 MEXICO BIOTECHNOLOGICAL METHOD IN PLANT BREEDING & CRISPR PLANT MARKET, BY TYPE, 2020-2029 (USD MILLION)
TABLE 73 MEXICO CONVENTIONAL BREEDING IN PLANT BREEDING & CRISPR PLANT MARKET, BY TYPE, 2020-2029 (USD MILLION)
TABLE 74 MEXICO GENETIC ENGINEERING IN PLANT BREEDING & CRISPR PLANT MARKET, BY TYPE, 2020-2029 (USD MILLION)
TABLE 75 MEXICO PLANT BREEDING & CRISPR PLANT MARKET, BY TRAIT, 2020-2029 (USD MILLION)
TABLE 76 MEXICO PLANT BREEDING & CRISPR PLANT MARKET, BY APPLICATION, 2020-2029 (USD MILLION)
TABLE 77 MEXICO CEREAL & GRAIN IN PLANT BREEDING & CRISPR PLANT MARKET, BY APPLICATION, 2020-2029 (USD MILLION)
TABLE 78 MEXICO OILSEED & PULSES IN PLANT BREEDING & CRISPR PLANT MARKET, BY APPLICATION, 2020-2029 (USD MILLION)
TABLE 79 MEXICO FRUITS & VEGETABLES IN PLANT BREEDING & CRISPR PLANT MARKET, BY APPLICATION, 2020-2029 (USD MILLION)
TABLE 80 MEXICO LEAFY GREEN IN PLANT BREEDING & CRISPR PLANT MARKET, BY APPLICATION, 2020-2029 (USD MILLION)
TABLE 81 MEXICO CASH CROPS IN PLANT BREEDING & CRISPR PLANT MARKET, BY APPLICATION, 2020-2029 (USD MILLION)
TABLE 82 MEXICO HERBS AND MICROGREEN IN PLANT BREEDING & CRISPR PLANT MARKET, BY APPLICATION, 2020-2029 (USD MILLION)
TABLE 83 EUROPE PLANT BREEDING & CRISPR PLANT MARKET, BY COUNTRY, 2020-2029 (USD MILLION)
TABLE 84 EUROPE PLANT BREEDING & CRISPR PLANT MARKET, BY TYPE, 2020-2029 (USD MILLION)
TABLE 85 EUROPE BIOTECHNOLOGICAL METHOD IN PLANT BREEDING & CRISPR PLANT MARKET, BY TYPE, 2020-2029 (USD MILLION)
TABLE 86 EUROPE CONVENTIONAL BREEDING IN PLANT BREEDING & CRISPR PLANT MARKET, BY TYPE, 2020-2029 (USD MILLION)
TABLE 87 EUROPE GENETIC ENGINEERING IN PLANT BREEDING & CRISPR PLANT MARKET, BY TYPE, 2020-2029 (USD MILLION)
TABLE 88 EUROPE PLANT BREEDING & CRISPR PLANT MARKET, BY TRAIT, 2020-2029 (USD MILLION)
TABLE 89 EUROPE PLANT BREEDING & CRISPR PLANT MARKET, BY APPLICATION, 2020-2029 (USD MILLION)
TABLE 90 EUROPE CEREAL & GRAIN IN PLANT BREEDING & CRISPR PLANT MARKET, BY APPLICATION, 2020-2029 (USD MILLION)
TABLE 91 EUROPE OILSEED & PULSES IN PLANT BREEDING & CRISPR PLANT MARKET, BY APPLICATION, 2020-2029 (USD MILLION)
TABLE 92 EUROPE FRUITS & VEGETABLES IN PLANT BREEDING & CRISPR PLANT MARKET, BY APPLICATION, 2020-2029 (USD MILLION)
TABLE 93 EUROPE LEAFY GREEN IN PLANT BREEDING & CRISPR PLANT MARKET, BY APPLICATION, 2020-2029 (USD MILLION)
TABLE 94 EUROPE CASH CROPS IN PLANT BREEDING & CRISPR PLANT MARKET, BY APPLICATION, 2020-2029 (USD MILLION)
TABLE 95 EUROPE HERBS AND MICROGREEN IN PLANT BREEDING & CRISPR PLANT MARKET, BY APPLICATION, 2020-2029 (USD MILLION)
TABLE 96 GERMANY PLANT BREEDING & CRISPR PLANT MARKET, BY TYPE, 2020-2029 (USD MILLION)
TABLE 97 GERMANY BIOTECHNOLOGICAL METHOD IN PLANT BREEDING & CRISPR PLANT MARKET, BY TYPE, 2020-2029 (USD MILLION)
TABLE 98 GERMANY CONVENTIONAL BREEDING IN PLANT BREEDING & CRISPR PLANT MARKET, BY TYPE, 2020-2029 (USD MILLION)
TABLE 99 GERMANY GENETIC ENGINEERING IN PLANT BREEDING & CRISPR PLANT MARKET, BY TYPE, 2020-2029 (USD MILLION)
TABLE 100 GERMANY PLANT BREEDING & CRISPR PLANT MARKET, BY TRAIT, 2020-2029 (USD MILLION)
TABLE 101 GERMANY PLANT BREEDING & CRISPR PLANT MARKET, BY APPLICATION, 2020-2029 (USD MILLION)
TABLE 102 GERMANY CEREAL & GRAIN IN PLANT BREEDING & CRISPR PLANT MARKET, BY APPLICATION, 2020-2029 (USD MILLION)
TABLE 103 GERMANY OILSEED & PULSES IN PLANT BREEDING & CRISPR PLANT MARKET, BY APPLICATION, 2020-2029 (USD MILLION)
TABLE 104 GERMANY FRUITS & VEGETABLES IN PLANT BREEDING & CRISPR PLANT MARKET, BY APPLICATION, 2020-2029 (USD MILLION)
TABLE 105 GERMANY LEAFY GREEN IN PLANT BREEDING & CRISPR PLANT MARKET, BY APPLICATION, 2020-2029 (USD MILLION)
TABLE 106 GERMANY CASH CROPS IN PLANT BREEDING & CRISPR PLANT MARKET, BY APPLICATION, 2020-2029 (USD MILLION)
TABLE 107 GERMANY HERBS AND MICROGREEN IN PLANT BREEDING & CRISPR PLANT MARKET, BY APPLICATION, 2020-2029 (USD MILLION)
TABLE 108 FRANCE PLANT BREEDING & CRISPR PLANT MARKET, BY TYPE, 2020-2029 (USD MILLION)
TABLE 109 FRANCE BIOTECHNOLOGICAL METHOD IN PLANT BREEDING & CRISPR PLANT MARKET, BY TYPE, 2020-2029 (USD MILLION)
TABLE 110 FRANCE CONVENTIONAL BREEDING IN PLANT BREEDING & CRISPR PLANT MARKET, BY TYPE, 2020-2029 (USD MILLION)
TABLE 111 FRANCE GENETIC ENGINEERING IN PLANT BREEDING & CRISPR PLANT MARKET, BY TYPE, 2020-2029 (USD MILLION)
TABLE 112 FRANCE PLANT BREEDING & CRISPR PLANT MARKET, BY TRAIT, 2020-2029 (USD MILLION)
TABLE 113 FRANCE PLANT BREEDING & CRISPR PLANT MARKET, BY APPLICATION, 2020-2029 (USD MILLION)
TABLE 114 FRANCE CEREAL & GRAIN IN PLANT BREEDING & CRISPR PLANT MARKET, BY APPLICATION, 2020-2029 (USD MILLION)
TABLE 115 FRANCE OILSEED & PULSES IN PLANT BREEDING & CRISPR PLANT MARKET, BY APPLICATION, 2020-2029 (USD MILLION)
TABLE 116 FRANCE FRUITS & VEGETABLES IN PLANT BREEDING & CRISPR PLANT MARKET, BY APPLICATION, 2020-2029 (USD MILLION)
TABLE 117 FRANCE LEAFY GREEN IN PLANT BREEDING & CRISPR PLANT MARKET, BY APPLICATION, 2020-2029 (USD MILLION)
TABLE 118 FRANCE CASH CROPS IN PLANT BREEDING & CRISPR PLANT MARKET, BY APPLICATION, 2020-2029 (USD MILLION)
TABLE 119 FRANCE HERBS AND MICROGREEN IN PLANT BREEDING & CRISPR PLANT MARKET, BY APPLICATION, 2020-2029 (USD MILLION)
TABLE 120 U.K. PLANT BREEDING & CRISPR PLANT MARKET, BY TYPE, 2020-2029 (USD MILLION)
TABLE 121 U.K. BIOTECHNOLOGICAL METHOD IN PLANT BREEDING & CRISPR PLANT MARKET, BY TYPE, 2020-2029 (USD MILLION)
TABLE 122 U.K. CONVENTIONAL BREEDING IN PLANT BREEDING & CRISPR PLANT MARKET, BY TYPE, 2020-2029 (USD MILLION)
TABLE 123 U.K. GENETIC ENGINEERING IN PLANT BREEDING & CRISPR PLANT MARKET, BY TYPE, 2020-2029 (USD MILLION)
TABLE 124 U.K. PLANT BREEDING & CRISPR PLANT MARKET, BY TRAIT, 2020-2029 (USD MILLION)
TABLE 125 U.K. PLANT BREEDING & CRISPR PLANT MARKET, BY APPLICATION, 2020-2029 (USD MILLION)
TABLE 126 U.K. CEREAL & GRAIN IN PLANT BREEDING & CRISPR PLANT MARKET, BY APPLICATION, 2020-2029 (USD MILLION)
TABLE 127 U.K. OILSEED & PULSES IN PLANT BREEDING & CRISPR PLANT MARKET, BY APPLICATION, 2020-2029 (USD MILLION)
TABLE 128 U.K. FRUITS & VEGETABLES IN PLANT BREEDING & CRISPR PLANT MARKET, BY APPLICATION, 2020-2029 (USD MILLION)
TABLE 129 U.K. LEAFY GREEN IN PLANT BREEDING & CRISPR PLANT MARKET, BY APPLICATION, 2020-2029 (USD MILLION)
TABLE 130 U.K. CASH CROPS IN PLANT BREEDING & CRISPR PLANT MARKET, BY APPLICATION, 2020-2029 (USD MILLION)
TABLE 131 U.K. HERBS AND MICROGREEN IN PLANT BREEDING & CRISPR PLANT MARKET, BY APPLICATION, 2020-2029 (USD MILLION)
TABLE 132 RUSSIA PLANT BREEDING & CRISPR PLANT MARKET, BY TYPE, 2020-2029 (USD MILLION)
TABLE 133 RUSSIA BIOTECHNOLOGICAL METHOD IN PLANT BREEDING & CRISPR PLANT MARKET, BY TYPE, 2020-2029 (USD MILLION)
TABLE 134 RUSSIA CONVENTIONAL BREEDING IN PLANT BREEDING & CRISPR PLANT MARKET, BY TYPE, 2020-2029 (USD MILLION)
TABLE 135 RUSSIA GENETIC ENGINEERING IN PLANT BREEDING & CRISPR PLANT MARKET, BY TYPE, 2020-2029 (USD MILLION)
TABLE 136 RUSSIA PLANT BREEDING & CRISPR PLANT MARKET, BY TRAIT, 2020-2029 (USD MILLION)
TABLE 137 RUSSIA PLANT BREEDING & CRISPR PLANT MARKET, BY APPLICATION, 2020-2029 (USD MILLION)
TABLE 138 RUSSIA CEREAL & GRAIN IN PLANT BREEDING & CRISPR PLANT MARKET, BY APPLICATION, 2020-2029 (USD MILLION)
TABLE 139 RUSSIA OILSEED & PULSES IN PLANT BREEDING & CRISPR PLANT MARKET, BY APPLICATION, 2020-2029 (USD MILLION)
TABLE 140 RUSSIA FRUITS & VEGETABLES IN PLANT BREEDING & CRISPR PLANT MARKET, BY APPLICATION, 2020-2029 (USD MILLION)
TABLE 141 RUSSIA LEAFY GREEN IN PLANT BREEDING & CRISPR PLANT MARKET, BY APPLICATION, 2020-2029 (USD MILLION)
TABLE 142 RUSSIA CASH CROPS IN PLANT BREEDING & CRISPR PLANT MARKET, BY APPLICATION, 2020-2029 (USD MILLION)
TABLE 143 RUSSIA HERBS AND MICROGREEN IN PLANT BREEDING & CRISPR PLANT MARKET, BY APPLICATION, 2020-2029 (USD MILLION)
TABLE 144 ITALY PLANT BREEDING & CRISPR PLANT MARKET, BY TYPE, 2020-2029 (USD MILLION)
TABLE 145 ITALY BIOTECHNOLOGICAL METHOD IN PLANT BREEDING & CRISPR PLANT MARKET, BY TYPE, 2020-2029 (USD MILLION)
TABLE 146 ITALY CONVENTIONAL BREEDING IN PLANT BREEDING & CRISPR PLANT MARKET, BY TYPE, 2020-2029 (USD MILLION)
TABLE 147 ITALY GENETIC ENGINEERING IN PLANT BREEDING & CRISPR PLANT MARKET, BY TYPE, 2020-2029 (USD MILLION)
TABLE 148 ITALY PLANT BREEDING & CRISPR PLANT MARKET, BY TRAIT, 2020-2029 (USD MILLION)
TABLE 149 ITALY PLANT BREEDING & CRISPR PLANT MARKET, BY APPLICATION, 2020-2029 (USD MILLION)
TABLE 150 ITALY CEREAL & GRAIN IN PLANT BREEDING & CRISPR PLANT MARKET, BY APPLICATION, 2020-2029 (USD MILLION)
TABLE 151 ITALY OILSEED & PULSES IN PLANT BREEDING & CRISPR PLANT MARKET, BY APPLICATION, 2020-2029 (USD MILLION)
TABLE 152 ITALY FRUITS & VEGETABLES IN PLANT BREEDING & CRISPR PLANT MARKET, BY APPLICATION, 2020-2029 (USD MILLION)
TABLE 153 ITALY LEAFY GREEN IN PLANT BREEDING & CRISPR PLANT MARKET, BY APPLICATION, 2020-2029 (USD MILLION)
TABLE 154 ITALY CASH CROPS IN PLANT BREEDING & CRISPR PLANT MARKET, BY APPLICATION, 2020-2029 (USD MILLION)
TABLE 155 ITALY HERBS AND MICROGREEN IN PLANT BREEDING & CRISPR PLANT MARKET, BY APPLICATION, 2020-2029 (USD MILLION)
TABLE 156 SPAIN PLANT BREEDING & CRISPR PLANT MARKET, BY TYPE, 2020-2029 (USD MILLION)
TABLE 157 SPAIN BIOTECHNOLOGICAL METHOD IN PLANT BREEDING & CRISPR PLANT MARKET, BY TYPE, 2020-2029 (USD MILLION)
TABLE 158 SPAIN CONVENTIONAL BREEDING IN PLANT BREEDING & CRISPR PLANT MARKET, BY TYPE, 2020-2029 (USD MILLION)
TABLE 159 SPAIN GENETIC ENGINEERING IN PLANT BREEDING & CRISPR PLANT MARKET, BY TYPE, 2020-2029 (USD MILLION)
TABLE 160 SPAIN PLANT BREEDING & CRISPR PLANT MARKET, BY TRAIT, 2020-2029 (USD MILLION)
TABLE 161 SPAIN PLANT BREEDING & CRISPR PLANT MARKET, BY APPLICATION, 2020-2029 (USD MILLION)
TABLE 162 SPAIN CEREAL & GRAIN IN PLANT BREEDING & CRISPR PLANT MARKET, BY APPLICATION, 2020-2029 (USD MILLION)
TABLE 163 SPAIN OILSEED & PULSES IN PLANT BREEDING & CRISPR PLANT MARKET, BY APPLICATION, 2020-2029 (USD MILLION)
TABLE 164 SPAIN FRUITS & VEGETABLES IN PLANT BREEDING & CRISPR PLANT MARKET, BY APPLICATION, 2020-2029 (USD MILLION)
TABLE 165 SPAIN LEAFY GREEN IN PLANT BREEDING & CRISPR PLANT MARKET, BY APPLICATION, 2020-2029 (USD MILLION)
TABLE 166 SPAIN CASH CROPS IN PLANT BREEDING & CRISPR PLANT MARKET, BY APPLICATION, 2020-2029 (USD MILLION)
TABLE 167 SPAIN HERBS AND MICROGREEN IN PLANT BREEDING & CRISPR PLANT MARKET, BY APPLICATION, 2020-2029 (USD MILLION)
TABLE 168 NETHERLANDS PLANT BREEDING & CRISPR PLANT MARKET, BY TYPE, 2020-2029 (USD MILLION)
TABLE 169 NETHERLANDS BIOTECHNOLOGICAL METHOD IN PLANT BREEDING & CRISPR PLANT MARKET, BY TYPE, 2020-2029 (USD MILLION)
TABLE 170 NETHERLANDS CONVENTIONAL BREEDING IN PLANT BREEDING & CRISPR PLANT MARKET, BY TYPE, 2020-2029 (USD MILLION)
TABLE 171 NETHERLANDS GENETIC ENGINEERING IN PLANT BREEDING & CRISPR PLANT MARKET, BY TYPE, 2020-2029 (USD MILLION)
TABLE 172 NETHERLANDS PLANT BREEDING & CRISPR PLANT MARKET, BY TRAIT, 2020-2029 (USD MILLION)
TABLE 173 NETHERLANDS PLANT BREEDING & CRISPR PLANT MARKET, BY APPLICATION, 2020-2029 (USD MILLION)
TABLE 174 NETHERLANDS CEREAL & GRAIN IN PLANT BREEDING & CRISPR PLANT MARKET, BY APPLICATION, 2020-2029 (USD MILLION)
TABLE 175 NETHERLANDS OILSEED & PULSES IN PLANT BREEDING & CRISPR PLANT MARKET, BY APPLICATION, 2020-2029 (USD MILLION)
TABLE 176 NETHERLANDS FRUITS & VEGETABLES IN PLANT BREEDING & CRISPR PLANT MARKET, BY APPLICATION, 2020-2029 (USD MILLION)
TABLE 177 NETHERLANDS LEAFY GREEN IN PLANT BREEDING & CRISPR PLANT MARKET, BY APPLICATION, 2020-2029 (USD MILLION)
TABLE 178 NETHERLANDS CASH CROPS IN PLANT BREEDING & CRISPR PLANT MARKET, BY APPLICATION, 2020-2029 (USD MILLION)
TABLE 179 NETHERLANDS HERBS AND MICROGREEN IN PLANT BREEDING & CRISPR PLANT MARKET, BY APPLICATION, 2020-2029 (USD MILLION)
TABLE 180 SWITZERLAND PLANT BREEDING & CRISPR PLANT MARKET, BY TYPE, 2020-2029 (USD MILLION)
TABLE 181 SWITZERLAND BIOTECHNOLOGICAL METHOD IN PLANT BREEDING & CRISPR PLANT MARKET, BY TYPE, 2020-2029 (USD MILLION)
TABLE 182 SWITZERLAND CONVENTIONAL BREEDING IN PLANT BREEDING & CRISPR PLANT MARKET, BY TYPE, 2020-2029 (USD MILLION)
TABLE 183 SWITZERLAND GENETIC ENGINEERING IN PLANT BREEDING & CRISPR PLANT MARKET, BY TYPE, 2020-2029 (USD MILLION)
TABLE 184 SWITZERLAND PLANT BREEDING & CRISPR PLANT MARKET, BY TRAIT, 2020-2029 (USD MILLION)
TABLE 185 SWITZERLAND PLANT BREEDING & CRISPR PLANT MARKET, BY APPLICATION, 2020-2029 (USD MILLION)
TABLE 186 SWITZERLAND CEREAL & GRAIN IN PLANT BREEDING & CRISPR PLANT MARKET, BY APPLICATION, 2020-2029 (USD MILLION)
TABLE 187 SWITZERLAND OILSEED & PULSES IN PLANT BREEDING & CRISPR PLANT MARKET, BY APPLICATION, 2020-2029 (USD MILLION)
TABLE 188 SWITZERLAND FRUITS & VEGETABLES IN PLANT BREEDING & CRISPR PLANT MARKET, BY APPLICATION, 2020-2029 (USD MILLION)
TABLE 189 SWITZERLAND LEAFY GREEN IN PLANT BREEDING & CRISPR PLANT MARKET, BY APPLICATION, 2020-2029 (USD MILLION)
TABLE 190 SWITZERLAND CASH CROPS IN PLANT BREEDING & CRISPR PLANT MARKET, BY APPLICATION, 2020-2029 (USD MILLION)
TABLE 191 SWITZERLAND HERBS AND MICROGREEN IN PLANT BREEDING & CRISPR PLANT MARKET, BY APPLICATION, 2020-2029 (USD MILLION)
TABLE 192 BELGIUM PLANT BREEDING & CRISPR PLANT MARKET, BY TYPE, 2020-2029 (USD MILLION)
TABLE 193 BELGIUM BIOTECHNOLOGICAL METHOD IN PLANT BREEDING & CRISPR PLANT MARKET, BY TYPE, 2020-2029 (USD MILLION)
TABLE 194 BELGIUM CONVENTIONAL BREEDING IN PLANT BREEDING & CRISPR PLANT MARKET, BY TYPE, 2020-2029 (USD MILLION)
TABLE 195 BELGIUM GENETIC ENGINEERING IN PLANT BREEDING & CRISPR PLANT MARKET, BY TYPE, 2020-2029 (USD MILLION)
TABLE 196 BELGIUM PLANT BREEDING & CRISPR PLANT MARKET, BY TRAIT, 2020-2029 (USD MILLION)
TABLE 197 BELGIUM PLANT BREEDING & CRISPR PLANT MARKET, BY APPLICATION, 2020-2029 (USD MILLION)
TABLE 198 BELGIUM CEREAL & GRAIN IN PLANT BREEDING & CRISPR PLANT MARKET, BY APPLICATION, 2020-2029 (USD MILLION)
TABLE 199 BELGIUM OILSEED & PULSES IN PLANT BREEDING & CRISPR PLANT MARKET, BY APPLICATION, 2020-2029 (USD MILLION)
TABLE 200 BELGIUM FRUITS & VEGETABLES IN PLANT BREEDING & CRISPR PLANT MARKET, BY APPLICATION, 2020-2029 (USD MILLION)
TABLE 201 BELGIUM LEAFY GREEN IN PLANT BREEDING & CRISPR PLANT MARKET, BY APPLICATION, 2020-2029 (USD MILLION)
TABLE 202 BELGIUM CASH CROPS IN PLANT BREEDING & CRISPR PLANT MARKET, BY APPLICATION, 2020-2029 (USD MILLION)
TABLE 203 BELGIUM HERBS AND MICROGREEN IN PLANT BREEDING & CRISPR PLANT MARKET, BY APPLICATION, 2020-2029 (USD MILLION)
TABLE 204 POLAND PLANT BREEDING & CRISPR PLANT MARKET, BY TYPE, 2020-2029 (USD MILLION)
TABLE 205 POLAND BIOTECHNOLOGICAL METHOD IN PLANT BREEDING & CRISPR PLANT MARKET, BY TYPE, 2020-2029 (USD MILLION)
TABLE 206 POLAND CONVENTIONAL BREEDING IN PLANT BREEDING & CRISPR PLANT MARKET, BY TYPE, 2020-2029 (USD MILLION)
TABLE 207 POLAND PLANT BREEDING & CRISPR PLANT MARKET, BY TRAIT, 2020-2029 (USD MILLION)
TABLE 208 POLAND PLANT BREEDING & CRISPR PLANT MARKET, BY APPLICATION, 2020-2029 (USD MILLION)
TABLE 209 POLAND CEREAL & GRAIN IN PLANT BREEDING & CRISPR PLANT MARKET, BY APPLICATION, 2020-2029 (USD MILLION)
TABLE 210 POLAND OILSEED & PULSES IN PLANT BREEDING & CRISPR PLANT MARKET, BY APPLICATION, 2020-2029 (USD MILLION)
TABLE 211 POLAND FRUITS & VEGETABLES IN PLANT BREEDING & CRISPR PLANT MARKET, BY APPLICATION, 2020-2029 (USD MILLION)
TABLE 212 POLAND LEAFY GREEN IN PLANT BREEDING & CRISPR PLANT MARKET, BY APPLICATION, 2020-2029 (USD MILLION)
TABLE 213 POLAND CASH CROPS IN PLANT BREEDING & CRISPR PLANT MARKET, BY APPLICATION, 2020-2029 (USD MILLION)
TABLE 214 POLAND HERBS AND MICROGREEN IN PLANT BREEDING & CRISPR PLANT MARKET, BY APPLICATION, 2020-2029 (USD MILLION)
TABLE 215 TURKEY PLANT BREEDING & CRISPR PLANT MARKET, BY TYPE, 2020-2029 (USD MILLION)
TABLE 216 TURKEY BIOTECHNOLOGICAL METHOD IN PLANT BREEDING & CRISPR PLANT MARKET, BY TYPE, 2020-2029 (USD MILLION)
TABLE 217 TURKEY CONVENTIONAL BREEDING IN PLANT BREEDING & CRISPR PLANT MARKET, BY TYPE, 2020-2029 (USD MILLION)
TABLE 218 TURKEY GENETIC ENGINEERING IN PLANT BREEDING & CRISPR PLANT MARKET, BY TYPE, 2020-2029 (USD MILLION)
TABLE 219 TURKEY PLANT BREEDING & CRISPR PLANT MARKET, BY TRAIT, 2020-2029 (USD MILLION)
TABLE 220 TURKEY PLANT BREEDING & CRISPR PLANT MARKET, BY APPLICATION, 2020-2029 (USD MILLION)
TABLE 221 TURKEY CEREAL & GRAIN IN PLANT BREEDING & CRISPR PLANT MARKET, BY APPLICATION, 2020-2029 (USD MILLION)
TABLE 222 TURKEY OILSEED & PULSES IN PLANT BREEDING & CRISPR PLANT MARKET, BY APPLICATION, 2020-2029 (USD MILLION)
TABLE 223 TURKEY FRUITS & VEGETABLES IN PLANT BREEDING & CRISPR PLANT MARKET, BY APPLICATION, 2020-2029 (USD MILLION)
TABLE 224 TURKEY LEAFY GREEN IN PLANT BREEDING & CRISPR PLANT MARKET, BY APPLICATION, 2020-2029 (USD MILLION)
TABLE 225 TURKEY CASH CROPS IN PLANT BREEDING & CRISPR PLANT MARKET, BY APPLICATION, 2020-2029 (USD MILLION)
TABLE 226 TURKEY HERBS AND MICROGREEN IN PLANT BREEDING & CRISPR PLANT MARKET, BY APPLICATION, 2020-2029 (USD MILLION)
TABLE 227 SWEDEN PLANT BREEDING & CRISPR PLANT MARKET, BY TYPE, 2020-2029 (USD MILLION)
TABLE 228 SWEDEN BIOTECHNOLOGICAL METHOD IN PLANT BREEDING & CRISPR PLANT MARKET, BY TYPE, 2020-2029 (USD MILLION)
TABLE 229 SWEDEN CONVENTIONAL BREEDING IN PLANT BREEDING & CRISPR PLANT MARKET, BY TYPE, 2020-2029 (USD MILLION)
TABLE 230 SWEDEN GENETIC ENGINEERING IN PLANT BREEDING & CRISPR PLANT MARKET, BY TYPE, 2020-2029 (USD MILLION)
TABLE 231 SWEDEN PLANT BREEDING & CRISPR PLANT MARKET, BY TRAIT, 2020-2029 (USD MILLION)
TABLE 232 SWEDEN PLANT BREEDING & CRISPR PLANT MARKET, BY APPLICATION, 2020-2029 (USD MILLION)
TABLE 233 SWEDEN CEREAL & GRAIN IN PLANT BREEDING & CRISPR PLANT MARKET, BY APPLICATION, 2020-2029 (USD MILLION)
TABLE 234 SWEDEN OILSEED & PULSES IN PLANT BREEDING & CRISPR PLANT MARKET, BY APPLICATION, 2020-2029 (USD MILLION)
TABLE 235 SWEDEN FRUITS & VEGETABLES IN PLANT BREEDING & CRISPR PLANT MARKET, BY APPLICATION, 2020-2029 (USD MILLION)
TABLE 236 SWEDEN LEAFY GREEN IN PLANT BREEDING & CRISPR PLANT MARKET, BY APPLICATION, 2020-2029 (USD MILLION)
TABLE 237 SWEDEN CASH CROPS IN PLANT BREEDING & CRISPR PLANT MARKET, BY APPLICATION, 2020-2029 (USD MILLION)
TABLE 238 SWEDEN HERBS AND MICROGREEN IN PLANT BREEDING & CRISPR PLANT MARKET, BY APPLICATION, 2020-2029 (USD MILLION)
TABLE 239 IRELAND PLANT BREEDING & CRISPR PLANT MARKET, BY TYPE, 2020-2029 (USD MILLION)
TABLE 240 IRELAND BIOTECHNOLOGICAL METHOD IN PLANT BREEDING & CRISPR PLANT MARKET, BY TYPE, 2020-2029 (USD MILLION)
TABLE 241 IRELAND CONVENTIONAL BREEDING IN PLANT BREEDING & CRISPR PLANT MARKET, BY TYPE, 2020-2029 (USD MILLION)
TABLE 242 IRELAND GENETIC ENGINEERING IN PLANT BREEDING & CRISPR PLANT MARKET, BY TYPE, 2020-2029 (USD MILLION)
TABLE 243 IRELAND PLANT BREEDING & CRISPR PLANT MARKET, BY TRAIT, 2020-2029 (USD MILLION)
TABLE 244 IRELAND PLANT BREEDING & CRISPR PLANT MARKET, BY APPLICATION, 2020-2029 (USD MILLION)
TABLE 245 IRELAND CEREAL & GRAIN IN PLANT BREEDING & CRISPR PLANT MARKET, BY APPLICATION, 2020-2029 (USD MILLION)
TABLE 246 IRELAND OILSEED & PULSES IN PLANT BREEDING & CRISPR PLANT MARKET, BY APPLICATION, 2020-2029 (USD MILLION)
TABLE 247 IRELAND FRUITS & VEGETABLES IN PLANT BREEDING & CRISPR PLANT MARKET, BY APPLICATION, 2020-2029 (USD MILLION)
TABLE 248 IRELAND LEAFY GREEN IN PLANT BREEDING & CRISPR PLANT MARKET, BY APPLICATION, 2020-2029 (USD MILLION)
TABLE 249 IRELAND CASH CROPS IN PLANT BREEDING & CRISPR PLANT MARKET, BY APPLICATION, 2020-2029 (USD MILLION)
TABLE 250 IRELAND HERBS AND MICROGREEN IN PLANT BREEDING & CRISPR PLANT MARKET, BY APPLICATION, 2020-2029 (USD MILLION)
TABLE 251 REST OF EUROPE PLANT BREEDING & CRISPR PLANT MARKET, BY TYPE, 2020-2029 (USD MILLION)
TABLE 252 ASIA-PACIFIC PLANT BREEDING & CRISPR PLANT MARKET, BY COUNTRY, 2020-2029 (USD MILLION)
TABLE 253 ASIA-PACIFIC PLANT BREEDING & CRISPR PLANT MARKET, BY TYPE, 2020-2029 (USD MILLION)
TABLE 254 ASIA-PACIFIC BIOTECHNOLOGICAL METHOD IN PLANT BREEDING & CRISPR PLANT MARKET, BY TYPE, 2020-2029 (USD MILLION)
TABLE 255 ASIA-PACIFIC CONVENTIONAL BREEDING IN PLANT BREEDING & CRISPR PLANT MARKET, BY TYPE, 2020-2029 (USD MILLION)
TABLE 256 ASIA-PACIFIC GENETIC ENGINEERING IN PLANT BREEDING & CRISPR PLANT MARKET, BY TYPE, 2020-2029 (USD MILLION)
TABLE 257 ASIA-PACIFIC PLANT BREEDING & CRISPR PLANT MARKET, BY TRAIT, 2020-2029 (USD MILLION)
TABLE 258 ASIA-PACIFIC PLANT BREEDING & CRISPR PLANT MARKET, BY APPLICATION, 2020-2029 (USD MILLION)
TABLE 259 ASIA-PACIFIC CEREAL & GRAIN IN PLANT BREEDING & CRISPR PLANT MARKET, BY APPLICATION, 2020-2029 (USD MILLION)
TABLE 260 ASIA-PACIFIC OILSEED & PULSES IN PLANT BREEDING & CRISPR PLANT MARKET, BY APPLICATION, 2020-2029 (USD MILLION)
TABLE 261 ASIA-PACIFIC FRUITS & VEGETABLES IN PLANT BREEDING & CRISPR PLANT MARKET, BY APPLICATION, 2020-2029 (USD MILLION)
TABLE 262 ASIA-PACIFIC LEAFY GREEN IN PLANT BREEDING & CRISPR PLANT MARKET, BY APPLICATION, 2020-2029 (USD MILLION)
TABLE 263 ASIA-PACIFIC CASH CROPS IN PLANT BREEDING & CRISPR PLANT MARKET, BY APPLICATION, 2020-2029 (USD MILLION)
TABLE 264 ASIA-PACIFIC HERBS AND MICROGREEN IN PLANT BREEDING & CRISPR PLANT MARKET, BY APPLICATION, 2020-2029 (USD MILLION)
TABLE 265 CHINA PLANT BREEDING & CRISPR PLANT MARKET, BY TYPE, 2020-2029 (USD MILLION)
TABLE 266 CHINA BIOTECHNOLOGICAL METHOD IN PLANT BREEDING & CRISPR PLANT MARKET, BY TYPE, 2020-2029 (USD MILLION)
TABLE 267 CHINA CONVENTIONAL BREEDING IN PLANT BREEDING & CRISPR PLANT MARKET, BY TYPE, 2020-2029 (USD MILLION)
TABLE 268 CHINA GENETIC ENGINEERING IN PLANT BREEDING & CRISPR PLANT MARKET, BY TYPE, 2020-2029 (USD MILLION)
TABLE 269 CHINA PLANT BREEDING & CRISPR PLANT MARKET, BY TRAIT, 2020-2029 (USD MILLION)
TABLE 270 CHINA PLANT BREEDING & CRISPR PLANT MARKET, BY APPLICATION, 2020-2029 (USD MILLION)
TABLE 271 CHINA CEREAL & GRAIN IN PLANT BREEDING & CRISPR PLANT MARKET, BY APPLICATION, 2020-2029 (USD MILLION)
TABLE 272 CHINA OILSEED & PULSES IN PLANT BREEDING & CRISPR PLANT MARKET, BY APPLICATION, 2020-2029 (USD MILLION)
TABLE 273 CHINA FRUITS & VEGETABLES IN PLANT BREEDING & CRISPR PLANT MARKET, BY APPLICATION, 2020-2029 (USD MILLION)
TABLE 274 CHINA LEAFY GREEN IN PLANT BREEDING & CRISPR PLANT MARKET, BY APPLICATION, 2020-2029 (USD MILLION)
TABLE 275 CHINA CASH CROPS IN PLANT BREEDING & CRISPR PLANT MARKET, BY APPLICATION, 2020-2029 (USD MILLION)
TABLE 276 CHINA HERBS AND MICROGREEN IN PLANT BREEDING & CRISPR PLANT MARKET, BY APPLICATION, 2020-2029 (USD MILLION)
TABLE 277 JAPAN PLANT BREEDING & CRISPR PLANT MARKET, BY TYPE, 2020-2029 (USD MILLION)
TABLE 278 JAPAN BIOTECHNOLOGICAL METHOD IN PLANT BREEDING & CRISPR PLANT MARKET, BY TYPE, 2020-2029 (USD MILLION)
TABLE 279 JAPAN CONVENTIONAL BREEDING IN PLANT BREEDING & CRISPR PLANT MARKET, BY TYPE, 2020-2029 (USD MILLION)
TABLE 280 JAPAN GENETIC ENGINEERING IN PLANT BREEDING & CRISPR PLANT MARKET, BY TYPE, 2020-2029 (USD MILLION)
TABLE 281 JAPAN PLANT BREEDING & CRISPR PLANT MARKET, BY TRAIT, 2020-2029 (USD MILLION)
TABLE 282 JAPAN PLANT BREEDING & CRISPR PLANT MARKET, BY APPLICATION, 2020-2029 (USD MILLION)
TABLE 283 JAPAN CEREAL & GRAIN IN PLANT BREEDING & CRISPR PLANT MARKET, BY APPLICATION, 2020-2029 (USD MILLION)
TABLE 284 JAPAN OILSEED & PULSES IN PLANT BREEDING & CRISPR PLANT MARKET, BY APPLICATION, 2020-2029 (USD MILLION)
TABLE 285 JAPAN FRUITS & VEGETABLES IN PLANT BREEDING & CRISPR PLANT MARKET, BY APPLICATION, 2020-2029 (USD MILLION)
TABLE 286 JAPAN LEAFY GREEN IN PLANT BREEDING & CRISPR PLANT MARKET, BY APPLICATION, 2020-2029 (USD MILLION)
TABLE 287 JAPAN CASH CROPS IN PLANT BREEDING & CRISPR PLANT MARKET, BY APPLICATION, 2020-2029 (USD MILLION)
TABLE 288 JAPAN HERBS AND MICROGREEN IN PLANT BREEDING & CRISPR PLANT MARKET, BY APPLICATION, 2020-2029 (USD MILLION)
TABLE 289 INDIA PLANT BREEDING & CRISPR PLANT MARKET, BY TYPE, 2020-2029 (USD MILLION)
TABLE 290 INDIA BIOTECHNOLOGICAL METHOD IN PLANT BREEDING & CRISPR PLANT MARKET, BY TYPE, 2020-2029 (USD MILLION)
TABLE 291 INDIA CONVENTIONAL BREEDING IN PLANT BREEDING & CRISPR PLANT MARKET, BY TYPE, 2020-2029 (USD MILLION)
TABLE 292 INDIA GENETIC ENGINEERING IN PLANT BREEDING & CRISPR PLANT MARKET, BY TYPE, 2020-2029 (USD MILLION)
TABLE 293 INDIA PLANT BREEDING & CRISPR PLANT MARKET, BY TRAIT, 2020-2029 (USD MILLION)
TABLE 294 INDIA PLANT BREEDING & CRISPR PLANT MARKET, BY APPLICATION, 2020-2029 (USD MILLION)
TABLE 295 INDIA CEREAL & GRAIN IN PLANT BREEDING & CRISPR PLANT MARKET, BY APPLICATION, 2020-2029 (USD MILLION)
TABLE 296 INDIA OILSEED & PULSES IN PLANT BREEDING & CRISPR PLANT MARKET, BY APPLICATION, 2020-2029 (USD MILLION)
TABLE 297 INDIA FRUITS & VEGETABLES IN PLANT BREEDING & CRISPR PLANT MARKET, BY APPLICATION, 2020-2029 (USD MILLION)
TABLE 298 INDIA LEAFY GREEN IN PLANT BREEDING & CRISPR PLANT MARKET, BY APPLICATION, 2020-2029 (USD MILLION)
TABLE 299 INDIA CASH CROPS IN PLANT BREEDING & CRISPR PLANT MARKET, BY APPLICATION, 2020-2029 (USD MILLION)
TABLE 300 INDIA HERBS AND MICROGREEN IN PLANT BREEDING & CRISPR PLANT MARKET, BY APPLICATION, 2020-2029 (USD MILLION)
TABLE 301 SOUTH KOREA PLANT BREEDING & CRISPR PLANT MARKET, BY TYPE, 2020-2029 (USD MILLION)
TABLE 302 SOUTH KOREA BIOTECHNOLOGICAL METHOD IN PLANT BREEDING & CRISPR PLANT MARKET, BY TYPE, 2020-2029 (USD MILLION)
TABLE 303 SOUTH KOREA CONVENTIONAL BREEDING IN PLANT BREEDING & CRISPR PLANT MARKET, BY TYPE, 2020-2029 (USD MILLION)
TABLE 304 SOUTH KOREA GENETIC ENGINEERING IN PLANT BREEDING & CRISPR PLANT MARKET, BY TYPE, 2020-2029 (USD MILLION)
TABLE 305 SOUTH KOREA PLANT BREEDING & CRISPR PLANT MARKET, BY TRAIT, 2020-2029 (USD MILLION)
TABLE 306 SOUTH KOREA PLANT BREEDING & CRISPR PLANT MARKET, BY APPLICATION, 2020-2029 (USD MILLION)
TABLE 307 SOUTH KOREA CEREAL & GRAIN IN PLANT BREEDING & CRISPR PLANT MARKET, BY APPLICATION, 2020-2029 (USD MILLION)
TABLE 308 SOUTH KOREA OILSEED & PULSES IN PLANT BREEDING & CRISPR PLANT MARKET, BY APPLICATION, 2020-2029 (USD MILLION)
TABLE 309 SOUTH KOREA FRUITS & VEGETABLES IN PLANT BREEDING & CRISPR PLANT MARKET, BY APPLICATION, 2020-2029 (USD MILLION)
TABLE 310 SOUTH KOREA LEAFY GREEN IN PLANT BREEDING & CRISPR PLANT MARKET, BY APPLICATION, 2020-2029 (USD MILLION)
TABLE 311 SOUTH KOREA CASH CROPS IN PLANT BREEDING & CRISPR PLANT MARKET, BY APPLICATION, 2020-2029 (USD MILLION)
TABLE 312 SOUTH KOREA HERBS AND MICROGREEN IN PLANT BREEDING & CRISPR PLANT MARKET, BY APPLICATION, 2020-2029 (USD MILLION)
TABLE 313 AUSTRALIA PLANT BREEDING & CRISPR PLANT MARKET, BY TYPE, 2020-2029 (USD MILLION)
TABLE 314 AUSTRALIA BIOTECHNOLOGICAL METHOD IN PLANT BREEDING & CRISPR PLANT MARKET, BY TYPE, 2020-2029 (USD MILLION)
TABLE 315 AUSTRALIA CONVENTIONAL BREEDING IN PLANT BREEDING & CRISPR PLANT MARKET, BY TYPE, 2020-2029 (USD MILLION)
TABLE 316 AUSTRALIA GENETIC ENGINEERING IN PLANT BREEDING & CRISPR PLANT MARKET, BY TYPE, 2020-2029 (USD MILLION)
TABLE 317 AUSTRALIA PLANT BREEDING & CRISPR PLANT MARKET, BY TRAIT, 2020-2029 (USD MILLION)
TABLE 318 AUSTRALIA PLANT BREEDING & CRISPR PLANT MARKET, BY APPLICATION, 2020-2029 (USD MILLION)
TABLE 319 AUSTRALIA CEREAL & GRAIN IN PLANT BREEDING & CRISPR PLANT MARKET, BY APPLICATION, 2020-2029 (USD MILLION)
TABLE 320 AUSTRALIA OILSEED & PULSES IN PLANT BREEDING & CRISPR PLANT MARKET, BY APPLICATION, 2020-2029 (USD MILLION)
TABLE 321 AUSTRALIA FRUITS & VEGETABLES IN PLANT BREEDING & CRISPR PLANT MARKET, BY APPLICATION, 2020-2029 (USD MILLION)
TABLE 322 AUSTRALIA LEAFY GREEN IN PLANT BREEDING & CRISPR PLANT MARKET, BY APPLICATION, 2020-2029 (USD MILLION)
TABLE 323 AUSTRALIA CASH CROPS IN PLANT BREEDING & CRISPR PLANT MARKET, BY APPLICATION, 2020-2029 (USD MILLION)
TABLE 324 AUSTRALIA HERBS AND MICROGREEN IN PLANT BREEDING & CRISPR PLANT MARKET, BY APPLICATION, 2020-2029 (USD MILLION)
TABLE 325 SINGAPORE PLANT BREEDING & CRISPR PLANT MARKET, BY TYPE, 2020-2029 (USD MILLION)
TABLE 326 SINGAPORE BIOTECHNOLOGICAL METHOD IN PLANT BREEDING & CRISPR PLANT MARKET, BY TYPE, 2020-2029 (USD MILLION)
TABLE 327 SINGAPORE CONVENTIONAL BREEDING IN PLANT BREEDING & CRISPR PLANT MARKET, BY TYPE, 2020-2029 (USD MILLION)
TABLE 328 SINGAPORE GENETIC ENGINEERING IN PLANT BREEDING & CRISPR PLANT MARKET, BY TYPE, 2020-2029 (USD MILLION)
TABLE 329 SINGAPORE PLANT BREEDING & CRISPR PLANT MARKET, BY TRAIT, 2020-2029 (USD MILLION)
TABLE 330 SINGAPORE PLANT BREEDING & CRISPR PLANT MARKET, BY APPLICATION, 2020-2029 (USD MILLION)
TABLE 331 SINGAPORE CEREAL & GRAIN IN PLANT BREEDING & CRISPR PLANT MARKET, BY APPLICATION, 2020-2029 (USD MILLION)
TABLE 332 SINGAPORE OILSEED & PULSES IN PLANT BREEDING & CRISPR PLANT MARKET, BY APPLICATION, 2020-2029 (USD MILLION)
TABLE 333 SINGAPORE FRUITS & VEGETABLES IN PLANT BREEDING & CRISPR PLANT MARKET, BY APPLICATION, 2020-2029 (USD MILLION)
TABLE 334 SINGAPORE LEAFY GREEN IN PLANT BREEDING & CRISPR PLANT MARKET, BY APPLICATION, 2020-2029 (USD MILLION)
TABLE 335 SINGAPORE CASH CROPS IN PLANT BREEDING & CRISPR PLANT MARKET, BY APPLICATION, 2020-2029 (USD MILLION)
TABLE 336 SINGAPORE HERBS AND MICROGREEN IN PLANT BREEDING & CRISPR PLANT MARKET, BY APPLICATION, 2020-2029 (USD MILLION)
TABLE 337 THAILAND PLANT BREEDING & CRISPR PLANT MARKET, BY TYPE, 2020-2029 (USD MILLION)
TABLE 338 THAILAND BIOTECHNOLOGICAL METHOD IN PLANT BREEDING & CRISPR PLANT MARKET, BY TYPE, 2020-2029 (USD MILLION)
TABLE 339 THAILAND CONVENTIONAL BREEDING IN PLANT BREEDING & CRISPR PLANT MARKET, BY TYPE, 2020-2029 (USD MILLION)
TABLE 340 THAILAND GENETIC ENGINEERING IN PLANT BREEDING & CRISPR PLANT MARKET, BY TYPE, 2020-2029 (USD MILLION)
TABLE 341 THAILAND PLANT BREEDING & CRISPR PLANT MARKET, BY TRAIT, 2020-2029 (USD MILLION)
TABLE 342 THAILAND PLANT BREEDING & CRISPR PLANT MARKET, BY APPLICATION, 2020-2029 (USD MILLION)
TABLE 343 THAILAND CEREAL & GRAIN IN PLANT BREEDING & CRISPR PLANT MARKET, BY APPLICATION, 2020-2029 (USD MILLION)
TABLE 344 THAILAND OILSEED & PULSES IN PLANT BREEDING & CRISPR PLANT MARKET, BY APPLICATION, 2020-2029 (USD MILLION)
TABLE 345 THAILAND FRUITS & VEGETABLES IN PLANT BREEDING & CRISPR PLANT MARKET, BY APPLICATION, 2020-2029 (USD MILLION)
TABLE 346 THAILAND LEAFY GREEN IN PLANT BREEDING & CRISPR PLANT MARKET, BY APPLICATION, 2020-2029 (USD MILLION)
TABLE 347 THAILAND CASH CROPS IN PLANT BREEDING & CRISPR PLANT MARKET, BY APPLICATION, 2020-2029 (USD MILLION)
TABLE 348 THAILAND HERBS AND MICROGREEN IN PLANT BREEDING & CRISPR PLANT MARKET, BY APPLICATION, 2020-2029 (USD MILLION)
TABLE 349 INDONESIA PLANT BREEDING & CRISPR PLANT MARKET, BY TYPE, 2020-2029 (USD MILLION)
TABLE 350 INDONESIA BIOTECHNOLOGICAL METHOD IN PLANT BREEDING & CRISPR PLANT MARKET, BY TYPE, 2020-2029 (USD MILLION)
TABLE 351 INDONESIA CONVENTIONAL BREEDING IN PLANT BREEDING & CRISPR PLANT MARKET, BY TYPE, 2020-2029 (USD MILLION)
TABLE 352 INDONESIA GENETIC ENGINEERING IN PLANT BREEDING & CRISPR PLANT MARKET, BY TYPE, 2020-2029 (USD MILLION)
TABLE 353 INDONESIA PLANT BREEDING & CRISPR PLANT MARKET, BY TRAIT, 2020-2029 (USD MILLION)
TABLE 354 INDONESIA PLANT BREEDING & CRISPR PLANT MARKET, BY APPLICATION, 2020-2029 (USD MILLION)
TABLE 355 INDONESIA CEREAL & GRAIN IN PLANT BREEDING & CRISPR PLANT MARKET, BY APPLICATION, 2020-2029 (USD MILLION)
TABLE 356 INDONESIA OILSEED & PULSES IN PLANT BREEDING & CRISPR PLANT MARKET, BY APPLICATION, 2020-2029 (USD MILLION)
TABLE 357 INDONESIA FRUITS & VEGETABLES IN PLANT BREEDING & CRISPR PLANT MARKET, BY APPLICATION, 2020-2029 (USD MILLION)
TABLE 358 INDONESIA LEAFY GREEN IN PLANT BREEDING & CRISPR PLANT MARKET, BY APPLICATION, 2020-2029 (USD MILLION)
TABLE 359 INDONESIA CASH CROPS IN PLANT BREEDING & CRISPR PLANT MARKET, BY APPLICATION, 2020-2029 (USD MILLION)
TABLE 360 INDONESIA HERBS AND MICROGREEN IN PLANT BREEDING & CRISPR PLANT MARKET, BY APPLICATION, 2020-2029 (USD MILLION)
TABLE 361 PHILIPPINES PLANT BREEDING & CRISPR PLANT MARKET, BY TYPE, 2020-2029 (USD MILLION)
TABLE 362 PHILIPPINES BIOTECHNOLOGICAL METHOD IN PLANT BREEDING & CRISPR PLANT MARKET, BY TYPE, 2020-2029 (USD MILLION)
TABLE 363 PHILIPPINES CONVENTIONAL BREEDING IN PLANT BREEDING & CRISPR PLANT MARKET, BY TYPE, 2020-2029 (USD MILLION)
TABLE 364 PHILIPPINES GENETIC ENGINEERING IN PLANT BREEDING & CRISPR PLANT MARKET, BY TYPE, 2020-2029 (USD MILLION)
TABLE 365 PHILIPPINES PLANT BREEDING & CRISPR PLANT MARKET, BY TRAIT, 2020-2029 (USD MILLION)
TABLE 366 PHILIPPINES PLANT BREEDING & CRISPR PLANT MARKET, BY APPLICATION, 2020-2029 (USD MILLION)
TABLE 367 PHILIPPINES CEREAL & GRAIN IN PLANT BREEDING & CRISPR PLANT MARKET, BY APPLICATION, 2020-2029 (USD MILLION)
TABLE 368 PHILIPPINES OILSEED & PULSES IN PLANT BREEDING & CRISPR PLANT MARKET, BY APPLICATION, 2020-2029 (USD MILLION)
TABLE 369 PHILIPPINES FRUITS & VEGETABLES IN PLANT BREEDING & CRISPR PLANT MARKET, BY APPLICATION, 2020-2029 (USD MILLION)
TABLE 370 PHILIPPINES LEAFY GREEN IN PLANT BREEDING & CRISPR PLANT MARKET, BY APPLICATION, 2020-2029 (USD MILLION)
TABLE 371 PHILIPPINES CASH CROPS IN PLANT BREEDING & CRISPR PLANT MARKET, BY APPLICATION, 2020-2029 (USD MILLION)
TABLE 372 PHILIPPINES HERBS AND MICROGREEN IN PLANT BREEDING & CRISPR PLANT MARKET, BY APPLICATION, 2020-2029 (USD MILLION)
TABLE 373 MALAYSIA PLANT BREEDING & CRISPR PLANT MARKET, BY TYPE, 2020-2029 (USD MILLION)
TABLE 374 MALAYSIA BIOTECHNOLOGICAL METHOD IN PLANT BREEDING & CRISPR PLANT MARKET, BY TYPE, 2020-2029 (USD MILLION)
TABLE 375 MALAYSIA CONVENTIONAL BREEDING IN PLANT BREEDING & CRISPR PLANT MARKET, BY TYPE, 2020-2029 (USD MILLION)
TABLE 376 MALAYSIA GENETIC ENGINEERING IN PLANT BREEDING & CRISPR PLANT MARKET, BY TYPE, 2020-2029 (USD MILLION)
TABLE 377 MALAYSIA PLANT BREEDING & CRISPR PLANT MARKET, BY TRAIT, 2020-2029 (USD MILLION)
TABLE 378 MALAYSIA PLANT BREEDING & CRISPR PLANT MARKET, BY APPLICATION, 2020-2029 (USD MILLION)
TABLE 379 MALAYSIA CEREAL & GRAIN IN PLANT BREEDING & CRISPR PLANT MARKET, BY APPLICATION, 2020-2029 (USD MILLION)
TABLE 380 MALAYSIA OILSEED & PULSES IN PLANT BREEDING & CRISPR PLANT MARKET, BY APPLICATION, 2020-2029 (USD MILLION)
TABLE 381 MALAYSIA FRUITS & VEGETABLES IN PLANT BREEDING & CRISPR PLANT MARKET, BY APPLICATION, 2020-2029 (USD MILLION)
TABLE 382 MALAYSIA LEAFY GREEN IN PLANT BREEDING & CRISPR PLANT MARKET, BY APPLICATION, 2020-2029 (USD MILLION)
TABLE 383 MALAYSIA CASH CROPS IN PLANT BREEDING & CRISPR PLANT MARKET, BY APPLICATION, 2020-2029 (USD MILLION)
TABLE 384 MALAYSIA HERBS AND MICROGREEN IN PLANT BREEDING & CRISPR PLANT MARKET, BY APPLICATION, 2020-2029 (USD MILLION)
TABLE 385 VIETNAM PLANT BREEDING & CRISPR PLANT MARKET, BY TYPE, 2020-2029 (USD MILLION)
TABLE 386 VIETNAM BIOTECHNOLOGICAL METHOD IN PLANT BREEDING & CRISPR PLANT MARKET, BY TYPE, 2020-2029 (USD MILLION)
TABLE 387 VIETNAM CONVENTIONAL BREEDING IN PLANT BREEDING & CRISPR PLANT MARKET, BY TYPE, 2020-2029 (USD MILLION)
TABLE 388 VIETNAM GENETIC ENGINEERING IN PLANT BREEDING & CRISPR PLANT MARKET, BY TYPE, 2020-2029 (USD MILLION)
TABLE 389 VIETNAM PLANT BREEDING & CRISPR PLANT MARKET, BY TRAIT, 2020-2029 (USD MILLION)
TABLE 390 VIETNAM PLANT BREEDING & CRISPR PLANT MARKET, BY APPLICATION, 2020-2029 (USD MILLION)
TABLE 391 VIETNAM CEREAL & GRAIN IN PLANT BREEDING & CRISPR PLANT MARKET, BY APPLICATION, 2020-2029 (USD MILLION)
TABLE 392 VIETNAM OILSEED & PULSES IN PLANT BREEDING & CRISPR PLANT MARKET, BY APPLICATION, 2020-2029 (USD MILLION)
TABLE 393 VIETNAM FRUITS & VEGETABLES IN PLANT BREEDING & CRISPR PLANT MARKET, BY APPLICATION, 2020-2029 (USD MILLION)
TABLE 394 VIETNAM LEAFY GREEN IN PLANT BREEDING & CRISPR PLANT MARKET, BY APPLICATION, 2020-2029 (USD MILLION)
TABLE 395 VIETNAM CASH CROPS IN PLANT BREEDING & CRISPR PLANT MARKET, BY APPLICATION, 2020-2029 (USD MILLION)
TABLE 396 VIETNAM HERBS AND MICROGREEN IN PLANT BREEDING & CRISPR PLANT MARKET, BY APPLICATION, 2020-2029 (USD MILLION)
TABLE 397 REST OF ASIA-PACIFIC PLANT BREEDING & CRISPR PLANT MARKET, BY TYPE, 2020-2029 (USD MILLION)
TABLE 398 SOUTH AMERICA PLANT BREEDING & CRISPR PLANT MARKET, BY COUNTRY, 2020-2029 (USD MILLION)
TABLE 399 SOUTH AMERICA PLANT BREEDING & CRISPR PLANT MARKET, BY TYPE, 2020-2029 (USD MILLION)
TABLE 400 SOUTH AMERICA BIOTECHNOLOGICAL METHOD IN PLANT BREEDING & CRISPR PLANT MARKET, BY TYPE, 2020-2029 (USD MILLION)
TABLE 401 SOUTH AMERICA CONVENTIONAL BREEDING IN PLANT BREEDING & CRISPR PLANT MARKET, BY TYPE, 2020-2029 (USD MILLION)
TABLE 402 SOUTH AMERICA GENETIC ENGINEERING IN PLANT BREEDING & CRISPR PLANT MARKET, BY TYPE, 2020-2029 (USD MILLION)
TABLE 403 SOUTH AMERICA PLANT BREEDING & CRISPR PLANT MARKET, BY TRAIT, 2020-2029 (USD MILLION)
TABLE 404 SOUTH AMERICA PLANT BREEDING & CRISPR PLANT MARKET, BY APPLICATION, 2020-2029 (USD MILLION)
TABLE 405 SOUTH AMERICA CEREAL & GRAIN IN PLANT BREEDING & CRISPR PLANT MARKET, BY APPLICATION, 2020-2029 (USD MILLION)
TABLE 406 SOUTH AMERICA OILSEED & PULSES IN PLANT BREEDING & CRISPR PLANT MARKET, BY APPLICATION, 2020-2029 (USD MILLION)
TABLE 407 SOUTH AMERICA FRUITS & VEGETABLES IN PLANT BREEDING & CRISPR PLANT MARKET, BY APPLICATION, 2020-2029 (USD MILLION)
TABLE 408 SOUTH AMERICA LEAFY GREEN IN PLANT BREEDING & CRISPR PLANT MARKET, BY APPLICATION, 2020-2029 (USD MILLION)
TABLE 409 SOUTH AMERICA CASH CROPS IN PLANT BREEDING & CRISPR PLANT MARKET, BY APPLICATION, 2020-2029 (USD MILLION)
TABLE 410 SOUTH AMERICA HERBS AND MICROGREEN IN PLANT BREEDING & CRISPR PLANT MARKET, BY APPLICATION, 2020-2029 (USD MILLION)
TABLE 411 BRAZIL PLANT BREEDING & CRISPR PLANT MARKET, BY TYPE, 2020-2029 (USD MILLION)
TABLE 412 BRAZIL BIOTECHNOLOGICAL METHOD IN PLANT BREEDING & CRISPR PLANT MARKET, BY TYPE, 2020-2029 (USD MILLION)
TABLE 413 BRAZIL CONVENTIONAL BREEDING IN PLANT BREEDING & CRISPR PLANT MARKET, BY TYPE, 2020-2029 (USD MILLION)
TABLE 414 BRAZIL GENETIC ENGINEERING IN PLANT BREEDING & CRISPR PLANT MARKET, BY TYPE, 2020-2029 (USD MILLION)
TABLE 415 BRAZIL PLANT BREEDING & CRISPR PLANT MARKET, BY TRAIT, 2020-2029 (USD MILLION)
TABLE 416 BRAZIL PLANT BREEDING & CRISPR PLANT MARKET, BY APPLICATION, 2020-2029 (USD MILLION)
TABLE 417 BRAZIL CEREAL & GRAIN IN PLANT BREEDING & CRISPR PLANT MARKET, BY APPLICATION, 2020-2029 (USD MILLION)
TABLE 418 BRAZIL OILSEED & PULSES IN PLANT BREEDING & CRISPR PLANT MARKET, BY APPLICATION, 2020-2029 (USD MILLION)
TABLE 419 BRAZIL FRUITS & VEGETABLES IN PLANT BREEDING & CRISPR PLANT MARKET, BY APPLICATION, 2020-2029 (USD MILLION)
TABLE 420 BRAZIL LEAFY GREEN IN PLANT BREEDING & CRISPR PLANT MARKET, BY APPLICATION, 2020-2029 (USD MILLION)
TABLE 421 BRAZIL CASH CROPS IN PLANT BREEDING & CRISPR PLANT MARKET, BY APPLICATION, 2020-2029 (USD MILLION)
TABLE 422 BRAZIL HERBS AND MICROGREEN IN PLANT BREEDING & CRISPR PLANT MARKET, BY APPLICATION, 2020-2029 (USD MILLION)
TABLE 423 ARGENTINA PLANT BREEDING & CRISPR PLANT MARKET, BY TYPE, 2020-2029 (USD MILLION)
TABLE 424 ARGENTINA BIOTECHNOLOGICAL METHOD IN PLANT BREEDING & CRISPR PLANT MARKET, BY TYPE, 2020-2029 (USD MILLION)
TABLE 425 ARGENTINA CONVENTIONAL BREEDING IN PLANT BREEDING & CRISPR PLANT MARKET, BY TYPE, 2020-2029 (USD MILLION)
TABLE 426 ARGENTINA GENETIC ENGINEERING IN PLANT BREEDING & CRISPR PLANT MARKET, BY TYPE, 2020-2029 (USD MILLION)
TABLE 427 ARGENTINA PLANT BREEDING & CRISPR PLANT MARKET, BY TRAIT, 2020-2029 (USD MILLION)
TABLE 428 ARGENTINA PLANT BREEDING & CRISPR PLANT MARKET, BY APPLICATION, 2020-2029 (USD MILLION)
TABLE 429 ARGENTINA CEREAL & GRAIN IN PLANT BREEDING & CRISPR PLANT MARKET, BY APPLICATION, 2020-2029 (USD MILLION)
TABLE 430 ARGENTINA OILSEED & PULSES IN PLANT BREEDING & CRISPR PLANT MARKET, BY APPLICATION, 2020-2029 (USD MILLION)
TABLE 431 ARGENTINA FRUITS & VEGETABLES IN PLANT BREEDING & CRISPR PLANT MARKET, BY APPLICATION, 2020-2029 (USD MILLION)
TABLE 432 ARGENTINA LEAFY GREEN IN PLANT BREEDING & CRISPR PLANT MARKET, BY APPLICATION, 2020-2029 (USD MILLION)
TABLE 433 ARGENTINA CASH CROPS IN PLANT BREEDING & CRISPR PLANT MARKET, BY APPLICATION, 2020-2029 (USD MILLION)
TABLE 434 ARGENTINA HERBS AND MICROGREEN IN PLANT BREEDING & CRISPR PLANT MARKET, BY APPLICATION, 2020-2029 (USD MILLION)
TABLE 435 REST OF SOUTH AMERICA PLANT BREEDING & CRISPR PLANT MARKET, BY TYPE, 2020-2029 (USD MILLION)
TABLE 436 MIDDLE EAST & AFRICA PLANT BREEDING & CRISPR PLANT MARKET, BY COUNTRY, 2020-2029 (USD MILLION)
TABLE 437 MIDDLE EAST & AFRICA PLANT BREEDING & CRISPR PLANT MARKET, BY TYPE, 2020-2029 (USD MILLION)
TABLE 438 MIDDLE EAST & AFRICA BIOTECHNOLOGICAL METHOD IN PLANT BREEDING & CRISPR PLANT MARKET, BY TYPE, 2020-2029 (USD MILLION)
TABLE 439 MIDDLE EAST & AFRICA CONVENTIONAL BREEDING IN PLANT BREEDING & CRISPR PLANT MARKET, BY TYPE, 2020-2029 (USD MILLION)
TABLE 440 MIDDLE EAST & AFRICA GENETIC ENGINEERING IN PLANT BREEDING & CRISPR PLANT MARKET, BY TYPE, 2020-2029 (USD MILLION)
TABLE 441 MIDDLE EAST & AFRICA PLANT BREEDING & CRISPR PLANT MARKET, BY TRAIT, 2020-2029 (USD MILLION)
TABLE 442 MIDDLE EAST & AFRICA PLANT BREEDING & CRISPR PLANT MARKET, BY APPLICATION, 2020-2029 (USD MILLION)
TABLE 443 MIDDLE EAST & AFRICA CEREAL & GRAIN IN PLANT BREEDING & CRISPR PLANT MARKET, BY APPLICATION, 2020-2029 (USD MILLION)
TABLE 444 MIDDLE EAST & AFRICA OILSEED & PULSES IN PLANT BREEDING & CRISPR PLANT MARKET, BY APPLICATION, 2020-2029 (USD MILLION)
TABLE 445 MIDDLE EAST & AFRICA FRUITS & VEGETABLES IN PLANT BREEDING & CRISPR PLANT MARKET, BY APPLICATION, 2020-2029 (USD MILLION)
TABLE 446 MIDDLE EAST & AFRICA LEAFY GREEN IN PLANT BREEDING & CRISPR PLANT MARKET, BY APPLICATION, 2020-2029 (USD MILLION)
TABLE 447 MIDDLE EAST & AFRICA CASH CROPS IN PLANT BREEDING & CRISPR PLANT MARKET, BY APPLICATION, 2020-2029 (USD MILLION)
TABLE 448 MIDDLE EAST & AFRICA HERBS AND MICROGREEN IN PLANT BREEDING & CRISPR PLANT MARKET, BY APPLICATION, 2020-2029 (USD MILLION)
TABLE 449 SOUTH AFRICA PLANT BREEDING & CRISPR PLANT MARKET, BY TYPE, 2020-2029 (USD MILLION)
TABLE 450 SOUTH AFRICA BIOTECHNOLOGICAL METHOD IN PLANT BREEDING & CRISPR PLANT MARKET, BY TYPE, 2020-2029 (USD MILLION)
TABLE 451 SOUTH AFRICA CONVENTIONAL BREEDING IN PLANT BREEDING & CRISPR PLANT MARKET, BY TYPE, 2020-2029 (USD MILLION)
TABLE 452 SOUTH AFRICA GENETIC ENGINEERING IN PLANT BREEDING & CRISPR PLANT MARKET, BY TYPE, 2020-2029 (USD MILLION)
TABLE 453 SOUTH AFRICA PLANT BREEDING & CRISPR PLANT MARKET, BY TRAIT, 2020-2029 (USD MILLION)
TABLE 454 SOUTH AFRICA PLANT BREEDING & CRISPR PLANT MARKET, BY APPLICATION, 2020-2029 (USD MILLION)
TABLE 455 SOUTH AFRICA CEREAL & GRAIN IN PLANT BREEDING & CRISPR PLANT MARKET, BY APPLICATION, 2020-2029 (USD MILLION)
TABLE 456 SOUTH AFRICA OILSEED & PULSES IN PLANT BREEDING & CRISPR PLANT MARKET, BY APPLICATION, 2020-2029 (USD MILLION)
TABLE 457 SOUTH AFRICA FRUITS & VEGETABLES IN PLANT BREEDING & CRISPR PLANT MARKET, BY APPLICATION, 2020-2029 (USD MILLION)
TABLE 458 SOUTH AFRICA LEAFY GREEN IN PLANT BREEDING & CRISPR PLANT MARKET, BY APPLICATION, 2020-2029 (USD MILLION)
TABLE 459 SOUTH AFRICA CASH CROPS IN PLANT BREEDING & CRISPR PLANT MARKET, BY APPLICATION, 2020-2029 (USD MILLION)
TABLE 460 SOUTH AFRICA HERBS AND MICROGREEN IN PLANT BREEDING & CRISPR PLANT MARKET, BY APPLICATION, 2020-2029 (USD MILLION)
TABLE 461 SAUDI ARABIA PLANT BREEDING & CRISPR PLANT MARKET, BY TYPE, 2020-2029 (USD MILLION)
TABLE 462 SAUDI ARABIA BIOTECHNOLOGICAL METHOD IN PLANT BREEDING & CRISPR PLANT MARKET, BY TYPE, 2020-2029 (USD MILLION)
TABLE 463 SAUDI ARABIA CONVENTIONAL BREEDING IN PLANT BREEDING & CRISPR PLANT MARKET, BY TYPE, 2020-2029 (USD MILLION)
TABLE 464 SAUDI ARABIA GENETIC ENGINEERING IN PLANT BREEDING & CRISPR PLANT MARKET, BY TYPE, 2020-2029 (USD MILLION)
TABLE 465 SAUDI ARABIA PLANT BREEDING & CRISPR PLANT MARKET, BY TRAIT, 2020-2029 (USD MILLION)
TABLE 466 SAUDI ARABIA PLANT BREEDING & CRISPR PLANT MARKET, BY APPLICATION, 2020-2029 (USD MILLION)
TABLE 467 SAUDI ARABIA CEREAL & GRAIN IN PLANT BREEDING & CRISPR PLANT MARKET, BY APPLICATION, 2020-2029 (USD MILLION)
TABLE 468 SAUDI ARABIA OILSEED & PULSES IN PLANT BREEDING & CRISPR PLANT MARKET, BY APPLICATION, 2020-2029 (USD MILLION)
TABLE 469 SAUDI ARABIA FRUITS & VEGETABLES IN PLANT BREEDING & CRISPR PLANT MARKET, BY APPLICATION, 2020-2029 (USD MILLION)
TABLE 470 SAUDI ARABIA LEAFY GREEN IN PLANT BREEDING & CRISPR PLANT MARKET, BY APPLICATION, 2020-2029 (USD MILLION)
TABLE 471 SAUDI ARABIA CASH CROPS IN PLANT BREEDING & CRISPR PLANT MARKET, BY APPLICATION, 2020-2029 (USD MILLION)
TABLE 472 SAUDI ARABIA HERBS AND MICROGREEN IN PLANT BREEDING & CRISPR PLANT MARKET, BY APPLICATION, 2020-2029 (USD MILLION)
TABLE 473 U.A.E PLANT BREEDING & CRISPR PLANT MARKET, BY TYPE, 2020-2029 (USD MILLION)
TABLE 474 U.A.E BIOTECHNOLOGICAL METHOD IN PLANT BREEDING & CRISPR PLANT MARKET, BY TYPE, 2020-2029 (USD MILLION)
TABLE 475 U.A.E CONVENTIONAL BREEDING IN PLANT BREEDING & CRISPR PLANT MARKET, BY TYPE, 2020-2029 (USD MILLION)
TABLE 476 U.A.E GENETIC ENGINEERING IN PLANT BREEDING & CRISPR PLANT MARKET, BY TYPE, 2020-2029 (USD MILLION)
TABLE 477 U.A.E PLANT BREEDING & CRISPR PLANT MARKET, BY TRAIT, 2020-2029 (USD MILLION)
TABLE 478 U.A.E PLANT BREEDING & CRISPR PLANT MARKET, BY APPLICATION, 2020-2029 (USD MILLION)
TABLE 479 U.A.E CEREAL & GRAIN IN PLANT BREEDING & CRISPR PLANT MARKET, BY APPLICATION, 2020-2029 (USD MILLION)
TABLE 480 U.A.E OILSEED & PULSES IN PLANT BREEDING & CRISPR PLANT MARKET, BY APPLICATION, 2020-2029 (USD MILLION)
TABLE 481 U.A.E FRUITS & VEGETABLES IN PLANT BREEDING & CRISPR PLANT MARKET, BY APPLICATION, 2020-2029 (USD MILLION)
TABLE 482 U.A.E LEAFY GREEN IN PLANT BREEDING & CRISPR PLANT MARKET, BY APPLICATION, 2020-2029 (USD MILLION)
TABLE 483 U.A.E CASH CROPS IN PLANT BREEDING & CRISPR PLANT MARKET, BY APPLICATION, 2020-2029 (USD MILLION)
TABLE 484 U.A.E HERBS AND MICROGREEN IN PLANT BREEDING & CRISPR PLANT MARKET, BY APPLICATION, 2020-2029 (USD MILLION)
TABLE 485 OMAN PLANT BREEDING & CRISPR PLANT MARKET, BY TYPE, 2020-2029 (USD MILLION)
TABLE 486 OMAN BIOTECHNOLOGICAL METHOD IN PLANT BREEDING & CRISPR PLANT MARKET, BY TYPE, 2020-2029 (USD MILLION)
TABLE 487 OMAN CONVENTIONAL BREEDING IN PLANT BREEDING & CRISPR PLANT MARKET, BY TYPE, 2020-2029 (USD MILLION)
TABLE 488 OMAN GENETIC ENGINEERING IN PLANT BREEDING & CRISPR PLANT MARKET, BY TYPE, 2020-2029 (USD MILLION)
TABLE 489 OMAN PLANT BREEDING & CRISPR PLANT MARKET, BY TRAIT, 2020-2029 (USD MILLION)
TABLE 490 OMAN PLANT BREEDING & CRISPR PLANT MARKET, BY APPLICATION, 2020-2029 (USD MILLION)
TABLE 491 OMAN CEREAL & GRAIN IN PLANT BREEDING & CRISPR PLANT MARKET, BY APPLICATION, 2020-2029 (USD MILLION)
TABLE 492 OMAN OILSEED & PULSES IN PLANT BREEDING & CRISPR PLANT MARKET, BY APPLICATION, 2020-2029 (USD MILLION)
TABLE 493 OMAN FRUITS & VEGETABLES IN PLANT BREEDING & CRISPR PLANT MARKET, BY APPLICATION, 2020-2029 (USD MILLION)
TABLE 494 OMAN LEAFY GREEN IN PLANT BREEDING & CRISPR PLANT MARKET, BY APPLICATION, 2020-2029 (USD MILLION)
TABLE 495 OMAN CASH CROPS IN PLANT BREEDING & CRISPR PLANT MARKET, BY APPLICATION, 2020-2029 (USD MILLION)
TABLE 496 OMAN HERBS AND MICROGREEN IN PLANT BREEDING & CRISPR PLANT MARKET, BY APPLICATION, 2020-2029 (USD MILLION)
TABLE 497 QATAR PLANT BREEDING & CRISPR PLANT MARKET, BY TYPE, 2020-2029 (USD MILLION)
TABLE 498 QATAR BIOTECHNOLOGICAL METHOD IN PLANT BREEDING & CRISPR PLANT MARKET, BY TYPE, 2020-2029 (USD MILLION)
TABLE 499 QATAR CONVENTIONAL BREEDING IN PLANT BREEDING & CRISPR PLANT MARKET, BY TYPE, 2020-2029 (USD MILLION)
TABLE 500 QATAR GENETIC ENGINEERING IN PLANT BREEDING & CRISPR PLANT MARKET, BY TYPE, 2020-2029 (USD MILLION)
TABLE 501 QATAR PLANT BREEDING & CRISPR PLANT MARKET, BY TRAIT, 2020-2029 (USD MILLION)
TABLE 502 QATAR PLANT BREEDING & CRISPR PLANT MARKET, BY APPLICATION, 2020-2029 (USD MILLION)
TABLE 503 QATAR CEREAL & GRAIN IN PLANT BREEDING & CRISPR PLANT MARKET, BY APPLICATION, 2020-2029 (USD MILLION)
TABLE 504 QATAR OILSEED & PULSES IN PLANT BREEDING & CRISPR PLANT MARKET, BY APPLICATION, 2020-2029 (USD MILLION)
TABLE 505 QATAR FRUITS & VEGETABLES IN PLANT BREEDING & CRISPR PLANT MARKET, BY APPLICATION, 2020-2029 (USD MILLION)
TABLE 506 QATAR LEAFY GREEN IN PLANT BREEDING & CRISPR PLANT MARKET, BY APPLICATION, 2020-2029 (USD MILLION)
TABLE 507 QATAR CASH CROPS IN PLANT BREEDING & CRISPR PLANT MARKET, BY APPLICATION, 2020-2029 (USD MILLION)
TABLE 508 QATAR HERBS AND MICROGREEN IN PLANT BREEDING & CRISPR PLANT MARKET, BY APPLICATION, 2020-2029 (USD MILLION)
TABLE 509 KUWAIT PLANT BREEDING & CRISPR PLANT MARKET, BY TYPE, 2020-2029 (USD MILLION)
TABLE 510 KUWAIT BIOTECHNOLOGICAL METHOD IN PLANT BREEDING & CRISPR PLANT MARKET, BY TYPE, 2020-2029 (USD MILLION)
TABLE 511 KUWAIT CONVENTIONAL BREEDING IN PLANT BREEDING & CRISPR PLANT MARKET, BY TYPE, 2020-2029 (USD MILLION)
TABLE 512 KUWAIT GENETIC ENGINEERING IN PLANT BREEDING & CRISPR PLANT MARKET, BY TYPE, 2020-2029 (USD MILLION)
TABLE 513 KUWAIT PLANT BREEDING & CRISPR PLANT MARKET, BY TRAIT, 2020-2029 (USD MILLION)
TABLE 514 KUWAIT PLANT BREEDING & CRISPR PLANT MARKET, BY APPLICATION, 2020-2029 (USD MILLION)
TABLE 515 KUWAIT CEREAL & GRAIN IN PLANT BREEDING & CRISPR PLANT MARKET, BY APPLICATION, 2020-2029 (USD MILLION)
TABLE 516 KUWAIT OILSEED & PULSES IN PLANT BREEDING & CRISPR PLANT MARKET, BY APPLICATION, 2020-2029 (USD MILLION)
TABLE 517 KUWAIT FRUITS & VEGETABLES IN PLANT BREEDING & CRISPR PLANT MARKET, BY APPLICATION, 2020-2029 (USD MILLION)
TABLE 518 KUWAIT LEAFY GREEN IN PLANT BREEDING & CRISPR PLANT MARKET, BY APPLICATION, 2020-2029 (USD MILLION)
TABLE 519 KUWAIT CASH CROPS IN PLANT BREEDING & CRISPR PLANT MARKET, BY APPLICATION, 2020-2029 (USD MILLION)
TABLE 520 KUWAIT HERBS AND MICROGREEN IN PLANT BREEDING & CRISPR PLANT MARKET, BY APPLICATION, 2020-2029 (USD MILLION)
TABLE 521 REST OF MIDDLE EAST AND AFRICA PLANT BREEDING & CRISPR PLANT MARKET, BY TYPE, 2020-2029 (USD MILLION)
Lista de figuras
FIGURE 1 GLOBAL PLANT BREEDING AND CRISPR PLANT MARKET: SEGMENTATION
FIGURE 2 GLOBAL PLANT BREEDING AND CRISPR PLANT MARKET: DATA TRIANGULATION
FIGURE 3 GLOBAL PLANT BREEDING AND CRISPR PLANT MARKET: DROC ANALYSIS
FIGURE 4 GLOBAL PLANT BREEDING AND CRISPR PLANT MARKET: REGIONAL VS COUNTRY MARKET ANALYSIS
FIGURE 5 GLOBAL PLANT BREEDING AND CRISPR PLANT MARKET: COMPANY RESEARCH ANALYSIS
FIGURE 6 GLOBAL PLANT BREEDING AND CRISPR PLANT MARKET: INTERVIEW DEMOGRAPHICS
FIGURE 7 GLOBAL PLANT BREEDING AND CRISPR PLANT MARKET: MARKET APPLICATION COVERAGE GRID
FIGURE 8 GLOBAL PLANT BREEDING AND CRISPR PLANT MARKET: DBMR MARKET POSITION GRID
FIGURE 9 GLOBAL PLANT BREEDING AND CRISPR PLANT MARKET: VENDOR SHARE ANALYSIS
FIGURE 10 GLOBAL PLANT BREEDING AND CRISPR PLANT MARKET: SEGMENTATION
FIGURE 11 NORTH AMERICA IS ANTICIPATED TO DOMINATE THE GLOBAL PLANT BREEDING AND CRISPR PLANT MARKET, AND EUROPE IS ESTIMATED TO BE GROWING WITH THE HIGHEST CAGR IN THE FORECAST PERIOD OF 2022 TO 2029
FIGURE 12 INCREASING IMPORTANCE FOR SUSTAINABLE CROP PRODUCTION IS EXPECTED TO DRIVE THE GLOBAL PLANT BREEDING AND CRISPR PLANT MARKET IN THE FORECAST PERIOD OF 2022 TO 2029
FIGURE 13 CONVENTIONAL BREEDING ARE EXPECTED TO ACCOUNT FOR THE LARGEST SHARE OF THE GLOBAL PLANT BREEDING AND CRISPR PLANT MARKET IN 2022 & 2029
FIGURE 14 NORTH AMERICA IS THE FASTEST GROWING MARKET FOR ARTIFICIAL INTELLIGENCE (AI) IN DRUG DISCOVERY MANUFACTURERS IN THE FORECAST PERIOD OF 2022 TO 2029
FIGURE 15 SOME OF THE FACTORS THAT AFFECT THE BUYING BEHAVIOR OF CONSUMERS BEFORE PURCHASING-
FIGURE 16 THE WORKFLOW MANUFACTURING PROCESS-
FIGURE 17 DRIVERS, RESTRAINTS, OPPORTUNITIES, AND CHALLENGE OF THE GLOBAL ANT BREEDING & CRISPR PLANT MARKET
FIGURE 18 GLOBAL PLANT BREEDING AND CRISPR PLANTS MARKET : BY TYPE, 2021
FIGURE 19 GLOBAL PLANT BREEDING AND CRISPR PLANTS MARKET : BY TYPE, 2022-2029 (USD MILLION)
FIGURE 20 GLOBAL PLANT BREEDING AND CRISPR PLANTS MARKET : BY TYPE, CAGR (2022-2029)
FIGURE 21 GLOBAL PLANT BREEDING AND CRISPR PLANTS MARKET : BY TYPE, LIFELINE CURVE
FIGURE 22 GLOBAL PLANT BREEDING & CRISPR PLANT MARKET : BY TRAIT, 2021
FIGURE 23 GLOBAL PLANT BREEDING & CRISPR PLANT MARKET : BY TRAIT, 2022-2029 (USD MILLION)
FIGURE 24 GLOBAL PLANT BREEDING & CRISPR PLANT MARKET : BY TRAIT, CAGR (2022-2029)
FIGURE 25 GLOBAL PLANT BREEDING & CRISPR PLANT MARKET : BY TRAIT, LIFELINE CURVE
FIGURE 26 GLOBAL PLANT BREEDING AND CRISPR PLANT MARKET: BY APPLICATION, 2021
FIGURE 27 GLOBAL PLANT BREEDING AND CRISPR PLANT MARKET: BY APPLICATION, 2022-2029 (USD MILLION)
FIGURE 28 GLOBAL PLANT BREEDING AND CRISPR PLANT MARKET: BY APPLICATION, CAGR (2022-2029)
FIGURE 29 GLOBAL PLANT BREEDING AND CRISPR PLANT MARKET: BY APPLICATION, LIFELINE CURVE
FIGURE 30 GLOBAL PLANT BREEDING AND CRISPR PLANT MARKET: SNAPSHOT (2021)
FIGURE 31 GLOBAL PLANT BREEDING AND CRISPR PLANT MARKET: BY REGION (2021)
FIGURE 32 GLOBAL PLANT BREEDING AND CRISPR PLANT MARKET: BY REGION (2022 & 2029)
FIGURE 33 GLOBAL PLANT BREEDING AND CRISPR PLANT MARKET: BY REGION (2021 & 2029)
FIGURE 34 GLOBAL PLANT BREEDING AND CRISPR PLANT MARKET: BY TYPE (2022-2029)
FIGURE 35 NORTH AMERICA PLANT BREEDING AND CRISPR PLANT MARKET: SNAPSHOT (2021)
FIGURE 36 NORTH AMERICA PLANT BREEDING AND CRISPR PLANT MARKET: BY COUNTRY (2021)
FIGURE 37 NORTH AMERICA PLANT BREEDING AND CRISPR PLANT MARKET: BY COUNTRY (2022 & 2029)
FIGURE 38 NORTH AMERICA PLANT BREEDING AND CRISPR PLANT MARKET: BY COUNTRY (2021 & 2029)
FIGURE 39 NORTH AMERICA PLANT BREEDING AND CRISPR PLANT MARKET: BY TYPE (2022-2029)
FIGURE 40 EUROPE PLANT BREEDING & CRISPR PLANT MARKET: SNAPSHOT (2021)
FIGURE 41 EUROPE PLANT BREEDING & CRISPR PLANT MARKET: BY COUNTRY (2021)
FIGURE 42 EUROPE PLANT BREEDING & CRISPR PLANT MARKET: BY COUNTRY (2022 & 2029)
FIGURE 43 EUROPE PLANT BREEDING & CRISPR PLANT MARKET: BY COUNTRY (2021 & 2029)
FIGURE 44 EUROPE PLANT BREEDING & CRISPR PLANT MARKET: BY TYPE (2022-2029)
FIGURE 45 ASIA-PACIFIC PLANT BREEDING AND CRISPR PLANT MARKET: SNAPSHOT (2021)
FIGURE 46 ASIA-PACIFIC PLANT BREEDING AND CRISPR PLANT MARKET: BY COUNTRY (2021)
FIGURE 47 ASIA-PACIFIC PLANT BREEDING AND CRISPR PLANT MARKET: BY COUNTRY (2022 & 2029)
FIGURE 48 ASIA-PACIFIC PLANT BREEDING AND CRISPR PLANT MARKET: BY COUNTRY (2021 & 2029)
FIGURE 49 ASIA-PACIFIC PLANT BREEDING AND CRISPR PLANT MARKET: BY TYPE (2022-2029)
FIGURE 50 SOUTH AMERICA PLANT BREEDING AND CRISPR PLANT MARKET: SNAPSHOT (2021)
FIGURE 51 SOUTH AMERICA PLANT BREEDING AND CRISPR PLANT MARKET: BY COUNTRY (2021)
FIGURE 52 SOUTH AMERICA PLANT BREEDING AND CRISPR PLANT MARKET: BY COUNTRY (2022 & 2029)
FIGURE 53 SOUTH AMERICA PLANT BREEDING AND CRISPR PLANT MARKET: BY COUNTRY (2021 & 2029)
FIGURE 54 SOUTH AMERICA PLANT BREEDING AND CRISPR PLANT MARKET: BY TYPE (2022-2029)
FIGURE 55 MIDDLE EAST AND AFRICA PLANT BREEDING AND CRISPR PLANT MARKET: SNAPSHOT (2021)
FIGURE 56 MIDDLE EAST AND AFRICA PLANT BREEDING AND CRISPR PLANT MARKET: BY COUNTRY (2021)
FIGURE 57 MIDDLE EAST AND AFRICA PLANT BREEDING AND CRISPR PLANT MARKET: BY COUNTRY (2022 & 2029)
FIGURE 58 MIDDLE EAST AND AFRICA PLANT BREEDING AND CRISPR PLANT MARKET: BY COUNTRY (2021 & 2029)
FIGURE 59 MIDDLE EAST AND AFRICA PLANT BREEDING AND CRISPR PLANT MARKET: BY TYPE (2022-2029)
FIGURE 60 GLOBAL PLANT BREEDING AND CSIPR PLANT MARKET: COMPANY SHARE 2021 (%)
FIGURE 61 NORTH AMERICA PLANT BREEDING AND CSIPR PLANT MARKET: COMPANY SHARE 2021 (%)
FIGURE 62 EUROPE PLANT BREEDING AND CSIPR PLANTSMARKET: COMPANY SHARE 2021 (%)
FIGURE 63 ASIA-PACIFIC PLANT BREEDING AND CSIPR PLANT MARKET: COMPANY SHARE 2021 (%)
Metodología de investigación
La recopilación de datos y el análisis del año base se realizan utilizando módulos de recopilación de datos con muestras de gran tamaño. La etapa incluye la obtención de información de mercado o datos relacionados a través de varias fuentes y estrategias. Incluye el examen y la planificación de todos los datos adquiridos del pasado con antelación. Asimismo, abarca el examen de las inconsistencias de información observadas en diferentes fuentes de información. Los datos de mercado se analizan y estiman utilizando modelos estadísticos y coherentes de mercado. Además, el análisis de la participación de mercado y el análisis de tendencias clave son los principales factores de éxito en el informe de mercado. Para obtener más información, solicite una llamada de un analista o envíe su consulta.
La metodología de investigación clave utilizada por el equipo de investigación de DBMR es la triangulación de datos, que implica la extracción de datos, el análisis del impacto de las variables de datos en el mercado y la validación primaria (experto en la industria). Los modelos de datos incluyen cuadrícula de posicionamiento de proveedores, análisis de línea de tiempo de mercado, descripción general y guía del mercado, cuadrícula de posicionamiento de la empresa, análisis de patentes, análisis de precios, análisis de participación de mercado de la empresa, estándares de medición, análisis global versus regional y de participación de proveedores. Para obtener más información sobre la metodología de investigación, envíe una consulta para hablar con nuestros expertos de la industria.
Personalización disponible
Data Bridge Market Research es líder en investigación formativa avanzada. Nos enorgullecemos de brindar servicios a nuestros clientes existentes y nuevos con datos y análisis que coinciden y se adaptan a sus objetivos. El informe se puede personalizar para incluir análisis de tendencias de precios de marcas objetivo, comprensión del mercado de países adicionales (solicite la lista de países), datos de resultados de ensayos clínicos, revisión de literatura, análisis de mercado renovado y base de productos. El análisis de mercado de competidores objetivo se puede analizar desde análisis basados en tecnología hasta estrategias de cartera de mercado. Podemos agregar tantos competidores sobre los que necesite datos en el formato y estilo de datos que esté buscando. Nuestro equipo de analistas también puede proporcionarle datos en archivos de Excel sin procesar, tablas dinámicas (libro de datos) o puede ayudarlo a crear presentaciones a partir de los conjuntos de datos disponibles en el informe.

