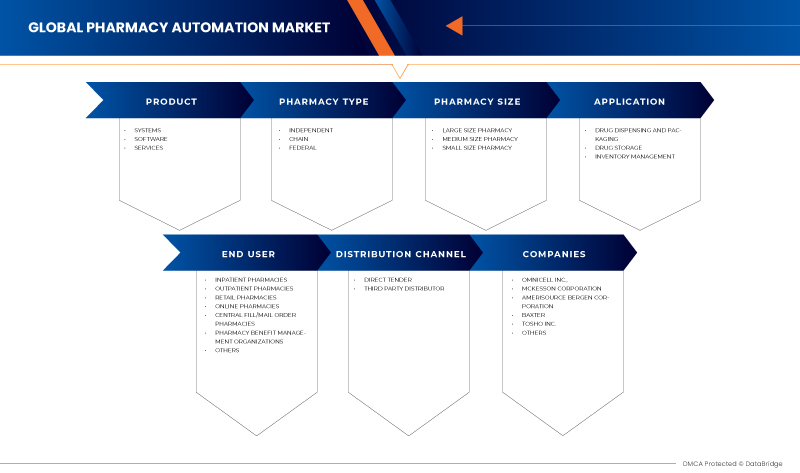
Mercado global de automatización de farmacias, por producto (sistemas, software y servicios), tipo de farmacia (independiente, cadena y federal), tamaño de farmacia (farmacia de tamaño grande, farmacia de tamaño mediano y farmacia de tamaño pequeño), aplicación (dispensación y envasado de medicamentos, almacenamiento de medicamentos y gestión de inventario), usuario final (farmacias para pacientes hospitalizados, farmacias para pacientes ambulatorios, farmacias minoristas, farmacias en línea, farmacias de llenado central/pedido por correo, organizaciones de gestión de beneficios farmacéuticos y otras), canal de distribución (licitación directa y distribuidor externo) - Tendencias de la industria y pronóstico hasta 2030.
Análisis y perspectivas del mercado de automatización de farmacias
La creciente incidencia de accidentes y muertes debido a errores en la prescripción de medicamentos ejerce una enorme presión sobre el sector sanitario en general. Tanto los profesionales sanitarios como los farmacéuticos buscan soluciones más eficaces y precisas para evitar estos frecuentes fallos médicos. Además, con el aumento del número de pacientes y visitantes y sus respectivas necesidades de seguridad, el sistema de suministro de medicamentos se vuelve cada día más complicado. Para abordar este grave problema, las tecnologías avanzadas, como los sistemas de automatización de farmacias, están surgiendo como las herramientas más poderosas. El objetivo de estos instrumentos es reducir los errores en las prescripciones médicas y maximizar la seguridad del paciente. Por lo tanto, la implementación de estos sistemas de automatización de farmacias ayuda a los proveedores de servicios sanitarios y a los farmacéuticos a minimizar sus pérdidas y mejorar la calidad y la productividad.
Además, la implementación de innovaciones tecnológicas y el avance de los sistemas automatizados con sistemas de automatización de farmacias mejorados conducen a mayores tasas de éxito y nuevas aplicaciones de dispositivos con mayor demanda de productos innovadores para medicamentos recetados para la preparación, dispensación, almacenamiento y etiquetado que están impulsando el crecimiento del mercado durante el período de pronóstico. Sin embargo, se anticipa que factores como la renuencia a implementar sistemas de automatización de farmacias debido a su alto costo restringirían su adopción, lo que se espera que frene el crecimiento del mercado.
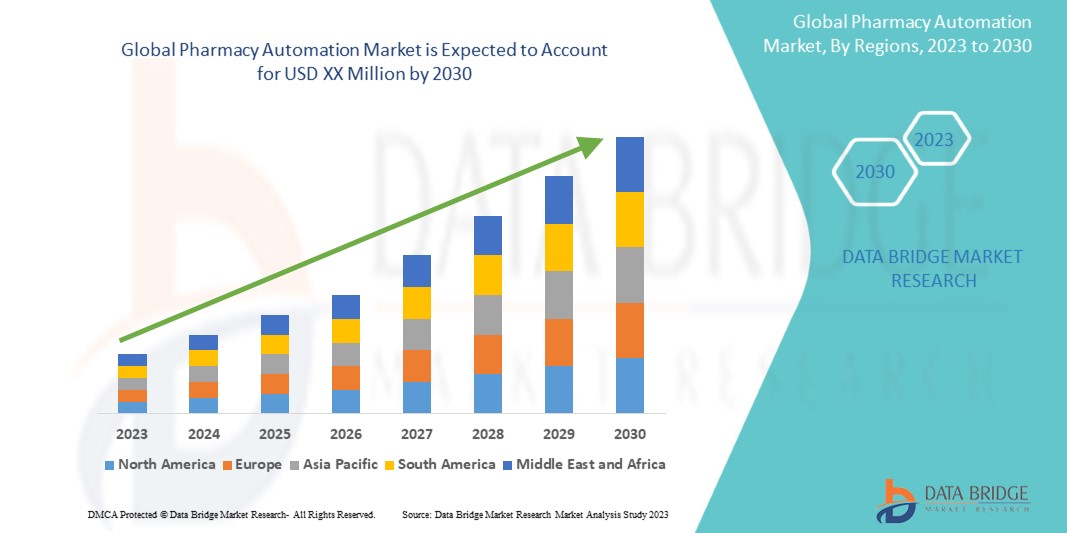
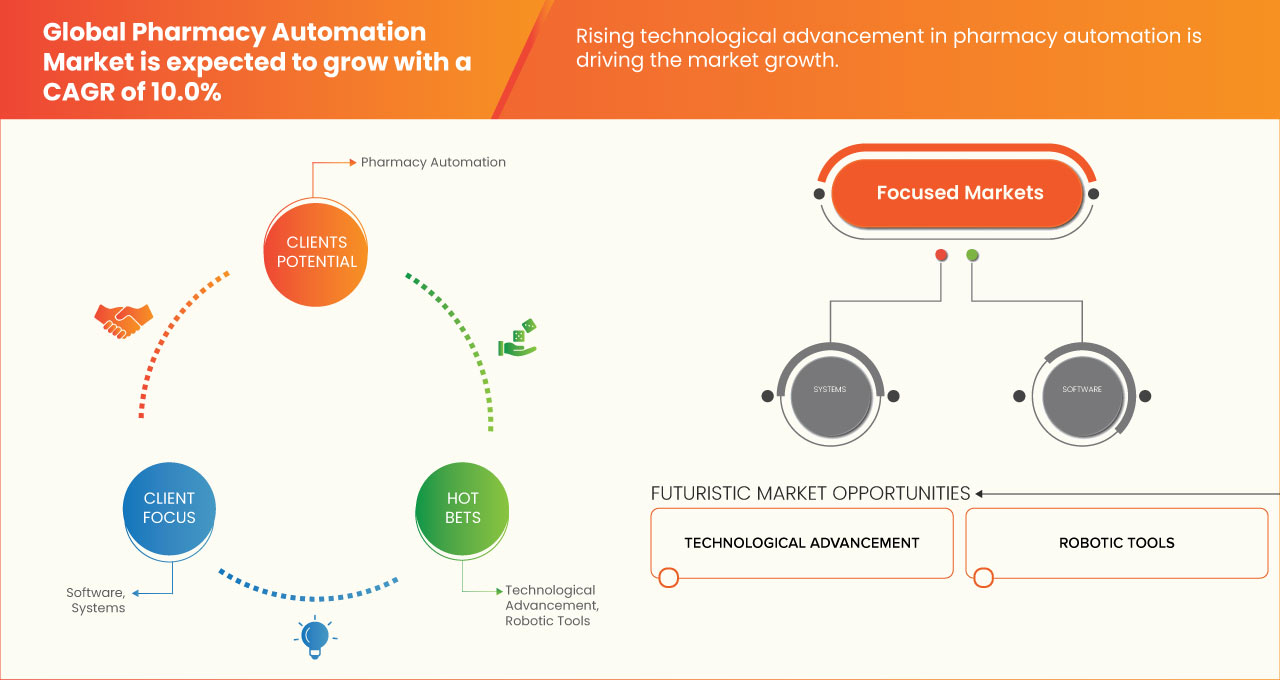
El mercado mundial de automatización de farmacias es favorable y tiene como objetivo reducir los errores de dispensación de medicamentos y mejorar la seguridad del paciente. Data Bridge Market Research analiza que el mercado mundial de automatización de farmacias crecerá a una tasa compuesta anual del 10,0 % durante el período de pronóstico de 2023 a 2030.
|
Métrica del informe |
Detalles |
|
Período de pronóstico |
2023 a 2030 |
|
Año base |
2022 |
|
Año histórico |
2021 (Personalizable para 2015 - 2020) |
|
Unidades cuantitativas |
Ingresos en millones y precios en USD |
|
Segmentos cubiertos |
Producto (sistemas, software y servicios), tipo de farmacia (independiente, cadena y federal), tamaño de la farmacia (farmacia grande, farmacia mediana y farmacia pequeña), aplicación (dispensación y envasado de medicamentos, almacenamiento de medicamentos y gestión de inventario), usuario final (farmacias para pacientes hospitalizados, farmacias para pacientes ambulatorios, farmacias minoristas, farmacias en línea, farmacias de pedidos por correo/surtido central, organizaciones de gestión de beneficios farmacéuticos y otras), canal de distribución (licitación directa y distribuidor externo) |
|
Países cubiertos |
EE. UU., Canadá, México, Alemania, Francia, Italia, Reino Unido, España, Países Bajos, Rusia, Suiza, Turquía, Bélgica, resto de Europa, Japón, China, India, Corea del Sur, Australia, Singapur, Malasia, Tailandia, Indonesia, Filipinas, resto de Asia-Pacífico, Brasil, Argentina, resto de Sudamérica, Arabia Saudita, Sudáfrica, Emiratos Árabes Unidos, Israel, Egipto y resto de Oriente Medio y África. |
|
Actores del mercado cubiertos |
ARxIUM, OMNICELL INC., Cerner Corporation, Capsa Healthcare, ScriptPro LLC, RxSafe, LLC., MedAvail Technologies, Inc., Asteres Inc., InterLink AI, Inc., BD, Baxter, Fullscript, McKesson Corporation, Innovation Associates, AmerisourceBergen Corporation, UNIVERSAL LOGISTICS HOLDINGS, INC, Takazono Corporation, TOSHO Inc., Willach Group, BIQHS, Synergy Medical, Yuyama, APD Algoritmos Procesos y Diseños SA, JVM Europe BV, Genesis Automation LTD, myPak Solutions Pty Ltd., Demodeks Pharmacy Shelving, Deenova Srl, KUKA AG y KLS Pharma Robotics GmbH, entre otros. |
Definición de mercado
La automatización de farmacias desempeña un papel importante en la atención médica moderna, ya que permite que los medicamentos se entreguen y distribuyan cómodamente en la farmacia del hospital o en la farmacia minorista. La automatización de la farmacia ayuda a reducir los errores en la medicación. Previene errores como la falta de información sobre medicamentos, la falta de información sobre el paciente, la dispensación de fórmulas, los errores de prescripción, el seguimiento de la terapia y otros que pueden ocurrir durante el proceso manual. Uno de los tipos de errores más comunes es la información y las instrucciones de etiquetado incorrectas. Para mejorar las instalaciones y los servicios de atención médica y garantizar la seguridad del paciente, es vital reducir los errores de prescripción, por lo que el sistema de automatización de farmacias se utiliza de formas bastante importantes para eliminar errores de almacenamiento, inventario, uso y recuperación. El uso de la automatización de farmacias es muy aceptable y beneficioso para aumentar la eficiencia y la precisión de las farmacias. Además, es probable que la necesidad de prevenir errores de medicación y el aumento de la población geriátrica en todo el mundo impulsen el crecimiento del mercado en el período de pronóstico.
Dinámica del mercado global de automatización de farmacias
En esta sección se aborda la comprensión de los factores impulsores, las ventajas, las oportunidades, las limitaciones y los desafíos del mercado. Todo esto se analiza en detalle a continuación:
CONDUCTORES
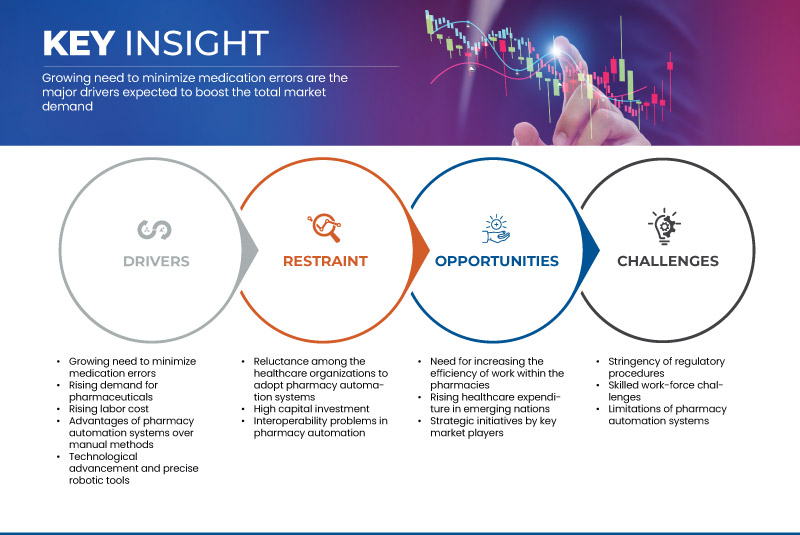
- Creciente necesidad de minimizar los errores de medicación
Los errores médicos son la principal causa de muerte en los países, lo que a su vez conduce a un aumento de las hospitalizaciones en todo el mundo. Los errores de medicación son de varios tipos e incluyen errores en la cadena de atención farmacológica y farmacéutica al paciente: errores de prescripción, errores de dispensación, errores de administración, errores de transcripción, errores de prescripción y errores "en todos los ámbitos".
Un error de medicación puede ocurrir debido a una serie de variables, como una coordinación inadecuada de pedidos entre el médico y el farmacéutico, prácticas de almacenamiento inadecuadas en las farmacias y malentendidos que surgen del uso de etiquetas idénticas.
Los errores de dispensación incluyen cualquier anomalía o desviación de la prescripción, como dispensar una dosis, un medicamento o un tipo de dosis incorrectos, una cantidad incorrecta o un etiquetado insuficiente, incorrecto o inadecuado. También se consideran errores de medicación las instrucciones de uso engañosas o insuficientes, la planificación, el envasado o el almacenamiento inadecuados del medicamento antes de su dispensación.
En una farmacia que elabora 250 recetas por día, se producen errores a un ritmo de 4 por día, lo que representa un total estimado de 51,5 millones de errores de un total de 3 mil millones de recetas elaboradas anualmente en todo el país.
- Creciente demanda de productos farmacéuticos
La creciente demanda de productos farmacéuticos se observa en todo el mundo debido a la creciente incidencia de enfermedades crónicas como el cáncer, la diabetes, la obesidad y el asma, entre otras. Las personas que padecen estas enfermedades dependen de uno u otro medicamento que les prescriben sus médicos.
Además, el envejecimiento de la población está aumentando a nivel mundial debido a la disponibilidad de mejores instalaciones sanitarias. El aumento de la investigación y el desarrollo que conducen al lanzamiento de medicamentos eficaces y novedosos orientados a enfermedades específicas contribuye aún más a la creciente demanda de productos farmacéuticos.
Además, la aparición del COVID-19 también ha aumentado la demanda de diversos medicamentos en todo el mundo, que incluyen tabletas de vitamina C e hidroxicloroquina , entre otros, lo que ha llevado a un aumento significativo en la demanda de productos farmacéuticos.
OPORTUNIDAD
- Necesidad de aumentar la eficiencia del trabajo en las farmacias
Cada farmacia intenta hacer las mismas cosas, que incluyen llenar recetas de manera correcta y eficiente, brindar atención al paciente de alta calidad y mantener un modelo comercial sustentable en el que los trabajadores tengan una buena satisfacción laboral y los consumidores estén satisfechos.
Con el fin de mejorar la eficacia de sus actividades farmacéuticas en apoyo de las estrategias y prioridades generales del hospital para brindar atención de alta calidad centrada en el paciente, muchos líderes de hospitales y farmacias han comenzado a adoptar sistemas de automatización de farmacias.
La adopción de un flujo de trabajo mejorado y de un software y un sistema de automatización de farmacias ha aumentado potencialmente la eficiencia de las farmacias. Por lo tanto, la necesidad de aumentar la eficiencia del trabajo dentro de las farmacias actúa como una oportunidad para el crecimiento del mercado.
RESTRICCIÓN
- Alta inversión de capital
Los sistemas de automatización de farmacias son más costosos en comparación con los sistemas manuales. El precio promedio de un sistema de automatización de farmacias comienza en USD 59,198.45, pero para versiones más exóticas, puede llegar a USD 591,984.50.
Dado que la inversión de capital necesaria para la implementación de un sistema de automatización de farmacias es significativamente alta, resulta difícil adoptar dichos sistemas en hospitales y farmacias de países en desarrollo, así como en farmacias pequeñas de todo el mundo. Por lo tanto, la alta inversión de capital conduce a una menor tasa de adopción de sistemas de automatización de farmacias y, por lo tanto, actúa como una restricción para el crecimiento del mercado.
DESAFÍO
- Procedimientos regulatorios estrictos
Los hospitales y las farmacias deben desempeñar un papel crucial en la cadena de suministro de medicamentos del país: la distribución de medicamentos al público. Entre las diversas normas (estatales y federales) que regulan las prácticas de dispensación de medicamentos, hay tres leyes importantes relacionadas con la protección y la seguridad tanto del público en general como de los profesionales de la industria.
Estas leyes se aplican a la protección de la cadena de suministro de medicamentos, la regulación y seguridad de sustancias controladas y la gestión de residuos farmacéuticos peligrosos, y son implementadas por la FDA, la DEA y la EPA.
Por lo tanto, los fabricantes de sistemas farmacéuticos automatizados deben cumplir con diversas normativas; mantener dicho cumplimiento es una tarea tediosa y puede retrasar el lanzamiento de productos. Por lo tanto, la rigurosidad de los procedimientos regulatorios representa un desafío para el crecimiento del mercado.
Acontecimientos recientes
- En enero de 2023, AmerisourceBergen Corporation anunció la finalización de su adquisición de PharmaLex Holding GmbH. La adquisición de PharmaLex mejora la estrategia de crecimiento de AmerisourceBergen Corporation al impulsar su liderazgo en servicios especializados y su plataforma global de capacidades de servicios para fabricantes de productos farmacéuticos.
- En febrero de 2022, Baxter anunció que había recibido autorización del programa de Vulnerabilidades y Exposiciones Comunes (CVE) para ser una Autoridad de Numeración CVE.
Mercado mundial de automatización de farmacias
El mercado global de automatización de farmacias está segmentado en seis segmentos notables según el producto, el tipo de farmacia, el tamaño de la farmacia, la aplicación, el usuario final y el canal de distribución.
PRODUCTO
- SISTEMAS
- SOFTWARE
- SERVICIOS
Según el producto, el mercado se segmenta en sistemas, software y servicios .
TIPO DE FARMACIA
- INDEPENDIENTE
- CADENA
- FEDERAL
Según el tipo de farmacia, el mercado se segmenta en independiente, cadena y federal.
TAMAÑO DE LA FARMACIA
- FARMACIA GRANDE
- FARMACIA DE TAMAÑO MEDIANO
- FARMACIA PEQUEÑA
En función del tamaño de la farmacia, el mercado se segmenta en farmacias de tamaño grande, farmacias de tamaño mediano y farmacias de tamaño pequeño.
SOLICITUD
- DISPENSACIÓN Y ENVASADO DE MEDICAMENTOS
- ALMACENAMIENTO DE MEDICAMENTOS
- GESTIÓN DE INVENTARIO
Sobre la base de la aplicación, el mercado está segmentado en dispensación y envasado de medicamentos, almacenamiento de medicamentos y gestión de inventario.
USUARIO FINAL
- FARMACIAS PARA PACIENTES INTERNADOS
- FARMACIAS PARA PACIENTES AMBULATORIOS
- FARMACIAS MINORISTAS
- FARMACIAS ONLINE
- FARMACIAS DE ABASTO CENTRAL/PEDIDOS POR CORREO
- ORGANIZACIONES DE GESTIÓN DE BENEFICIOS DE FARMACIA
- OTROS
Sobre la base del usuario final, el mercado se segmenta en farmacias para pacientes hospitalizados, farmacias para pacientes ambulatorios, farmacias minoristas, farmacias en línea, farmacias de llenado central/pedido por correo, organizaciones de gestión de beneficios farmacéuticos y otras.
CANAL DE DISTRIBUCIÓN
- LICITACIÓN DIRECTA
- DISTRIBUIDOR DE TERCEROS
Sobre la base del canal de distribución, el mercado se segmenta en licitación directa y distribuidor externo.
Análisis y perspectivas regionales del mercado global de automatización de farmacias
El mercado global de automatización de farmacias está segmentado en seis segmentos notables según el producto, el tipo de farmacia, el tamaño de la farmacia, la aplicación, el usuario final y el canal de distribución.
Los países cubiertos en este informe de mercado son EE. UU., Canadá, México, Alemania, Francia, Italia, Reino Unido, España, Países Bajos, Rusia, Suiza, Turquía, Bélgica, resto de Europa, Japón, China, India, Corea del Sur, Australia, Singapur, Malasia, Tailandia, Indonesia, Filipinas, resto de Asia-Pacífico, Brasil, Argentina, resto de Sudamérica, Arabia Saudita, Sudáfrica, Emiratos Árabes Unidos, Israel, Egipto y resto de Medio Oriente y África.
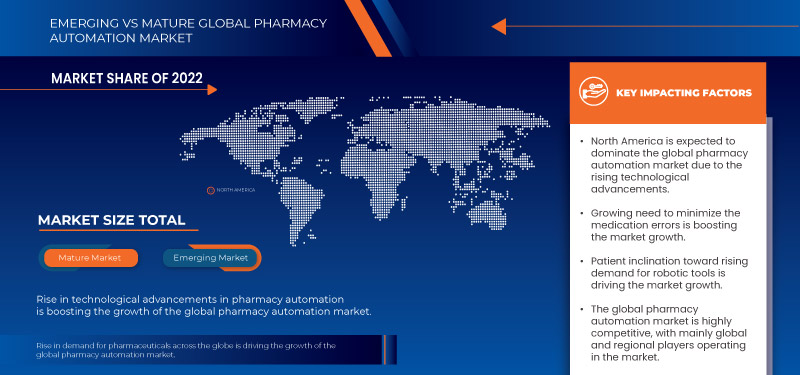
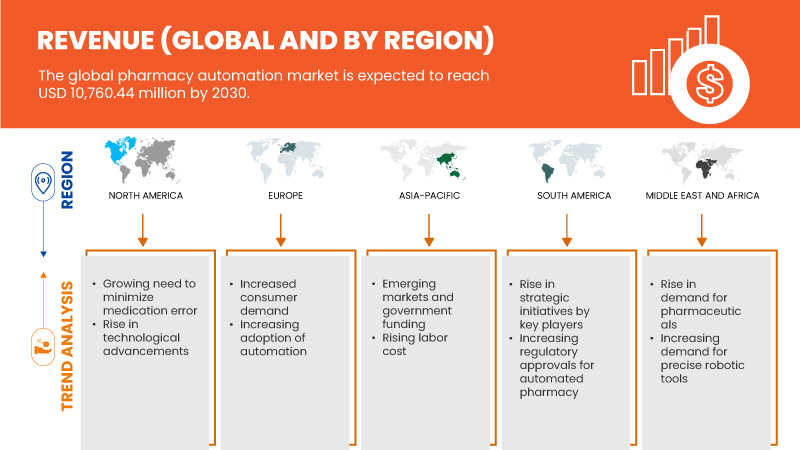
La región de Asia-Pacífico domina el mercado debido a la creciente inversión en I+D, que se espera que impulse el crecimiento del mercado. En 2023, se espera que China domine la región de Asia-Pacífico debido a la creciente necesidad de minimizar los errores de medicación y la creciente demanda de productos farmacéuticos. Se espera que Estados Unidos domine la región de América del Norte debido a la fuerte presencia de actores clave como OMNICELL, INC., McKesson Corporation y AmerisourceBergen Corporation. Se espera que Alemania domine la región de Europa debido a la creciente conciencia sobre las ventajas de los sistemas de automatización de farmacias sobre los métodos manuales.
La sección de países del informe también proporciona factores individuales que impactan en el mercado y cambios en la regulación en el mercado a nivel nacional que afectan las tendencias actuales y futuras del mercado. Los puntos de datos como nuevas ventas, ventas de reemplazo, demografía del país, leyes regulatorias y aranceles de importación y exportación son algunos de los principales indicadores utilizados para pronosticar el escenario del mercado para países individuales. Además, la presencia y disponibilidad de marcas globales y sus desafíos enfrentados debido a la competencia grande o escasa de las marcas locales y nacionales, y el impacto de los canales de venta se consideran al proporcionar un análisis de pronóstico de los datos del país.
Análisis del panorama competitivo y de la cuota de mercado global de la automatización de farmacias
El panorama competitivo del mercado global de automatización de farmacias proporciona detalles de los competidores. Los detalles incluidos son una descripción general de la empresa, las finanzas de la empresa, los ingresos generados, el potencial de mercado, la inversión en I+D, las nuevas iniciativas de mercado, la presencia global, los sitios e instalaciones de producción, las capacidades de producción, las fortalezas y debilidades de la empresa, el lanzamiento de productos, la amplitud y variedad de productos y el dominio de las aplicaciones. Los puntos de datos proporcionados anteriormente solo están relacionados con el enfoque de las empresas en el mercado.
Algunos de los principales actores del mercado que operan en el mercado global de automatización de farmacias son ARxIUM, OMNICELL INC., Cerner Corporation, Capsa Healthcare, ScriptPro LLC, RxSafe, LLC., MedAvail Technologies, Inc., Asteres Inc., InterLink AI, Inc., BD, Baxter, Fullscript, McKesson Corporation, Innovation Associates, AmerisourceBergen Corporation, UNIVERSAL LOGISTICS HOLDINGS, INC, Takazono Corporation, TOSHO Inc., Willach Group, BIQHS.
SKU-
Obtenga acceso en línea al informe sobre la primera nube de inteligencia de mercado del mundo
- Panel de análisis de datos interactivo
- Panel de análisis de empresas para oportunidades con alto potencial de crecimiento
- Acceso de analista de investigación para personalización y consultas
- Análisis de la competencia con panel interactivo
- Últimas noticias, actualizaciones y análisis de tendencias
- Aproveche el poder del análisis de referencia para un seguimiento integral de la competencia
Tabla de contenido
1 INTRODUCTION
1.1 OBJECTIVES OF THE STUDY
1.2 MARKET DEFINITION
1.3 OVERVIEW OF GLOBAL PHARMACY AUTOMATION MARKET
1.4 CURRENCY AND PRICING
1.5 LIMITATIONS
1.6 MARKETS COVERED
2 MARKET SEGMENTATION
2.1 MARKETS COVERED
2.2 GEOGRAPHICAL SCOPE
2.3 YEARS CONSIDERED FOR THE STUDY
2.4 DBMR TRIPOD DATA VALIDATION MODEL
2.5 PRIMARY INTERVIEWS WITH KEY OPINION LEADERS
2.6 MULTIVARIATE MODELLING
2.7 MARKET APPLICATION COVERAGE GRID
2.8 PRODUCT LIFELINE CURVE
2.9 DBMR MARKET POSITION GRID
2.1 VENDOR SHARE ANALYSIS
2.11 SECONDARY SOURCES
2.12 ASSUMPTIONS
3 EXECUTIVE SUMMARY
4 GLOBAL PHARMACY AUTOMATION MARKET: REGULATIONS
4.1 EXISTING STATE LAWS AND REGULATIONS FOR THE USE OF AUTOMATED DISPENSING SYSTEMS (ADS) IN THE U.S.
5 MARKET OVERVIEW
5.1 DRIVERS
5.1.1 GROWING NEED TO MINIMIZE MEDICATION ERRORS
5.1.2 RISING DEMAND FOR PHARMACEUTICALS
5.1.3 RISING LABOR COST
5.1.4 ADVANTAGES OF PHARMACY AUTOMATION SYSTEMS OVER MANUAL METHODS
5.1.5 TECHNOLOGICAL ADVANCEMENTS AND PRECISE ROBOTIC TOOLS
5.2 RESTRAINTS
5.2.1 RELUCTANCE AMONG THE HEALTHCARE ORGANIZATIONS TO ADOPT PHARMACY AUTOMATION SYSTEMS
5.2.2 HIGH CAPITAL INVESTMENT
5.2.3 INTEROPERABILITY PROBLEMS IN PHARMACY AUTOMATION
5.3 OPPORTUNITIES
5.3.1 NEED FOR INCREASING THE EFFICIENCY OF WORK WITHIN THE PHARMACIES
5.3.2 RISING HEALTHCARE EXPENDITURE IN EMERGING NATIONS
5.3.3 STRATEGIC INITIATIVES OF KEY MARKET PLAYERS
5.4 CHALLENGES
5.4.1 STRINGENCY OF REGULATORY PROCEDURES
5.4.2 SKILLED WORK-FORCE CHALLENGES
5.4.3 LIMITATIONS OF PHARMACY AUTOMATION SYSTEMS
6 GLOBAL PHARMACY AUTOMATION MARKET, BY PRODUCT
6.1 OVERVIEW
6.2 SYSTEMS
6.3 SOFTWARE
6.4 SERVICES
7 GLOBAL PHARMACY AUTOMATION MARKET, BY PHARMACY TYPE
7.1 OVERVIEW
7.2 INDEPENDENT
7.3 CHAIN
7.4 FEDERAL
8 GLOBAL PHARMACY AUTOMATION MARKET, BY PHARMACY SIZE
8.1 OVERVIEW
8.2 LARGE SIZE PHARMACY
8.3 MEDIUM SIZE PHARMACY
8.4 SMALL SIZE PHARMACY
9 GLOBAL PHARMACY AUTOMATION MARKET, BY APPLICATION
9.1 OVERVIEW
9.2 DRUG DISPENSING AND PACKAGING
9.3 DRUG STORAGE
9.4 INVENTORY MANAGEMENT
10 GLOBAL PHARMACY AUTOMATION MARKET, BY END USER
10.1 OVERVIEW
10.2 INPATIENT PHARMACIES
10.3 OUTPATIENT PHARMACIES
10.4 RETAIL PHARMACIES
10.5 ONLINE PHARMACIES
10.6 CENTRAL FILL/MAIL ORDER PHARMACIES
10.7 PHARMACY BENEFIT MANAGEMENT ORGANIZATIONS
10.8 OTHERS
11 GLOBAL PHARMACY AUTOMATION MARKET, BY DISTRIBUTION CHANNEL
11.1 OVERVIEW
11.2 DIRECT TENDER
11.3 THIRD PARTY DISTRIBUTOR
12 GLOBAL PHARMACY AUTOMATION MARKET, BY REGION
12.1 OVERVIEW
12.2 NORTH AMERICA
12.2.1 U.S.
12.2.2 CANADA
12.2.3 MEXICO
12.3 EUROPE
12.3.1 GERMANY
12.3.2 FRANCE
12.3.3 ITALY
12.3.4 U.K.
12.3.5 SPAIN
12.3.6 SWITZERLAND
12.3.7 RUSSIA
12.3.8 NETHERLANDS
12.3.9 BELGIUM
12.3.10 TURKEY
12.3.11 REST OF EUROPE
12.4 ASIA-PACIFIC
12.4.1 JAPAN
12.4.2 CHINA
12.4.3 AUSTRALIA
12.4.4 SOUTH KOREA
12.4.5 INDIA
12.4.6 SINGAPORE
12.4.7 THAILAND
12.4.8 INDONESIA
12.4.9 MALAYSIA
12.4.10 PHILIPPINES
12.4.11 REST OF ASIA-PACIFIC
12.5 SOUTH AMERICA
12.5.1 BRAZIL
12.5.2 ARGENTINA
12.5.3 REST OF SOUTH AMERICA
12.6 MIDDLE EAST & AFRICA
12.6.1 SAUDI ARABIA
12.6.2 SOUTH AFRICA
12.6.3 U.A.E.
12.6.4 ISRAEL
12.6.5 EGYPT
12.6.6 REST OF MIDDLE EAST & AFRICA
13 GLOBAL PHARMACY AUTOMATION MARKET, COMPANY LANDSCAPE
13.1 COMPANY SHARE ANALYSIS: GLOBAL
13.2 COMPANY SHARE ANALYSIS: NORTH AMERICA
13.3 COMPANY SHARE ANALYSIS: EUROPE
13.4 COMPANY SHARE ANALYSIS: ASIA-PACIFIC
14 SWOT ANALYSIS
15 COMPANY PROFILE
15.1 OMNICELL, INC.
15.1.1 COMPANY SNAPSHOT
15.1.2 REVENUE ANALYSIS
15.1.3 COMPANY SHARE ANALYSIS
15.1.4 PRODUCT PORTFOLIO
15.1.5 RECENT DEVELOPMENTS
15.2 MCKESSON CORPORATION
15.2.1 COMPANY SNAPSHOT
15.2.2 REVENUE ANALYSIS
15.2.3 COMPANY SHARE ANALYSIS
15.2.4 PRODUCT PORTFOLIO
15.2.5 RECENT DEVELOPMENTS
15.3 AMERISOURCEBERGEN CORPORATION
15.3.1 COMPANY SNAPSHOT
15.3.2 REVENUE ANALYSIS
15.3.3 COMPANY SHARE ANALYSIS
15.3.4 PRODUCT PORTFOLIO
15.3.5 RECENT DEVELOPMENTS
15.4 BAXTER
15.4.1 COMPANY SNAPSHOT
15.4.2 REVENUE ANALYSIS
15.4.3 COMPANY SHARE ANALYSIS
15.4.4 PRODUCT PORTFOLIO
15.4.5 RECENT DEVELOPMENTS
15.5 TOSHO CO., INC.
15.5.1 COMPANY SNAPSHOT
15.5.2 COMPANY SHARE ANALYSIS
15.5.3 PRODUCT PORTFOLIO
15.5.4 RECENT DEVELOPMENTS
15.6 APD ALGORITMOS PROCESOS Y DISEÑOS S.A.
15.6.1 COMPANY SNAPSHOT
15.6.2 PRODUCT PORTFOLIO
15.6.3 RECENT DEVELOPMENTS
15.7 ASTERES INC.
15.7.1 COMPANY SNAPSHOT
15.7.2 PRODUCT PORTFOLIO
15.7.3 RECENT DEVELOPMENTS
15.8 ARXIUM
15.8.1 COMPANY SNAPSHOT
15.8.2 PRODUCT PORTFOLIO
15.8.3 RECENT DEVELOPMENTS
15.9 BD
15.9.1 COMPANY SNAPSHOT
15.9.2 REVENUE ANALYSIS
15.9.3 COMPANY SHARE ANALYSIS
15.9.4 PRODUCT PORTFOLIO
15.9.5 RECENT DEVELOPMENTS
15.1 BIQHS
15.10.1 COMPANY SNAPSHOT
15.10.2 PRODUCT PORTFOLIO
15.10.3 RECENT DEVELOPMENTS
15.11 CAPSA HEALTHCARE
15.11.1 COMPANY SNAPSHOT
15.11.2 PRODUCT PORTFOLIO
15.11.3 RECENT DEVELOPMENTS
15.12 CERNER CORPORATION
15.12.1 COMPANY SNAPSHOT
15.12.2 REVENUE ANALYSIS
15.12.3 PRODUCT PORTFOLIO
15.12.4 RECENT DEVELOPMENTS
15.13 DEENOVA S.R.L.
15.13.1 COMPANY SNAPSHOT
15.13.2 PRODUCT PORTFOLIO
15.13.3 RECENT DEVELOPMENTS
15.14 DEMODEKS PHARMACY SHELVING
15.14.1 COMPANY SNAPSHOT
15.14.2 PRODUCT PORTFOLIO
15.14.3 RECENT DEVELOPMENTS
15.15 FULLSCRIPT
15.15.1 COMPANY SNAPSHOT
15.15.2 PRODUCT PORTFOLIO
15.15.3 RECENT DEVELOPMENTS
15.16 GENESIS AUTOMATION LTD
15.16.1 COMPANY SNAPSHOT
15.16.2 PRODUCT PORTFOLIO
15.16.3 RECENT DEVELOPMENTS
15.17 IA
15.17.1 COMPANY SNAPSHOT
15.17.2 PRODUCT PORTFOLIO
15.17.3 RECENT DEVELOPMENTS
15.18 INTERLINK AI, INC
15.18.1 COMPANY SNAPSHOT
15.18.2 PRODUCT PORTFOLIO
15.18.3 RECENT DEVELOPMENTS
15.19 JVM EUROPE BV
15.19.1 COMPANY SNAPSHOT
15.19.2 PRODUCT PORTFOLIO
15.19.3 RECENT DEVELOPMENTS
15.2 KLS PHARMA ROBOTICS GMBH
15.20.1 COMPANY SNAPSHOT
15.20.2 PRODUCT PORTFOLIO
15.20.3 RECENT DEVELOPMENTS
15.21 KUKA AG
15.21.1 COMPANY SNAPSHOT
15.21.2 REVENUE ANALYSIS
15.21.3 COMPANY SHARE ANALYSIS
15.21.4 PRODUCT PORTFOLIO
15.21.5 RECENT DEVELOPMENTS
15.22 MEDAVAIL TECHNOLOGIES, INC.
15.22.1 COMPANY SNAPSHOT
15.22.2 PRODUCT PORTFOLIO
15.22.3 RECENT DEVELOPMENTS
15.23 MYPAK SOLUTIONS PTY LTD.
15.23.1 COMPANY SNAPSHOT
15.23.2 PRODUCT PORTFOLIO
15.23.3 RECENT DEVELOPMENTS
15.24 RXSAFE, LLC.
15.24.1 COMPANY SNAPSHOT
15.24.2 PRODUCT PORTFOLIO
15.24.3 RECENT DEVELOPMENTS
15.25 SCRIPTPRO LLC
15.25.1 COMPANY SNAPSHOT
15.25.2 COMPANY SHARE ANALYSIS
15.26.3 PRODUCT PORTFOLIO
15.26.4 RECENT DEVELOPMENTS
15.27 SYNERGY MEDICAL
15.27.1 COMPANY SNAPSHOT
15.27.2 PRODUCT PORTFOLIO
15.27.3 RECENT DEVELOPMENTS
15.28 TAKAZONO CORPORATION
15.28.1 COMPANY SNAPSHOT
15.28.2 PRODUCT PORTFOLIO
15.28.3 RECENT DEVELOPMENTS
15.29 UNIVERSAL LOGISTICS HOLDINGS, INC.
15.29.1 COMPANY SNAPSHOT
15.29.2 REVENUE ANALYSIS
15.29.3 PRODUCT PORTFOLIO
15.29.4 RECENT DEVELOPMENTS
15.3 WILLACH GROUP
15.30.1 COMPANY SNAPSHOT
15.30.2 PRODUCT PORTFOLIO
15.30.3 RECENT DEVELOPMENTS
15.31 YUYAMA
15.31.1 COMPANY SNAPSHOT
15.31.2 PRODUCT PORTFOLIO
15.31.3 RECENT DEVELOPMENTS
16 QUESTIONNAIRE
17 RELATED REPORTS
Lista de figuras
FIGURE 1 GLOBAL PHARMACY AUTOMATION MARKET: SEGMENTATION
FIGURE 2 GLOBAL PHARMACY AUTOMATION MARKET: DATA TRIANGULATION
FIGURE 3 GLOBAL PHARMACY AUTOMATION MARKET: DROC ANALYSIS
FIGURE 4 GLOBAL PHARMACY AUTOMATION MARKET: GLOBAL VS REGIONAL MARKET ANALYSIS
FIGURE 5 GLOBAL PHARMACY AUTOMATION MARKET: COMPANY RESEARCH ANALYSIS
FIGURE 6 GLOBAL PHARMACY AUTOMATION MARKET: INTERVIEW DEMOGRAPHICS
FIGURE 7 GLOBAL PHARMACY AUTOMATION MARKET: MARKET APPLICATION COVERAGE GRID
FIGURE 8 GLOBAL PHARMACY AUTOMATION MARKET: DBMR MARKET POSITION GRID
FIGURE 9 GLOBAL PHARMACY AUTOMATION MARKET: VENDOR SHARE ANALYSIS
FIGURE 10 GLOBAL PHARMACY AUTOMATION MARKET: SEGMENTATION
FIGURE 11 NORTH AMERICA IS ANTICIPATED TO DOMINATE THE GLOBAL PHARMACY AUTOMATION MARKET AND ASIA-PACIFIC IS ESTIMATED TO BE GROWING WITH THE HIGHEST CAGR IN THE FORECAST PERIOD OF 2023 TO 2030
FIGURE 12 GROWING NEED TO MINIMIZE MEDICATION ERRORS IS EXPECTED TO DRIVE THE GLOBAL PHARMACY AUTOMATION MARKET IN THE FORECAST PERIOD OF 2023 TO 2030
FIGURE 13 SYSTEMS SEGMENT IS EXPECTED TO ACCOUNT FOR THE LARGEST SHARE OF THE GLOBAL PHARMACY AUTOMATION MARKET IN 2023 AND 2030
FIGURE 14 ASIA-PACIFIC IS THE FASTEST GROWING REGION FOR PHARMACY AUTOMATION MANUFACTURERS IN THE FORECAST PERIOD OF 2023 TO 2030
FIGURE 15 DRIVERS, RESTRAINTS, OPPORTUNITIES AND CHALLENGES OF GLOBAL PHARMACY AUTOMATION MARKET
FIGURE 16 GLOBAL PHARMACY AUTOMATION MARKET: BY PRODUCT, 2022
FIGURE 17 GLOBAL PHARMACY AUTOMATION MARKET: BY PRODUCT, 2023-2030 (USD
FIGURE 18 GLOBAL PHARMACY AUTOMATION MARKET: BY PRODUCT, CAGR (2023-2030)
FIGURE 19 GLOBAL PHARMACY AUTOMATION MARKET: BY PRODUCT, LIFELINE CURVE
FIGURE 20 GLOBAL PHARMACY AUTOMATION MARKET: BY PHARMACY TYPE, 2022
FIGURE 21 GLOBAL PHARMACY AUTOMATION MARKET: BY PHARMACY TYPE, 2023-2030 (USD MILLION)
FIGURE 22 GLOBAL PHARMACY AUTOMATION MARKET: BY PHARMACY TYPE, CAGR (2023-2030)
FIGURE 23 GLOBAL PHARMACY AUTOMATION MARKET: BY PHARMACY TYPE, LIFELINE CURVE
FIGURE 24 GLOBAL PHARMACY AUTOMATION MARKET: BY PHARMACY SIZE, 2022
FIGURE 25 GLOBAL PHARMACY AUTOMATION MARKET: BY PHARMACY SIZE, 2023-2030 (USD MILLION)
FIGURE 26 GLOBAL PHARMACY AUTOMATION MARKET: BY PHARMACY SIZE, CAGR (2023-2030)
FIGURE 27 GLOBAL PHARMACY AUTOMATION MARKET: BY PHARMACY SIZE, LIFELINE CURVE
FIGURE 28 GLOBAL PHARMACY AUTOMATION MARKET: BY APPLICATION, 2022
FIGURE 29 GLOBAL PHARMACY AUTOMATION MARKET: BY APPLICATION, 2023-2030 (USD MILLION)
FIGURE 30 GLOBAL PHARMACY AUTOMATION MARKET: BY APPLICATION, CAGR (2023-2030)
FIGURE 31 GLOBAL PHARMACY AUTOMATION MARKET: BY APPLICATION, LIFELINE CURVE
FIGURE 32 GLOBAL PHARMACY AUTOMATION MARKET: BY END USER, 2022
FIGURE 33 GLOBAL PHARMACY AUTOMATION MARKET: BY END USER, 2023-2030 (USD MILLION)
FIGURE 34 GLOBAL PHARMACY AUTOMATION MARKET: BY END USER, CAGR (2023-2030)
FIGURE 35 GLOBAL PHARMACY AUTOMATION MARKET: BY END USER, LIFELINE CURVE
FIGURE 36 GLOBAL PHARMACY AUTOMATION MARKET: BY DISTRIBUTION CHANNEL, 2022
FIGURE 37 GLOBAL PHARMACY AUTOMATION MARKET: BY DISTRIBUTION CHANNEL, 2023-2030 (USD MILLION)
FIGURE 38 GLOBAL PHARMACY AUTOMATION MARKET: BY DISTRIBUTION CHANNEL, CAGR (2023-2030)
FIGURE 39 GLOBAL PHARMACY AUTOMATION MARKET: BY DISTRIBUTION CHANNEL, LIFELINE CURVE
FIGURE 40 GLOBAL PHARMACY AUTOMATION MARKET: SNAPSHOT (2022)
FIGURE 41 GLOBAL PHARMACY AUTOMATION MARKET: BY REGION (2022)
FIGURE 42 GLOBAL PHARMACY AUTOMATION MARKET: BY REGION (2023 & 2030)
FIGURE 43 GLOBAL PHARMACY AUTOMATION MARKET: BY REGION (2022 & 2030)
FIGURE 44 GLOBAL PHARMACY AUTOMATION MARKET: BY PRODUCT (2023-2030)
FIGURE 45 NORTH AMERICA PHARMACY AUTOMATION MARKET: SNAPSHOT (2022)
FIGURE 46 NORTH AMERICA PHARMACY AUTOMATION MARKET: BY COUNTRY (2022)
FIGURE 47 NORTH AMERICA PHARMACY AUTOMATION MARKET: BY COUNTRY (2023 & 2030)
FIGURE 48 NORTH AMERICA PHARMACY AUTOMATION MARKET: BY COUNTRY (2022 & 2030)
FIGURE 49 NORTH AMERICA PHARMACY AUTOMATION MARKET: BY PRODUCT (2023-2030)
FIGURE 50 EUROPE PHARMACY AUTOMATION MARKET: SNAPSHOT (2022)
FIGURE 51 EUROPE PHARMACY AUTOMATION MARKET: BY COUNTRY (2022)
FIGURE 52 EUROPE PHARMACY AUTOMATION MARKET: BY COUNTRY (2023 & 2030)
FIGURE 53 EUROPE PHARMACY AUTOMATION MARKET: BY COUNTRY (2022 & 2030)
FIGURE 54 EUROPE PHARMACY AUTOMATION MARKET: BY PRODUCT (2023-2030)
FIGURE 55 ASIA-PACIFIC PHARMACY AUTOMATION MARKET: SNAPSHOT (2022)
FIGURE 56 ASIA-PACIFIC PHARMACY AUTOMATION MARKET: BY COUNTRY (2022)
FIGURE 57 ASIA-PACIFIC PHARMACY AUTOMATION MARKET: BY COUNTRY (2023 & 2030)
FIGURE 58 ASIA-PACIFIC PHARMACY AUTOMATION MARKET: BY COUNTRY (2022 & 2030)
FIGURE 59 ASIA-PACIFIC PHARMACY AUTOMATION MARKET: BY PRODUCT (2023-2030)
FIGURE 60 SOUTH AMERICA PHARMACY AUTOMATION MARKET: SNAPSHOT (2022)
FIGURE 61 SOUTH AMERICA PHARMACY AUTOMATION MARKET: BY COUNTRY (2022)
FIGURE 62 SOUTH AMERICA PHARMACY AUTOMATION MARKET: BY COUNTRY (2023 & 2030)
FIGURE 63 SOUTH AMERICA PHARMACY AUTOMATION MARKET: BY COUNTRY (2022 & 2030)
FIGURE 64 SOUTH AMERICA PHARMACY AUTOMATION MARKET: BY PRODUCT (2023-2030)
FIGURE 65 MIDDLE EAST & AFRICA PHARMACY AUTOMATION MARKET: SNAPSHOT (2022)
FIGURE 66 MIDDLE EAST & AFRICA PHARMACY AUTOMATION MARKET: BY COUNTRY (2022)
FIGURE 67 MIDDLE EAST & AFRICA PHARMACY AUTOMATION MARKET: BY COUNTRY (2023 & 2030)
FIGURE 68 MIDDLE EAST & AFRICA PHARMACY AUTOMATION MARKET: BY COUNTRY (2022 & 2030)
FIGURE 69 MIDDLE EAST & AFRICA PHARMACY AUTOMATION MARKET: BY PRODUCT (2023-2030)
FIGURE 70 GLOBAL PHARMACY AUTOMATION MARKET: COMPANY SHARE 2022 (%)
FIGURE 71 NORTH AMERICA PHARMACY AUTOMATION MARKET: COMPANY SHARE 2022 (%)
FIGURE 72 EUROPE PHARMACY AUTOMATION MARKET: COMPANY SHARE 2022 (%)
FIGURE 73 ASIA-PACIFIC PHARMACY AUTOMATION MARKET: COMPANY SHARE 2022 (%)

Metodología de investigación
La recopilación de datos y el análisis del año base se realizan utilizando módulos de recopilación de datos con muestras de gran tamaño. La etapa incluye la obtención de información de mercado o datos relacionados a través de varias fuentes y estrategias. Incluye el examen y la planificación de todos los datos adquiridos del pasado con antelación. Asimismo, abarca el examen de las inconsistencias de información observadas en diferentes fuentes de información. Los datos de mercado se analizan y estiman utilizando modelos estadísticos y coherentes de mercado. Además, el análisis de la participación de mercado y el análisis de tendencias clave son los principales factores de éxito en el informe de mercado. Para obtener más información, solicite una llamada de un analista o envíe su consulta.
La metodología de investigación clave utilizada por el equipo de investigación de DBMR es la triangulación de datos, que implica la extracción de datos, el análisis del impacto de las variables de datos en el mercado y la validación primaria (experto en la industria). Los modelos de datos incluyen cuadrícula de posicionamiento de proveedores, análisis de línea de tiempo de mercado, descripción general y guía del mercado, cuadrícula de posicionamiento de la empresa, análisis de patentes, análisis de precios, análisis de participación de mercado de la empresa, estándares de medición, análisis global versus regional y de participación de proveedores. Para obtener más información sobre la metodología de investigación, envíe una consulta para hablar con nuestros expertos de la industria.
Personalización disponible
Data Bridge Market Research es líder en investigación formativa avanzada. Nos enorgullecemos de brindar servicios a nuestros clientes existentes y nuevos con datos y análisis que coinciden y se adaptan a sus objetivos. El informe se puede personalizar para incluir análisis de tendencias de precios de marcas objetivo, comprensión del mercado de países adicionales (solicite la lista de países), datos de resultados de ensayos clínicos, revisión de literatura, análisis de mercado renovado y base de productos. El análisis de mercado de competidores objetivo se puede analizar desde análisis basados en tecnología hasta estrategias de cartera de mercado. Podemos agregar tantos competidores sobre los que necesite datos en el formato y estilo de datos que esté buscando. Nuestro equipo de analistas también puede proporcionarle datos en archivos de Excel sin procesar, tablas dinámicas (libro de datos) o puede ayudarlo a crear presentaciones a partir de los conjuntos de datos disponibles en el informe.

