
Global Pharmaceutical Vials Market
Tamaño del mercado en miles de millones de dólares
Tasa de crecimiento anual compuesta (CAGR) :
% 
 USD
13,571.04 Million
USD
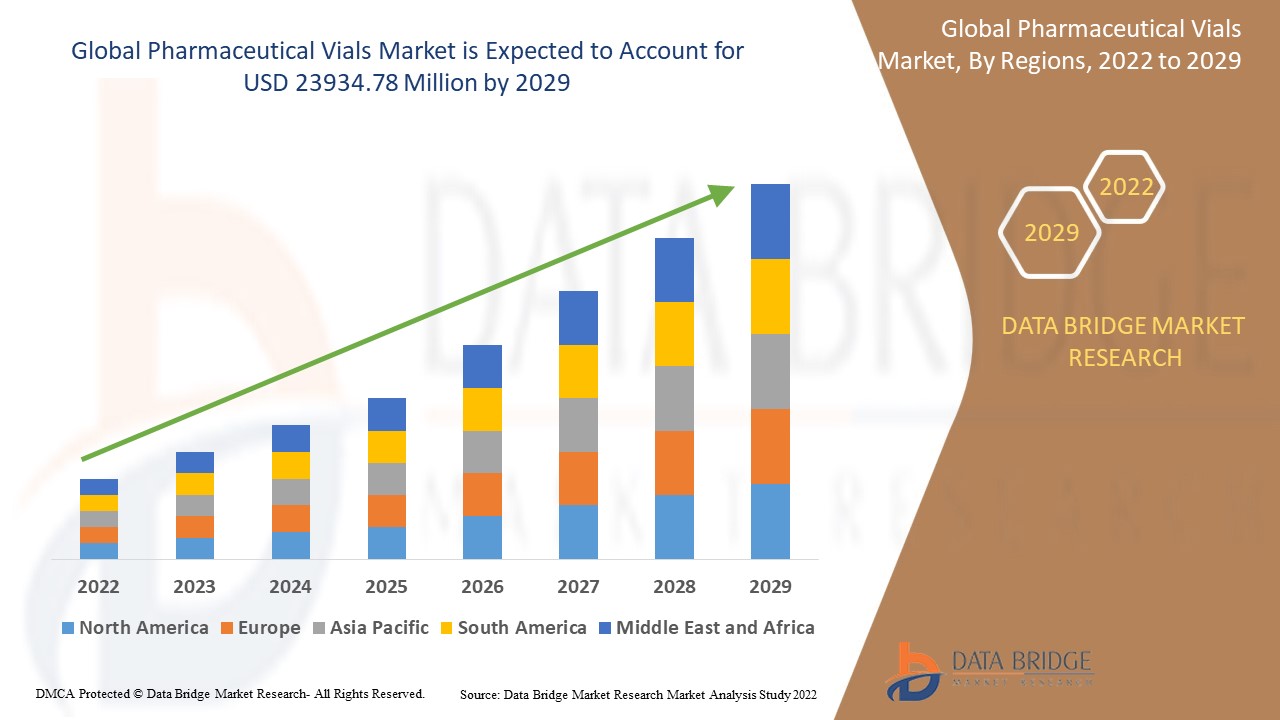
23,934.78 Million
2021
2029
USD
13,571.04 Million
USD
23,934.78 Million
2021
2029
| 2022 –2029 | |
| USD 13,571.04 Million | |
| USD 23,934.78 Million | |
| % | |
|
Global Pharmaceutical Vials Market, By Material (Plastic, Glass, Others), Neck Type (Crimp Neck, Double Chamber, Screw Neck, Flip Cap, Others), Cap Size (13-425 MM, 15-425 MM, 18-400 MM, 22-350 MM, 24-400 MM, 8-425 MM, 9MM, Others), Market (Parenteral, Gastro, ENT, Others), Drug Type (Injectable, Non-Injectable), Capacity (1 ML, 2 ML, 3 ML, 4 ML, 8 ML, 10 ML, 20 ML, 30 ML, 50 ML, Others), Application (Nasal, Oral, Others), Distribution Channel (Direct Sales, Medical Stores/Pharmacies, E-Commerce, Others), End-User (Pharmaceutical Companies, Biopharmaceutical Companies, Contract Development and Manufacturing Companies, Compound Pharmacy, Others) – Industry Trends and Forecast to 2029
Market Analysis and Size
Pharmaceutical vials are a type of small containers which are used for the purpose of storing liquid medicines. They are being used as a scientific sample vessel for testing in labs that is also used in an auto sampler device. Pharmaceutical vials also help the person in consuming their medicines in the precise dosage and at the right time.
Data Bridge Market Research analyses that the global pharmaceutical vials market was valued at USD 13571.04 million in 2021 and is expected to reach USD 23934.78 million by 2029, registering a CAGR of 7.35 % during the forecast period of 2022 to 2029. In addition to the market insights such as market value, growth rate, market segments, geographical coverage, market players, and market scenario, the market report curated by the Data Bridge Market Research team includes in-depth expert analysis, import/export analysis, pricing analysis, production consumption analysis, patent analysis and technological advancements.
Report Scope and Market Segmentation
|
Report Metric |
Details |
|
Forecast Period |
2022 to 2029 |
|
Base Year |
2021 |
|
Historic Years |
2020 (Customizable to 2014 - 2019) |
|
Quantitative Units |
Revenue in USD million, Volumes in Units, Pricing in USD |
|
Segments Covered |
Material (Plastic, Glass, Others), Neck Type (Crimp Neck, Double Chamber, Screw Neck, Flip Cap, Others), Cap Size (13-425 MM, 15-425 MM, 18-400 MM, 22-350 MM, 24-400 MM, 8-425 MM, 9MM, Others), Market (Parenteral, Gastro, ENT, Others), Drug Type (Injectable, Non-Injectable), Capacity (1 ML, 2 ML, 3 ML, 4 ML, 8 ML, 10 ML, 20 ML, 30 ML, 50 ML, Others), Application (Nasal, Oral, Others), Distribution Channel (Direct Sales, Medical Stores/Pharmacies, E-Commerce, Others), End-User (Pharmaceutical Companies, Biopharmaceutical Companies, Contract Development and Manufacturing Companies, Compound Pharmacy, Others) |
|
Countries Covered |
EE. UU., Canadá y México en América del Norte, Alemania, Francia, Reino Unido, Países Bajos, Suiza, Bélgica, Rusia, Italia, España, Turquía, Resto de Europa en Europa, China, Japón, India, Corea del Sur, Singapur, Malasia, Australia, Tailandia, Indonesia, Filipinas, Resto de Asia-Pacífico (APAC) en Asia-Pacífico (APAC), Arabia Saudita, Emiratos Árabes Unidos, Sudáfrica, Egipto, Israel, Resto de Medio Oriente y África (MEA) como parte de Medio Oriente y África (MEA), Brasil, Argentina y Resto de América del Sur como parte de América del Sur |
|
Actores del mercado cubiertos |
Schott AG (Alemania), Nipro (Japón), Piramal Glass (India), Sisecam (Turquía), Owens-Illinois Inc. (EE. UU.), Gerresheimer AG (Alemania), Bormioli Pharma SpA (Italia), Ardagh Group SA (Luxemburgo), West Pharmaceutical Services Inc. (EE. UU.), STOELZLE GLASS GROUP (Austria), SGD Pharma (Francia), Shandong Qidu Pharmaceutical Co., Ltd. (China), Corning Incorporated (EE. UU.), DWK Life Sciences (EE. UU.), Berry Global Inc (EE. UU.), Airnov (EE. UU.), Pacific Vial (EE. UU.), Stevanato Group (Italia), Adelphi Healthcare Packaging (Reino Unido) |
|
Oportunidades de mercado |
|
Definición de mercado
Los viales son pequeños recipientes o frascos hechos de vidrio o plástico . Se utilizan para almacenar medicamentos en forma líquida, e incluso pueden contener tabletas o polvos. Los viales se utilizan para transportar múltiples dosis de medicamentos y normalmente son de mayor tamaño. Los viales están sellados con un tapón de goma o una tapa de rosca, lo que significa que se pueden volver a sellar y abrir.
Dinámica del mercado de viales farmacéuticos
Conductores
- Industria farmacéutica en crecimiento
La industria farmacéutica, que crece rápidamente, está impulsando el crecimiento del mercado de viales farmacéuticos a nivel mundial. La demanda de viales farmacéuticos está aumentando principalmente en países densamente poblados. La creciente demanda de viales aumenta la producción farmacéutica en estos países y se espera que aumente aún más la tasa de crecimiento del mercado.
- Alta demanda de viales de vidrio
Los envases de vidrio son muy populares en el sector farmacéutico porque son fáciles de esterilizar con calor y no reaccionan con la mayoría de los medicamentos . Los envases de vidrio de colores pueden proteger los medicamentos de diferentes longitudes de onda, incluidos los rayos ultravioleta del sol. Además, el vidrio se puede reciclar y está disponible en todo el mundo, lo que lo ha convertido en un material perfecto para el envasado de productos farmacéuticos.
- Aumento de la demanda debido al aumento de enfermedades
La creciente complejidad de los medicamentos debido al aumento de enfermedades, que aumentan la demanda de medicamentos parenterales como la insulina y los corticosteroides, y la creciente vacunación impulsarán el crecimiento del mercado de viales farmacéuticos a nivel mundial.
Oportunidades
Los diversos avances de productos que se están realizando en el sector de la salud están abriendo un nuevo potencial de demanda en el mercado de viales farmacéuticos. El objetivo principal de los profesionales y proveedores de atención médica es garantizar que los pacientes tomen la dosis precisa de medicamentos o medicinas, lo que también ha impulsado la popularidad de los viales farmacéuticos. La demanda de nuevas formulaciones para enfermedades crónicas en pacientes hospitalizados también ha favorecido a los fabricantes en los sectores farmacéutico y biotecnológico . Debido a esto, se generan más oportunidades ventajosas para la tasa de crecimiento del mercado de viales farmacéuticos.
Restricciones/ Desafíos
La liberación de sustancias químicas en la superficie interna de los recipientes de vidrio es el principal problema que enfrentan los fabricantes a la hora de producir viales farmacéuticos innovadores. El aumento del costo del embalaje en general también es la principal limitación que obstaculizará la tasa de crecimiento del mercado de viales farmacéuticos.
Este informe sobre el mercado de viales farmacéuticos proporciona detalles de los nuevos desarrollos recientes, regulaciones comerciales, análisis de importación y exportación, análisis de producción, optimización de la cadena de valor, participación de mercado, impacto de los actores del mercado nacional y localizado, analiza las oportunidades en términos de bolsillos de ingresos emergentes, cambios en las regulaciones del mercado, análisis estratégico del crecimiento del mercado, tamaño del mercado, crecimientos del mercado por categorías, nichos de aplicación y dominio, aprobaciones de productos, lanzamientos de productos, expansiones geográficas, innovaciones tecnológicas en el mercado. Para obtener más información sobre el mercado de viales farmacéuticos, comuníquese con Data Bridge Market Research para obtener un informe de analista; nuestro equipo lo ayudará a tomar una decisión de mercado informada para lograr el crecimiento del mercado.
Impacto de COVID-19 en el mercado de viales farmacéuticos
El brote sin precedentes de la pandemia de COVID-19 ha aumentado la demanda de medicamentos parenterales, alentando a los actores del mercado a crear nuevos viales farmacéuticos estériles y seguros, y permanecer libres de contaminación antes de la organización. Esto impulsará la tasa de crecimiento del mercado de viales farmacéuticos durante la pandemia. Por otro lado, el brote de covid-19 ha interrumpido la unidad de fabricación y la cadena de suministro con una caída significativa en la producción.
Desarrollo reciente
- En febrero de 2022, Bormioli Pharma anunció una serie de colaboraciones destinadas a aumentar la sostenibilidad y el rendimiento del vidrio utilizado en el sector farmacéutico, fortalecer la resistencia de las botellas a las sustancias químicas y reducir la huella de carbono durante la producción de vidrio.
- En junio de 2021, la Administración de Alimentos y Medicamentos de EE. UU. (FDA) aprobó una aprobación tentativa recibida por Zydus Cadila Healthcare para vender “pemetrexed” en viales de 500 mg, 100 mg y 1000 mg, y viales de dosis única para inyección.
Alcance del mercado mundial de viales farmacéuticos
El mercado de viales farmacéuticos está segmentado en función del material, el tipo de cuello, el tamaño de la tapa, el tipo de fármaco comercializado, la capacidad, el canal de distribución y el usuario final. El crecimiento entre estos segmentos le ayudará a analizar los segmentos de crecimiento reducido de las industrias y brindará a los usuarios una valiosa descripción general del mercado y conocimientos del mercado para ayudarlos a tomar decisiones estratégicas para identificar las principales aplicaciones del mercado.
Material
- Plástico
- Vaso
- Otros
Tipo de cuello
- Cuello engarzado
- Doble cámara
- Cuello de tornillo
- Tapa abatible
- Otros
Tamaño de la tapa
- 13-425 MM
- 15-425 MM
- 18-400 mm
- 22-350 milímetros
- 24-400 mm
- 8-425 MM
- 9MM
- Otros
Mercado
- Parenteral
- Gastro
- Otorrinolaringología
- Otros
Tipo de droga
- Inyectable
- No inyectable
Capacidad
- 1 ml
- 2 ml
- 3 ml
- 4 ml
- 8 ml
- 10 ml
- 20 ml
- 30 ml
- 50 ml
- Otros
Solicitud
- Nasal
- Oral
- Otros
Canal de distribución
- Ventas directas
- Tiendas de medicamentos/farmacias
- Comercio electrónico
- Otros
Usuario final
- Compañías farmacéuticas
- Compañías biofarmacéuticas
- Empresas de desarrollo y fabricación por contrato
- Farmacia compuesta
- Otros
Análisis y perspectivas regionales del mercado de viales farmacéuticos
Se analiza el mercado de viales farmacéuticos y se proporcionan información y tendencias del tamaño del mercado por material del país, tipo de cuello, tamaño de la tapa, tipo de medicamento del mercado, capacidad, aplicación, canal de distribución y usuario final como se menciona anteriormente.
Los países cubiertos en el informe del mercado de viales farmacéuticos son EE. UU., Canadá y México en América del Norte, Alemania, Francia, Reino Unido, Países Bajos, Suiza, Bélgica, Rusia, Italia, España, Turquía, Resto de Europa en Europa, China, Japón, India, Corea del Sur, Singapur, Malasia, Australia, Tailandia, Indonesia, Filipinas, Resto de Asia-Pacífico (APAC) en Asia-Pacífico (APAC), Arabia Saudita, Emiratos Árabes Unidos, Sudáfrica, Egipto, Israel, Resto de Medio Oriente y África (MEA) como parte de Medio Oriente y África (MEA), Brasil, Argentina y Resto de América del Sur como parte de América del Sur.
América del Norte domina el mercado de viales farmacéuticos en términos de participación de mercado durante el período de pronóstico. Esto se debe a la creciente demanda de viales farmacéuticos en esta región. La región de América del Norte lidera el mercado de viales farmacéuticos, con EE. UU. a la cabeza debido a la creciente conciencia y expansión comercial entre los consumidores de viales farmacéuticos en esta región.
Durante el período proyectado, se espera que América del Norte sea la región con mayor desarrollo debido al creciente consumo de viales farmacéuticos en la industria farmacéutica en este sector.
La sección de países del informe también proporciona factores de impacto de mercado individuales y cambios en la regulación del mercado que afectan las tendencias actuales y futuras del mercado. Los puntos de datos como el análisis de la cadena de valor ascendente y descendente, las tendencias técnicas y el análisis de las cinco fuerzas de Porter, los estudios de casos son algunos de los indicadores utilizados para pronosticar el escenario del mercado para países individuales. Además, la presencia y disponibilidad de marcas globales y sus desafíos enfrentados debido a la competencia grande o escasa de las marcas locales y nacionales, el impacto de los aranceles nacionales y las rutas comerciales se consideran al proporcionar un análisis de pronóstico de los datos del país.
Análisis del panorama competitivo y de la cuota de mercado de los viales farmacéuticos
El panorama competitivo del mercado de viales farmacéuticos proporciona detalles por competidor. Los detalles incluidos son una descripción general de la empresa, las finanzas de la empresa, los ingresos generados, el potencial de mercado, la inversión en investigación y desarrollo, las nuevas iniciativas de mercado, la presencia global, los sitios e instalaciones de producción, las capacidades de producción, las fortalezas y debilidades de la empresa, el lanzamiento de productos, la amplitud y la variedad de productos, y el dominio de las aplicaciones. Los puntos de datos anteriores proporcionados solo están relacionados con el enfoque de las empresas en relación con el mercado de viales farmacéuticos.
Algunos de los principales actores que operan en el mercado de viales farmacéuticos son:
- Schott AG (Alemania)
- Nipro (Japón)
- Vidrio piramidal (India)
- Sisecam (Turquía)
- Owens-Illinois Inc. (Estados Unidos)
- Gerresheimer AG (Alemania)
- Bormioli Pharma SpA (Italia)
- Grupo Ardagh SA (Luxemburgo)
- Servicios farmacéuticos del oeste Inc. (Estados Unidos)
- GRUPO DE VIDRIO STOELZLE (Austria)
- SGD Pharma (Francia)
- Compañía farmacéutica Shandong Qidu (China)
- Corning Incorporated (Estados Unidos)
- DWK Life Sciences (Estados Unidos)
- Berry Global Inc (Estados Unidos)
- Airnov (EE. UU.), Pacific Vial (EE. UU.)
- Grupo Stevanato (Italia)
- Adelphi Healthcare Packaging (Reino Unido)
SKU-
Obtenga acceso en línea al informe sobre la primera nube de inteligencia de mercado del mundo

- Panel de análisis de datos interactivo
- Panel de análisis de empresas para oportunidades con alto potencial de crecimiento
- Acceso de analista de investigación para personalización y consultas
- Análisis de la competencia con panel interactivo
- Últimas noticias, actualizaciones y análisis de tendencias
- Aproveche el poder del análisis de referencia para un seguimiento integral de la competencia
Tabla de contenido
- INTRODUCTION
- OBJECTIVES OF THE STUDY
- MARKET DEFINITION
- OVERVIEW OF GLOBAL PHARMACEUTICAL VIALS MARKET
- LIMITATION
- MARKETS COVERED
- MARKET SEGMENTATION
- MARKETS COVERED
- GEOGRAPHICAL SCOPE
- YEARS CONSIDERED FOR THE STUDY
- CURRENCY AND PRICING
- DBMR TRIPOD DATA VALIDATION MODEL
- DRUG TYPE LIFE LINE CURVE
- MULTIVARIATE MODELLING
- PRIMARY INTERVIEWS WITH KEY OPINION LEADERS
- DBMR MARKET POSITION GRID
- MARKET APPLICATION COVERAGE GRID
- DBMR MARKET CHALLENGE MATRIX
- VENDOR SHARE ANALYSIS
- IMPORT-EXPORT DATA
- SECONDARY SOURCES
- ASSUMPTIONS
- EXECUTIVE SUMMARY
- PREMIUM INSIGHTS
- PREMIUM INSIGHTS
- MARKET OVERVIEW
- DRIVERS
- GROWING DEMAND OF PACKAGING IN PHARMACEUTICAL INDUSTRY
- GROWING DEMAND FOR DRUG DELIVERY DEVICES AND BLISTER PACKAGING
- GROWTH OF PREFILLED SYRINGES
- GROWING HEALTH AWARENESS AND ADOPTION OF NEW TECHNIQUES FOR STORAGE OF LIQUID MEDICINE
- RESTRAINTS
- CHEMICALS RELEASE OF THE INTERNAL SURFACE OF GLASS TUBING CONTAINERS
- INCREASING COST OF OVERALL PACKAGING
- OPPORTUNITIES
- IMPLEMENTING READY-TO USE GLASS VIALS FOR FLEXIBLE ASEPTIC FILLING
- INCREASING DEMAND OF PACKAGING FOR COVID-19 VACCINE
- CHALLENGES
- RECYCLING OF WASTE PRODUCE BY PHARMACEUTICAL PACKAGING
- INCREASING GOVERNMENT REGULATIONS TOWARDS PHARMACEUTICAL SECTOR
- COVID-19 IMPACT ON THE PHARMACEUTICAL VIALS MARKET IN CHEMICAL AND MATERIALS INDUSTRY
- ANALYSIS ON IMPACT OF COVID-19 ON THE GLOBAL PHARMACEUTICAL VIALS MARKET
- AFTERMATH OF COVID-19 AND GOVERNMENT INITIATIVE TO BOOST THE GLOBAL PHARMACEUTICAL VIALS MARKET
- STRATEGIC DECISIONS FOR MANUFACTURERS AFTER COVID-19 TO GAIN COMPETITIVE MARKET SHARE
- PRICE IMPACT
- IMPACT ON DEMAND
- IMPACT ON SUPPLY CHAIN
- CONCLUSION
- GLOBAL PHARMACEUTICAL VIALS MARKET, BY MATERIAL
- OVERVIEW
- GLASS
- GLASS BY COLOR
- AMBER
- CLEAR
- OTHERS
- GLASS BY TYPE
- TYPE I (BOROSILICATE GLASS)
- TYPE II (TREATED SODA-LIME GLASS)
- TYPE III (REGULAR SODA LIME GLASS)
- TYPE IV (TYPE NP GLASS/GENERAL-PURPOSE SODA LIME GLASS)
- GLASS BY PRODUCT
- SERUM / SPECIALTY GLASS VIALS
- SCREW THREAD GLASS VIALS
- STERILE GLASS VIALS
- SAMPLE GLASS VIALS
- AUTOSAMPLER VIALS
- CHROMATOGRAPHY VIALS
- EPA VOA VIALS
- OTHERS
- PLASTIC
- PLASTIC BY COLOR
- TRANSLUCENT
- OPAQUE
- OTHERS
- PLASTIC BY TYPE
- HIGH-DENSITY POLYETHYLENE (HDPE)
- POLYSTYRENE
- POLYPROPYLENE
- POLYVINYL CHLORIDE (PVC)
- POLYCARBONATE
- POLYESTER
- OTHERS
- OTHERS
- GLOBAL PHARMACEUTICAL VIALS MARKET, BY NECK TYPE
- OVERVIEW
- SCREW NECK
- CRIMP NECK
- DOUBLE CHAMBER
- FLIP CAP
- OTHERS
- GLOBAL PHARMACEUTICAL VIALS MARKET, BY CAP SIZE
- OVERVIEW
- 9MM
- 8-425 MM
- 13-425 MM
- 15-425 MM
- 18-400 MM
- 22-350 MM
- 24-400 MM
- OTHERS
- GLOBAL PHARMACEUTICAL VIALS MARKET, BY DISTRIBUTION CHANNEL
- OVERVIEW
- DIRECT SALES
- MEDICAL STORES/PHARMACIES
- E-COMMERCE
- OTHERS
- GLOBAL PHARMACEUTICAL VIALS MARKET, BY CAPACITY
- OVERVIEW
- 1 ML
- 2 ML
- 3 ML
- 4 ML
- 8 ML
- 10 ML
- 20 ML
- 30 ML
- 50 ML
- OTHERS
- GLOBAL PHARMACEUTICAL VIALS MARKET, BY DRUG TYPE
- OVERVIEW
- INJECTABLE
- INJECTABLE TYPE
- LYOPHILIZED
- LIQUID
- NON-INJECTABLE
- NON-INJECTABLE TYPE
- DIAGNOSTIC
- SOLID
- GLOBAL PHARMACEUTICAL VIALS MARKET, BY APPLICATION
- OVERVIEW
- ORAL
- NASAL
- OTHERS
- GLOBAL PHARMACEUTICAL VIALS MARKET, BY END-USER
- OVERVIEW
- PHARMACEUTICAL COMPANIES
- BIOPHARMACEUTICAL COMPANIES
- CONTRACT DEVELOPMENT AND MANUFACTURING COMPANIES
- COMPOUND PHARMACY
- OTHERS
- GLOBAL PHARMACEUTICAL VIALS MARKET, BY MARKET
- OVERVIEW
- PARENTERAL
- GASTRO
- ENT
- OTHERS
- GLOBAL PHARMACEUTICAL VIALS MARKET, BY GEOGRAPHY
- OVERVIEW
- EUROPE
- GERMANY
- U.K.
- ITALY
- FRANCE
- SPAIN
- SWITZERLAND
- RUSSIA
- TURKEY
- BELGIUM
- NETHERLANDS
- REST OF EUROPE
- MIDDLE EAST & AFRICA
- U.A.E
- EGYPT
- SAUDI ARABIA
- ISRAEL
- SOUTH AFRICA
- REST OF MIDDLE EAST AND AFRICA
- ASIA-PACIFIC
- CHINA
- INDIA
- JAPAN
- SOUTH KOREA
- AUSTRALIA & NEW ZEALAND
- INDONESIA
- HONG KONG
- SINGAPORE
- MALAYSIA
- THAILAND
- PHILIPPINES
- TAIWAN
- REST OF ASIA-PACIFIC
- NORTH AMERICA
- U.S.
- CANADA
- MEXICO
- SOUTH AMERICA
- BRAZIL
- ARGENTINA
- REST OF SOUTH AFRICA
- GLOBAL PHARMACEUTICAL VIALS MARKET: COMPANY LANDSCAPE
- COMPANY SHARE ANALYSIS: GLOBAL
- COMPANY SHARE ANALYSIS: NORTH AMERICA
- COMPANY SHARE ANALYSIS: EUROPE
- COMPANY SHARE ANALYSIS: ASIA-PACIFIC
- MERGERS & ACQUISITIONS
- EXPANSIONS
- NEW PRODUCT DEVELOPMENT
- SWOT ANALYSIS
- COMPANY PROFILES
- BERRY GLOBAL INC.
- COMPANY SNAPSHOT
- REVENUE ANALYSIS
- COMPANY SHARE ANALYSIS
- PRODUCT PORTFOLIO
- RECENT UPDATE
- WEST PHARMACEUTICAL SERVICES, INC.
- COMPANY SNAPSHOT
- REVENUE ANALYSIS
- COMPANY SHARE ANALYSIS
- PRODUCT PORTFOLIO
- RECENT UPDATE
- PIRAMAL GLASS PRIVATE LIMITED (A SUBSIDIARY OF PIRAMAL ENTERPRISES LTD.)
- COMPANY SNAPSHOT
- REVENUE ANALYSIS
- COMPANY SHARE ANALYSIS
- PRODUCT PORTFOLIO
- RECENT UPDATE
- TOYOBO CO., LTD.
- COMPANY SNAPSHOT
- REVENUE ANALYSIS
- COMPANY SHARE ANALYSIS
- PRODUCT PORTFOLIO
- RECENT UPDATE
- CORNING INCORPORATED
- COMPANY SNAPSHOT
- REVENUE ANALYSIS
- COMPANY SHARE ANALYSIS
- PRODUCT PORTFOLIO
- RECENT UPDATES
- GERRESHEIMER AG
- COMPANY SNAPSHOT
- REVENUE ANALYSIS
- PRODUCT PORTFOLIO
- RECENT UPDATE
- NIPRO
- COMPANY SNAPSHOT
- REVENUE ANALYSIS
- PRODUCT PORTFOLIO
- RECENT UPDATE
- SCHOTT AG
- COMPANY SNAPSHOT
- PRODUCT PORTFOLIO
- RECENT UPDATE
- APG
- COMPANY SNAPSHOT
- PRODUCT PORTFOLIO
- RECENT UPDATE
- BORMIOLI PHARMA S.P.A.
- COMPANY SNAPSHOT
- PRODUCT PORTFOLIO
- RECENT UPDATE
- DWK LIFE SCIENCES LTD.
- COMPANY SNAPSHOT
- PRODUCT PORTFOLIO
- RECENT UPDATE
- ORIGIN PHARMA PACKAGING
- COMPANY SNAPSHOT
- PRODUCT PORTFOLIO
- RECENT UPDATE
- PACIFIC VIAL
- COMPANY SNAPSHOT
- PRODUCT PORTFOLIO
- RECENT UPDATE
- SGD PHARMA (A SUBSIDIARY OF SAINT-GOBAIN)
- COMPANY SNAPSHOT
- REVENUE ANALYSIS
- PRODUCT PORTFOLIO
- RECENT UPDATE
- STEVANATO GROUP
- COMPANY SNAPSHOT
- PRODUCT PORTFOLIO
- RECENT UPDATE
- QUESTIONNAIRE
- RELATED REPORTS
Lista de Tablas
TABLE 1 IMPORT DATA OF Product: 7010 Carboys, bottles, flasks, jars, pots, phials, ampoules and other containers, of glass, of a.....HS CODE: 7010 (USD THOUSAND)
TABLE 2 export DATA OF Product: 7010 Carboys, bottles, flasks, jars, pots, phials, ampoules and other containers, of glass, of a.....HS CODE: 7010 (USD THOUSAND)
TABLE 3 Time taken for garbage to decompose in the environment (2015)
TABLE 4 Global Pharmaceutical Vials market, BY MATERIAL, 2019-2028 (USD million)
TABLE 5 Global Pharmaceutical Vials market, BY Type, 2019-2028 (Million Units)
TABLE 6 Global Pharmaceutical Vials market, Glass BY region, 2019-2028 (USD million)
TABLE 7 Global Pharmaceutical Vials market, GLASS BY region, 2019-2028 (Million Units)
TABLE 8 Global Pharmaceutical Vials Market, Glass By Color, 2019-2028 (USD Million)
TABLE 9 Global Pharmaceutical Vials Market, Glass By Type, 2019-2028 (USD Million)
TABLE 10 Global pharmaceutical vials Market, Glass By product, 2019-2028 (USD Million)
TABLE 11 Global Pharmaceutical Vials market, Plastic BY region, 2019-2028 (USD million)
TABLE 12 Global Pharmaceutical Vials market, Plastic BY region, 2019-2028 (Million Units)
TABLE 13 Global Pharmaceutical vials Market, Plastic By Color, 2019-2028 (USD Million)
TABLE 14 Global Pharmaceutical vials Market, Plastic By TYPE, 2019-2028 (USD Million)
TABLE 15 Global Pharmaceutical Vials market, Others BY region, 2019-2028 (USD million)
TABLE 16 Global Pharmaceutical Vials market, Others BY region, 2019-2028 (Million Units)
TABLE 17 Global Pharmaceutical Vials market, BY Neck Type, 2019-2028 (USD million)
TABLE 18 Global Pharmaceutical Vials market, Screw Neck BY region, 2019-2028 (USD million)
TABLE 19 Global Pharmaceutical Vials market, Crimp Neck BY region, 2019-2028 (USD million)
TABLE 20 Global Pharmaceutical Vials market, Double Chamber BY region, 2019-2028 (USD million)
TABLE 21 Global Pharmaceutical Vials market, Flip Cap BY region, 2019-2028 (USD million)
TABLE 22 Global Pharmaceutical Vials market, Others BY region, 2019-2028 (USD million)
TABLE 23 Global Pharmaceutical Vials market, BY Cap Size, 2019-2028 (USD million)
TABLE 24 Global Pharmaceutical Vials market, 9MM BY region, 2019-2028 (USD million)
TABLE 25 Global Pharmaceutical Vials market, 8-425 MM BY region, 2019-2028 (USD million)
TABLE 26 Global Pharmaceutical Vials market, 13-425 MM BY region, 2019-2028 (USD million)
TABLE 27 Global Pharmaceutical Vials market, 15-425 MM BY region, 2019-2028 (USD million)
TABLE 28 Global Pharmaceutical Vials market, 18-400 MM BY region, 2019-2028 (USD million)
TABLE 29 Global Pharmaceutical Vials market, 22-350 MM BY region, 2019-2028 (USD million)
TABLE 30 Global Pharmaceutical Vials market, 24-400 MM BY region, 2019-2028 (USD million)
TABLE 31 Global Pharmaceutical Vials market, Others BY region, 2019-2028 (USD million)
TABLE 32 Global Pharmaceutical Vials market, BY Distribution Channel, 2019-2028 (USD million)
TABLE 33 Global Pharmaceutical Vials market, Direct Sales BY region, 2019-2028 (USD million)
TABLE 34 Global Pharmaceutical Vials market, Medical Stores/Pharmacies BY region, 2019-2028 (USD million)
TABLE 35 Global Pharmaceutical Vials market, E-Commerce BY region, 2019-2028 (USD million)
TABLE 36 Global Pharmaceutical Vials market, Others BY region, 2019-2028 (USD million)
TABLE 37 Global Pharmaceutical Vials market, BY Capacity, 2019-2028 (USD million)
TABLE 38 Global Pharmaceutical Vials market, 1 ML BY region, 2019-2028 (USD million)
TABLE 39 Global Pharmaceutical Vials market, 2 ML BY region, 2019-2028 (USD million)
TABLE 40 Global Pharmaceutical Vials market, 3 ML BY region, 2019-2028 (USD million)
TABLE 41 Global Pharmaceutical Vials market, 4 ML BY region, 2019-2028 (USD million)
TABLE 42 Global Pharmaceutical Vials market, 8 ML BY region, 2019-2028 (USD million)
TABLE 43 Global Pharmaceutical Vials market, 10 ML BY region, 2019-2028 (USD million)
TABLE 44 Global Pharmaceutical Vials market, 20 ML BY region, 2019-2028 (USD million)
TABLE 45 Global Pharmaceutical Vials market, 30 ML BY region, 2019-2028 (USD million)
TABLE 46 Global Pharmaceutical Vials market, 50 ML BY region, 2019-2028 (USD million)
TABLE 47 Global Pharmaceutical Vials market, Others BY region, 2019-2028 (USD million)
TABLE 48 Global Pharmaceutical Vials market, BY Drug Type, 2019-2028 (USD million)
TABLE 49 Global Pharmaceutical Vials market, Injectable BY region, 2019-2028 (USD million)
TABLE 50 Global Pharmaceutical Vials Market, By Injectable Type, 2019-2028 (USD Million)
TABLE 51 Global Pharmaceutical Vials market, Non-Injectable BY region, 2019-2028 (USD million)
TABLE 52 Global Pharmaceutical VialS Market, By Non-Injectable Type, 2019-2028 (USD Million)
TABLE 53 Global Pharmaceutical vials market, BY application, 2019-2028 (USD Million)
TABLE 54 Global Pharmaceutical vials market, oral BY region, 2019-2028 (USD million)
TABLE 55 Global Pharmaceutical vials market, Nasal BY region, 2019-2028 (USD million)
TABLE 56 Global Pharmaceutical vials market, Others BY region, 2019-2028 (USD million)
TABLE 57 Global Pharmaceutical vials market, BY End-User, 2019-2028 (USD Million)
TABLE 58 Global Pharmaceutical vials market, Pharmaceutical companies BY region, 2019-2028 (USD million)
TABLE 59 Global Pharmaceutical vials market, Biopharmaceutical companies BY region, 2019-2028 (USD million)
TABLE 60 Global Pharmaceutical vials market, Contract Development and Manufacturing Companies BY region, 2019-2028 (USD million)
TABLE 61 Global Pharmaceutical vials market, Compound Pharmacy BY region, 2019-2028 (USD million)
TABLE 62 Global Pharmaceutical vials market, Others BY region, 2019-2028 (USD million)
TABLE 63 Global Pharmaceutical vials market, BY market, 2019-2028 (USD million)
TABLE 64 Global Pharmaceutical vials market, Parenteral BY region, 2019-2028 (USD million)
TABLE 65 Global Pharmaceutical vials market, Gastro BY region, 2019-2028 (USD million)
TABLE 66 Global Pharmaceutical vials market, Ent BY region, 2019-2028 (USD million)
TABLE 67 Global Pharmaceutical vials market, others BY region, 2019-2028 (USD million)
TABLE 69 GLOBAL pharmaceutical vials market, By region, 2018-2027 (million Units)
TABLE 70 GLOBAL pharmaceutical vials market, By region, 2018-2027 (usd Million)
TABLE 71 EUROPE pharmaceutical vials Market, BY COUNtry ,2019-2028 (USD Million)
TABLE 72 EUROPE PHARMACEUTICAL VIALS Market, BY COUNtry ,2019-2028 (MILLION UNITS)
TABLE 73 Europe PHARMACEUTICAL VIALS Market, BY Material, 2019-2028 (USD Million)
TABLE 74 Europe PHARMACEUTICAL VIALS Market, BY material, 2019-2028 (Million units)
TABLE 75 Europe PHARMACEUTICAL VIALS Market, glass BY color, 2019-2028 (USD Million)
TABLE 76 Europe PHARMACEUTICAL VIALS Market, Glass BY type, 2019-2028 (USD Million)
TABLE 77 Europe PHARMACEUTICAL VIALS Market, glass BY product, 2019-2028 (USD Million)
TABLE 78 Europe PHARMACEUTICAL VIALS Market, Plastic BY color, 2019-2028 (USD Million)
TABLE 79 Europe PHARMACEUTICAL VIALS Market, Plastic BY type, 2019-2028 (USD Million)
TABLE 80 Europe PHARMACEUTICAL VIALS Market, BY neck type,2019-2028 (USD Million)
TABLE 81 Europe PHARMACEUTICAL VIALS Market, BY Cap size,2019-2028 (USD Million)
TABLE 82 Europe PHARMACEUTICAL VIALS Market, BY distribution channel,2019-2028 (USD Million)
TABLE 83 Europe PHARMACEUTICAL VIALS Market, BY Capacity,2019-2028 (USD Million)
TABLE 84 Europe PHARMACEUTICAL VIALS Market, BY Drug type,2019-2028 (USD Million)
TABLE 85 Europe PHARMACEUTICAL VIALS Market in Drug type, BY injectable,2019-2028 (USD Million)
TABLE 86 Europe PHARMACEUTICAL VIALS Market in Drug type, BY non-injectable,2019-2028 (USD Million)
TABLE 87 Europe PHARMACEUTICAL VIALS Market, BY application,2019-2028 (USD Million)
TABLE 88 Europe PHARMACEUTICAL VIALS Market, BY end-user,2019-2028 (USD Million)
TABLE 89 Europe PHARMACEUTICAL VIALS Market, BY Market,2019-2028 (USD Million)
TABLE 90 Germany PHARMACEUTICAL VIALS Market, BY Material, 2019-2028 (USD Million)
TABLE 91 Germany PHARMACEUTICAL VIALS Market, BY material, 2019-2028 (Million units)
TABLE 92 Germany PHARMACEUTICAL VIALS Market, glass BY color, 2019-2028 (USD Million)
TABLE 93 Germany PHARMACEUTICAL VIALS Market, Glass BY type, 2019-2028 (USD Million)
TABLE 94 Germany PHARMACEUTICAL VIALS Market, glass BY product, 2019-2028 (USD Million)
TABLE 95 Germany PHARMACEUTICAL VIALS Market, Plastic BY color, 2019-2028 (USD Million)
TABLE 96 Germany PHARMACEUTICAL VIALS Market, Plastic BY type, 2019-2028 (USD Million)
TABLE 97 Germany PHARMACEUTICAL VIALS Market, BY neck type,2019-2028 (USD Million)
TABLE 98 Germany PHARMACEUTICAL VIALS Market, BY Cap size,2019-2028 (USD Million)
TABLE 99 Germany PHARMACEUTICAL VIALS Market, BY distribution channel,2019-2028 (USD Million)
TABLE 100 Germany PHARMACEUTICAL VIALS Market, BY Capacity,2019-2028 (USD Million)
TABLE 101 Germany PHARMACEUTICAL VIALS Market, BY Drug type,2019-2028 (USD Million)
TABLE 102 Germany PHARMACEUTICAL VIALS Market in Drug type, BY injectable,2019-2028 (USD Million)
TABLE 103 Germany PHARMACEUTICAL VIALS Market in Drug type, BY non-injectable,2019-2028 (USD Million)
TABLE 104 Germany PHARMACEUTICAL VIALS Market, BY application,2019-2028 (USD Million)
TABLE 105 Germany PHARMACEUTICAL VIALS Market, BY end-user,2019-2028 (USD Million)
TABLE 106 Germany PHARMACEUTICAL VIALS Market, BY Market,2019-2028 (USD Million)
TABLE 107 U.K. PHARMACEUTICAL VIALS Market, BY Material, 2019-2028 (USD Million)
TABLE 108 U.K. PHARMACEUTICAL VIALS Market, BY material, 2019-2028 (Million units)
TABLE 109 U.K. PHARMACEUTICAL VIALS Market, glass BY color, 2019-2028 (USD Million)
TABLE 110 U.K. PHARMACEUTICAL VIALS Market, Glass BY type, 2019-2028 (USD Million)
TABLE 111 U.K. PHARMACEUTICAL VIALS Market, glass BY product, 2019-2028 (USD Million)
TABLE 112 U.K. PHARMACEUTICAL VIALS Market, Plastic BY color, 2019-2028 (USD Million)
TABLE 113 U.K. PHARMACEUTICAL VIALS Market, Plastic BY type, 2019-2028 (USD Million)
TABLE 114 U.K. PHARMACEUTICAL VIALS Market, BY neck type,2019-2028 (USD Million)
TABLE 115 U.K. PHARMACEUTICAL VIALS Market, BY Cap size,2019-2028 (USD Million)
TABLE 116 U.K. PHARMACEUTICAL VIALS Market, BY distribution channel,2019-2028 (USD Million)
TABLE 117 U.K. PHARMACEUTICAL VIALS Market, BY Capacity,2019-2028 (USD Million)
TABLE 118 U.K. PHARMACEUTICAL VIALS Market, BY Drug type,2019-2028 (USD Million)
TABLE 119 U.K. PHARMACEUTICAL VIALS Market in Drug type, BY injectable,2019-2028 (USD Million)
TABLE 120 U.K. PHARMACEUTICAL VIALS Market in Drug type, BY non-injectable,2019-2028 (USD Million)
TABLE 121 U.K. PHARMACEUTICAL VIALS Market, BY application,2019-2028 (USD Million)
TABLE 122 U.K. PHARMACEUTICAL VIALS Market, BY end-user,2019-2028 (USD Million)
TABLE 123 U.K. PHARMACEUTICAL VIALS Market, BY Market,2019-2028 (USD Million)
TABLE 124 ITALY PHARMACEUTICAL VIALS Market, BY Material, 2019-2028 (USD Million)
TABLE 125 ITALY PHARMACEUTICAL VIALS Market, BY material, 2019-2028 (Million units)
TABLE 126 ITALY PHARMACEUTICAL VIALS Market, glass BY color, 2019-2028 (USD Million)
TABLE 127 ITALY PHARMACEUTICAL VIALS Market, Glass BY type, 2019-2028 (USD Million)
TABLE 128 ITALY PHARMACEUTICAL VIALS Market, glass BY product, 2019-2028 (USD Million)
TABLE 129 ITALY PHARMACEUTICAL VIALS Market, Plastic BY color, 2019-2028 (USD Million)
TABLE 130 ITALY PHARMACEUTICAL VIALS Market, Plastic BY type, 2019-2028 (USD Million)
TABLE 131 ITALY PHARMACEUTICAL VIALS Market, BY neck type,2019-2028 (USD Million)
TABLE 132 ITALY PHARMACEUTICAL VIALS Market, BY Cap size,2019-2028 (USD Million)
TABLE 133 ITALY PHARMACEUTICAL VIALS Market, BY distribution channel,2019-2028 (USD Million)
TABLE 134 ITALY PHARMACEUTICAL VIALS Market, BY Capacity,2019-2028 (USD Million)
TABLE 135 ITALY PHARMACEUTICAL VIALS Market, BY Drug type,2019-2028 (USD Million)
TABLE 136 ITALY PHARMACEUTICAL VIALS Market in Drug type, BY injectable,2019-2028 (USD Million)
TABLE 137 ITALY PHARMACEUTICAL VIALS Market in Drug type, BY non-injectable,2019-2028 (USD Million)
TABLE 138 ITALY PHARMACEUTICAL VIALS Market, BY application,2019-2028 (USD Million)
TABLE 139 ITALY PHARMACEUTICAL VIALS Market, BY end-user,2019-2028 (USD Million)
TABLE 140 ITALY PHARMACEUTICAL VIALS Market, BY Market,2019-2028 (USD Million)
TABLE 141 FRANCE PHARMACEUTICAL VIALS Market, BY Material, 2019-2028 (USD Million)
TABLE 142 FRANCE PHARMACEUTICAL VIALS Market, BY material, 2019-2028 (Million units)
TABLE 143 FRANCE PHARMACEUTICAL VIALS Market, glass BY color, 2019-2028 (USD Million)
TABLE 144 FRANCE PHARMACEUTICAL VIALS Market, Glass BY type, 2019-2028 (USD Million)
TABLE 145 FRANCE PHARMACEUTICAL VIALS Market, glass BY product, 2019-2028 (USD Million)
TABLE 146 FRANCE PHARMACEUTICAL VIALS Market, Plastic BY color, 2019-2028 (USD Million)
TABLE 147 FRANCE PHARMACEUTICAL VIALS Market, Plastic BY type, 2019-2028 (USD Million)
TABLE 148 FRANCE PHARMACEUTICAL VIALS Market, BY neck type,2019-2028 (USD Million)
TABLE 149 FRANCE PHARMACEUTICAL VIALS Market, BY Cap size,2019-2028 (USD Million)
TABLE 150 FRANCE PHARMACEUTICAL VIALS Market, BY distribution channel,2019-2028 (USD Million)
TABLE 151 FRANCE PHARMACEUTICAL VIALS Market, BY Capacity,2019-2028 (USD Million)
TABLE 152 FRANCE PHARMACEUTICAL VIALS Market, BY Drug type,2019-2028 (USD Million)
TABLE 153 FRANCE PHARMACEUTICAL VIALS Market in Drug type, BY injectable,2019-2028 (USD Million)
TABLE 154 FRANCE PHARMACEUTICAL VIALS Market in Drug type, BY non-injectable,2019-2028 (USD Million)
TABLE 155 FRANCE PHARMACEUTICAL VIALS Market, BY application,2019-2028 (USD Million)
TABLE 156 FRANCE PHARMACEUTICAL VIALS Market, BY end-user,2019-2028 (USD Million)
TABLE 157 FRANCE PHARMACEUTICAL VIALS Market, BY Market,2019-2028 (USD Million)
TABLE 158 SPAIN PHARMACEUTICAL VIALS Market, BY Material, 2019-2028 (USD Million)
TABLE 159 SPAIN PHARMACEUTICAL VIALS Market, BY material, 2019-2028 (Million units)
TABLE 160 SPAIN PHARMACEUTICAL VIALS Market, glass BY color, 2019-2028 (USD Million)
TABLE 161 SPAIN PHARMACEUTICAL VIALS Market, Glass BY type, 2019-2028 (USD Million)
TABLE 162 SPAIN PHARMACEUTICAL VIALS Market, glass BY product, 2019-2028 (USD Million)
TABLE 163 SPAIN PHARMACEUTICAL VIALS Market, Plastic BY color, 2019-2028 (USD Million)
TABLE 164 SPAIN PHARMACEUTICAL VIALS Market, Plastic BY type, 2019-2028 (USD Million)
TABLE 165 SPAIN PHARMACEUTICAL VIALS Market, BY neck type,2019-2028 (USD Million)
TABLE 166 SPAIN PHARMACEUTICAL VIALS Market, BY Cap size,2019-2028 (USD Million)
TABLE 167 SPAIN PHARMACEUTICAL VIALS Market, BY distribution channel,2019-2028 (USD Million)
TABLE 168 SPAIN PHARMACEUTICAL VIALS Market, BY Capacity,2019-2028 (USD Million)
TABLE 169 SPAIN PHARMACEUTICAL VIALS Market, BY Drug type,2019-2028 (USD Million)
TABLE 170 SPAIN PHARMACEUTICAL VIALS Market in Drug type, BY injectable,2019-2028 (USD Million)
TABLE 171 SPAIN PHARMACEUTICAL VIALS Market in Drug type, BY non-injectable,2019-2028 (USD Million)
TABLE 172 SPAIN PHARMACEUTICAL VIALS Market, BY application,2019-2028 (USD Million)
TABLE 173 SPAIN PHARMACEUTICAL VIALS Market, BY end-user,2019-2028 (USD Million)
TABLE 174 SPAIN PHARMACEUTICAL VIALS Market, BY Market,2019-2028 (USD Million)
TABLE 175 SWITZERLAND PHARMACEUTICAL VIALS Market, BY Material, 2019-2028 (USD Million)
TABLE 176 SWITZERLAND PHARMACEUTICAL VIALS Market, BY material, 2019-2028 (Million units)
TABLE 177 SWITZERLAND PHARMACEUTICAL VIALS Market, glass BY color, 2019-2028 (USD Million)
TABLE 178 SWITZERLAND PHARMACEUTICAL VIALS Market, Glass BY type, 2019-2028 (USD Million)
TABLE 179 SWITZERLAND PHARMACEUTICAL VIALS Market, glass BY product, 2019-2028 (USD Million)
TABLE 180 SWITZERLAND PHARMACEUTICAL VIALS Market, Plastic BY color, 2019-2028 (USD Million)
TABLE 181 SWITZERLAND PHARMACEUTICAL VIALS Market, Plastic BY type, 2019-2028 (USD Million)
TABLE 182 SWITZERLAND PHARMACEUTICAL VIALS Market, BY neck type,2019-2028 (USD Million)
TABLE 183 SWITZERLAND PHARMACEUTICAL VIALS Market, BY Cap size,2019-2028 (USD Million)
TABLE 184 SWITZERLAND PHARMACEUTICAL VIALS Market, BY distribution channel,2019-2028 (USD Million)
TABLE 185 SWITZERLAND PHARMACEUTICAL VIALS Market, BY Capacity,2019-2028 (USD Million)
TABLE 186 SWITZERLAND PHARMACEUTICAL VIALS Market, BY Drug type,2019-2028 (USD Million)
TABLE 187 SWITZERLAND PHARMACEUTICAL VIALS Market in Drug type, BY injectable,2019-2028 (USD Million)
TABLE 188 SWITZERLAND PHARMACEUTICAL VIALS Market in Drug type, BY non-injectable,2019-2028 (USD Million)
TABLE 189 SWITZERLAND PHARMACEUTICAL VIALS Market, BY application,2019-2028 (USD Million)
TABLE 190 SWITZERLAND PHARMACEUTICAL VIALS Market, BY end-user,2019-2028 (USD Million)
TABLE 191 SWITZERLAND PHARMACEUTICAL VIALS Market, BY Market,2019-2028 (USD Million)
TABLE 192 RUSSIA PHARMACEUTICAL VIALS Market, BY Material, 2019-2028 (USD Million)
TABLE 193 RUSSIA PHARMACEUTICAL VIALS Market, BY material, 2019-2028 (Million units)
TABLE 194 RUSSIA PHARMACEUTICAL VIALS Market, glass BY color, 2019-2028 (USD Million)
TABLE 195 RUSSIA PHARMACEUTICAL VIALS Market, Glass BY type, 2019-2028 (USD Million)
TABLE 196 RUSSIA PHARMACEUTICAL VIALS Market, glass BY product, 2019-2028 (USD Million)
TABLE 197 RUSSIA PHARMACEUTICAL VIALS Market, Plastic BY color, 2019-2028 (USD Million)
TABLE 198 RUSSIA PHARMACEUTICAL VIALS Market, Plastic BY type, 2019-2028 (USD Million)
TABLE 199 RUSSIA PHARMACEUTICAL VIALS Market, BY neck type,2019-2028 (USD Million)
TABLE 200 RUSSIA PHARMACEUTICAL VIALS Market, BY Cap size,2019-2028 (USD Million)
TABLE 201 RUSSIA PHARMACEUTICAL VIALS Market, BY distribution channel,2019-2028 (USD Million)
TABLE 202 RUSSIA PHARMACEUTICAL VIALS Market, BY Capacity,2019-2028 (USD Million)
TABLE 203 RUSSIA PHARMACEUTICAL VIALS Market, BY Drug type,2019-2028 (USD Million)
TABLE 204 RUSSIA PHARMACEUTICAL VIALS Market in Drug type, BY injectable,2019-2028 (USD Million)
TABLE 205 RUSSIA PHARMACEUTICAL VIALS Market in Drug type, BY non-injectable,2019-2028 (USD Million)
TABLE 206 RUSSIA PHARMACEUTICAL VIALS Market, BY application,2019-2028 (USD Million)
TABLE 207 RUSSIA PHARMACEUTICAL VIALS Market, BY end-user,2019-2028 (USD Million)
TABLE 208 RUSSIA PHARMACEUTICAL VIALS Market, BY Market,2019-2028 (USD Million)
TABLE 209 TURKEY PHARMACEUTICAL VIALS Market, BY Material, 2019-2028 (USD Million)
TABLE 210 TURKEY PHARMACEUTICAL VIALS Market, BY material, 2019-2028 (Million units)
TABLE 211 TURKEY PHARMACEUTICAL VIALS Market, glass BY color, 2019-2028 (USD Million)
TABLE 212 TURKEY PHARMACEUTICAL VIALS Market, Glass BY type, 2019-2028 (USD Million)
TABLE 213 TURKEY PHARMACEUTICAL VIALS Market, glass BY product, 2019-2028 (USD Million)
TABLE 214 TURKEY PHARMACEUTICAL VIALS Market, Plastic BY color, 2019-2028 (USD Million)
TABLE 215 TURKEY PHARMACEUTICAL VIALS Market, Plastic BY type, 2019-2028 (USD Million)
TABLE 216 TURKEY PHARMACEUTICAL VIALS Market, BY neck type,2019-2028 (USD Million)
TABLE 217 TURKEY PHARMACEUTICAL VIALS Market, BY Cap size,2019-2028 (USD Million)
TABLE 218 TURKEY PHARMACEUTICAL VIALS Market, BY distribution channel,2019-2028 (USD Million)
TABLE 219 TURKEY PHARMACEUTICAL VIALS Market, BY Capacity,2019-2028 (USD Million)
TABLE 220 TURKEY PHARMACEUTICAL VIALS Market, BY Drug type,2019-2028 (USD Million)
TABLE 221 TURKEY PHARMACEUTICAL VIALS Market in Drug type, BY injectable,2019-2028 (USD Million)
TABLE 222 TURKEY PHARMACEUTICAL VIALS Market in Drug type, BY non-injectable,2019-2028 (USD Million)
TABLE 223 TURKEY PHARMACEUTICAL VIALS Market, BY application,2019-2028 (USD Million)
TABLE 224 TURKEY PHARMACEUTICAL VIALS Market, BY end-user,2019-2028 (USD Million)
TABLE 225 TURKEY PHARMACEUTICAL VIALS Market, BY Market,2019-2028 (USD Million)
TABLE 226 BELGIUM PHARMACEUTICAL VIALS Market, BY Material, 2019-2028 (USD Million)
TABLE 227 BELGIUM PHARMACEUTICAL VIALS Market, BY material, 2019-2028 (Million units)
TABLE 228 BELGIUM PHARMACEUTICAL VIALS Market, glass BY color, 2019-2028 (USD Million)
TABLE 229 BELGIUM PHARMACEUTICAL VIALS Market, Glass BY type, 2019-2028 (USD Million)
TABLE 230 BELGIUM PHARMACEUTICAL VIALS Market, glass BY product, 2019-2028 (USD Million)
TABLE 231 BELGIUM PHARMACEUTICAL VIALS Market, Plastic BY color, 2019-2028 (USD Million)
TABLE 232 BELGIUM PHARMACEUTICAL VIALS Market, Plastic BY type, 2019-2028 (USD Million)
TABLE 233 BELGIUM PHARMACEUTICAL VIALS Market, BY neck type,2019-2028 (USD Million)
TABLE 234 BELGIUM PHARMACEUTICAL VIALS Market, BY Cap size,2019-2028 (USD Million)
TABLE 235 BELGIUM PHARMACEUTICAL VIALS Market, BY distribution channel,2019-2028 (USD Million)
TABLE 236 BELGIUM PHARMACEUTICAL VIALS Market, BY Capacity,2019-2028 (USD Million)
TABLE 237 BELGIUM PHARMACEUTICAL VIALS Market, BY Drug type,2019-2028 (USD Million)
TABLE 238 BELGIUM PHARMACEUTICAL VIALS Market in Drug type, BY injectable,2019-2028 (USD Million)
TABLE 239 BELGIUM PHARMACEUTICAL VIALS Market in Drug type, BY non-injectable,2019-2028 (USD Million)
TABLE 240 BELGIUM PHARMACEUTICAL VIALS Market, BY application,2019-2028 (USD Million)
TABLE 241 BELGIUM PHARMACEUTICAL VIALS Market, BY end-user,2019-2028 (USD Million)
TABLE 242 BELGIUM PHARMACEUTICAL VIALS Market, BY Market,2019-2028 (USD Million)
TABLE 243 NETHERLANDS PHARMACEUTICAL VIALS Market, BY Material, 2019-2028 (USD Million)
TABLE 244 NETHERLANDS PHARMACEUTICAL VIALS Market, BY material, 2019-2028 (Million units)
TABLE 245 NETHERLANDS PHARMACEUTICAL VIALS Market, glass BY color, 2019-2028 (USD Million)
TABLE 246 NETHERLANDS PHARMACEUTICAL VIALS Market, Glass BY type, 2019-2028 (USD Million)
TABLE 247 NETHERLANDS PHARMACEUTICAL VIALS Market, glass BY product, 2019-2028 (USD Million)
TABLE 248 NETHERLANDS PHARMACEUTICAL VIALS Market, Plastic BY color, 2019-2028 (USD Million)
TABLE 249 NETHERLANDS PHARMACEUTICAL VIALS Market, Plastic BY type, 2019-2028 (USD Million)
TABLE 250 NETHERLANDS PHARMACEUTICAL VIALS Market, BY neck type,2019-2028 (USD Million)
TABLE 251 NETHERLANDS PHARMACEUTICAL VIALS Market, BY Cap size,2019-2028 (USD Million)
TABLE 252 NETHERLANDS PHARMACEUTICAL VIALS Market, BY distribution channel,2019-2028 (USD Million)
TABLE 253 NETHERLANDS PHARMACEUTICAL VIALS Market, BY Capacity,2019-2028 (USD Million)
TABLE 254 NETHERLANDS PHARMACEUTICAL VIALS Market, BY Drug type,2019-2028 (USD Million)
TABLE 255 NETHERLANDS PHARMACEUTICAL VIALS Market in Drug type, BY injectable,2019-2028 (USD Million)
TABLE 256 NETHERLANDS PHARMACEUTICAL VIALS Market in Drug type, BY non-injectable,2019-2028 (USD Million)
TABLE 257 NETHERLANDS PHARMACEUTICAL VIALS Market, BY application,2019-2028 (USD Million)
TABLE 258 NETHERLANDS PHARMACEUTICAL VIALS Market, BY end-user,2019-2028 (USD Million)
TABLE 259 NETHERLANDS PHARMACEUTICAL VIALS Market, BY Market,2019-2028 (USD Million)
TABLE 260 Rest of europe PHARMACEUTICAL VIALS Market, BY Material, 2019-2028 (USD Million)
TABLE 261 Rest of Europe PHARMACEUTICAL VIALS Market, BY material, 2019-2028 (Million units)
TABLE 262 MIDDLE EAST & AFRICA pharmaceutical vials Market, BY COUNtry ,2019-2028 (USD Million)
TABLE 263 MIDDLE EAST & AFRICA PHARMACEUTICAL VIALS MARKET, BY COUNTRY ,2019-2028 (Million Units)
TABLE 264 Middle east & Africa PHARMACEUTICAL VIALS Market, BY Material, 2019-2028 (USD Million)
TABLE 265 Middle east & Africa PHARMACEUTICAL VIALS Market, BY material, 2019-2028 (Million units)
TABLE 266 Middle east & Africa PHARMACEUTICAL VIALS Market, glass BY color, 2019-2028 (USD Million)
TABLE 267 Middle east & Africa PHARMACEUTICAL VIALS Market, Glass BY type, 2019-2028 (USD Million)
TABLE 268 Middle east & Africa PHARMACEUTICAL VIALS Market, glass BY product, 2019-2028 (USD Million)
TABLE 269 Middle east & Africa PHARMACEUTICAL VIALS Market, Plastic BY color, 2019-2028 (USD Million)
TABLE 270 Middle east & Africa PHARMACEUTICAL VIALS Market, Plastic BY type, 2019-2028 (USD Million)
TABLE 271 Middle east & Africa PHARMACEUTICAL VIALS Market, BY neck type,2019-2028 (USD Million)
TABLE 272 Middle east & Africa PHARMACEUTICAL VIALS Market, BY Cap size,2019-2028 (USD Million)
TABLE 273 Middle east & Africa PHARMACEUTICAL VIALS Market, BY distribution channel,2019-2028 (USD Million)
TABLE 274 Middle east & Africa PHARMACEUTICAL VIALS Market, BY Capacity,2019-2028 (USD Million)
TABLE 275 Middle east & Africa PHARMACEUTICAL VIALS Market, BY Drug type,2019-2028 (USD Million)
TABLE 276 Middle east & Africa PHARMACEUTICAL VIALS Market in Drug type, BY injectable,2019-2028 (USD Million)
TABLE 277 Middle east & Africa PHARMACEUTICAL VIALS Market in Drug type, BY non-injectable,2019-2028 (USD Million)
TABLE 278 Middle east & Africa PHARMACEUTICAL VIALS Market, BY application,2019-2028 (USD Million)
TABLE 279 Middle east & Africa PHARMACEUTICAL VIALS Market, BY end-user,2019-2028 (USD Million)
TABLE 280 Middle east & Africa PHARMACEUTICAL VIALS Market, BY Market,2019-2028 (USD Million)
TABLE 281 U.A.E PHARMACEUTICAL VIALS Market, BY Material, 2019-2028 (USD Million)
TABLE 282 U.A.E PHARMACEUTICAL VIALS Market, BY material, 2019-2028 (Million units)
TABLE 283 U.A.E PHARMACEUTICAL VIALS Market, glass BY color, 2019-2028 (USD Million)
TABLE 284 U.A.E PHARMACEUTICAL VIALS Market, Glass BY type, 2019-2028 (USD Million)
TABLE 285 U.A.E PHARMACEUTICAL VIALS Market, glass BY product, 2019-2028 (USD Million)
TABLE 286 U.A.E PHARMACEUTICAL VIALS Market, Plastic BY color, 2019-2028 (USD Million)
TABLE 287 U.A.E PHARMACEUTICAL VIALS Market, Plastic BY type, 2019-2028 (USD Million)
TABLE 288 U.A.E PHARMACEUTICAL VIALS Market, BY neck type,2019-2028 (USD Million)
TABLE 289 U.A.E PHARMACEUTICAL VIALS Market, BY Cap size,2019-2028 (USD Million)
TABLE 290 U.A.E PHARMACEUTICAL VIALS Market, BY distribution channel,2019-2028 (USD Million)
TABLE 291 U.A.E PHARMACEUTICAL VIALS Market, BY Capacity,2019-2028 (USD Million)
TABLE 292 U.A.E PHARMACEUTICAL VIALS Market, BY Drug type,2019-2028 (USD Million)
TABLE 293 U.A.E PHARMACEUTICAL VIALS Market in Drug type, BY injectable,2019-2028 (USD Million)
TABLE 294 U.A.E PHARMACEUTICAL VIALS Market in Drug type, BY non-injectable,2019-2028 (USD Million)
TABLE 295 U.A.E PHARMACEUTICAL VIALS Market, BY application,2019-2028 (USD Million)
TABLE 296 U.A.E PHARMACEUTICAL VIALS Market, BY end-user,2019-2028 (USD Million)
TABLE 297 U.A.E PHARMACEUTICAL VIALS Market, BY Market,2019-2028 (USD Million)
TABLE 298 EGYPT PHARMACEUTICAL VIALS Market, BY Material, 2019-2028 (USD Million)
TABLE 299 EGYPT PHARMACEUTICAL VIALS Market, BY material, 2019-2028 (Million units)
TABLE 300 EGYPT PHARMACEUTICAL VIALS Market, glass BY color, 2019-2028 (USD Million)
TABLE 301 EGYPT PHARMACEUTICAL VIALS Market, Glass BY type, 2019-2028 (USD Million)
TABLE 302 EGYPT PHARMACEUTICAL VIALS Market, glass BY product, 2019-2028 (USD Million)
TABLE 303 EGYPT PHARMACEUTICAL VIALS Market, Plastic BY color, 2019-2028 (USD Million)
TABLE 304 EGYPT PHARMACEUTICAL VIALS Market, Plastic BY type, 2019-2028 (USD Million)
TABLE 305 EGYPT PHARMACEUTICAL VIALS Market, BY neck type,2019-2028 (USD Million)
TABLE 306 EGYPT PHARMACEUTICAL VIALS Market, BY Cap size,2019-2028 (USD Million)
TABLE 307 EGYPT PHARMACEUTICAL VIALS Market, BY distribution channel,2019-2028 (USD Million)
TABLE 308 EGYPT PHARMACEUTICAL VIALS Market, BY Capacity,2019-2028 (USD Million)
TABLE 309 EGYPT PHARMACEUTICAL VIALS Market, BY Drug type,2019-2028 (USD Million)
TABLE 310 EGYPT PHARMACEUTICAL VIALS Market in Drug type, BY injectable,2019-2028 (USD Million)
TABLE 311 EGYPT PHARMACEUTICAL VIALS Market in Drug type, BY non-injectable,2019-2028 (USD Million)
TABLE 312 EGYPT PHARMACEUTICAL VIALS Market, BY application,2019-2028 (USD Million)
TABLE 313 EGYPT PHARMACEUTICAL VIALS Market, BY end-user,2019-2028 (USD Million)
TABLE 314 EGYPT PHARMACEUTICAL VIALS Market, BY Market,2019-2028 (USD Million)
TABLE 315 SAUDI ARABIA PHARMACEUTICAL VIALS Market, BY Material, 2019-2028 (USD Million)
TABLE 316 SAUDI ARABIA PHARMACEUTICAL VIALS Market, BY material, 2019-2028 (Million units)
TABLE 317 SAUDI ARABIA PHARMACEUTICAL VIALS Market, glass BY color, 2019-2028 (USD Million)
TABLE 318 SAUDI ARABIA PHARMACEUTICAL VIALS Market, Glass BY type, 2019-2028 (USD Million)
TABLE 319 SAUDI ARABIA PHARMACEUTICAL VIALS Market, glass BY product, 2019-2028 (USD Million)
TABLE 320 SAUDI ARABIA PHARMACEUTICAL VIALS Market, Plastic BY color, 2019-2028 (USD Million)
TABLE 321 SAUDI ARABIA PHARMACEUTICAL VIALS Market, Plastic BY type, 2019-2028 (USD Million)
TABLE 322 SAUDI ARABIA PHARMACEUTICAL VIALS Market, BY neck type,2019-2028 (USD Million)
TABLE 323 SAUDI ARABIA PHARMACEUTICAL VIALS Market, BY Cap size,2019-2028 (USD Million)
TABLE 324 SAUDI ARABIA PHARMACEUTICAL VIALS Market, BY distribution channel,2019-2028 (USD Million)
TABLE 325 SAUDI ARABIA PHARMACEUTICAL VIALS Market, BY Capacity,2019-2028 (USD Million)
TABLE 326 SAUDI ARABIA PHARMACEUTICAL VIALS Market, BY Drug type,2019-2028 (USD Million)
TABLE 327 SAUDI ARABIA PHARMACEUTICAL VIALS Market in Drug type, BY injectable,2019-2028 (USD Million)
TABLE 328 SAUDI ARABIA PHARMACEUTICAL VIALS Market in Drug type, BY non-injectable,2019-2028 (USD Million)
TABLE 329 SAUDI ARABIA PHARMACEUTICAL VIALS Market, BY application,2019-2028 (USD Million)
TABLE 330 SAUDI ARABIA PHARMACEUTICAL VIALS Market, BY end-user,2019-2028 (USD Million)
TABLE 331 SAUDI ARABIA PHARMACEUTICAL VIALS Market, BY Market,2019-2028 (USD Million)
TABLE 332 ISRAEL PHARMACEUTICAL VIALS Market, BY Material, 2019-2028 (USD Million)
TABLE 333 ISRAEL PHARMACEUTICAL VIALS Market, BY material, 2019-2028 (Million units)
TABLE 334 ISRAEL PHARMACEUTICAL VIALS Market, glass BY color, 2019-2028 (USD Million)
TABLE 335 ISRAEL PHARMACEUTICAL VIALS Market, Glass BY type, 2019-2028 (USD Million)
TABLE 336 ISRAEL PHARMACEUTICAL VIALS Market, glass BY product, 2019-2028 (USD Million)
TABLE 337 ISRAEL PHARMACEUTICAL VIALS Market, Plastic BY color, 2019-2028 (USD Million)
TABLE 338 ISRAEL PHARMACEUTICAL VIALS Market, Plastic BY type, 2019-2028 (USD Million)
TABLE 339 ISRAEL PHARMACEUTICAL VIALS Market, BY neck type,2019-2028 (USD Million)
TABLE 340 ISRAEL PHARMACEUTICAL VIALS Market, BY Cap size,2019-2028 (USD Million)
TABLE 341 ISRAEL PHARMACEUTICAL VIALS Market, BY distribution channel,2019-2028 (USD Million)
TABLE 342 ISRAEL PHARMACEUTICAL VIALS Market, BY Capacity,2019-2028 (USD Million)
TABLE 343 ISRAEL PHARMACEUTICAL VIALS Market, BY Drug type,2019-2028 (USD Million)
TABLE 344 ISRAEL PHARMACEUTICAL VIALS Market in Drug type, BY injectable,2019-2028 (USD Million)
TABLE 345 ISRAEL PHARMACEUTICAL VIALS Market in Drug type, BY non-injectable,2019-2028 (USD Million)
TABLE 346 ISRAEL PHARMACEUTICAL VIALS Market, BY application,2019-2028 (USD Million)
TABLE 347 ISRAEL PHARMACEUTICAL VIALS Market, BY end-user,2019-2028 (USD Million)
TABLE 348 ISRAEL PHARMACEUTICAL VIALS Market, BY Market,2019-2028 (USD Million)
TABLE 349 SOUTH AFRICA PHARMACEUTICAL VIALS Market, BY Material, 2019-2028 (USD Million)
TABLE 350 SOUTH AFRICA PHARMACEUTICAL VIALS Market, BY material, 2019-2028 (Million units)
TABLE 351 SOUTH AFRICA PHARMACEUTICAL VIALS Market, glass BY color, 2019-2028 (USD Million)
TABLE 352 SOUTH AFRICA PHARMACEUTICAL VIALS Market, Glass BY type, 2019-2028 (USD Million)
TABLE 353 SOUTH AFRICA PHARMACEUTICAL VIALS Market, glass BY product, 2019-2028 (USD Million)
TABLE 354 SOUTH AFRICA PHARMACEUTICAL VIALS Market, Plastic BY color, 2019-2028 (USD Million)
TABLE 355 SOUTH AFRICA PHARMACEUTICAL VIALS Market, Plastic BY type, 2019-2028 (USD Million)
TABLE 356 SOUTH AFRICA PHARMACEUTICAL VIALS Market, BY neck type,2019-2028 (USD Million)
TABLE 357 SOUTH AFRICA PHARMACEUTICAL VIALS Market, BY Cap size,2019-2028 (USD Million)
TABLE 358 SOUTH AFRICA PHARMACEUTICAL VIALS Market, BY distribution channel,2019-2028 (USD Million)
TABLE 359 SOUTH AFRICA PHARMACEUTICAL VIALS Market, BY Capacity,2019-2028 (USD Million)
TABLE 360 SOUTH AFRICA PHARMACEUTICAL VIALS Market, BY Drug type,2019-2028 (USD Million)
TABLE 361 SOUTH AFRICA PHARMACEUTICAL VIALS Market in Drug type, BY injectable,2019-2028 (USD Million)
TABLE 362 SOUTH AFRICA PHARMACEUTICAL VIALS Market in Drug type, BY non-injectable,2019-2028 (USD Million)
TABLE 363 SOUTH AFRICA PHARMACEUTICAL VIALS Market, BY application,2019-2028 (USD Million)
TABLE 364 SOUTH AFRICA PHARMACEUTICAL VIALS Market, BY end-user,2019-2028 (USD Million)
TABLE 365 SOUTH AFRICA PHARMACEUTICAL VIALS Market, BY Market,2019-2028 (USD Million)
TABLE 366 Rest of Middle East and Africa PHARMACEUTICAL VIALS Market, BY Material, 2019-2028 (USD Million)
TABLE 367 Rest of Middle East and Africa PHARMACEUTICAL VIALS Market, BY material, 2019-2028 (Million units)
TABLE 368 Asia-Pacific Pharmaceutical vials Market, BY COUNtry ,2019-2028 (USD Million)
TABLE 369 Asia-Pacific Pharmaceutical vials Market, BY COUNtry,2019-2028 (Million Units)
TABLE 370 ASIA-PACIFIC PHARMACEUTICAL VIALS Market, BY Material, 2019-2028 (USD Million)
TABLE 371 ASIA-PACIFIC PHARMACEUTICAL VIALS Market, BY material, 2019-2028 (Million units)
TABLE 372 ASIA-PACIFIC PHARMACEUTICAL VIALS Market, glass BY color, 2019-2028 (USD Million)
TABLE 373 ASIA-PACIFIC PHARMACEUTICAL VIALS Market, Glass BY type, 2019-2028 (USD Million)
TABLE 374 ASIA-PACIFIC PHARMACEUTICAL VIALS Market, glass BY product, 2019-2028 (USD Million)
TABLE 375 ASIA-PACIFIC PHARMACEUTICAL VIALS Market, Plastic BY color, 2019-2028 (USD Million)
TABLE 376 ASIA-PACIFIC PHARMACEUTICAL VIALS Market, Plastic BY type, 2019-2028 (USD Million)
TABLE 377 ASIA-PACIFIC PHARMACEUTICAL VIALS Market, BY neck type,2019-2028 (USD Million)
TABLE 378 ASIA-PACIFIC PHARMACEUTICAL VIALS Market, BY Cap size,2019-2028 (USD Million)
TABLE 379 ASIA-PACIFIC PHARMACEUTICAL VIALS Market, BY distribution channel,2019-2028 (USD Million)
TABLE 380 ASIA-PACIFIC PHARMACEUTICAL VIALS Market, BY Capacity,2019-2028 (USD Million)
TABLE 381 ASIA-PACIFIC PHARMACEUTICAL VIALS Market, BY Drug type,2019-2028 (USD Million)
TABLE 382 ASIA-PACIFIC PHARMACEUTICAL VIALS Market in Drug type, BY injectable,2019-2028 (USD Million)
TABLE 383 ASIA-PACIFIC PHARMACEUTICAL VIALS Market in Drug type, BY non-injectable,2019-2028 (USD Million)
TABLE 384 ASIA-PACIFIC PHARMACEUTICAL VIALS Market, BY application,2019-2028 (USD Million)
TABLE 385 ASIA-PACIFIC PHARMACEUTICAL VIALS Market, BY end-user,2019-2028 (USD Million)
TABLE 386 ASIA-PACIFIC PHARMACEUTICAL VIALS Market, BY Market,2019-2028 (USD Million)
TABLE 387 CHINA PHARMACEUTICAL VIALS Market, BY Material, 2019-2028 (USD Million)
TABLE 388 CHINA PHARMACEUTICAL VIALS Market, BY material, 2019-2028 (Million units)
TABLE 389 CHINA PHARMACEUTICAL VIALS Market, glass BY color, 2019-2028 (USD Million)
TABLE 390 CHINA PHARMACEUTICAL VIALS Market, Glass BY type, 2019-2028 (USD Million)
TABLE 391 CHINA PHARMACEUTICAL VIALS Market, glass BY product, 2019-2028 (USD Million)
TABLE 392 CHINA PHARMACEUTICAL VIALS Market, Plastic BY color, 2019-2028 (USD Million)
TABLE 393 CHINA PHARMACEUTICAL VIALS Market, Plastic BY type, 2019-2028 (USD Million)
TABLE 394 CHINA PHARMACEUTICAL VIALS Market, BY neck type,2019-2028 (USD Million)
TABLE 395 CHINA PHARMACEUTICAL VIALS Market, BY Cap size,2019-2028 (USD Million)
TABLE 396 CHINA PHARMACEUTICAL VIALS Market, BY distribution channel,2019-2028 (USD Million)
TABLE 397 CHINA PHARMACEUTICAL VIALS Market, BY Capacity,2019-2028 (USD Million)
TABLE 398 CHINA PHARMACEUTICAL VIALS Market, BY Drug type,2019-2028 (USD Million)
TABLE 399 CHINA PHARMACEUTICAL VIALS Market in Drug type, BY injectable,2019-2028 (USD Million)
TABLE 400 CHINA PHARMACEUTICAL VIALS Market in Drug type, BY non-injectable,2019-2028 (USD Million)
TABLE 401 CHINA PHARMACEUTICAL VIALS Market, BY application,2019-2028 (USD Million)
TABLE 402 CHINA PHARMACEUTICAL VIALS Market, BY end-user,2019-2028 (USD Million)
TABLE 403 CHINA PHARMACEUTICAL VIALS Market, BY Market,2019-2028 (USD Million)
TABLE 404 INDIA PHARMACEUTICAL VIALS Market, BY Material, 2019-2028 (USD Million)
TABLE 405 INDIA PHARMACEUTICAL VIALS Market, BY material, 2019-2028 (Million units)
TABLE 406 INDIA PHARMACEUTICAL VIALS Market, glass BY color, 2019-2028 (USD Million)
TABLE 407 INDIA PHARMACEUTICAL VIALS Market, Glass BY type, 2019-2028 (USD Million)
TABLE 408 INDIA PHARMACEUTICAL VIALS Market, glass BY product, 2019-2028 (USD Million)
TABLE 409 INDIA PHARMACEUTICAL VIALS Market, Plastic BY color, 2019-2028 (USD Million)
TABLE 410 INDIA PHARMACEUTICAL VIALS Market, Plastic BY type, 2019-2028 (USD Million)
TABLE 411 INDIA PHARMACEUTICAL VIALS Market, BY neck type,2019-2028 (USD Million)
TABLE 412 INDIA PHARMACEUTICAL VIALS Market, BY Cap size,2019-2028 (USD Million)
TABLE 413 INDIA PHARMACEUTICAL VIALS Market, BY distribution channel,2019-2028 (USD Million)
TABLE 414 INDIA PHARMACEUTICAL VIALS Market, BY Capacity,2019-2028 (USD Million)
TABLE 415 INDIA PHARMACEUTICAL VIALS Market, BY Drug type,2019-2028 (USD Million)
TABLE 416 INDIA PHARMACEUTICAL VIALS Market in Drug type, BY injectable,2019-2028 (USD Million)
TABLE 417 INDIA PHARMACEUTICAL VIALS Market in Drug type, BY non-injectable,2019-2028 (USD Million)
TABLE 418 INDIA PHARMACEUTICAL VIALS Market, BY application,2019-2028 (USD Million)
TABLE 419 INDIA PHARMACEUTICAL VIALS Market, BY end-user,2019-2028 (USD Million)
TABLE 420 INDIA PHARMACEUTICAL VIALS Market, BY Market,2019-2028 (USD Million)
TABLE 421 JAPAN PHARMACEUTICAL VIALS Market, BY Material, 2019-2028 (USD Million)
TABLE 422 JAPAN PHARMACEUTICAL VIALS Market, BY material, 2019-2028 (Million units)
TABLE 423 JAPAN PHARMACEUTICAL VIALS Market, glass BY color, 2019-2028 (USD Million)
TABLE 424 JAPAN PHARMACEUTICAL VIALS Market, Glass BY type, 2019-2028 (USD Million)
TABLE 425 JAPAN PHARMACEUTICAL VIALS Market, glass BY product, 2019-2028 (USD Million)
TABLE 426 JAPAN PHARMACEUTICAL VIALS Market, Plastic BY color, 2019-2028 (USD Million)
TABLE 427 JAPAN PHARMACEUTICAL VIALS Market, Plastic BY type, 2019-2028 (USD Million)
TABLE 428 JAPAN PHARMACEUTICAL VIALS Market, BY neck type,2019-2028 (USD Million)
TABLE 429 JAPAN PHARMACEUTICAL VIALS Market, BY Cap size,2019-2028 (USD Million)
TABLE 430 JAPAN PHARMACEUTICAL VIALS Market, BY distribution channel,2019-2028 (USD Million)
TABLE 431 JAPAN PHARMACEUTICAL VIALS Market, BY Capacity,2019-2028 (USD Million)
TABLE 432 JAPAN PHARMACEUTICAL VIALS Market, BY Drug type,2019-2028 (USD Million)
TABLE 433 JAPAN PHARMACEUTICAL VIALS Market in Drug type, BY injectable,2019-2028 (USD Million)
TABLE 434 JAPAN PHARMACEUTICAL VIALS Market in Drug type, BY non-injectable,2019-2028 (USD Million)
TABLE 435 JAPAN PHARMACEUTICAL VIALS Market, BY application,2019-2028 (USD Million)
TABLE 436 JAPAN PHARMACEUTICAL VIALS Market, BY end-user,2019-2028 (USD Million)
TABLE 437 JAPAN PHARMACEUTICAL VIALS Market, BY Market,2019-2028 (USD Million)
TABLE 438 SOUTH KOREA PHARMACEUTICAL VIALS Market, BY Material, 2019-2028 (USD Million)
TABLE 439 SOUTH KOREA PHARMACEUTICAL VIALS Market, BY material, 2019-2028 (Million units)
TABLE 440 SOUTH KOREA PHARMACEUTICAL VIALS Market, glass BY color, 2019-2028 (USD Million)
TABLE 441 SOUTH KOREA PHARMACEUTICAL VIALS Market, Glass BY type, 2019-2028 (USD Million)
TABLE 442 SOUTH KOREA PHARMACEUTICAL VIALS Market, glass BY product, 2019-2028 (USD Million)
TABLE 443 SOUTH KOREA PHARMACEUTICAL VIALS Market, Plastic BY color, 2019-2028 (USD Million)
TABLE 444 SOUTH KOREA PHARMACEUTICAL VIALS Market, Plastic BY type, 2019-2028 (USD Million)
TABLE 445 SOUTH KOREA PHARMACEUTICAL VIALS Market, BY neck type,2019-2028 (USD Million)
TABLE 446 SOUTH KOREA PHARMACEUTICAL VIALS Market, BY Cap size,2019-2028 (USD Million)
TABLE 447 SOUTH KOREA PHARMACEUTICAL VIALS Market, BY distribution channel,2019-2028 (USD Million)
TABLE 448 SOUTH KOREA PHARMACEUTICAL VIALS Market, BY Capacity,2019-2028 (USD Million)
TABLE 449 SOUTH KOREA PHARMACEUTICAL VIALS Market, BY Drug type,2019-2028 (USD Million)
TABLE 450 SOUTH KOREA PHARMACEUTICAL VIALS Market in Drug type, BY injectable,2019-2028 (USD Million)
TABLE 451 SOUTH KOREA PHARMACEUTICAL VIALS Market in Drug type, BY non-injectable,2019-2028 (USD Million)
TABLE 452 SOUTH KOREA PHARMACEUTICAL VIALS Market, BY application,2019-2028 (USD Million)
TABLE 453 SOUTH KOREA PHARMACEUTICAL VIALS Market, BY end-user,2019-2028 (USD Million)
TABLE 454 SOUTH KOREA PHARMACEUTICAL VIALS Market, BY Market,2019-2028 (USD Million)
TABLE 455 AUSTRALIA AND NEW ZEALAND PHARMACEUTICAL VIALS Market, BY Material, 2019-2028 (USD Million)
TABLE 456 AUSTRALIA AND NEW ZEALAND PHARMACEUTICAL VIALS Market, BY material, 2019-2028 (Million units)
TABLE 457 AUSTRALIA AND NEW ZEALAND PHARMACEUTICAL VIALS Market, glass BY color, 2019-2028 (USD Million)
TABLE 458 AUSTRALIA AND NEW ZEALAND PHARMACEUTICAL VIALS Market, Glass BY type, 2019-2028 (USD Million)
TABLE 459 AUSTRALIA AND NEW ZEALAND PHARMACEUTICAL VIALS Market, glass BY product, 2019-2028 (USD Million)
TABLE 460 AUSTRALIA AND NEW ZEALAND PHARMACEUTICAL VIALS Market, Plastic BY color, 2019-2028 (USD Million)
TABLE 461 AUSTRALIA AND NEW ZEALAND PHARMACEUTICAL VIALS Market, Plastic BY type, 2019-2028 (USD Million)
TABLE 462 AUSTRALIA AND NEW ZEALAND PHARMACEUTICAL VIALS Market, BY neck type,2019-2028 (USD Million)
TABLE 463 AUSTRALIA AND NEW ZEALAND PHARMACEUTICAL VIALS Market, BY Cap size,2019-2028 (USD Million)
TABLE 464 AUSTRALIA AND NEW ZEALAND PHARMACEUTICAL VIALS Market, BY distribution channel,2019-2028 (USD Million)
TABLE 465 AUSTRALIA AND NEW ZEALAND PHARMACEUTICAL VIALS Market, BY Capacity,2019-2028 (USD Million)
TABLE 466 AUSTRALIA AND NEW ZEALAND PHARMACEUTICAL VIALS Market, BY Drug type,2019-2028 (USD Million)
TABLE 467 AUSTRALIA AND NEW ZEALAND PHARMACEUTICAL VIALS Market in Drug type, BY injectable,2019-2028 (USD Million)
TABLE 468 AUSTRALIA AND NEW ZEALAND PHARMACEUTICAL VIALS Market in Drug type, BY non-injectable,2019-2028 (USD Million)
TABLE 469 AUSTRALIA AND NEW ZEALAND PHARMACEUTICAL VIALS Market, BY application,2019-2028 (USD Million)
TABLE 470 AUSTRALIA AND NEW ZEALAND PHARMACEUTICAL VIALS Market, BY end-user,2019-2028 (USD Million)
TABLE 471 AUSTRALIA AND NEW ZEALAND PHARMACEUTICAL VIALS Market, BY Market,2019-2028 (USD Million)
TABLE 472 INDONESIA PHARMACEUTICAL VIALS Market, BY Material, 2019-2028 (USD Million)
TABLE 473 INDONESIA PHARMACEUTICAL VIALS Market, BY material, 2019-2028 (Million units)
TABLE 474 INDONESIA PHARMACEUTICAL VIALS Market, glass BY color, 2019-2028 (USD Million)
TABLE 475 INDONESIA PHARMACEUTICAL VIALS Market, Glass BY type, 2019-2028 (USD Million)
TABLE 476 INDONESIA PHARMACEUTICAL VIALS Market, glass BY product, 2019-2028 (USD Million)
TABLE 477 INDONESIA PHARMACEUTICAL VIALS Market, Plastic BY color, 2019-2028 (USD Million)
TABLE 478 INDONESIA PHARMACEUTICAL VIALS Market, Plastic BY type, 2019-2028 (USD Million)
TABLE 479 INDONESIA PHARMACEUTICAL VIALS Market, BY neck type,2019-2028 (USD Million)
TABLE 480 INDONESIA PHARMACEUTICAL VIALS Market, BY Cap size,2019-2028 (USD Million)
TABLE 481 INDONESIA PHARMACEUTICAL VIALS Market, BY distribution channel,2019-2028 (USD Million)
TABLE 482 INDONESIA PHARMACEUTICAL VIALS Market, BY Capacity,2019-2028 (USD Million)
TABLE 483 INDONESIA PHARMACEUTICAL VIALS Market, BY Drug type,2019-2028 (USD Million)
TABLE 484 INDONESIA PHARMACEUTICAL VIALS Market in Drug type, BY injectable,2019-2028 (USD Million)
TABLE 485 INDONESIA PHARMACEUTICAL VIALS Market in Drug type, BY non-injectable,2019-2028 (USD Million)
TABLE 486 INDONESIA PHARMACEUTICAL VIALS Market, BY application,2019-2028 (USD Million)
TABLE 487 INDONESIA PHARMACEUTICAL VIALS Market, BY end-user,2019-2028 (USD Million)
TABLE 488 INDONESIA PHARMACEUTICAL VIALS Market, BY Market,2019-2028 (USD Million)
TABLE 489 HONG KONG PHARMACEUTICAL VIALS Market, BY Material, 2019-2028 (USD Million)
TABLE 490 HONG KONG PHARMACEUTICAL VIALS Market, BY material, 2019-2028 (Million units)
TABLE 491 HONG KONG PHARMACEUTICAL VIALS Market, glass BY color, 2019-2028 (USD Million)
TABLE 492 HONG KONG PHARMACEUTICAL VIALS Market, Glass BY type, 2019-2028 (USD Million)
TABLE 493 HONG KONG PHARMACEUTICAL VIALS Market, glass BY product, 2019-2028 (USD Million)
TABLE 494 HONG KONG PHARMACEUTICAL VIALS Market, Plastic BY color, 2019-2028 (USD Million)
TABLE 495 HONG KONG PHARMACEUTICAL VIALS Market, Plastic BY type, 2019-2028 (USD Million)
TABLE 496 HONG KONG PHARMACEUTICAL VIALS Market, BY neck type,2019-2028 (USD Million)
TABLE 497 HONG KONG PHARMACEUTICAL VIALS Market, BY Cap size,2019-2028 (USD Million)
TABLE 498 HONG KONG PHARMACEUTICAL VIALS Market, BY distribution channel,2019-2028 (USD Million)
TABLE 499 HONG KONG PHARMACEUTICAL VIALS Market, BY Capacity,2019-2028 (USD Million)
TABLE 500 HONG KONG PHARMACEUTICAL VIALS Market, BY Drug type,2019-2028 (USD Million)
TABLE 501 HONG KONG PHARMACEUTICAL VIALS Market in Drug type, BY injectable,2019-2028 (USD Million)
TABLE 502 HONG KONG PHARMACEUTICAL VIALS Market in Drug type, BY non-injectable,2019-2028 (USD Million)
TABLE 503 HONG KONG PHARMACEUTICAL VIALS Market, BY application,2019-2028 (USD Million)
TABLE 504 HONG KONG PHARMACEUTICAL VIALS Market, BY end-user,2019-2028 (USD Million)
TABLE 505 HONG KONG PHARMACEUTICAL VIALS Market, BY Market,2019-2028 (USD Million)
TABLE 506 SINGAPORE PHARMACEUTICAL VIALS Market, BY Material, 2019-2028 (USD Million)
TABLE 507 SINGAPORE PHARMACEUTICAL VIALS Market, BY material, 2019-2028 (Million units)
TABLE 508 SINGAPORE PHARMACEUTICAL VIALS Market, glass BY color, 2019-2028 (USD Million)
TABLE 509 SINGAPORE PHARMACEUTICAL VIALS Market, Glass BY type, 2019-2028 (USD Million)
TABLE 510 SINGAPORE PHARMACEUTICAL VIALS Market, glass BY product, 2019-2028 (USD Million)
TABLE 511 SINGAPORE PHARMACEUTICAL VIALS Market, Plastic BY color, 2019-2028 (USD Million)
TABLE 512 SINGAPORE PHARMACEUTICAL VIALS Market, Plastic BY type, 2019-2028 (USD Million)
TABLE 513 SINGAPORE PHARMACEUTICAL VIALS Market, BY neck type,2019-2028 (USD Million)
TABLE 514 SINGAPORE PHARMACEUTICAL VIALS Market, BY Cap size,2019-2028 (USD Million)
TABLE 515 SINGAPORE PHARMACEUTICAL VIALS Market, BY distribution channel,2019-2028 (USD Million)
TABLE 516 SINGAPORE PHARMACEUTICAL VIALS Market, BY Capacity,2019-2028 (USD Million)
TABLE 517 SINGAPORE PHARMACEUTICAL VIALS Market, BY Drug type,2019-2028 (USD Million)
TABLE 518 SINGAPORE PHARMACEUTICAL VIALS Market in Drug type, BY injectable,2019-2028 (USD Million)
TABLE 519 SINGAPORE PHARMACEUTICAL VIALS Market in Drug type, BY non-injectable,2019-2028 (USD Million)
TABLE 520 SINGAPORE PHARMACEUTICAL VIALS Market, BY application,2019-2028 (USD Million)
TABLE 521 SINGAPORE PHARMACEUTICAL VIALS Market, BY end-user,2019-2028 (USD Million)
TABLE 522 SINGAPORE PHARMACEUTICAL VIALS Market, BY Market,2019-2028 (USD Million)
TABLE 523 MALAYSIA PHARMACEUTICAL VIALS Market, BY Material, 2019-2028 (USD Million)
TABLE 524 MALAYSIA PHARMACEUTICAL VIALS Market, BY material, 2019-2028 (Million units)
TABLE 525 MALAYSIA PHARMACEUTICAL VIALS Market, glass BY color, 2019-2028 (USD Million)
TABLE 526 MALAYSIA PHARMACEUTICAL VIALS Market, Glass BY type, 2019-2028 (USD Million)
TABLE 527 MALAYSIA PHARMACEUTICAL VIALS Market, glass BY product, 2019-2028 (USD Million)
TABLE 528 MALAYSIA PHARMACEUTICAL VIALS Market, Plastic BY color, 2019-2028 (USD Million)
TABLE 529 MALAYSIA PHARMACEUTICAL VIALS Market, Plastic BY type, 2019-2028 (USD Million)
TABLE 530 MALAYSIA PHARMACEUTICAL VIALS Market, BY neck type,2019-2028 (USD Million)
TABLE 531 MALAYSIA PHARMACEUTICAL VIALS Market, BY Cap size,2019-2028 (USD Million)
TABLE 532 MALAYSIA PHARMACEUTICAL VIALS Market, BY distribution channel,2019-2028 (USD Million)
TABLE 533 MALAYSIA PHARMACEUTICAL VIALS Market, BY Capacity,2019-2028 (USD Million)
TABLE 534 MALAYSIA PHARMACEUTICAL VIALS Market, BY Drug type,2019-2028 (USD Million)
TABLE 535 MALAYSIA PHARMACEUTICAL VIALS Market in Drug type, BY injectable,2019-2028 (USD Million)
TABLE 536 MALAYSIA PHARMACEUTICAL VIALS Market in Drug type, BY non-injectable,2019-2028 (USD Million)
TABLE 537 MALAYSIA PHARMACEUTICAL VIALS Market, BY application,2019-2028 (USD Million)
TABLE 538 MALAYSIA PHARMACEUTICAL VIALS Market, BY end-user,2019-2028 (USD Million)
TABLE 539 MALAYSIA PHARMACEUTICAL VIALS Market, BY Market,2019-2028 (USD Million)
TABLE 540 THAILAND PHARMACEUTICAL VIALS Market, BY Material, 2019-2028 (USD Million)
TABLE 541 THAILAND PHARMACEUTICAL VIALS Market, BY material, 2019-2028 (Million units)
TABLE 542 THAILAND PHARMACEUTICAL VIALS Market, glass BY color, 2019-2028 (USD Million)
TABLE 543 THAILAND PHARMACEUTICAL VIALS Market, Glass BY type, 2019-2028 (USD Million)
TABLE 544 THAILAND PHARMACEUTICAL VIALS Market, glass BY product, 2019-2028 (USD Million)
TABLE 545 THAILAND PHARMACEUTICAL VIALS Market, Plastic BY color, 2019-2028 (USD Million)
TABLE 546 THAILAND PHARMACEUTICAL VIALS Market, Plastic BY type, 2019-2028 (USD Million)
TABLE 547 THAILAND PHARMACEUTICAL VIALS Market, BY neck type,2019-2028 (USD Million)
TABLE 548 THAILAND PHARMACEUTICAL VIALS Market, BY Cap size,2019-2028 (USD Million)
TABLE 549 THAILAND PHARMACEUTICAL VIALS Market, BY distribution channel,2019-2028 (USD Million)
TABLE 550 THAILAND PHARMACEUTICAL VIALS Market, BY Capacity,2019-2028 (USD Million)
TABLE 551 THAILAND PHARMACEUTICAL VIALS Market, BY Drug type,2019-2028 (USD Million)
TABLE 552 THAILAND PHARMACEUTICAL VIALS Market in Drug type, BY injectable,2019-2028 (USD Million)
TABLE 553 THAILAND PHARMACEUTICAL VIALS Market in Drug type, BY non-injectable,2019-2028 (USD Million)
TABLE 554 THAILAND PHARMACEUTICAL VIALS Market, BY application,2019-2028 (USD Million)
TABLE 555 THAILAND PHARMACEUTICAL VIALS Market, BY end-user,2019-2028 (USD Million)
TABLE 556 THAILAND PHARMACEUTICAL VIALS Market, BY Market,2019-2028 (USD Million)
TABLE 557 PHILIPPINES PHARMACEUTICAL VIALS Market, BY Material, 2019-2028 (USD Million)
TABLE 558 PHILIPPINES PHARMACEUTICAL VIALS Market, BY material, 2019-2028 (Million units)
TABLE 559 PHILIPPINES PHARMACEUTICAL VIALS Market, glass BY color, 2019-2028 (USD Million)
TABLE 560 PHILIPPINES PHARMACEUTICAL VIALS Market, Glass BY type, 2019-2028 (USD Million)
TABLE 561 PHILIPPINES PHARMACEUTICAL VIALS Market, glass BY product, 2019-2028 (USD Million)
TABLE 562 PHILIPPINES PHARMACEUTICAL VIALS Market, Plastic BY color, 2019-2028 (USD Million)
TABLE 563 PHILIPPINES PHARMACEUTICAL VIALS Market, Plastic BY type, 2019-2028 (USD Million)
TABLE 564 PHILIPPINES PHARMACEUTICAL VIALS Market, BY neck type,2019-2028 (USD Million)
TABLE 565 PHILIPPINES PHARMACEUTICAL VIALS Market, BY Cap size,2019-2028 (USD Million)
TABLE 566 PHILIPPINES PHARMACEUTICAL VIALS Market, BY distribution channel,2019-2028 (USD Million)
TABLE 567 PHILIPPINES PHARMACEUTICAL VIALS Market, BY Capacity,2019-2028 (USD Million)
TABLE 568 PHILIPPINES PHARMACEUTICAL VIALS Market, BY Drug type,2019-2028 (USD Million)
TABLE 569 PHILIPPINES PHARMACEUTICAL VIALS Market in Drug type, BY injectable,2019-2028 (USD Million)
TABLE 570 PHILIPPINES PHARMACEUTICAL VIALS Market in Drug type, BY non-injectable,2019-2028 (USD Million)
TABLE 571 PHILIPPINES PHARMACEUTICAL VIALS Market, BY application,2019-2028 (USD Million)
TABLE 572 PHILIPPINES PHARMACEUTICAL VIALS Market, BY end-user,2019-2028 (USD Million)
TABLE 573 PHILIPPINES PHARMACEUTICAL VIALS Market, BY Market,2019-2028 (USD Million)
TABLE 574 TAIWAN PHARMACEUTICAL VIALS Market, BY Material, 2019-2028 (USD Million)
TABLE 575 TAIWAN PHARMACEUTICAL VIALS Market, BY material, 2019-2028 (Million units)
TABLE 576 TAIWAN PHARMACEUTICAL VIALS Market, glass BY color, 2019-2028 (USD Million)
TABLE 577 TAIWAN PHARMACEUTICAL VIALS Market, Glass BY type, 2019-2028 (USD Million)
TABLE 578 TAIWAN PHARMACEUTICAL VIALS Market, glass BY product, 2019-2028 (USD Million)
TABLE 579 TAIWAN PHARMACEUTICAL VIALS Market, Plastic BY color, 2019-2028 (USD Million)
TABLE 580 TAIWAN PHARMACEUTICAL VIALS Market, Plastic BY type, 2019-2028 (USD Million)
TABLE 581 TAIWAN PHARMACEUTICAL VIALS Market, BY neck type,2019-2028 (USD Million)
TABLE 582 TAIWAN PHARMACEUTICAL VIALS Market, BY Cap size,2019-2028 (USD Million)
TABLE 583 TAIWAN PHARMACEUTICAL VIALS Market, BY distribution channel,2019-2028 (USD Million)
TABLE 584 TAIWAN PHARMACEUTICAL VIALS Market, BY Capacity,2019-2028 (USD Million)
TABLE 585 TAIWAN PHARMACEUTICAL VIALS Market, BY Drug type,2019-2028 (USD Million)
TABLE 586 TAIWAN PHARMACEUTICAL VIALS Market in Drug type, BY injectable,2019-2028 (USD Million)
TABLE 587 TAIWAN PHARMACEUTICAL VIALS Market in Drug type, BY non-injectable,2019-2028 (USD Million)
TABLE 588 TAIWAN PHARMACEUTICAL VIALS Market, BY application,2019-2028 (USD Million)
TABLE 589 TAIWAN PHARMACEUTICAL VIALS Market, BY end-user,2019-2028 (USD Million)
TABLE 590 TAIWAN PHARMACEUTICAL VIALS Market, BY Market,2019-2028 (USD Million)
TABLE 591 Rest of Asia-Pacific PHARMACEUTICAL VIALS Market, BY Material, 2019-2028 (USD Million)
TABLE 592 Rest of Asia-Pacific PHARMACEUTICAL VIALS Market, BY material, 2019-2028 (Million units)
TABLE 593 NORTH AMERICA pharmaceutical vials Market, BY COUNtry ,2019-2028 (USD Million)
TABLE 594 NORTH AMERICA PHARMACEUTICAL VIALS MARKET, BY COUNTRY ,2019-2028 (Million Units)
TABLE 595 North America PHARMACEUTICAL VIALS Market, BY Material, 2019-2028 (USD Million)
TABLE 596 North America PHARMACEUTICAL VIALS Market, BY material, 2019-2028 (Million units)
TABLE 597 North America PHARMACEUTICAL VIALS Market, glass BY color, 2019-2028 (USD Million)
TABLE 598 North America PHARMACEUTICAL VIALS Market, Glass BY type, 2019-2028 (USD Million)
TABLE 599 North America PHARMACEUTICAL VIALS Market, glass BY product, 2019-2028 (USD Million)
TABLE 600 North America PHARMACEUTICAL VIALS Market, Plastic BY color, 2019-2028 (USD Million)
TABLE 601 North America PHARMACEUTICAL VIALS Market, Plastic BY type, 2019-2028 (USD Million)
TABLE 602 North America PHARMACEUTICAL VIALS Market, BY neck type,2019-2028 (USD Million)
TABLE 603 North America PHARMACEUTICAL VIALS Market, BY Cap size,2019-2028 (USD Million)
TABLE 604 North America PHARMACEUTICAL VIALS Market, BY distribution channel,2019-2028 (USD Million)
TABLE 605 North America PHARMACEUTICAL VIALS Market, BY Capacity,2019-2028 (USD Million)
TABLE 606 North America PHARMACEUTICAL VIALS Market, BY Drug type,2019-2028 (USD Million)
TABLE 607 North America PHARMACEUTICAL VIALS Market in Drug type, BY injectable,2019-2028 (USD Million)
TABLE 608 North America PHARMACEUTICAL VIALS Market in Drug type, BY non-injectable,2019-2028 (USD Million)
TABLE 609 North America PHARMACEUTICAL VIALS Market, BY application,2019-2028 (USD Million)
TABLE 610 North America PHARMACEUTICAL VIALS Market, BY end-user,2019-2028 (USD Million)
TABLE 611 North America PHARMACEUTICAL VIALS Market, BY Market,2019-2028 (USD Million)
TABLE 612 U.S. PHARMACEUTICAL VIALS Market, BY Material, 2019-2028 (USD Million)
TABLE 613 U.S. PHARMACEUTICAL VIALS Market, BY material, 2019-2028 (Million units)
TABLE 614 U.S. PHARMACEUTICAL VIALS Market, glass BY color, 2019-2028 (USD Million)
TABLE 615 U.S. PHARMACEUTICAL VIALS Market, Glass BY type, 2019-2028 (USD Million)
TABLE 616 U.S. PHARMACEUTICAL VIALS Market, glass BY product, 2019-2028 (USD Million)
TABLE 617 U.S. PHARMACEUTICAL VIALS Market, Plastic BY color, 2019-2028 (USD Million)
TABLE 618 U.S. PHARMACEUTICAL VIALS Market, Plastic BY type, 2019-2028 (USD Million)
TABLE 619 U.S. PHARMACEUTICAL VIALS Market, BY neck type,2019-2028 (USD Million)
TABLE 620 U.S. PHARMACEUTICAL VIALS Market, BY Cap size,2019-2028 (USD Million)
TABLE 621 U.S. PHARMACEUTICAL VIALS Market, BY distribution channel,2019-2028 (USD Million)
TABLE 622 U.S. PHARMACEUTICAL VIALS Market, BY Capacity,2019-2028 (USD Million)
TABLE 623 U.S. PHARMACEUTICAL VIALS Market, BY Drug type,2019-2028 (USD Million)
TABLE 624 U.S. PHARMACEUTICAL VIALS Market in Drug type, BY injectable,2019-2028 (USD Million)
TABLE 625 U.S. PHARMACEUTICAL VIALS Market in Drug type, BY non-injectable,2019-2028 (USD Million)
TABLE 626 U.S. PHARMACEUTICAL VIALS Market, BY application,2019-2028 (USD Million)
TABLE 627 U.S. PHARMACEUTICAL VIALS Market, BY end-user,2019-2028 (USD Million)
TABLE 628 U.S. PHARMACEUTICAL VIALS Market, BY Market,2019-2028 (USD Million)
TABLE 629 CANADA PHARMACEUTICAL VIALS Market, BY Material, 2019-2028 (USD Million)
TABLE 630 CANADA PHARMACEUTICAL VIALS Market, BY material, 2019-2028 (Million units)
TABLE 631 CANADA PHARMACEUTICAL VIALS Market, glass BY color, 2019-2028 (USD Million)
TABLE 632 CANADA PHARMACEUTICAL VIALS Market, Glass BY type, 2019-2028 (USD Million)
TABLE 633 CANADA PHARMACEUTICAL VIALS Market, glass BY product, 2019-2028 (USD Million)
TABLE 634 CANADA PHARMACEUTICAL VIALS Market, Plastic BY color, 2019-2028 (USD Million)
TABLE 635 CANADA PHARMACEUTICAL VIALS Market, Plastic BY type, 2019-2028 (USD Million)
TABLE 636 CANADA PHARMACEUTICAL VIALS Market, BY neck type,2019-2028 (USD Million)
TABLE 637 CANADA PHARMACEUTICAL VIALS Market, BY Cap size,2019-2028 (USD Million)
TABLE 638 CANADA PHARMACEUTICAL VIALS Market, BY distribution channel,2019-2028 (USD Million)
TABLE 639 CANADA PHARMACEUTICAL VIALS Market, BY Capacity,2019-2028 (USD Million)
TABLE 640 CANADA PHARMACEUTICAL VIALS Market, BY Drug type,2019-2028 (USD Million)
TABLE 641 CANADA PHARMACEUTICAL VIALS Market in Drug type, BY injectable,2019-2028 (USD Million)
TABLE 642 CANADA PHARMACEUTICAL VIALS Market in Drug type, BY non-injectable,2019-2028 (USD Million)
TABLE 643 CANADA PHARMACEUTICAL VIALS Market, BY application,2019-2028 (USD Million)
TABLE 644 CANADA PHARMACEUTICAL VIALS Market, BY end-user,2019-2028 (USD Million)
TABLE 645 CANADA PHARMACEUTICAL VIALS Market, BY Market,2019-2028 (USD Million)
TABLE 646 MEXICO PHARMACEUTICAL VIALS Market, BY Material, 2019-2028 (USD Million)
TABLE 647 MEXICO PHARMACEUTICAL VIALS Market, BY material, 2019-2028 (Million units)
TABLE 648 MEXICO PHARMACEUTICAL VIALS Market, glass BY color, 2019-2028 (USD Million)
TABLE 649 MEXICO PHARMACEUTICAL VIALS Market, Glass BY type, 2019-2028 (USD Million)
TABLE 650 MEXICO PHARMACEUTICAL VIALS Market, glass BY product, 2019-2028 (USD Million)
TABLE 651 MEXICO PHARMACEUTICAL VIALS Market, Plastic BY color, 2019-2028 (USD Million)
TABLE 652 MEXICO PHARMACEUTICAL VIALS Market, Plastic BY type, 2019-2028 (USD Million)
TABLE 653 MEXICO PHARMACEUTICAL VIALS Market, BY neck type,2019-2028 (USD Million)
TABLE 654 MEXICO PHARMACEUTICAL VIALS Market, BY Cap size,2019-2028 (USD Million)
TABLE 655 MEXICO PHARMACEUTICAL VIALS Market, BY distribution channel,2019-2028 (USD Million)
TABLE 656 MEXICO PHARMACEUTICAL VIALS Market, BY Capacity,2019-2028 (USD Million)
TABLE 657 MEXICO PHARMACEUTICAL VIALS Market, BY Drug type,2019-2028 (USD Million)
TABLE 658 MEXICO PHARMACEUTICAL VIALS Market in Drug type, BY injectable,2019-2028 (USD Million)
TABLE 659 MEXICO PHARMACEUTICAL VIALS Market in Drug type, BY non-injectable,2019-2028 (USD Million)
TABLE 660 MEXICO PHARMACEUTICAL VIALS Market, BY application,2019-2028 (USD Million)
TABLE 661 MEXICO PHARMACEUTICAL VIALS Market, BY end-user,2019-2028 (USD Million)
TABLE 662 MEXICO PHARMACEUTICAL VIALS Market, BY Market,2019-2028 (USD Million)
TABLE 663 SOUTH AMERICA pharmaceutical vials Market, BY COUNtry ,2019-2028 (USD Million)
TABLE 664 SOUTH AMERICA PHARMACEUTICAL VIALS MARKET, BY COUNTRY ,2019-2028 (Million Units)
TABLE 665 South America PHARMACEUTICAL VIALS Market, BY Material, 2019-2028 (USD Million)
TABLE 666 South America PHARMACEUTICAL VIALS Market, BY material, 2019-2028 (Million units)
TABLE 667 South America PHARMACEUTICAL VIALS Market, glass BY color, 2019-2028 (USD Million)
TABLE 668 South America PHARMACEUTICAL VIALS Market, Glass BY type, 2019-2028 (USD Million)
TABLE 669 South America PHARMACEUTICAL VIALS Market, glass BY product, 2019-2028 (USD Million)
TABLE 670 South America PHARMACEUTICAL VIALS Market, Plastic BY color, 2019-2028 (USD Million)
TABLE 671 South America PHARMACEUTICAL VIALS Market, Plastic BY type, 2019-2028 (USD Million)
TABLE 672 South America PHARMACEUTICAL VIALS Market, BY neck type,2019-2028 (USD Million)
TABLE 673 South America PHARMACEUTICAL VIALS Market, BY Cap size,2019-2028 (USD Million)
TABLE 674 South America PHARMACEUTICAL VIALS Market, BY distribution channel,2019-2028 (USD Million)
TABLE 675 South America PHARMACEUTICAL VIALS Market, BY Capacity,2019-2028 (USD Million)
TABLE 676 South America PHARMACEUTICAL VIALS Market, BY Drug type,2019-2028 (USD Million)
TABLE 677 South America PHARMACEUTICAL VIALS Market in Drug type, BY injectable,2019-2028 (USD Million)
TABLE 678 South America PHARMACEUTICAL VIALS Market in Drug type, BY non-injectable,2019-2028 (USD Million)
TABLE 679 South America PHARMACEUTICAL VIALS Market, BY application,2019-2028 (USD Million)
TABLE 680 South America PHARMACEUTICAL VIALS Market, BY end-user,2019-2028 (USD Million)
TABLE 681 South America PHARMACEUTICAL VIALS Market, BY Market,2019-2028 (USD Million)
TABLE 682 BRAZIL PHARMACEUTICAL VIALS Market, BY Material, 2019-2028 (USD Million)
TABLE 683 BRAZIL PHARMACEUTICAL VIALS Market, BY material, 2019-2028 (Million units)
TABLE 684 BRAZIL PHARMACEUTICAL VIALS Market, glass BY color, 2019-2028 (USD Million)
TABLE 685 BRAZIL PHARMACEUTICAL VIALS Market, Glass BY type, 2019-2028 (USD Million)
TABLE 686 BRAZIL PHARMACEUTICAL VIALS Market, glass BY product, 2019-2028 (USD Million)
TABLE 687 BRAZIL PHARMACEUTICAL VIALS Market, Plastic BY color, 2019-2028 (USD Million)
TABLE 688 BRAZIL PHARMACEUTICAL VIALS Market, Plastic BY type, 2019-2028 (USD Million)
TABLE 689 BRAZIL PHARMACEUTICAL VIALS Market, BY neck type,2019-2028 (USD Million)
TABLE 690 BRAZIL PHARMACEUTICAL VIALS Market, BY Cap size,2019-2028 (USD Million)
TABLE 691 BRAZIL PHARMACEUTICAL VIALS Market, BY distribution channel,2019-2028 (USD Million)
TABLE 692 BRAZIL PHARMACEUTICAL VIALS Market, BY Capacity,2019-2028 (USD Million)
TABLE 693 BRAZIL PHARMACEUTICAL VIALS Market, BY Drug type,2019-2028 (USD Million)
TABLE 694 BRAZIL PHARMACEUTICAL VIALS Market in Drug type, BY injectable,2019-2028 (USD Million)
TABLE 695 BRAZIL PHARMACEUTICAL VIALS Market in Drug type, BY non-injectable,2019-2028 (USD Million)
TABLE 696 BRAZIL PHARMACEUTICAL VIALS Market, BY application,2019-2028 (USD Million)
TABLE 697 BRAZIL PHARMACEUTICAL VIALS Market, BY end-user,2019-2028 (USD Million)
TABLE 698 BRAZIL PHARMACEUTICAL VIALS Market, BY Market,2019-2028 (USD Million)
TABLE 699 ARGENTINA PHARMACEUTICAL VIALS Market, BY Material, 2019-2028 (USD Million)
TABLE 700 ARGENTINA PHARMACEUTICAL VIALS Market, BY material, 2019-2028 (Million units)
TABLE 701 ARGENTINA PHARMACEUTICAL VIALS Market, glass BY color, 2019-2028 (USD Million)
TABLE 702 ARGENTINA PHARMACEUTICAL VIALS Market, Glass BY type, 2019-2028 (USD Million)
TABLE 703 ARGENTINA PHARMACEUTICAL VIALS Market, glass BY product, 2019-2028 (USD Million)
TABLE 704 ARGENTINA PHARMACEUTICAL VIALS Market, Plastic BY color, 2019-2028 (USD Million)
TABLE 705 ARGENTINA PHARMACEUTICAL VIALS Market, Plastic BY type, 2019-2028 (USD Million)
TABLE 706 ARGENTINA PHARMACEUTICAL VIALS Market, BY neck type,2019-2028 (USD Million)
TABLE 707 ARGENTINA PHARMACEUTICAL VIALS Market, BY Cap size,2019-2028 (USD Million)
TABLE 708 ARGENTINA PHARMACEUTICAL VIALS Market, BY distribution channel,2019-2028 (USD Million)
TABLE 709 ARGENTINA PHARMACEUTICAL VIALS Market, BY Capacity,2019-2028 (USD Million)
TABLE 710 ARGENTINA PHARMACEUTICAL VIALS Market, BY Drug type,2019-2028 (USD Million)
TABLE 711 ARGENTINA PHARMACEUTICAL VIALS Market in Drug type, BY injectable,2019-2028 (USD Million)
TABLE 712 ARGENTINA PHARMACEUTICAL VIALS Market in Drug type, BY non-injectable,2019-2028 (USD Million)
TABLE 713 ARGENTINA PHARMACEUTICAL VIALS Market, BY application,2019-2028 (USD Million)
TABLE 714 ARGENTINA PHARMACEUTICAL VIALS Market, BY end-user,2019-2028 (USD Million)
TABLE 715 ARGENTINA PHARMACEUTICAL VIALS Market, BY Market,2019-2028 (USD Million)
TABLE 716 REST OF SOUTH AFRICA PHARMACEUTICAL VIALS Market, BY Material, 2019-2028 (USD Million)
TABLE 717 REST OF SOUTH AFRICA PHARMACEUTICAL VIALS Market, BY material, 2019-2028 (Million units)
Lista de figuras
FIGURE 1 GLOBAL PHARMACEUTICAL VIALS market: segmentation
FIGURE 2 GLOBAL PHARMACEUTICAL VIALS MARKET: data triangulation
FIGURE 3 GLOBAL PHARMACEUTICAL VIALS market: DROC ANALYSIS
FIGURE 4 GLOBAL PHARMACEUTICAL VIALS mARKET: GLOBAL VS REGIONAL MARKET ANALYSIS
FIGURE 5 GLOBAL PHARMACEUTICAL VIALS MARKET: COMPANY RESEARCH ANALYSIS
FIGURE 6 GLOBAL PHARMACEUTICAL VIALS MARKET: THE Drug Type LIFE LINE CURVE
FIGURE 7 GLOBAL PHARMACEUTICAL VIALS MARKET: INTERVIEW DEMOGRAPHICS
FIGURE 8 GLOBAL PHARMACEUTICAL VIALS Market: DBMR MARKET POSITION GRID
FIGURE 9 GLOBAL PHARMACEUTICAL VIALS Market: MARKET APPLICATION COVERAGE GRID
FIGURE 10 GLOBAL PHARMACEUTICAL VIALS MARKET: THE MARKET CHALLENGE MATRIX
FIGURE 11 Global PHARMACEUTICAL VIALS market: SEGMENTATION
FIGURE 12 north america is expected to DOMINATE THE GLOBAL PHARMACEUTICAL VIALS MARKET and IS EXPECTED TO GROW WITH THE HIGHEST CAGR IN the forecast period of 2021 to 2028
FIGURE 13 Growing demand for drug delivery devices and blister packaging is DRIVing THE GLOBAL PHARMACEUTICAL VIALS MARKET IN THE FORECAST PERIOD OF 2021 to 2028
FIGURE 14 GLASS SEGMENT is expected to account for the largest share of the Global PHARMACEUTICAL VIALS market in 2021 & 2028
FIGURE 15 north america is the fastest growing market for PHARMACEUTICAL VIALS manufacturers in the forecast period of 2021 to 2028
FIGURE 16 DRIVERS, RESTRAINTS, OPPORTUNITIES AND CHALLENGEs OF global Pharmaceutical Vials MARKET
FIGURE 17 Global Pharmaceutical Vials market: BY MATERIAL, 2020
FIGURE 18 Global Pharmaceutical Vials market: BY Neck Type, 2020
FIGURE 19 Global Pharmaceutical Vials market: BY Cap Size, 2020
FIGURE 20 Global Pharmaceutical Vials market: BY Distribution Channel, 2020
FIGURE 21 Global Pharmaceutical Vials market: BY Capacity, 2020
FIGURE 22 Global Pharmaceutical Vials market: BY Drug Type, 2020
FIGURE 23 Global Pharmaceutical vials market: BY application, 2020
FIGURE 24 Global Pharmaceutical vials market: BY End-User, 2020
FIGURE 25 Global Pharmaceutical vials market: BY market, 2020
FIGURE 26 GLOBAL pharmaceutical vials market: SNAPSHOT (2019)
FIGURE 27 GLOBAL pharmaceutical vials market: by geography (2019)
FIGURE 28 GLOBAL pharmaceutical vials market: by geography (2020 & 2027)
FIGURE 29 GLOBAL pharmaceutical vials market: by geography (2019 & 2027)
FIGURE 30 GLOBAL pharmaceutical vials market: by material (2020-2027)
FIGURE 31 EUROPE PHARMACEUTICAL VIALS MARKET: SNAPSHOT (2020)
FIGURE 32 EUROPE PHARMACEUTICAL VIALS MARKET: by COUNTRY (2020)
FIGURE 33 EUROPE PHARMACEUTICAL VIALS MARKET: by COUNTRY (2021 & 2028)
FIGURE 34 EUROPE Pharmaceutical vials MARKET: by COUNTRY (2020 & 2028)
FIGURE 35 EUROPE Pharmaceutical vials MARKET: by material (2021-2028)
FIGURE 36 MIDDLE EAST & AFRICA PHARMACEUTICAL VIALS MARKET: SNAPSHOT (2020)
FIGURE 37 MIDDLE EAST & AFRICA PHARMACEUTICAL VIALS MARKET: by COUNTRY (2020)
FIGURE 38 MIDDLE EAST & AFRICA PHARMACEUTICAL VIALS MARKET: by COUNTRY (2021 & 2028)
FIGURE 39 MIDDLE EAST & AFRICA Pharmaceutical vials MARKET: by COUNTRY (2020 & 2028)
FIGURE 40 MIDDLE EAST & AFRICA Pharmaceutical vials MARKET: by material (2021-2028)
FIGURE 41 ASIA-PACIFIC Pharmaceutical vials market: SNAPSHOT (2020)
FIGURE 42 ASIA-PACIFIC Pharmaceutical vials market: by COUNTRY (2020)
FIGURE 43 ASIA-PACIFIC Pharmaceutical vials market: by COUNTRY (2021 & 2028)
FIGURE 44 ASIA-PACIFIC Pharmaceutical vials market: by COUNTRY (2020 & 2028)
FIGURE 45 ASIA-PACIFIC Pharmaceutical vials market: by TYPE (2021-2028)
FIGURE 46 NORTH AMERICA PHARMACEUTICAL VIALS MARKET: SNAPSHOT (2020)
FIGURE 47 NORTH AMERICA PHARMACEUTICAL VIALS MARKET: by COUNTRY (2020)
FIGURE 48 NORTH AMERICA PHARMACEUTICAL VIALS MARKET: by COUNTRY (2021 & 2028)
FIGURE 49 NORTH AMERICA Pharmaceutical vials MARKET: by COUNTRY (2020 & 2028)
FIGURE 50 NORTH AMERICA Pharmaceutical vials MARKET: by material (2021-2028)
FIGURE 51 SOUTH AMERICA PHARMACEUTICAL VIALS MARKET: SNAPSHOT (2020)
FIGURE 52 SOUTH AMERICA PHARMACEUTICAL VIALS MARKET: by COUNTRY (2020)
FIGURE 53 SOUTH AMERICA PHARMACEUTICAL VIALS MARKET: by COUNTRY (2021 & 2028)
FIGURE 54 SOUTH AMERICA Pharmaceutical vials MARKET: by COUNTRY (2020 & 2028)
FIGURE 55 SOUTH AMERICA Pharmaceutical vials MARKET: by material (2021-2028)
FIGURE 56 GLOBAL PHARMACEUTICAL VIALS MARKET: company share 2020 (%)
FIGURE 57 north AMERICA PHARMACEUTICAL VIALS MARKET: COMPANY SHARE 2020 (%)
FIGURE 58 EUROPE PHARMACEUTICAL VIALS MARKET: company share 2020 (%)
FIGURE 59 Asia-Pacific PHARMACEUTICAL VIALS MARKET: COMPANY SHARE 2020 (%)
Metodología de investigación
La recopilación de datos y el análisis del año base se realizan utilizando módulos de recopilación de datos con muestras de gran tamaño. La etapa incluye la obtención de información de mercado o datos relacionados a través de varias fuentes y estrategias. Incluye el examen y la planificación de todos los datos adquiridos del pasado con antelación. Asimismo, abarca el examen de las inconsistencias de información observadas en diferentes fuentes de información. Los datos de mercado se analizan y estiman utilizando modelos estadísticos y coherentes de mercado. Además, el análisis de la participación de mercado y el análisis de tendencias clave son los principales factores de éxito en el informe de mercado. Para obtener más información, solicite una llamada de un analista o envíe su consulta.
La metodología de investigación clave utilizada por el equipo de investigación de DBMR es la triangulación de datos, que implica la extracción de datos, el análisis del impacto de las variables de datos en el mercado y la validación primaria (experto en la industria). Los modelos de datos incluyen cuadrícula de posicionamiento de proveedores, análisis de línea de tiempo de mercado, descripción general y guía del mercado, cuadrícula de posicionamiento de la empresa, análisis de patentes, análisis de precios, análisis de participación de mercado de la empresa, estándares de medición, análisis global versus regional y de participación de proveedores. Para obtener más información sobre la metodología de investigación, envíe una consulta para hablar con nuestros expertos de la industria.
Personalización disponible
Data Bridge Market Research es líder en investigación formativa avanzada. Nos enorgullecemos de brindar servicios a nuestros clientes existentes y nuevos con datos y análisis que coinciden y se adaptan a sus objetivos. El informe se puede personalizar para incluir análisis de tendencias de precios de marcas objetivo, comprensión del mercado de países adicionales (solicite la lista de países), datos de resultados de ensayos clínicos, revisión de literatura, análisis de mercado renovado y base de productos. El análisis de mercado de competidores objetivo se puede analizar desde análisis basados en tecnología hasta estrategias de cartera de mercado. Podemos agregar tantos competidores sobre los que necesite datos en el formato y estilo de datos que esté buscando. Nuestro equipo de analistas también puede proporcionarle datos en archivos de Excel sin procesar, tablas dinámicas (libro de datos) o puede ayudarlo a crear presentaciones a partir de los conjuntos de datos disponibles en el informe.

