

Global Optical Fiber Monitoring Market
Tamaño del mercado en miles de millones de dólares
Tasa de crecimiento anual compuesta (CAGR) :
% 
 USD
9.63 Billion
USD
16.52 Billion
2024
2032
USD
9.63 Billion
USD
16.52 Billion
2024
2032
| 2025 –2032 | |
| USD 9.63 Billion | |
| USD 16.52 Billion | |
| % | |
|
Mercado global de monitoreo de fibra óptica, por componente (hardware, software, servicios), técnica de monitoreo (monitoreo distribuido, monitoreo puntual), aplicación (detección y localización de fallas, monitoreo del rendimiento de la red, garantía de calidad del servicio, otros), usuario final (telecomunicaciones, petróleo y gas, sector militar y aeroespacial, BFSI, energía y servicios públicos, gobierno, otros): tendencias de la industria y pronóstico hasta 2032
Tamaño del mercado de monitoreo de fibra óptica
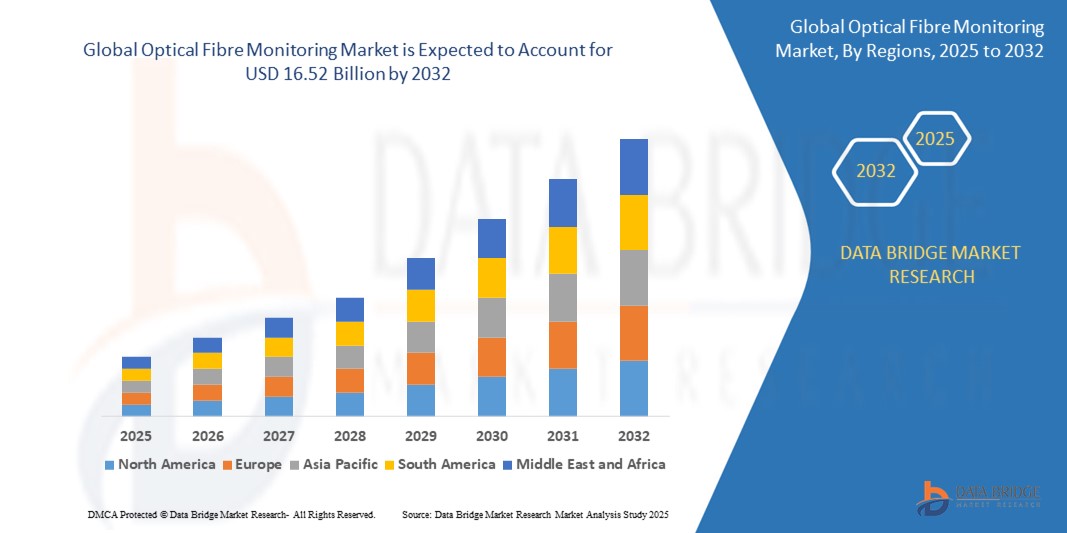
- El tamaño del mercado global de monitoreo de fibra óptica se valoró en USD 9,63 mil millones en 2025 y se espera que alcance los USD 16,52 mil millones para 2032 , con una CAGR de 8,01% durante el período de pronóstico.
- Este crecimiento se debe a la creciente demanda de conectividad de red ininterrumpida, la creciente adopción de infraestructura inteligente y la expansión global de centros de datos y redes 5G. Los sistemas de monitorización de fibra óptica garantizan la integridad y el rendimiento de los cables de fibra óptica mediante la detección de fallos en tiempo real, la evaluación de pérdidas de señal y el análisis predictivo, lo que minimiza el tiempo de inactividad y mejora la eficiencia operativa.
Análisis del mercado de monitorización de fibra óptica
- La monitorización de fibra óptica se refiere a la vigilancia continua del rendimiento del cable óptico en los sectores de telecomunicaciones, redes eléctricas e infraestructuras críticas. Estos sistemas detectan anomalías en la capa física, como curvaturas, cortes y degradación de la señal en la fibra. Con la creciente dependencia de las redes de fibra óptica para la comunicación y la transmisión de datos a alta velocidad, la localización de fallos en tiempo real y la garantía del servicio se han vuelto cruciales.
- Las tecnologías de detección distribuida de fibra, como OTDR (Reflectometría Óptica en el Dominio del Tiempo) y BOTDA (Análisis Óptico en el Dominio del Tiempo de Brillouin), están ganando terreno para la cobertura de áreas extensas y el diagnóstico proactivo de redes. Las empresas y los operadores de telecomunicaciones también están invirtiendo en plataformas de monitorización basadas en IA que predicen fallos antes de que interrumpan los servicios.
- Asia-Pacífico lidera en 2025 gracias al despliegue de fibra a gran escala, las iniciativas de ciudades inteligentes y la expansión del 5G en China, India y Corea del Sur. Norteamérica le sigue de cerca, con una sólida presencia de proveedores de nube, centros de datos a gran escala y aplicaciones críticas de seguridad de red. Europa experimenta un crecimiento estable, impulsado por la creciente demanda de fiabilidad de banda ancha y cumplimiento normativo de la seguridad de la infraestructura.
Alcance del informe y segmentación del mercado de monitoreo de fibra óptica
|
Atributos |
Perspectivas clave del mercado de monitoreo de fibra óptica |
|
Segmentos cubiertos |
|
|
Países cubiertos |
América del norte
Europa
Asia-Pacífico
Oriente Medio y África
Sudamerica
|
|
Actores clave del mercado |
|
|
Oportunidades de mercado |
|
|
Conjuntos de información de datos de valor añadido |
Además de los conocimientos sobre escenarios de mercado como valor de mercado, tasa de crecimiento, segmentación, cobertura geográfica y actores principales, los informes de mercado seleccionados por Data Bridge Market Research también incluyen análisis de importación y exportación, descripción general de la capacidad de producción, análisis del consumo de producción, análisis de tendencias de precios, escenario de cambio climático, análisis de la cadena de suministro, análisis de la cadena de valor, descripción general de materias primas/consumibles, criterios de selección de proveedores, análisis PESTLE, análisis de Porter y marco regulatorio. |
Tendencias del mercado de monitorización de fibra óptica
La monitorización de fibra impulsada por IA redefine la resiliencia de la red.
- La monitorización de la fibra óptica está cada vez más potenciada por inteligencia artificial y plataformas en la nube para detectar y predecir fallas antes de que se produzcan fallos en la red, mejorando así la fiabilidad y la satisfacción del cliente.
- La creciente demanda de módulos OTDR compactos, plug-and-play, con análisis integrados permite una implementación rápida en centros de datos, redes inteligentes y redes industriales.
- La integración con las tecnologías SDN y NFV permite la asignación dinámica de recursos y mejora la visibilidad en redes de fibra de múltiples inquilinos.
- Los paneles de control en tiempo real, el mapeo de fallas y los sistemas de alerta móviles se están convirtiendo en características estándar en las plataformas de monitoreo de próxima generación.
- Las tendencias de sustentabilidad y eficiencia energética están impulsando a los fabricantes a desarrollar sistemas de monitoreo de bajo consumo con una vida útil más larga y una huella de carbono mínima.
Dinámica del mercado de monitorización de fibra óptica
Conductor
Despliegue rápido de infraestructura de fibra y creciente demanda de automatización de redes
- A medida que los países amplían la cobertura de banda ancha, la infraestructura 5G e IoT, los operadores de telecomunicaciones y empresariales dependen de sistemas de monitoreo de fibra para gestionar la calidad y prevenir interrupciones del servicio.
- Las iniciativas de automatización de redes en todos los sectores están aprovechando herramientas de monitoreo de fibra óptica para mejorar la eficiencia operativa y reducir los costos de mantenimiento.
- Los crecientes esfuerzos de transformación digital en los sectores gubernamentales y públicos están creando una demanda de monitoreo automatizado en tiempo real.
- El aumento del tráfico en los centros de datos y la demanda de conectividad de alta velocidad están impulsando a los operadores a adoptar sistemas de monitoreo resilientes.
Restricción/Desafío
Altos costos iniciales y problemas de integración en sistemas heredados
-
La instalación de soluciones de monitoreo distribuido puede requerir una gran inversión de capital, particularmente para redes grandes y dispersas.
- Los problemas de compatibilidad con redes de fibra más antiguas, junto con la escasez de técnicos capacitados para la configuración, dificultan su adopción en algunos mercados.
- La conciencia limitada en las economías emergentes y las limitaciones presupuestarias entre las PYME restringen la implementación de soluciones avanzadas.
- La privacidad de los datos y las preocupaciones regulatorias relacionadas con el análisis del monitoreo de fibra pueden plantear desafíos de cumplimiento en sectores sensibles.
Alcance del mercado de monitorización de fibra óptica
El mercado está segmentado según el componente, la técnica de monitoreo, la aplicación y el usuario final.
• Por componente
El segmento de hardware poseerá la mayor cuota de mercado en 2025, impulsado por la creciente demanda de sensores de fibra, procesadores de señales y analizadores ópticos en campo. El hardware constituye la infraestructura central para la detección de fallos, facilitando la monitorización continua en redes de larga distancia y metropolitanas.
Se proyecta que el segmento de software crecerá a la CAGR más alta entre 2025 y 2032. Las soluciones de software para análisis en tiempo real, detección de eventos basada en IA y paneles de control basados en la nube están ganando popularidad entre los operadores de telecomunicaciones y centros de datos para mejorar la eficiencia operativa.
• Por técnica de monitoreo
El segmento de monitoreo distribuido domina el mercado, ofreciendo detección de fallas en áreas extensas mediante tecnologías OTDR y de detección acústica distribuida (DAS). Estas soluciones son las preferidas para redes de telecomunicaciones a gran escala, oleoductos e implementaciones de redes inteligentes.
Se espera que el segmento de monitoreo de puntos crezca significativamente debido a su utilidad en entornos localizados, tales como sistemas de fibra en edificios, redes de campus y configuraciones industriales de alta precisión donde localizar problemas es fundamental.
• Por aplicación
El segmento de detección y localización de fallas tendrá la mayor participación en los ingresos en 2025, ya que los proveedores de servicios priorizan la respuesta rápida y la resiliencia de la red.
Se pronostica que el segmento de monitoreo del rendimiento de la red crecerá a la CAGR más rápida durante el período de pronóstico, impulsado por el aumento en la demanda de ancho de banda y la necesidad de garantía de servicio en tiempo real en entornos de alta velocidad.
• Por el usuario final
El segmento de telecomunicaciones representará la mayor parte del mercado en 2025, debido a la gran dependencia de la infraestructura de fibra para la implementación de banda ancha y 5G.
Se prevé que el segmento de energía y servicios públicos se expandirá rápidamente debido al creciente uso de detección de fibra para el monitoreo de la integridad de tuberías, la detección de fallas en la red eléctrica y la vigilancia del perímetro.
Análisis regional del mercado de monitorización de fibra óptica
- Norteamérica domina el mercado de monitoreo de fibra óptica, con la mayor participación en ingresos en 2025. La región se beneficia de una amplia banda ancha basada en fibra, un alto tráfico de datos y una sólida infraestructura de telecomunicaciones. Las inversiones en redes inteligentes y seguridad de servicios públicos impulsan aún más la expansión del mercado.
- Europa está experimentando una fuerte adopción, impulsada por la modernización de la infraestructura digital y el creciente despliegue de fibra en aplicaciones ferroviarias y de servicios públicos. Países como Alemania y el Reino Unido son líderes en la monitorización de fibra con IA integrada.
- Asia-Pacífico es el mercado de mayor crecimiento, impulsado por amplios despliegues de fibra para 5G, ciudades inteligentes y plataformas en la nube. China, India y Japón priorizan las redes de fibra de alta velocidad con sistemas de monitorización inteligente.
- La región de Medio Oriente y África está ampliando sus capacidades de monitoreo de fibra, especialmente en los Emiratos Árabes Unidos y Arabia Saudita, donde la infraestructura urbana inteligente y la seguridad industrial son prioridades críticas.
- Sudamérica muestra un crecimiento sostenido, liderado por Brasil y Argentina, centrados en la expansión de la fibra rural y el monitoreo en tiempo real de la infraestructura pública y las redes de seguridad.
Estados Unidos
Estados Unidos lidera la contribución de América del Norte a los ingresos, impulsado por la penetración de la banda ancha de alta velocidad, la adopción de la nube y las primeras implementaciones de 5G. Las inversiones en centros de datos de hiperescala y herramientas de seguridad de fibra basadas en IA están fortaleciendo su posición en el mercado.
Porcelana
China es el mercado líder en Asia-Pacífico debido a los proyectos masivos de infraestructura de fibra, el desarrollo de ciudades inteligentes respaldado por el gobierno y la innovación local en soluciones de hardware y software de monitoreo.
Alemania
Alemania impulsa el crecimiento del mercado europeo con inversiones en la modernización de la banda ancha y aplicaciones de IoT industrial. Se están integrando herramientas de monitorización de fibra en sistemas de automatización de servicios públicos, transporte y fábricas.
India
India está experimentando un rápido crecimiento en la monitorización de fibra óptica gracias a los programas nacionales de conectividad digital y a la expansión de la banda ancha rural. Existe una alta demanda de soluciones rentables de monitorización distribuida.
Japón
Japón sigue siendo un mercado tecnológicamente avanzado, con un fuerte enfoque en la seguridad de las ciudades inteligentes, la resiliencia energética y los sistemas de alerta temprana, todos ellos basados en monitoreo basado en fibra.
Cuota de mercado de monitorización de fibra óptica
La industria de monitorización de fibra óptica está liderada principalmente por empresas bien establecidas, entre las que se incluyen:
- EXFO Inc. (Canadá)
- VIAVI Solutions Inc. (EE. UU.)
- Corporación Eléctrica Yokogawa (Japón)
- Keysight Technologies (EE. UU.)
- Corning Incorporated (EE. UU.)
- Corporación Anritsu (Japón)
- OptaSense (Reino Unido)
- Hewlett Packard Enterprise (EE. UU.)
- Osisoft LLC (EE. UU.)
- DarkPulse Inc. (EE. UU.)
Últimos avances en el mercado global de monitoreo de fibra óptica
- En abril de 2025, VIAVI Solutions lanzó un dispositivo OTDR de próxima generación con capacidades de inteligencia artificial integradas, lo que permite a los proveedores de servicios reducir el tiempo medio de reparación (MTTR) y predecir fallas de la red con anticipación.
- En marzo de 2025, EXFO firmó una alianza estratégica con Nokia para integrar diagnósticos automatizados del estado de la fibra en proyectos de infraestructura de backhaul 5G en varios países.
- En febrero de 2025, OptaSense implementó su plataforma DAS en los oleoductos y gasoductos de los EAU, proporcionando capacidades de monitoreo de intrusiones e integridad de fibra de doble capa.
- En enero de 2025, Yokogawa Electric presentó un módulo de detección óptica miniaturizado para plantas de fabricación, mejorando la seguridad y el rendimiento de la comunicación por fibra industrial.
- En diciembre de 2024, Keysight Technologies presentó un panel de análisis de fibra óptica nativo de la nube diseñado para centros de datos de hiperescala y redes de telecomunicaciones metropolitanas.
SKU-
Obtenga acceso en línea al informe sobre la primera nube de inteligencia de mercado del mundo

- Panel de análisis de datos interactivo
- Panel de análisis de empresas para oportunidades con alto potencial de crecimiento
- Acceso de analista de investigación para personalización y consultas
- Análisis de la competencia con panel interactivo
- Últimas noticias, actualizaciones y análisis de tendencias
- Aproveche el poder del análisis de referencia para un seguimiento integral de la competencia
Tabla de contenido
1 INTRODUCTION
1.1 OBJECTIVES OF THE STUDY
1.2 MARKET DEFINITION
1.3 OVERVIEW OF GLOBAL OPTICAL FIBER MONITORING MARKET
1.4 CURRENCY AND PRICING
1.5 LIMITATIONS
1.6 MARKETS COVERED
2 MARKET SEGMENTATION
2.1 MARKETS COVERED
2.2 GEOGRAPHICAL SCOPE
2.3 YEARS CONSIDERED FOR THE STUDY
2.4 RESEARCH METHODOLOGY
2.5 PRIMARY INTERVIEWS WITH KEY OPINION LEADERS
2.6 DBMR MARKET POSITION GRID
2.7 DBMR MARKET CHALLENGE MATRIX
2.8 DBMR MARKET TIMELINE
2.9 DBMR MULTIVARIATE MODEL
2.1 COMPANY SHARE ANYLYSIS
2.11 SECONDARY SOURCES
2.12 ASSUMPTIONS
3 MARKET OVERVIEW
3.1 DRIVERS
3.1.1 SHIFT FROM COPPER CABLES TO OPTICAL FIBER CABLES
3.1.2 RISE IN OPTICAL FIBER NETWORK
3.1.3 RISING CONCERN FOR LEAKAGE DETECTION IN OIL & GAS INDUSTRY
3.2 RESTRAINTS
3.2.1 UNCERTAINITY IN DEAD ZONES
3.2.2 HIGH INSTALLATION COST
3.3 OPPORTUNITIES
3.3.1 INCREASE IN GOVERNMENTS’ INITIATIVES FOR HIGH SPEED INTERNET CONNECTIVITY
3.3.2 CONTINUOUS INNOVATIONS IN OPTICAL FIBER
3.4 CHALLENGE
3.4.1 THREAT OF SUBSTITUTES OF OPTICAL FIBER NETWORKS
4 EXECUTIVE SUMMARY
5 PREMIUM INSIGHTS
6 INDUSTRY INSIDE
7 GLOBAL OPTICAL FIBER MONITORING MARKET, BY COMPONENT
7.1 OVERVIEW
7.2 HARDWARE
7.2.1 TRANSCEIVER
7.2.1.1 QSFP, QSFP14, QSFP28
7.2.1.2 SFP+ AND SFP28
7.2.1.3 SFF AND SFP
7.2.1.4 CXP
7.2.1.5 CFP2 AND CFP4
7.2.1.6 XFP
7.2.2 CABLES
7.2.2.1 SINGLE MODE CABLE
7.2.2.2 MULTI MODE CABLE
7.2.3 ACTIVE OPTICAL CABLES
7.2.4 AMPLIFIERS
7.2.4.1 ERBIUM-DOPED FIBER AMPLIFIER
7.2.4.2 SEMICONDUCTOR AMPLIFIER
7.2.4.3 RAMAN AMPLIFIER
7.2.5 CONNECTORS
7.2.5.1 LC CONNECTOR
7.2.5.2 SC CONNECTOR
7.2.5.3 ST CONNECTOR
7.2.5.4 FC CONNECTOR
7.2.5.5 MTP/MPO CONNECTOR
7.2.5.6 OTHERS
7.2.6 SPLITTERS
7.2.7 CIRCULATORS
7.2.8 FIBER OPTICS FILTER
7.2.9 OTHERS
7.3 SOFTWARE
7.4 SERVICES
8 GLOBAL OPTICAL FIBER MONITORING MARKET, BY SYSTEM
8.1 OVERVIEW
8.2 CONTROL UNITS
8.3 CENTRAL CONTROL UNITS
8.4 REGIONAL CONTROL UNITS
9 GLOBAL OPTICAL FIBER MONITORING MARKET, BY APPLICATION
9.1 OVERVIEW
9.2 FTTH
9.3 DISTRIBUTED SENSING
9.3.1 TEMPERATURE SENSING
9.3.2 ACOUSTIC SENSING
9.3.3 OTHERS
9.4 DATA CENTER
9.5 ANALYTICAL AND MEDICAL EQUIPMENT
9.6 POWER TRANSMISSION
9.7 OTHERS
10 GLOBAL OPTICAL FIBER MONITORING MARKET, BY END-USER
10.1 OVERVIEW
10.2 TELECOMMUNICATION
10.3 MILITARY AND AEROSPACE
10.4 OIL & GAS
10.5 MEDICAL
10.6 RAILWAY
10.7 BANKING AND FINANCE SERVICES AND INSURANCE (BFSI)
10.8 OTHERS
11 GLOBAL OPTICAL FIBER MONITORING MARKET, BY GEOGRAPHY
11.1 OVERVIEW
11.2 NORTH AMERICA
11.2.1 U.S.
11.2.2 CANADA
11.2.3 MEXICO
11.3 EUROPE
11.3.1 RUSSIA
11.3.2 GERMANY
11.3.3 U.K
11.3.4 FRANCE
11.3.5 SPAIN
11.3.6 SWEDEN
11.3.7 NETHERLANDS
11.3.8 SWITZERLAND
11.3.9 ITALY
11.3.10 TURKEY
11.3.11 BELGIUM
11.3.12 REST OF EUROPE
11.4 ASIA-PACIFIC
11.4.1 CHINA
11.4.2 JAPAN
11.4.3 SOUTH KOREA
11.4.4 INDIA
11.4.5 AUSTRALIA
11.4.6 SINGAPORE
11.4.7 THAILAND
11.4.8 INDONESIA
11.4.9 MALAYSIA
11.4.10 PHILIPPINES
11.4.11 REST OF ASIA-PACIFIC
11.5 SOUTH AMERICA
11.5.1 BRAZIL
11.5.2 ARGENTINA
11.5.3 REST OF SOUTH AMERICA
11.6 MIDDLE EAST AND AFRICA
11.6.1 SAUDI ARABIA
11.6.2 U.A.E
11.6.3 SOUTH AFRICA
11.6.4 ISRAEL
11.6.5 EGYPT
11.6.6 REST OF MIDDLE EAST AND AFRICA
12 GLOBAL OPTICAL FIBER MONITORING MARKET, COMPANY LANDSCAPE
12.1 COMPANY SHARE ANALYSIS: GLOBAL
12.2 COMPANY SHARE ANALYSIS: NORTH AMERICA
12.3 COMPANY SHARE ANALYSIS: EUROPE
12.4 COMPANY SHARE ANALYSIS: ASIA-PACIFIC
13 SWOT ANALYSIS
13.1 STRENGTH:-HIGH R&D EXPENDITURES
13.2 WEAKNESS: - LESS FOCUS ON OIL & GAS AND MEDICAL APPLICATIONS
13.3 OPPORTUNITY:-NORTH AMERICA AS A LEADING REGION FOR TELECOMMUNICATION SECTOR
13.4 THREAT:-WEAK ENTRY BARRIER
13.5 DATA BRIDGE MARKET RESEARCH ANALYSIS
14 COMPANY PROFILE
14.1 FUJIKURA LTD
14.1.1 COMPANY OVERVIEW
14.1.2 REVENUE ANALYSIS
14.1.3 COMPANY SHARE ANALYSIS
14.1.4 GEOGRAPHICAL PRESENCE
14.1.5 PRODUCT PORTFOLIO
14.1.6 RECENT DEVELOPMENTS
14.2 SCHLUMBERGER LIMITED
14.2.1 COMPANY OVERVIEW
14.2.2 REVENUE ANALYSIS
14.2.3 COMPANY SHARE ANALYSIS
14.2.4 GEOGRAPHICAL PRESENCE
14.2.5 PRODUCT PORTFOLIO
14.2.6 RECENT DEVELOPMENT
14.3 SUMITOMO ELECTRIC INDUSTRIES, LTD.
14.3.1 COMPANY OVERVIEW
14.3.2 REVENUE ANALYSIS
14.3.3 COMPANY SHARE ANALYSIS
14.3.4 GEOGRPHICAL PRESENCE
14.3.5 PRODUCT PORTFOLIO
14.3.6 RECENT DEVELOPMENTS
14.4 FURUKAWA ELECTRIC CO., LTD
14.4.1 COMPANY OVERVIEW
14.4.2 REVENUE ANALYSIS
14.4.3 COMPANY SHARE ANALYSIS
14.4.4 GEOGRAPHICAL PRESENCE
14.4.5 PRODUCT PORTFOLIO
14.4.6 RECENT DEVELOPMENTS
14.5 ADVA OPTICAL NETWORKING
14.5.1 COMPANY OVERVIEW
14.5.2 REVENUE ANALYSIS
14.5.3 COMPANY SHARE ANALYSIS
14.5.4 GEOGRAPHICAL PRESENCE
14.5.5 PRODUCT PORTFOLIO
14.5.6 RECENT DEVELOPMENTS
14.6 ALLIED TELESIS, INC.
14.6.1 COMPANY OVERVIEW
14.6.2 REVENUE ANALYSIS
14.6.3 GEOGRAPHICAL PRESENCE
14.6.4 PRODUCT PORTFOLIO
14.7 BANDWEAVER
14.7.1 COMPANY OVERVIEW
14.7.2 GEOGRAPHICAL PRESENCE
14.7.3 PRODUCT PORTFOLIO
14.7.4 RECENT DEVELOPMENTS
14.8 COMMVERGE SOLUTIONS
14.8.1 COMPANY OVERVIEW
14.8.2 GEOGRAPHICAL PRESENCE
14.8.3 PRODUCT PORTFOLIO
14.8.4 RECENT DEVELOPMENT
14.9 DSIT SOLUTIONS LTD.
14.9.1 COMPANY OVERVIEW
14.9.2 PRODUCT PORTFOLIO
14.9.3 RECENT DEVELOPMENT
14.1 EXFO INC.
14.10.1 COMPANY OVERVIEW
14.10.2 REVENUE ANALYSIS
14.10.3 GEOGRAPHICAL PRESENCE
14.10.4 PRODUCT PORTFOLIO
14.10.5 RECENT DEVELOPMENTS
14.11 FIBERNET
14.11.1 COMPANY OVERVIEW
14.11.2 PRODUCT PORTFOLIO
14.11.3 RECENT DEVELOPMENT
14.12 FINISAR CORPORATION
14.12.1 COMPANY OVERVIEW
14.12.2 REVENUE ANALYSIS
14.12.3 GEOGRAPHICAL PRESENCE
14.12.4 PRODUCT PORTFOLIO
14.12.5 RECENT DEVELOPMENTS
14.13 HALLIBURTON
14.13.1 COMPANY OVERVIEW
14.13.2 REVENUE ANALYSIS
14.13.3 GEOGRAPHICAL PRESENCE
14.13.4 PRODUCT PORTFOLIO
14.13.5 RECENT DEVELOPMENT
14.14 HBM
14.14.1 COMPANY OVERVIEW
14.14.2 GEOGRAPHICAL PRESENCE
14.14.3 PRODUCT PORTFOLIO
14.14.4 RECENT DEVELOPMENTS
14.15 LANCIER MONITORING GMBH
14.15.1 COMPANY OVERVIEW
14.15.2 GEOGRAPHICAL PRESENCE
14.15.3 PRODUCT PORTFOLIO
14.15.4 RECENT DEVELOPMENTS
14.16 LUMENTUM OPERATIONS LLC
14.16.1 COMPANY OVERVIEW
14.16.2 REVENUE ANALYSIS
14.16.3 GEOGRAPHICAL PRESENCE
14.16.4 PRODUCT PORTFOLIO
14.16.5 RECENT DEVELOPMENTS
14.17 M2 OPTICS INC.
14.17.1 COMPANY OVERVIEW
14.17.2 GEOGRAPHICAL PRESENCE
14.17.3 PRODUCT PORTFOLIO
14.17.4 RECENT DEVELOPMENTS
14.18 NBG HOLDING GMBH
14.18.1 COMPANY OVERVIEW
14.18.2 PRODUCT PORTFOLIO
14.18.3 RECENT DEVELOPMENTS
14.19 NEOPHOTONICS CORPORATION
14.19.1 COMPANY OVERVIEW
14.19.2 REVENUE ANALYSIS
14.19.3 GEOGRAPHICAL PRESENCE
14.19.4 PRODUCT PORTFOLIO
14.19.5 RECENT DEVELOPMENTS
14.2 OMNISENS
14.20.1 COMPANY OVERVIEW
14.20.2 GEOGRAPHICAL PRESENCE
14.20.3 PRODUCT PORTFOLIO
14.20.4 RECENT DEVELOPMENTS
14.21 QUALITROL COMPANY LLC
14.21.1 COMPANY OVERVIEW
14.21.2 GEOGRPHICAL PRESENCE
14.21.3 PRODUCT PORTFOLIO
14.21.4 RECENT DEVELOPMENT
14.22 VIAVI SOLUTIONS INC.
14.22.1 COMPANY OVERVIEW
14.22.2 REVENUE ANALYSIS
14.22.3 GEOGRAPHICAL PRESENCE
14.22.4 PRODUCT PORTFOLIO
14.22.5 RECENT DEVELOPMENTS
14.23 ZAYO GROUP, LLC
14.23.1 COMPANY OVERVIEW
14.23.2 REVENUE ANALYSIS
14.23.3 GEOGRAPHICAL PRESENCE
14.23.4 PRODUCT PORTFOLIO
14.23.5 RECENT DEVELOPMENTS
15 QUESTIONNAIRE
16 CONCLUSION
17 REFERENCES
18 RELATED REPORTS
Lista de Tablas
TABLE 1 INSTALLATION COSTS OF VARIOUS PROJECTS BY U.S. DEPARTMENT OF TRANSPORTATION RESEARCH AND INNOVATIVE TECHNOLOGY
ADMINISTRATION (RITA) 61
TABLE 2 INITIATIVES BY VARIOUS GOVERNMENTS FOR ADOPTION OF OPTICAL FIBER
TABLE 3 THE DIFFERENCE BETWEEN THE VARIOUS SUBSTITUTES AND THEIR PROS AND CONS ARE AS FOLLOWING:
TABLE 4 GLOBAL OPTICAL FIBER MONITORING MARKET, BY COMPONENT, 2017-2026 (USD MILLION)
TABLE 5 GLOBAL HARDWARE IN OPTICAL FIBER MONITORING MARKET, BY REGION, 2017-2026 (USD MILLION)
TABLE 6 GLOBAL HARDWARE IN OPTICAL FIBER MONITORING MARKET, BY TYPE, 2017-2026 (USD MILLION)
TABLE 7 GLOBAL TRANSCEIVER IN OPTICAL FIBER MONITORING MARKET, BY REGION, 2017-2026 (USD MILLION)
TABLE 8 GLOBAL TRANSCEIVER IN OPTICAL FIBER MONITORING MARKET, BY TYPE, 2017-2026 (USD MILLION)
TABLE 9 GLOBAL QSFP, QSFP14, QSFP28 IN TRANSCEIVER FOR OPTICAL FIBER MONITORING MARKET, BY REGION, 2017-2026 (USD MILLION)
TABLE 10 GLOBAL SFP+ AND SFP28 IN TRANSCEIVER FOR OPTICAL FIBER MONITORING MARKET, BY REGION, 2017-2026 (USD MILLION)
TABLE 11 GLOBAL SFF AND SFP IN TRANSCEIVER FOR OPTICAL FIBER MONITORING MARKET, BY REGION, 2017-2026 (USD MILLION)
TABLE 12 GLOBAL CXP IN TRANSCEIVER FOR OPTICAL FIBER MONITORING MARKET, BY REGION, 2017-2026 (USD MILLION)
TABLE 13 GLOBAL CFP2 AND CFP4 IN TRANSCEIVER FOR OPTICAL FIBER MONITORING MARKET, BY REGION, 2017-2026 (USD MILLION)
TABLE 14 GLOBAL XFP IN TRANSCEIVER FOR OPTICAL FIBER MONITORING MARKET, BY REGION, 2017-2026 (USD MILLION)
TABLE 15 GLOBAL CABLES IN OPTICAL FIBER MONITORING MARKET, BY REGION, 2017-2026 (USD MILLION)
TABLE 16 GLOBAL CABLES IN OPTICAL FIBER MONITORING MARKET, BY TYPE, 2017-2026 (USD MILLION)
TABLE 17 GLOBAL SINGLE MODE CABLE IN OPTICAL FIBER MONITORING MARKET, BY REGION, 2017-2026 (USD MILLION)
TABLE 18 GLOBAL MULTI MODE CABLE IN OPTICAL FIBER MONITORING MARKET, BY REGION, 2017-2026 (USD MILLION)
TABLE 19 GLOBAL ACTIVE OPTICAL CABLES IN OPTICAL FIBER MONITORING MARKET, BY REGION, 2017-2026 (USD MILLION)
TABLE 20 GLOBAL AMPLIFIERS IN OPTICAL FIBER MONITORING MARKET, BY REGION, 2017-2026 (USD MILLION)
TABLE 21 GLOBAL AMPLIFIERS IN OPTICAL FIBER MONITORING MARKET, BY TYPE, 2017-2026 (USD MILLION)
TABLE 22 GLOBAL ERBIUM-DOPED FIBER AMPLIFIER IN OPTICAL FIBER MONITORING MARKET, BY REGION, 2017-2026 (USD MILLION)
TABLE 23 GLOBAL SEMICONDUCTOR AMPLIFIER IN OPTICAL FIBER MONITORING MARKET, BY REGION, 2017-2026 (USD MILLION)
TABLE 24 GLOBAL RAMAN AMPLIFIER IN OPTICAL FIBER MONITORING MARKET, BY REGION, 2017-2026 (USD MILLION)
TABLE 25 GLOBAL CONNECTORS IN OPTICAL FIBER MONITORING MARKET, BY REGION, 2017-2026 (USD MILLION)
TABLE 26 GLOBAL CONNECTORS IN OPTICAL FIBER MONITORING MARKET, BY TYPE, 2017-2026 (USD MILLION)
TABLE 27 GLOBAL LC CONNECTOR IN OPTICAL FIBER MONITORING MARKET, BY REGION, 2017-2026 (USD MILLION)
TABLE 28 GLOBAL SC CONNECTOR IN OPTICAL FIBER MONITORING MARKET, BY REGION, 2017-2026 (USD MILLION)
TABLE 29 GLOBAL ST CONNECTOR IN OPTICAL FIBER MONITORING MARKET, BY REGION, 2017-2026 (USD MILLION)
TABLE 30 GLOBAL FC CONNECTOR IN OPTICAL FIBER MONITORING MARKET, BY REGION, 2017-2026 (USD MILLION)
TABLE 31 GLOBAL MTP/MPO CONNECTOR IN OPTICAL FIBER MONITORING MARKET, BY REGION, 2017-2026 (USD MILLION)
TABLE 32 GLOBAL OTHERS CONNECTOR IN OPTICAL FIBER MONITORING MARKET, BY REGION, 2017-2026 (USD MILLION)
TABLE 33 GLOBAL SPLITTERRS IN OPTICAL FIBER MONITORING MARKET, BY REGION, 2017-2026 (USD MILLION)
TABLE 34 GLOBAL CIRCULATORS IN OPTICAL FIBER MONITORING MARKET, BY REGION, 2017-2026 (USD MILLION)
TABLE 35 GLOBAL FIBER OPTICS FILTER IN OPTICAL FIBER MONITORING MARKET, BY REGION, 2017-2026 (USD MILLION)
TABLE 36 GLOBAL OTHERS IN OPTICAL FIBER MONITORING MARKET, BY REGION, 2017-2026 (USD MILLION)
TABLE 37 GLOBAL SOFTWARE IN OPTICAL FIBER MONITORING MARKET, BY REGION, 2017-2026 (USD MILLION)
TABLE 38 GLOBAL SERVICES IN OPTICAL FIBER MONITORING MARKET, BY REGION, 2017-2026 (USD MILLION)
TABLE 39 GLOBAL OPTICAL FIBER MONITORING MARKET, BY SYSTEM, 2017-2026 (USD MILLION)
TABLE 40 GLOBAL CONTROL UNITS IN OPTICAL FIBER MONITORING MARKET, BY REGION, 2017-2026 (USD MILLION)
TABLE 41 GLOBAL CENTRAL CONTROL UNITS IN OPTICAL FIBER MONITORING MARKET, BY REGION, 2017-2026 (USD MILLION)
TABLE 42 GLOBAL REGIONAL CONTROL UNITS IN GLOBAL OPTICAL FIBER MONITORING MARKET, BY REGION, 2017-2026 (USD MILLION)
TABLE 43 GLOBAL OPTICAL FIBER MONITORING MARKET, BY APPLICATION, 2017-2026 (USD MILLION)
TABLE 44 GLOBAL FTTH IN OPTICAL FIBER MONITORING MARKET, BY REGION, 2017-2026 (USD MILLION)
TABLE 45 GLOBAL DISTRIBUTED SENSING IN OPTICAL FIBER MONITORING MARKET, BY REGION, 2017-2026 (USD MILLION)
TABLE 46 GLOBAL DISTRIBUTED SENSING IN OPTICAL FIBER MONITORING MARKET, BY TYPE, 2017-2026 (USD MILLION)
TABLE 47 GLOBAL TEMPERATURE SENSING IN OPTICAL FIBER MONITORING MARKET, BY REGION, 2017-2026 (USD MILLION)
TABLE 48 GLOBAL ACOUSTIC SENSING IN OPTICAL FIBER MONITORING MARKET, BY REGION, 2017-2026 (USD MILLION)
TABLE 49 GLOBAL OTHERS IN OPTICAL FIBER MONITORING MARKET, BY REGION, 2017-2026 (USD MILLION)
TABLE 50 GLOBAL DATA CENTER IN OPTICAL FIBER MONITORING MARKET, BY REGION, 2017-2026, (USD MILLION)
TABLE 51 GLOBAL ANALYTICAL AND MEDICAL EQUIPMENT IN OPTICAL FIBER MONITORING MARKET, BY REGION, 2017-2026 (USD MILLION)
TABLE 52 GLOBAL POWER TRANSMISSION IN GLOBAL OPTICAL FIBER MONITORING MARKET, BY REGION, 2017-2026 (USD MILLION)
TABLE 53 GLOBAL OTHERS IN OPTICAL FIBER MONITORING MARKET, BY REGION, 2017-2026 (USD MILLION)
TABLE 54 GLOBAL OPTICAL FIBER MONITORING MARKET, BY END-USER, 2017-2026 (USD MILLION)
TABLE 55 GLOBAL TELECOMMUNICATION IN OPTICAL FIBER MONITORING MARKET, BY REGION, 2017-2026 (USD MILLION)
TABLE 56 GLOBAL MILITARY AND AEROSPACE IN OPTICAL FIBER MONITORING MARKET, BY REGION, 2017-2026 (USD MILLION)
TABLE 57 GLOBAL OIL & GAS IN OPTICAL FIBER MONITORING MARKET, BY REGION, 2017-2026 (USD MILLION)
TABLE 58 GLOBAL MEDICAL IN GLOBAL OPTICAL FIBER MONITORING MARKET, BY REGION, 2017-2026 (USD MILLION)
TABLE 59 GLOBAL RAILWAY IN OPTICAL FIBER MONITORING MARKET, BY REGION, 2017-2026 (USD MILLION)
TABLE 60 GLOBAL BANKING AND FINANCE SERVICES AND INSURANCE (BFSI) IN OPTICAL FIBER MONITORING MARKET, BY REGION, 2017-2026 (USD MILLION)
TABLE 61 GLOBAL OTHERS IN OPTICAL FIBER MONITORING MARKET, BY REGION, 2017-2026 (USD MILLION)
TABLE 62 GLOBAL OPTICAL FIBER MONITORING MARKET, BY GEOGRAPHY, 2017-2026 (USD MILLION)
TABLE 63 NORTH AMERICA OPTICAL FIBER MONITORING MARKET, BY COUNTRY, 2017-2026 (USD MILLION)
TABLE 64 NORTH AMERICA OPTICAL FIBER MONITORING MARKET, BY COMPONENT, 2017-2026 (USD MILLION)
TABLE 65 NORTH AMERICA HARDWARE IN OPTICAL FIBER MONITORING MARKET, BY TYPE, 2017-2026 (USD MILLION)
TABLE 66 NORTH AMERICA CABLES IN OPTICAL FIBER MONITORING MARKET, BY TYPE, 2017-2026 (USD MILLION)
TABLE 67 NORTH AMERICA TRANSCEIVER IN OPTICAL FIBER MONITORING MARKET, BY TYPE, 2017-2026 (USD MILLION)
TABLE 68 NORTH AMERICA AMPLIFIERS IN OPTICAL FIBER MONITORING MARKET, BY TYPE, 2017-2026 (USD MILLION)
TABLE 69 NORTH AMERICA CONNECTORS IN OPTICAL FIBER MONITORING MARKET, BY TYPE, 2017-2026 (USD MILLION)
TABLE 70 NORTH AMERICA OPTICAL FIBER MONITORING MARKET, BY SYSTEM, 2017-2026 (USD MILLION)
TABLE 71 NORTH AMERICA OPTICAL FIBER MONITORING MARKET, BY APPLICATION, 2017-2026 (USD MILLION)
TABLE 72 NORTH AMERICA DISTRIBUTED SENSING IN OPTICAL FIBER MONITORING MARKET, BY TYPE, 2017-2026 (USD MILLION)
TABLE 73 NORTH AMERICA OPTICAL FIBER MONITORING MARKET, BY END-USER, 2017-2026 (USD MILLION)
TABLE 74 U.S. OPTICAL FIBER MONITORING MARKET, BY COMPONENT, 2017-2026 (USD MILLION)
TABLE 75 U.S. HARDWARE IN OPTICAL FIBER MONITORING MARKET, BY TYPE, 2017-2026 (USD MILLION)
TABLE 76 U.S. CABLES IN OPTICAL FIBER MONITORING MARKET, BY TYPE, 2017-2026 (USD MILLION)
TABLE 77 U.S. TRANSCEIVER IN OPTICAL FIBER MONITORING MARKET, BY TYPE, 2017-2026 (USD MILLION)
TABLE 78 U.S. AMPLIFIERS IN OPTICAL FIBER MONITORING MARKET, BY TYPE, 2017-2026 (USD MILLION)
TABLE 79 U.S. CONNECTORS IN OPTICAL FIBER MONITORING MARKET, BY TYPE, 2017-2026 (USD MILLION)
TABLE 80 U.S. OPTICAL FIBER MONITORING MARKET, BY SYSTEM, 2017-2026 (USD MILLION)
TABLE 81 U.S. OPTICAL FIBER MONITORING MARKET, BY APPLICATION, 2017-2026 (USD MILLION)
TABLE 82 U.S. DISTRIBUTED SENSING IN OPTICAL FIBER MONITORING MARKET, BY TYPE, 2017-2026 (USD MILLION)
TABLE 83 U.S. OPTICAL FIBER MONITORING MARKET, BY END-USER, 2017-2026 (USD MILLION)
TABLE 84 CANADA OPTICAL FIBER MONITORING MARKET, BY COMPONENT, 2017-2026 (USD MILLION)
TABLE 85 CANADA HARDWARE IN OPTICAL FIBER MONITORING MARKET, BY TYPE, 2017-2026 (USD MILLION)
TABLE 86 CANADA CABLES IN OPTICAL FIBER MONITORING MARKET, BY TYPE, 2017-2026 (USD MILLION)
TABLE 87 CANADA TRANSCEIVER IN OPTICAL FIBER MONITORING MARKET, BY TYPE, 2017-2026 (USD MILLION)
TABLE 88 CANADA AMPLIFIERS IN OPTICAL FIBER MONITORING MARKET, BY TYPE, 2017-2026 (USD MILLION)
TABLE 89 CANADA CONNECTORS IN OPTICAL FIBER MONITORING MARKET, BY TYPE, 2017-2026 (USD MILLION)
TABLE 90 CANADA OPTICAL FIBER MONITORING MARKET, BY SYSTEM, 2017-2026 (USD MILLION)
TABLE 91 CANADA OPTICAL FIBER MONITORING MARKET, BY APPLICATION, 2017-2026 (USD MILLION)
TABLE 92 CANADA DISTRIBUTED SENSING IN OPTICAL FIBER MONITORING MARKET, BY TYPE, 2017-2026 (USD MILLION)
TABLE 93 CANADA OPTICAL FIBER MONITORING MARKET, BY END-USER, 2017-2026 (USD MILLION)
TABLE 94 MEXICO OPTICAL FIBER MONITORING MARKET, BY COMPONENT, 2017-2026 (USD MILLION)
TABLE 95 MEXICO HARDWARE IN OPTICAL FIBER MONITORING MARKET, BY TYPE, 2017-2026 (USD MILLION)
TABLE 96 MEXICO CABLES IN OPTICAL FIBER MONITORING MARKET, BY TYPE, 2017-2026 (USD MILLION)
TABLE 97 MEXICO TRANSCEIVER IN OPTICAL FIBER MONITORING MARKET, BY TYPE, 2017-2026 (USD MILLION)
TABLE 98 MEXICO AMPLIFIERS IN OPTICAL FIBER MONITORING MARKET, BY TYPE, 2017-2026 (USD MILLION)
TABLE 99 MEXICO CONNECTORS IN OPTICAL FIBER MONITORING MARKET, BY TYPE, 2017-2026 (USD MILLION)
TABLE 100 MEXICO OPTICAL FIBER MONITORING MARKET, BY SYSTEM, 2017-2026 (USD MILLION)
TABLE 101 MEXICO OPTICAL FIBER MONITORING MARKET, BY APPLICATION, 2017-2026 (USD MILLION)
TABLE 102 MEXICO DISTRIBUTED SENSING IN OPTICAL FIBER MONITORING MARKET, BY TYPE, 2017-2026 (USD MILLION)
TABLE 103 MEXICO OPTICAL FIBER MONITORING MARKET, BY END-USER, 2017-2026 (USD MILLION)
TABLE 104 EUROPE OPTICAL FIBER MONITORING MARKET, BY COUNTRY, 2017-2026 (USD MILLION)
TABLE 105 EUROPE OPTICAL FIBER MONITORING MARKET, BY COMPONENT, 2017-2026 (USD MILLION)
TABLE 106 EUROPE HARDWARE IN OPTICAL FIBER MONITORING MARKET, BY TYPE, 2017-2026 (USD MILLION)
TABLE 107 EUROPE CABLES IN OPTICAL FIBER MONITORING MARKET, BY TYPE, 2017-2026 (USD MILLION)
TABLE 108 EUROPE TRANSCEIVER IN OPTICAL FIBER MONITORING MARKET, BY TYPE, 2017-2026 (USD MILLION)
TABLE 109 EUROPE AMPLIFIERS IN OPTICAL FIBER MONITORING MARKET, BY TYPE, 2017-2026 (USD MILLION)
TABLE 110 EUROPE CONNECTORS IN OPTICAL FIBER MONITORING MARKET, BY TYPE, 2017-2026 (USD MILLION)
TABLE 111 EUROPE OPTICAL FIBER MONITORING MARKET, BY SYSTEM, 2017-2026 (USD MILLION)
TABLE 112 EUROPE OPTICAL FIBER MONITORING MARKET, BY APPLICATION, 2017-2026 (USD MILLION)
TABLE 113 EUROPE DISTRIBUTED SENSING IN OPTICAL FIBER MONITORING MARKET, BY TYPE, 2017-2026 (USD MILLION)
TABLE 114 EUROPE OPTICAL FIBER MONITORING MARKET, BY END-USER, 2017-2026 (USD MILLION)
TABLE 115 RUSSIA OPTICAL FIBER MONITORING MARKET, BY COMPONENT, 2017-2026 (USD MILLION)
TABLE 116 RUSSIA HARDWARE IN OPTICAL FIBER MONITORING MARKET, BY TYPE, 2017-2026 (USD MILLION)
TABLE 117 RUSSIA CABLES IN OPTICAL FIBER MONITORING MARKET, BY TYPE, 2017-2026 (USD MILLION)
TABLE 118 RUSSIA TRANSCEIVER IN OPTICAL FIBER MONITORING MARKET, BY TYPE, 2017-2026 (USD MILLION)
TABLE 119 RUSSIA AMPLIFIERS IN OPTICAL FIBER MONITORING MARKET, BY TYPE, 2017-2026 (USD MILLION)
TABLE 120 RUSSIA CONNECTORS IN OPTICAL FIBER MONITORING MARKET, BY TYPE, 2017-2026 (USD MILLION)
TABLE 121 RUSSIA OPTICAL FIBER MONITORING MARKET, BY SYSTEM, 2017-2026 (USD MILLION)
TABLE 122 RUSSIA OPTICAL FIBER MONITORING MARKET, BY APPLICATION, 2017-2026 (USD MILLION)
TABLE 123 RUSSIA DISTRIBUTED SENSING IN OPTICAL FIBER MONITORING MARKET, BY TYPE, 2017-2026 (USD MILLION)
TABLE 124 RUSSIA OPTICAL FIBER MONITORING MARKET, BY END-USER, 2017-2026 (USD MILLION)
TABLE 125 GERMANY OPTICAL FIBER MONITORING MARKET, BY COMPONENT, 2017-2026 (USD MILLION)
TABLE 126 GERMANY HARDWARE IN OPTICAL FIBER MONITORING MARKET, BY TYPE, 2017-2026 (USD MILLION)
TABLE 127 GERMANY CABLES IN OPTICAL FIBER MONITORING MARKET, BY TYPE, 2017-2026 (USD MILLION)
TABLE 128 GERMANY TRANSCEIVER IN OPTICAL FIBER MONITORING MARKET, BY TYPE, 2017-2026 (USD MILLION)
TABLE 129 GERMANY AMPLIFIERS IN OPTICAL FIBER MONITORING MARKET, BY TYPE, 2017-2026 (USD MILLION)
TABLE 130 GERMANY CONNECTORS IN OPTICAL FIBER MONITORING MARKET, BY TYPE, 2017-2026 (USD MILLION)
TABLE 131 GERMANY OPTICAL FIBER MONITORING MARKET, BY SYSTEM, 2017-2026 (USD MILLION)
TABLE 132 GERMANY OPTICAL FIBER MONITORING MARKET, BY APPLICATION, 2017-2026 (USD MILLION)
TABLE 133 GERMANY DISTRIBUTED SENSING IN OPTICAL FIBER MONITORING MARKET, BY TYPE, 2017-2026 (USD MILLION)
TABLE 134 GERMANY OPTICAL FIBER MONITORING MARKET, BY END-USER, 2017-2026 (USD MILLION)
TABLE 135 U.K OPTICAL FIBER MONITORING MARKET, BY COMPONENT, 2017-2026 (USD MILLION)
TABLE 136 U.K HARDWARE IN OPTICAL FIBER MONITORING MARKET, BY TYPE, 2017-2026 (USD MILLION)
TABLE 137 U.K CABLES IN OPTICAL FIBER MONITORING MARKET, BY TYPE, 2017-2026 (USD MILLION)
TABLE 138 U.K TRANSCEIVER IN OPTICAL FIBER MONITORING MARKET, BY TYPE, 2017-2026 (USD MILLION)
TABLE 139 U.K AMPLIFIERS IN OPTICAL FIBER MONITORING MARKET, BY TYPE, 2017-2026 (USD MILLION)
TABLE 140 U.K CONNECTORS IN OPTICAL FIBER MONITORING MARKET, BY TYPE, 2017-2026 (USD MILLION)
TABLE 141 U.K OPTICAL FIBER MONITORING MARKET, BY SYSTEM, 2017-2026 (USD MILLION)
TABLE 142 U.K OPTICAL FIBER MONITORING MARKET, BY APPLICATION, 2017-2026 (USD MILLION)
TABLE 143 U.K DISTRIBUTED SENSING IN OPTICAL FIBER MONITORING MARKET, BY TYPE, 2017-2026 (USD MILLION)
TABLE 144 U.K OPTICAL FIBER MONITORING MARKET, BY END-USER, 2017-2026 (USD MILLION)
TABLE 145 FRANCE OPTICAL FIBER MONITORING MARKET, BY COMPONENT, 2017-2026 (USD MILLION)
TABLE 146 FRANCE HARDWARE IN OPTICAL FIBER MONITORING MARKET, BY TYPE, 2017-2026 (USD MILLION)
TABLE 147 FRANCE CABLES IN OPTICAL FIBER MONITORING MARKET, BY TYPE, 2017-2026 (USD MILLION)
TABLE 148 FRANCE TRANSCEIVER IN OPTICAL FIBER MONITORING MARKET, BY TYPE, 2017-2026 (USD MILLION)
TABLE 149 FRANCE AMPLIFIERS IN OPTICAL FIBER MONITORING MARKET, BY TYPE, 2017-2026 (USD MILLION)
TABLE 150 FRANCE CONNECTORS IN OPTICAL FIBER MONITORING MARKET, BY TYPE, 2017-2026 (USD MILLION)
TABLE 151 FRANCE OPTICAL FIBER MONITORING MARKET, BY SYSTEM, 2017-2026 (USD MILLION)
TABLE 152 FRANCE OPTICAL FIBER MONITORING MARKET, BY APPLICATION, 2017-2026 (USD MILLION)
TABLE 153 FRANCE DISTRIBUTED SENSING IN OPTICAL FIBER MONITORING MARKET, BY TYPE, 2017-2026 (USD MILLION)
TABLE 154 FRANCE OPTICAL FIBER MONITORING MARKET, BY END-USER, 2017-2026 (USD MILLION)
TABLE 155 SPAIN OPTICAL FIBER MONITORING MARKET, BY COMPONENT, 2017-2026 (USD MILLION)
TABLE 156 SPAIN HARDWARE IN OPTICAL FIBER MONITORING MARKET, BY TYPE, 2017-2026 (USD MILLION)
TABLE 157 SPAIN CABLES IN OPTICAL FIBER MONITORING MARKET, BY TYPE, 2017-2026 (USD MILLION)
TABLE 158 SPAIN TRANSCEIVER IN OPTICAL FIBER MONITORING MARKET, BY TYPE, 2017-2026 (USD MILLION)
TABLE 159 SPAIN AMPLIFIERS IN OPTICAL FIBER MONITORING MARKET, BY TYPE, 2017-2026 (USD MILLION)
TABLE 160 SPAIN CONNECTORS IN OPTICAL FIBER MONITORING MARKET, BY TYPE, 2017-2026 (USD MILLION)
TABLE 161 SPAIN OPTICAL FIBER MONITORING MARKET, BY SYSTEM, 2017-2026 (USD MILLION)
TABLE 162 SPAIN OPTICAL FIBER MONITORING MARKET, BY APPLICATION, 2017-2026 (USD MILLION)
TABLE 163 SPAIN DISTRIBUTED SENSING IN OPTICAL FIBER MONITORING MARKET, BY TYPE, 2017-2026 (USD MILLION)
TABLE 164 SPAIN OPTICAL FIBER MONITORING MARKET, BY END-USER, 2017-2026 (USD MILLION)
TABLE 165 SWEDEN OPTICAL FIBER MONITORING MARKET, BY COMPONENT, 2017-2026 (USD MILLION)
TABLE 166 SWEDEN HARDWARE IN OPTICAL FIBER MONITORING MARKET, BY TYPE, 2017-2026 (USD MILLION)
TABLE 167 SWEDEN CABLES IN OPTICAL FIBER MONITORING MARKET, BY TYPE, 2017-2026 (USD MILLION)
TABLE 168 SWEDEN TRANSCEIVER IN OPTICAL FIBER MONITORING MARKET, BY TYPE, 2017-2026 (USD MILLION)
TABLE 169 SWEDEN AMPLIFIERS IN OPTICAL FIBER MONITORING MARKET, BY TYPE, 2017-2026 (USD MILLION)
TABLE 170 SWEDEN CONNECTORS IN OPTICAL FIBER MONITORING MARKET, BY TYPE, 2017-2026 (USD MILLION)
TABLE 171 SWEDEN OPTICAL FIBER MONITORING MARKET, BY SYSTEM, 2017-2026 (USD MILLION)
TABLE 172 SWEDEN OPTICAL FIBER MONITORING MARKET, BY APPLICATION, 2017-2026 (USD MILLION)
TABLE 173 SWEDEN DISTRIBUTED SENSING IN OPTICAL FIBER MONITORING MARKET, BY TYPE, 2017-2026 (USD MILLION)
TABLE 174 SWEDEN OPTICAL FIBER MONITORING MARKET, BY END-USER, 2017-2026 (USD MILLION)
TABLE 175 NETHERLANDS OPTICAL FIBER MONITORING MARKET, BY COMPONENT, 2017-2026 (USD MILLION)
TABLE 176 NETHERLANDS HARDWARE IN OPTICAL FIBER MONITORING MARKET, BY TYPE, 2017-2026 (USD MILLION)
TABLE 177 NETHERLANDS CABLES IN OPTICAL FIBER MONITORING MARKET, BY TYPE, 2017-2026 (USD MILLION)
TABLE 178 NETHERLANDS TRANSCEIVER IN OPTICAL FIBER MONITORING MARKET, BY TYPE, 2017-2026 (USD MILLION)
TABLE 179 NETHERLANDS AMPLIFIERS IN OPTICAL FIBER MONITORING MARKET, BY TYPE, 2017-2026 (USD MILLION)
TABLE 180 NETHERLANDS CONNECTORS IN OPTICAL FIBER MONITORING MARKET, BY TYPE, 2017-2026 (USD MILLION)
TABLE 181 NETHERLANDS OPTICAL FIBER MONITORING MARKET, BY SYSTEM, 2017-2026 (USD MILLION)
TABLE 182 NETHERLANDS OPTICAL FIBER MONITORING MARKET, BY APPLICATION, 2017-2026 (USD MILLION)
TABLE 183 NETHERLANDS DISTRIBUTED SENSING IN OPTICAL FIBER MONITORING MARKET, BY TYPE, 2017-2026 (USD MILLION)
TABLE 184 NETHERLANDS OPTICAL FIBER MONITORING MARKET, BY END-USER, 2017-2026 (USD MILLION)
TABLE 185 SWITZERLAND OPTICAL FIBER MONITORING MARKET, BY COMPONENT, 2017-2026 (USD MILLION)
TABLE 186 SWITZERLAND HARDWARE IN OPTICAL FIBER MONITORING MARKET, BY TYPE, 2017-2026 (USD MILLION)
TABLE 187 SWITZERLAND CABLES IN OPTICAL FIBER MONITORING MARKET, BY TYPE, 2017-2026 (USD MILLION)
TABLE 188 SWITZERLAND TRANSCEIVER IN OPTICAL FIBER MONITORING MARKET, BY TYPE, 2017-2026 (USD MILLION)
TABLE 189 SWITZERLAND AMPLIFIERS IN OPTICAL FIBER MONITORING MARKET, BY TYPE, 2017-2026 (USD MILLION)
TABLE 190 SWITZERLAND CONNECTORS IN OPTICAL FIBER MONITORING MARKET, BY TYPE, 2017-2026 (USD MILLION)
TABLE 191 SWITZERLAND OPTICAL FIBER MONITORING MARKET, BY SYSTEM, 2017-2026 (USD MILLION)
TABLE 192 SWITZERLAND OPTICAL FIBER MONITORING MARKET, BY APPLICATION, 2017-2026 (USD MILLION)
TABLE 193 SWITZERLAND DISTRIBUTED SENSING IN OPTICAL FIBER MONITORING MARKET, BY TYPE, 2017-2026 (USD MILLION)
TABLE 194 SWITZERLAND OPTICAL FIBER MONITORING MARKET, BY END-USER, 2017-2026 (USD MILLION)
TABLE 195 ITALY OPTICAL FIBER MONITORING MARKET, BY COMPONENT, 2017-2026 (USD MILLION)
TABLE 196 ITALY HARDWARE IN OPTICAL FIBER MONITORING MARKET, BY TYPE, 2017-2026 (USD MILLION)
TABLE 197 ITALY CABLES IN OPTICAL FIBER MONITORING MARKET, BY TYPE, 2017-2026 (USD MILLION)
TABLE 198 ITALY TRANSCEIVER IN OPTICAL FIBER MONITORING MARKET, BY TYPE, 2017-2026 (USD MILLION)
TABLE 199 ITALY AMPLIFIERS IN OPTICAL FIBER MONITORING MARKET, BY TYPE, 2017-2026 (USD MILLION)
TABLE 200 ITALY CONNECTORS IN OPTICAL FIBER MONITORING MARKET, BY TYPE, 2017-2026 (USD MILLION)
TABLE 201 ITALY OPTICAL FIBER MONITORING MARKET, BY SYSTEM, 2017-2026 (USD MILLION)
TABLE 202 ITALY OPTICAL FIBER MONITORING MARKET, BY APPLICATION, 2017-2026 (USD MILLION)
TABLE 203 ITALY DISTRIBUTED SENSING IN OPTICAL FIBER MONITORING MARKET, BY TYPE, 2017-2026 (USD MILLION)
TABLE 204 ITALY OPTICAL FIBER MONITORING MARKET, BY END-USER, 2017-2026 (USD MILLION)
TABLE 205 TURKEY OPTICAL FIBER MONITORING MARKET, BY COMPONENT, 2017-2026 (USD MILLION)
TABLE 206 TURKEY HARDWARE IN OPTICAL FIBER MONITORING MARKET, BY TYPE, 2017-2026 (USD MILLION)
TABLE 207 TURKEY CABLES IN OPTICAL FIBER MONITORING MARKET, BY TYPE, 2017-2026 (USD MILLION)
TABLE 208 TURKEY TRANSCEIVER IN OPTICAL FIBER MONITORING MARKET, BY TYPE, 2017-2026 (USD MILLION)
TABLE 209 TURKEY AMPLIFIERS IN OPTICAL FIBER MONITORING MARKET, BY TYPE, 2017-2026 (USD MILLION)
TABLE 210 TURKEY CONNECTORS IN OPTICAL FIBER MONITORING MARKET, BY TYPE, 2017-2026 (USD MILLION)
TABLE 211 TURKEY OPTICAL FIBER MONITORING MARKET, BY SYSTEM, 2017-2026 (USD MILLION)
TABLE 212 TURKEY OPTICAL FIBER MONITORING MARKET, BY APPLICATION, 2017-2026 (USD MILLION)
TABLE 213 TURKEY DISTRIBUTED SENSING IN OPTICAL FIBER MONITORING MARKET, BY TYPE, 2017-2026 (USD MILLION)
TABLE 214 TURKEY OPTICAL FIBER MONITORING MARKET, BY END-USER, 2017-2026 (USD MILLION)
TABLE 215 BELGIUM OPTICAL FIBER MONITORING MARKET, BY COMPONENT, 2017-2026 (USD MILLION)
TABLE 216 BELGIUM HARDWARE IN OPTICAL FIBER MONITORING MARKET, BY TYPE, 2017-2026 (USD MILLION)
TABLE 217 BELGIUM CABLES IN OPTICAL FIBER MONITORING MARKET, BY TYPE, 2017-2026 (USD MILLION)
TABLE 218 BELGIUM TRANSCEIVER IN OPTICAL FIBER MONITORING MARKET, BY TYPE, 2017-2026 (USD MILLION)
TABLE 219 BELGIUM AMPLIFIERS IN OPTICAL FIBER MONITORING MARKET, BY TYPE, 2017-2026 (USD MILLION)
TABLE 220 BELGIUM CONNECTORS IN OPTICAL FIBER MONITORING MARKET, BY TYPE, 2017-2026 (USD MILLION)
TABLE 221 BELGIUM OPTICAL FIBER MONITORING MARKET, BY SYSTEM, 2017-2026 (USD MILLION)
TABLE 222 BELGIUM OPTICAL FIBER MONITORING MARKET, BY APPLICATION, 2017-2026 (USD MILLION)
TABLE 223 BELGIUM DISTRIBUTED SENSING IN OPTICAL FIBER MONITORING MARKET, BY TYPE, 2017-2026 (USD MILLION)
TABLE 224 BELGIUM OPTICAL FIBER MONITORING MARKET, BY END-USER, 2017-2026 (USD MILLION)
TABLE 225 REST OF EUROPE OPTICAL FIBER MONITORING MARKET, BY COMPONENT, 2017-2026 (USD MILLION)
TABLE 226 ASIA-PACIFIC OPTICAL FIBER MONITORING MARKET, BY COUNTRY, 2017-2026 (USD MILLION)
TABLE 227 ASIA-PACIFIC OPTICAL FIBER MONITORING MARKET, BY COMPONENT, 2017-2026 (USD MILLION)
TABLE 228 ASIA-PACIFIC HARDWARE IN OPTICAL FIBER MONITORING MARKET, BY TYPE, 2017-2026 (USD MILLION)
TABLE 229 ASIA-PACIFIC CABLES IN OPTICAL FIBER MONITORING MARKET, BY TYPE, 2017-2026 (USD MILLION)
TABLE 230 ASIA-PACIFIC TRANSCEIVER IN OPTICAL FIBER MONITORING MARKET, BY TYPE, 2017-2026 (USD MILLION)
TABLE 231 ASIA-PACIFIC AMPLIFIERS IN OPTICAL FIBER MONITORING MARKET, BY TYPE, 2017-2026 (USD MILLION)
TABLE 232 ASIA-PACIFIC CONNECTORS IN OPTICAL FIBER MONITORING MARKET, BY TYPE, 2017-2026 (USD MILLION)
TABLE 233 ASIA-PACIFIC OPTICAL FIBER MONITORING MARKET, BY SYSTEM, 2017-2026 (USD MILLION)
TABLE 234 ASIA-PACIFIC OPTICAL FIBER MONITORING MARKET, BY APPLICATION, 2017-2026 (USD MILLION)
TABLE 235 ASIA-PACIFIC DISTRIBUTED SENSING IN OPTICAL FIBER MONITORING MARKET, BY TYPE, 2017-2026 (USD MILLION)
TABLE 236 ASIA-PACIFIC OPTICAL FIBER MONITORING MARKET, BY END-USER, 2017-2026 (USD MILLION)
TABLE 237 CHINA OPTICAL FIBER MONITORING MARKET, BY COMPONENT, 2017-2026 (USD MILLION)
TABLE 238 CHINA HARDWARE IN OPTICAL FIBER MONITORING MARKET, BY TYPE, 2017-2026 (USD MILLION)
TABLE 239 CHINA CABLES IN OPTICAL FIBER MONITORING MARKET, BY TYPE, 2017-2026 (USD MILLION)
TABLE 240 CHINA TRANSCEIVER IN OPTICAL FIBER MONITORING MARKET, BY TYPE, 2017-2026 (USD MILLION)
TABLE 241 CHINA AMPLIFIERS IN OPTICAL FIBER MONITORING MARKET, BY TYPE, 2017-2026 (USD MILLION)
TABLE 242 CHINA CONNECTORS IN OPTICAL FIBER MONITORING MARKET, BY TYPE, 2017-2026 (USD MILLION)
TABLE 243 CHINA OPTICAL FIBER MONITORING MARKET, BY SYSTEM, 2017-2026 (USD MILLION)
TABLE 244 CHINA OPTICAL FIBER MONITORING MARKET, BY APPLICATION, 2017-2026 (USD MILLION)
TABLE 245 CHINA DISTRIBUTED SENSING IN OPTICAL FIBER MONITORING MARKET, BY TYPE, 2017-2026 (USD MILLION)
TABLE 246 CHINA OPTICAL FIBER MONITORING MARKET, BY END-USER, 2017-2026 (USD MILLION)
TABLE 247 JAPAN OPTICAL FIBER MONITORING MARKET, BY COMPONENT, 2017-2026 (USD MILLION)
TABLE 248 JAPAN HARDWARE IN OPTICAL FIBER MONITORING MARKET, BY TYPE, 2017-2026 (USD MILLION)
TABLE 249 JAPAN CABLES IN OPTICAL FIBER MONITORING MARKET, BY TYPE, 2017-2026 (USD MILLION)
TABLE 250 JAPAN TRANSCEIVER IN OPTICAL FIBER MONITORING MARKET, BY TYPE, 2017-2026 (USD MILLION)
TABLE 251 JAPAN AMPLIFIERS IN OPTICAL FIBER MONITORING MARKET, BY TYPE, 2017-2026 (USD MILLION)
TABLE 252 JAPAN CONNECTORS IN OPTICAL FIBER MONITORING MARKET, BY TYPE, 2017-2026 (USD MILLION)
TABLE 253 JAPAN OPTICAL FIBER MONITORING MARKET, BY SYSTEM, 2017-2026 (USD MILLION)
TABLE 254 JAPAN OPTICAL FIBER MONITORING MARKET, BY APPLICATION, 2017-2026 (USD MILLION)
TABLE 255 JAPAN DISTRIBUTED SENSING IN OPTICAL FIBER MONITORING MARKET, BY TYPE, 2017-2026 (USD MILLION)
TABLE 256 JAPAN OPTICAL FIBER MONITORING MARKET, BY END-USER, 2017-2026 (USD MILLION)
TABLE 257 SOUTH KOREA OPTICAL FIBER MONITORING MARKET, BY COMPONENT, 2017-2026 (USD MILLION)
TABLE 258 SOUTH KOREA HARDWARE IN OPTICAL FIBER MONITORING MARKET, BY TYPE, 2017-2026 (USD MILLION)
TABLE 259 SOUTH KOREA CABLES IN OPTICAL FIBER MONITORING MARKET, BY TYPE, 2017-2026 (USD MILLION)
TABLE 260 SOUTH KOREA TRANSCEIVER IN OPTICAL FIBER MONITORING MARKET, BY TYPE, 2017-2026 (USD MILLION)
TABLE 261 SOUTH KOREA AMPLIFIERS IN OPTICAL FIBER MONITORING MARKET, BY TYPE, 2017-2026 (USD MILLION)
TABLE 262 SOUTH KOREA CONNECTORS IN OPTICAL FIBER MONITORING MARKET, BY TYPE, 2017-2026 (USD MILLION)
TABLE 263 SOUTH KOREA OPTICAL FIBER MONITORING MARKET, BY SYSTEM, 2017-2026 (USD MILLION)
TABLE 264 SOUTH KOREA OPTICAL FIBER MONITORING MARKET, BY APPLICATION, 2017-2026 (USD MILLION)
TABLE 265 SOUTH KOREA DISTRIBUTED SENSING IN OPTICAL FIBER MONITORING MARKET, BY TYPE, 2017-2026 (USD MILLION)
TABLE 266 SOUTH KOREA OPTICAL FIBER MONITORING MARKET, BY END-USER, 2017-2026 (USD MILLION)
TABLE 267 INDIA OPTICAL FIBER MONITORING MARKET, BY COMPONENT, 2017-2026 (USD MILLION)
TABLE 268 INDIA HARDWARE IN OPTICAL FIBER MONITORING MARKET, BY TYPE, 2017-2026 (USD MILLION)
TABLE 269 INDIA CABLES IN OPTICAL FIBER MONITORING MARKET, BY TYPE, 2017-2026 (USD MILLION)
TABLE 270 INDIA TRANSCEIVER IN OPTICAL FIBER MONITORING MARKET, BY TYPE, 2017-2026 (USD MILLION)
TABLE 271 INDIA AMPLIFIERS IN OPTICAL FIBER MONITORING MARKET, BY TYPE, 2017-2026 (USD MILLION)
TABLE 272 INDIA CONNECTORS IN OPTICAL FIBER MONITORING MARKET, BY TYPE, 2017-2026 (USD MILLION)
TABLE 273 INDIA OPTICAL FIBER MONITORING MARKET, BY SYSTEM, 2017-2026 (USD MILLION)
TABLE 274 INDIA OPTICAL FIBER MONITORING MARKET, BY APPLICATION, 2017-2026 (USD MILLION)
TABLE 275 INDIA DISTRIBUTED SENSING IN OPTICAL FIBER MONITORING MARKET, BY TYPE, 2017-2026 (USD MILLION)
TABLE 276 INDIA OPTICAL FIBER MONITORING MARKET, BY END-USER, 2017-2026 (USD MILLION)
TABLE 277 AUSTRALIA OPTICAL FIBER MONITORING MARKET, BY COMPONENT, 2017-2026 (USD MILLION)
TABLE 278 AUSTRALIA HARDWARE IN OPTICAL FIBER MONITORING MARKET, BY TYPE, 2017-2026 (USD MILLION)
TABLE 279 AUSTRALIA CABLES IN OPTICAL FIBER MONITORING MARKET, BY TYPE, 2017-2026 (USD MILLION)
TABLE 280 AUSTRALIA TRANSCEIVER IN OPTICAL FIBER MONITORING MARKET, BY TYPE, 2017-2026 (USD MILLION)
TABLE 281 AUSTRALIA AMPLIFIERS IN OPTICAL FIBER MONITORING MARKET, BY TYPE, 2017-2026 (USD MILLION)
TABLE 282 AUSTRALIA CONNECTORS IN OPTICAL FIBER MONITORING MARKET, BY TYPE, 2017-2026 (USD MILLION)
TABLE 283 AUSTRALIA OPTICAL FIBER MONITORING MARKET, BY SYSTEM, 2017-2026 (USD MILLION)
TABLE 284 AUSTRALIA OPTICAL FIBER MONITORING MARKET, BY APPLICATION, 2017-2026 (USD MILLION)
TABLE 285 AUSTRALIA DISTRIBUTED SENSING IN OPTICAL FIBER MONITORING MARKET, BY TYPE, 2017-2026 (USD MILLION)
TABLE 286 AUSTRALIA OPTICAL FIBER MONITORING MARKET, BY END-USER, 2017-2026 (USD MILLION)
TABLE 287 SINGAPORE OPTICAL FIBER MONITORING MARKET, BY COMPONENT, 2017-2026 (USD MILLION)
TABLE 288 SINGAPORE HARDWARE IN OPTICAL FIBER MONITORING MARKET, BY TYPE, 2017-2026 (USD MILLION)
TABLE 289 SINGAPORE CABLES IN OPTICAL FIBER MONITORING MARKET, BY TYPE, 2017-2026 (USD MILLION)
TABLE 290 SINGAPORE TRANSCEIVER IN OPTICAL FIBER MONITORING MARKET, BY TYPE, 2017-2026 (USD MILLION)
TABLE 291 SINGAPORE AMPLIFIERS IN OPTICAL FIBER MONITORING MARKET, BY TYPE, 2017-2026 (USD MILLION)
TABLE 292 SINGAPORE CONNECTORS IN OPTICAL FIBER MONITORING MARKET, BY TYPE, 2017-2026 (USD MILLION)
TABLE 293 SINGAPORE OPTICAL FIBER MONITORING MARKET, BY SYSTEM, 2017-2026 (USD MILLION)
TABLE 294 SINGAPORE OPTICAL FIBER MONITORING MARKET, BY APPLICATION, 2017-2026 (USD MILLION)
TABLE 295 SINGAPORE DISTRIBUTED SENSING IN OPTICAL FIBER MONITORING MARKET, BY TYPE, 2017-2026 (USD MILLION)
TABLE 296 SINGAPORE OPTICAL FIBER MONITORING MARKET, BY END-USER, 2017-2026 (USD MILLION)
TABLE 297 THAILAND OPTICAL FIBER MONITORING MARKET, BY COMPONENT, 2017-2026 (USD MILLION)
TABLE 298 THAILAND HARDWARE IN OPTICAL FIBER MONITORING MARKET, BY TYPE, 2017-2026 (USD MILLION)
TABLE 299 THAILAND CABLES IN OPTICAL FIBER MONITORING MARKET, BY TYPE, 2017-2026 (USD MILLION)
TABLE 300 THAILAND TRANSCEIVER IN OPTICAL FIBER MONITORING MARKET, BY TYPE, 2017-2026 (USD MILLION)
TABLE 301 THAILAND AMPLIFIERS IN OPTICAL FIBER MONITORING MARKET, BY TYPE, 2017-2026 (USD MILLION)
TABLE 302 THAILAND CONNECTORS IN OPTICAL FIBER MONITORING MARKET, BY TYPE, 2017-2026 (USD MILLION)
TABLE 303 THAILAND OPTICAL FIBER MONITORING MARKET, BY SYSTEM, 2017-2026 (USD MILLION)
TABLE 304 THAILAND OPTICAL FIBER MONITORING MARKET, BY APPLICATION, 2017-2026 (USD MILLION)
TABLE 305 THAILAND DISTRIBUTED SENSING IN OPTICAL FIBER MONITORING MARKET, BY TYPE, 2017-2026 (USD MILLION)
TABLE 306 THAILAND OPTICAL FIBER MONITORING MARKET, BY END-USER, 2017-2026 (USD MILLION)
TABLE 307 INDONESIA OPTICAL FIBER MONITORING MARKET, BY COMPONENT, 2017-2026 (USD MILLION)
TABLE 308 INDONESIA HARDWARE IN OPTICAL FIBER MONITORING MARKET, BY TYPE, 2017-2026 (USD MILLION)
TABLE 309 INDONESIA CABLES IN OPTICAL FIBER MONITORING MARKET, BY TYPE, 2017-2026 (USD MILLION)
TABLE 310 INDONESIA TRANSCEIVER IN OPTICAL FIBER MONITORING MARKET, BY TYPE, 2017-2026 (USD MILLION)
TABLE 311 INDONESIA AMPLIFIERS IN OPTICAL FIBER MONITORING MARKET, BY TYPE, 2017-2026 (USD MILLION)
TABLE 312 INDONESIA CONNECTORS IN OPTICAL FIBER MONITORING MARKET, BY TYPE, 2017-2026 (USD MILLION)
TABLE 313 INDONESIA OPTICAL FIBER MONITORING MARKET, BY SYSTEM, 2017-2026 (USD MILLION)
TABLE 314 INDONESIA OPTICAL FIBER MONITORING MARKET, BY APPLICATION, 2017-2026 (USD MILLION)
TABLE 315 INDONESIA DISTRIBUTED SENSING IN OPTICAL FIBER MONITORING MARKET, BY TYPE, 2017-2026 (USD MILLION)
TABLE 316 INDONESIA OPTICAL FIBER MONITORING MARKET, BY END-USER, 2017-2026 (USD MILLION)
TABLE 317 MALAYSIA OPTICAL FIBER MONITORING MARKET, BY COMPONENT, 2017-2026 (USD MILLION)
TABLE 318 MALAYSIA HARDWARE IN OPTICAL FIBER MONITORING MARKET, BY TYPE, 2017-2026 (USD MILLION)
TABLE 319 MALAYSIA CABLES IN OPTICAL FIBER MONITORING MARKET, BY TYPE, 2017-2026 (USD MILLION)
TABLE 320 MALAYSIA TRANSCEIVER IN OPTICAL FIBER MONITORING MARKET, BY TYPE, 2017-2026 (USD MILLION)
TABLE 321 MALAYSIA AMPLIFIERS IN OPTICAL FIBER MONITORING MARKET, BY TYPE, 2017-2026 (USD MILLION)
TABLE 322 MALAYSIA CONNECTORS IN OPTICAL FIBER MONITORING MARKET, BY TYPE, 2017-2026 (USD MILLION)
TABLE 323 MALAYSIA OPTICAL FIBER MONITORING MARKET, BY SYSTEM, 2017-2026 (USD MILLION)
TABLE 324 MALAYSIA OPTICAL FIBER MONITORING MARKET, BY APPLICATION, 2017-2026 (USD MILLION)
TABLE 325 MALAYSIA DISTRIBUTED SENSING IN OPTICAL FIBER MONITORING MARKET, BY TYPE, 2017-2026 (USD MILLION)
TABLE 326 MALAYSIA OPTICAL FIBER MONITORING MARKET, BY END-USER, 2017-2026 (USD MILLION)
TABLE 327 PHILIPPINES OPTICAL FIBER MONITORING MARKET, BY COMPONENT, 2017-2026 (USD MILLION)
TABLE 328 PHILIPPINES HARDWARE IN OPTICAL FIBER MONITORING MARKET, BY TYPE, 2017-2026 (USD MILLION)
TABLE 329 PHILIPPINES CABLES IN OPTICAL FIBER MONITORING MARKET, BY TYPE, 2017-2026 (USD MILLION)
TABLE 330 PHILIPPINES TRANSCEIVER IN OPTICAL FIBER MONITORING MARKET, BY TYPE, 2017-2026 (USD MILLION)
TABLE 331 PHILIPPINES AMPLIFIERS IN OPTICAL FIBER MONITORING MARKET, BY TYPE, 2017-2026 (USD MILLION)
TABLE 332 PHILIPPINES CONNECTORS IN OPTICAL FIBER MONITORING MARKET, BY TYPE, 2017-2026 (USD MILLION)
TABLE 333 PHILIPPINES OPTICAL FIBER MONITORING MARKET, BY SYSTEM, 2017-2026 (USD MILLION)
TABLE 334 PHILIPPINES OPTICAL FIBER MONITORING MARKET, BY APPLICATION, 2017-2026 (USD MILLION)
TABLE 335 PHILIPPINES DISTRIBUTED SENSING IN OPTICAL FIBER MONITORING MARKET, BY TYPE, 2017-2026 (USD MILLION)
TABLE 336 PHILIPPINES OPTICAL FIBER MONITORING MARKET, BY END-USER, 2017-2026 (USD MILLION)
TABLE 337 REST OF ASIA-PACIFIC OPTICAL FIBER MONITORING MARKET, BY COMPONENT, 2017-2026 (USD MILLION)
TABLE 338 SOUTH AMERICA OPTICAL FIBER MONITORING MARKET, BY COUNTRY, 2017-2026 (USD MILLION)
TABLE 339 SOUTH AMERICA OPTICAL FIBER MONITORING MARKET, BY COMPONENT, 2017-2026 (USD MILLION)
TABLE 340 SOUTH AMERICA HARDWARE IN OPTICAL FIBER MONITORING MARKET, BY TYPE, 2017-2026 (USD MILLION)
TABLE 341 SOUTH AMERICA CABLES IN OPTICAL FIBER MONITORING MARKET, BY TYPE, 2017-2026 (USD MILLION)
TABLE 342 SOUTH AMERICA TRANSCEIVER IN OPTICAL FIBER MONITORING MARKET, BY TYPE, 2017-2026 (USD MILLION)
TABLE 343 SOUTH AMERICA AMPLIFIERS IN OPTICAL FIBER MONITORING MARKET, BY TYPE, 2017-2026 (USD MILLION)
TABLE 344 SOUTH AMERICA CONNECTORS IN OPTICAL FIBER MONITORING MARKET, BY TYPE, 2017-2026 (USD MILLION)
TABLE 345 SOUTH AMERICA OPTICAL FIBER MONITORING MARKET, BY SYSTEM, 2017-2026 (USD MILLION)
TABLE 346 SOUTH AMERICA OPTICAL FIBER MONITORING MARKET, BY APPLICATION, 2017-2026 (USD MILLION)
TABLE 347 SOUTH AMERICA DISTRIBUTED SENSING IN OPTICAL FIBER MONITORING MARKET, BY TYPE, 2017-2026 (USD MILLION)
TABLE 348 SOUTH AMERICA OPTICAL FIBER MONITORING MARKET, BY END-USER, 2017-2026 (USD MILLION)
TABLE 349 BRAZIL OPTICAL FIBER MONITORING MARKET, BY COMPONENT, 2017-2026 (USD MILLION)
TABLE 350 BRAZIL HARDWARE IN OPTICAL FIBER MONITORING MARKET, BY TYPE, 2017-2026 (USD MILLION)
TABLE 351 BRAZIL CABLES IN OPTICAL FIBER MONITORING MARKET, BY TYPE, 2017-2026 (USD MILLION)
TABLE 352 BRAZIL TRANSCEIVER IN OPTICAL FIBER MONITORING MARKET, BY TYPE, 2017-2026 (USD MILLION)
TABLE 353 BRAZIL AMPLIFIERS IN OPTICAL FIBER MONITORING MARKET, BY TYPE, 2017-2026 (USD MILLION)
TABLE 354 BRAZIL CONNECTORS IN OPTICAL FIBER MONITORING MARKET, BY TYPE, 2017-2026 (USD MILLION)
TABLE 355 BRAZIL OPTICAL FIBER MONITORING MARKET, BY SYSTEM, 2017-2026 (USD MILLION)
TABLE 356 BRAZIL OPTICAL FIBER MONITORING MARKET, BY APPLICATION, 2017-2026 (USD MILLION)
TABLE 357 BRAZIL DISTRIBUTED SENSING IN OPTICAL FIBER MONITORING MARKET, BY TYPE, 2017-2026 (USD MILLION)
TABLE 358 BRAZIL OPTICAL FIBER MONITORING MARKET, BY END-USER, 2017-2026 (USD MILLION)
TABLE 359 ARGENTINA OPTICAL FIBER MONITORING MARKET, BY COMPONENT, 2017-2026 (USD MILLION)
TABLE 360 ARGENTINA HARDWARE IN OPTICAL FIBER MONITORING MARKET, BY TYPE, 2017-2026 (USD MILLION)
TABLE 361 ARGENTINA CABLES IN OPTICAL FIBER MONITORING MARKET, BY TYPE, 2017-2026 (USD MILLION)
TABLE 362 ARGENTINA TRANSCEIVER IN OPTICAL FIBER MONITORING MARKET, BY TYPE, 2017-2026 (USD MILLION)
TABLE 363 ARGENTINA AMPLIFIERS IN OPTICAL FIBER MONITORING MARKET, BY TYPE, 2017-2026 (USD MILLION)
TABLE 364 ARGENTINA CONNECTORS IN OPTICAL FIBER MONITORING MARKET, BY TYPE, 2017-2026 (USD MILLION)
TABLE 365 ARGENTINA OPTICAL FIBER MONITORING MARKET, BY SYSTEM, 2017-2026 (USD MILLION)
TABLE 366 ARGENTINA OPTICAL FIBER MONITORING MARKET, BY APPLICATION, 2017-2026 (USD MILLION)
TABLE 367 ARGENTINA DISTRIBUTED SENSING IN OPTICAL FIBER MONITORING MARKET, BY TYPE, 2017-2026 (USD MILLION)
TABLE 368 ARGENTINA OPTICAL FIBER MONITORING MARKET, BY END-USER, 2017-2026 (USD MILLION)
TABLE 369 REST OF SOUTH AMERICA OPTICAL FIBER MONITORING MARKET, BY COMPONENT, 2017-2026 (USD MILLION)
TABLE 370 MIDDLE EAST AND AFRICA OPTICAL FIBER MONITORING MARKET, BY COUNTRY, 2017-2026 (USD MILLION)
TABLE 371 MIDDLE EAST AND AFRICA OPTICAL FIBER MONITORING MARKET, BY COMPONENT, 2017-2026 (USD MILLION)
TABLE 372 MIDDLE EAST AND AFRICA HARDWARE IN OPTICAL FIBER MONITORING MARKET, BY TYPE, 2017-2026 (USD MILLION)
TABLE 373 MIDDLE EAST AND AFRICA CABLES IN OPTICAL FIBER MONITORING MARKET, BY TYPE, 2017-2026 (USD MILLION)
TABLE 374 MIDDLE EAST AND AFRICA TRANSCEIVER IN OPTICAL FIBER MONITORING MARKET, BY TYPE, 2017-2026 (USD MILLION)
TABLE 375 MIDDLE EAST AND AFRICA AMPLIFIERS IN OPTICAL FIBER MONITORING MARKET, BY TYPE, 2017-2026 (USD MILLION)
TABLE 376 MIDDLE EAST AND AFRICA CONNECTORS IN OPTICAL FIBER MONITORING MARKET, BY TYPE, 2017-2026 (USD MILLION)
TABLE 377 MIDDLE EAST AND AFRICA OPTICAL FIBER MONITORING MARKET, BY SYSTEM, 2017-2026 (USD MILLION)
TABLE 378 MIDDLE EAST AND AFRICA OPTICAL FIBER MONITORING MARKET, BY APPLICATION, 2017-2026 (USD MILLION)
TABLE 379 MIDDLE EAST AND AFRICA DISTRIBUTED SENSING IN OPTICAL FIBER MONITORING MARKET, BY TYPE, 2017-2026 (USD MILLION)
TABLE 380 MIDDLE EAST AND AFRICA OPTICAL FIBER MONITORING MARKET, BY END-USER, 2017-2026 (USD MILLION)
TABLE 381 SAUDI ARABIA OPTICAL FIBER MONITORING MARKET, BY COMPONENT, 2017-2026 (USD MILLION)
TABLE 382 SAUDI ARABIA HARDWARE IN OPTICAL FIBER MONITORING MARKET, BY TYPE, 2017-2026 (USD MILLION)
TABLE 383 SAUDI ARABIA CABLES IN OPTICAL FIBER MONITORING MARKET, BY TYPE, 2017-2026 (USD MILLION)
TABLE 384 SAUDI ARABIA TRANSCEIVER IN OPTICAL FIBER MONITORING MARKET, BY TYPE, 2017-2026 (USD MILLION)
TABLE 385 SAUDI ARABIA AMPLIFIERS IN OPTICAL FIBER MONITORING MARKET, BY TYPE, 2017-2026 (USD MILLION)
TABLE 386 SAUDI ARABIA CONNECTORS IN OPTICAL FIBER MONITORING MARKET, BY TYPE, 2017-2026 (USD MILLION)
TABLE 387 SAUDI ARABIA OPTICAL FIBER MONITORING MARKET, BY SYSTEM, 2017-2026 (USD MILLION)
TABLE 388 SAUDI ARABIA OPTICAL FIBER MONITORING MARKET, BY APPLICATION, 2017-2026 (USD MILLION)
TABLE 389 SAUDI ARABIA DISTRIBUTED SENSING IN OPTICAL FIBER MONITORING MARKET, BY TYPE, 2017-2026 (USD MILLION)
TABLE 390 SAUDI ARABIA OPTICAL FIBER MONITORING MARKET, BY END-USER, 2017-2026 (USD MILLION)
TABLE 391 U.A.E OPTICAL FIBER MONITORING MARKET, BY COMPONENT, 2017-2026 (USD MILLION)
TABLE 392 U.A.E HARDWARE IN OPTICAL FIBER MONITORING MARKET, BY TYPE, 2017-2026 (USD MILLION)
TABLE 393 U.A.E CABLES IN OPTICAL FIBER MONITORING MARKET, BY TYPE, 2017-2026 (USD MILLION)
TABLE 394 U.A.E TRANSCEIVER IN OPTICAL FIBER MONITORING MARKET, BY TYPE, 2017-2026 (USD MILLION)
TABLE 395 U.A.E AMPLIFIERS IN OPTICAL FIBER MONITORING MARKET, BY TYPE, 2017-2026 (USD MILLION)
TABLE 396 U.A.E CONNECTORS IN OPTICAL FIBER MONITORING MARKET, BY TYPE, 2017-2026 (USD MILLION)
TABLE 397 U.A.E OPTICAL FIBER MONITORING MARKET, BY SYSTEM, 2017-2026 (USD MILLION)
TABLE 398 U.A.E OPTICAL FIBER MONITORING MARKET, BY APPLICATION, 2017-2026 (USD MILLION)
TABLE 399 U.A.E DISTRIBUTED SENSING IN OPTICAL FIBER MONITORING MARKET, BY TYPE, 2017-2026 (USD MILLION)
TABLE 400 U.A.E OPTICAL FIBER MONITORING MARKET, BY END-USER, 2017-2026 (USD MILLION)
TABLE 401 SOUTH AFRICA OPTICAL FIBER MONITORING MARKET, BY COMPONENT, 2017-2026 (USD MILLION)
TABLE 402 SOUTH AFRICA HARDWARE IN OPTICAL FIBER MONITORING MARKET, BY TYPE, 2017-2026 (USD MILLION)
TABLE 403 SOUTH AFRICA CABLES IN OPTICAL FIBER MONITORING MARKET, BY TYPE, 2017-2026 (USD MILLION)
TABLE 404 SOUTH AFRICA TRANSCEIVER IN OPTICAL FIBER MONITORING MARKET, BY TYPE, 2017-2026 (USD MILLION)
TABLE 405 SOUTH AFRICA AMPLIFIERS IN OPTICAL FIBER MONITORING MARKET, BY TYPE, 2017-2026 (USD MILLION)
TABLE 406 SOUTH AFRICA CONNECTORS IN OPTICAL FIBER MONITORING MARKET, BY TYPE, 2017-2026 (USD MILLION)
TABLE 407 SOUTH AFRICA OPTICAL FIBER MONITORING MARKET, BY SYSTEM, 2017-2026 (USD MILLION)
TABLE 408 SOUTH AFRICA OPTICAL FIBER MONITORING MARKET, BY APPLICATION, 2017-2026 (USD MILLION)
TABLE 409 SOUTH AFRICA DISTRIBUTED SENSING IN OPTICAL FIBER MONITORING MARKET, BY TYPE, 2017-2026 (USD MILLION)
TABLE 410 SOUTH AFRICA OPTICAL FIBER MONITORING MARKET, BY END-USER, 2017-2026 (USD MILLION)
TABLE 411 ISRAEL OPTICAL FIBER MONITORING MARKET, BY COMPONENT, 2017-2026 (USD MILLION)
TABLE 412 ISRAEL HARDWARE IN OPTICAL FIBER MONITORING MARKET, BY TYPE, 2017-2026 (USD MILLION)
TABLE 413 ISRAEL CABLES IN OPTICAL FIBER MONITORING MARKET, BY TYPE, 2017-2026 (USD MILLION)
TABLE 414 ISRAEL TRANSCEIVER IN OPTICAL FIBER MONITORING MARKET, BY TYPE, 2017-2026 (USD MILLION)
TABLE 415 ISRAEL AMPLIFIERS IN OPTICAL FIBER MONITORING MARKET, BY TYPE, 2017-2026 (USD MILLION)
TABLE 416 ISRAEL CONNECTORS IN OPTICAL FIBER MONITORING MARKET, BY TYPE, 2017-2026 (USD MILLION)
TABLE 417 ISRAEL OPTICAL FIBER MONITORING MARKET, BY SYSTEM, 2017-2026 (USD MILLION)
TABLE 418 ISRAEL OPTICAL FIBER MONITORING MARKET, BY APPLICATION, 2017-2026 (USD MILLION)
TABLE 419 ISRAEL DISTRIBUTED SENSING IN OPTICAL FIBER MONITORING MARKET, BY TYPE, 2017-2026 (USD MILLION)
TABLE 420 ISRAEL OPTICAL FIBER MONITORING MARKET, BY END-USER, 2017-2026 (USD MILLION)
TABLE 421 EGYPT OPTICAL FIBER MONITORING MARKET, BY COMPONENT, 2017-2026 (USD MILLION)
TABLE 422 EGYPT HARDWARE IN OPTICAL FIBER MONITORING MARKET, BY TYPE, 2017-2026 (USD MILLION)
TABLE 423 EGYPT CABLES IN OPTICAL FIBER MONITORING MARKET, BY TYPE, 2017-2026 (USD MILLION)
TABLE 424 EGYPT TRANSCEIVER IN OPTICAL FIBER MONITORING MARKET, BY TYPE, 2017-2026 (USD MILLION)
TABLE 425 EGYPT AMPLIFIERS IN OPTICAL FIBER MONITORING MARKET, BY TYPE, 2017-2026 (USD MILLION)
TABLE 426 EGYPT CONNECTORS IN OPTICAL FIBER MONITORING MARKET, BY TYPE, 2017-2026 (USD MILLION)
TABLE 427 EGYPT OPTICAL FIBER MONITORING MARKET, BY SYSTEM, 2017-2026 (USD MILLION)
TABLE 428 EGYPT OPTICAL FIBER MONITORING MARKET, BY APPLICATION, 2017-2026 (USD MILLION)
TABLE 429 EGYPT DISTRIBUTED SENSING IN OPTICAL FIBER MONITORING MARKET, BY TYPE, 2017-2026 (USD MILLION)
TABLE 430 EGYPT OPTICAL FIBER MONITORING MARKET, BY END-USER, 2017-2026 (USD MILLION)
TABLE 431 REST OF MIDDLE EAST AND AFRICA OPTICAL FIBER MONITORING MARKET, BY COMPONENT, 2017-2026 (USD MILLION)
Lista de figuras
FIGURE 1 GLOBAL OPTICAL FIBER MONITORING MARKET: SEGMENTATION
FIGURE 2 GLOBAL OPTICAL FIBER MONITORING MARKET: DATA VALIDATION MODEL
FIGURE 3 GLOBAL OPTICAL FIBER MONITORING MARKET: DROC ANALYSIS
FIGURE 4 GLOBAL OPTICAL FIBER MONITORING MARKET: GLOBAL VS REGIONAL MARKET ANALYSIS
FIGURE 5 GLOBAL OPTICAL FIBER MONITORING MARKET: COMPANY RESEARCH ANALYSIS
FIGURE 6 GLOBAL OPTICAL FIBER MONITORING MARKET: INTERVIEW DEMOGRAPHICS
FIGURE 7 GLOBAL OPTICAL FIBER MONITORING MARKET: DBMR MARKET POSITION GRID
FIGURE 8 GLOBAL OPTICAL FIBER MONITORING MARKET: THE MARKET CHALLENGE MATRIX
FIGURE 9 GLOBAL OPTICAL FIBER MONITORING MARKET: APPLICATION GRID
FIGURE 10 GLOBAL OPTICAL FIBER MONITORING MARKET: THE MARKET TIMELINE
FIGURE 11 GLOBAL OPTICAL FIBER MONITORING MARKET: THE MULTIVARIATE MODEL
FIGURE 12 GLOBAL OPTICAL FIBER MONITORING MARKET: COMPANY SHARE ANALYSIS
FIGURE 13 DRIVERS, RESTRAINTS, OPPORTUNITIES AND CHALLENGE OF THE GLOBAL OPTICAL FIBER MONITORING MARKET
FIGURE 14 GLOBAL ADOPTION OF FIBER OPTIC CABLES IN 2017
FIGURE 15 COUNTRY WISE COMPARISONS OF FIBER SUBSCRIPTIONS IN 2015 & 2018
FIGURE 16 NUMBER OF INTERNET USERS REGION WISE (AS PER MARCH, 2019) (IN MILLIONS)
FIGURE 17 GLOBAL OPTICAL FIBER MONITORING MARKET: SEGMENTATION
FIGURE 18 ASIA-PACIFIC IS ANTICIPATED TO DOMINATE THE OPTICAL FIBER MONITORING MARKET AND NORTH AMERICA IS ESTIMATED TO BE INCREASING WITH THE HIGHEST CAGR IN THE FORECAST PERIOD OF 2019 TO 2026
FIGURE 19 SHIFT FROM COPPER CABLES TO OPTICAL FIBER CABLES, RISE IN BANDWIDTH OF OPTICAL FIBER NETWORK AND LEAKAGE DETECTION IN OIL & GAS INDUSTRY IS EXPECTED TO DRIVE THE GLOBAL OPTICAL FIBER MONITORING MARKET IN THE FORECAST PERIOD 2019 TO 2026
FIGURE 20 HARDWARE IS EXPECTED TO ACCOUNT FOR THE LARGEST SHARE OF THE OPTICAL FIBER MONITORING MARKET IN 2019 & 2026
FIGURE 21 NORTH AMERICA IS THE MAXIMUM GROWING AND MOST PROFITABLE REVENUE POCKETS FOR OPTICAL FIBER MONITORING MARKET IN THE FORECAST PERIOD OF 2019 TO 2026
FIGURE 22 GLOBAL OPTICAL FIBER MONITORING MARKET: BY COMPONENT, 2018
FIGURE 23 GLOBAL OPTICAL FIBER MONITORING MARKET: BY SYSTEM, 2018
FIGURE 24 GLOBAL OPTICAL FIBER MONITORING MARKET: BY APPLICATION, 2018
FIGURE 25 GLOBAL OPTICAL FIBER MONITORING MARKET: BY END-USER, 2018
FIGURE 26 GLOBAL OPTICAL FIBER MONITORING MARKET: SNAPSHOT (2018)
FIGURE 27 GLOBAL OPTICAL FIBER MONITORING MARKET: BY GEOGRAPHY (2018)
FIGURE 28 GLOBAL OPTICAL FIBER MONITORING MARKET: BY GEOGRAPHY (2019 & 2026)
FIGURE 29 GLOBAL OPTICAL FIBER MONITORING MARKET: BY GEOGRAPHY (2018 & 2026)
FIGURE 30 GLOBAL OPTICAL FIBER MONITORING MARKET: BY COMPONENT (2019-2026)
FIGURE 31 NORTH AMERICA OPTICAL FIBER MONITORING MARKET: SNAPSHOT (2018)
FIGURE 32 NORTH AMERICA OPTICAL FIBER MONITORING MARKET: BY COUNTRY (2018)
FIGURE 33 NORTH AMERICA OPTICAL FIBER MONITORING MARKET: BY COUNTRY (2019 & 2026)
FIGURE 34 NORTH AMERICA OPTICAL FIBER MONITORING MARKET: BY COUNTRY (2018 & 2026)
FIGURE 35 NORTH AMERICA OPTICAL FIBER MONITORING MARKET: BY COMPONENT (2019-2026)
FIGURE 36 EUROPE OPTICAL FIBER MONITORING MARKET: SNAPSHOT (2018)
FIGURE 37 EUROPE OPTICAL FIBER MONITORING MARKET: BY COUNTRY (2018)
FIGURE 38 EUROPE OPTICAL FIBER MONITORING MARKET: BY COUNTRY (2019 & 2026)
FIGURE 39 EUROPE OPTICAL FIBER MONITORING MARKET: BY COUNTRY (2018 & 2026)
FIGURE 40 EUROPE OPTICAL FIBER MONITORING MARKET: BY COMPONENT (2019-2026)
FIGURE 41 ASIA-PACIFIC OPTICAL FIBER MONITORING MARKET: SNAPSHOT (2018)
FIGURE 42 ASIA-PACIFIC OPTICAL FIBER MONITORING MARKET: BY COUNTRY (2018)
FIGURE 43 ASIA-PACIFIC OPTICAL FIBER MONITORING MARKET: BY COUNTRY (2019 & 2026)
FIGURE 44 ASIA-PACIFIC OPTICAL FIBER MONITORING MARKET: BY COUNTRY (2018 & 2026)
FIGURE 45 ASIA-PACIFIC OPTICAL FIBER MONITORING MARKET: BY COMPONENT (2019-2026)
FIGURE 46 SOUTH AMERICA OPTICAL FIBER MONITORING MARKET: SNAPSHOT (2018)
FIGURE 47 SOUTH AMERICA OPTICAL FIBER MONITORING MARKET: BY COUNTRY (2018)
FIGURE 48 SOUTH AMERICA OPTICAL FIBER MONITORING MARKET: BY COUNTRY (2019 & 2026)
FIGURE 49 SOUTH AMERICA OPTICAL FIBER MONITORING MARKET: BY COUNTRY (2018 & 2026)
FIGURE 50 SOUTH AMERICA OPTICAL FIBER MONITORING MARKET: BY COMPONENT (2019-2026)
FIGURE 51 MIDDLE EAST AND AFRICA OPTICAL FIBER MONITORING MARKET: SNAPSHOT (2018)
FIGURE 52 MIDDLE EAST AND AFRICA OPTICAL FIBER MONITORING MARKET: BY COUNTRY (2018)
FIGURE 53 MIDDLE EAST AND AFRICA OPTICAL FIBER MONITORING MARKET: BY COUNTRY (2019 & 2026)
FIGURE 54 MIDDLE EAST AND AFRICA OPTICAL FIBER MONITORING MARKET: BY COUNTRY (2018 & 2026)
FIGURE 55 MIDDLE EAST AND AFRICA OPTICAL FIBER MONITORING MARKET: BY COMPONENT (2019-2026)
FIGURE 56 GLOBAL OPTICAL FIBER MONITORING MARKET: COMPANY SHARE 2018 (%)
FIGURE 57 NORTH AMERICA OPTICAL FIBER MONITORING MARKET: COMPANY SHARE 2018 (%)
FIGURE 58 EUROPE] OPTICAL FIBER MONITORING MARKET: COMPANY SHARE 2018 (%)
FIGURE 59 ASIA-PACIFIC OPTICAL FIBER MONITORING MARKET: COMPANY SHARE 2018 (%)
Metodología de investigación
La recopilación de datos y el análisis del año base se realizan utilizando módulos de recopilación de datos con muestras de gran tamaño. La etapa incluye la obtención de información de mercado o datos relacionados a través de varias fuentes y estrategias. Incluye el examen y la planificación de todos los datos adquiridos del pasado con antelación. Asimismo, abarca el examen de las inconsistencias de información observadas en diferentes fuentes de información. Los datos de mercado se analizan y estiman utilizando modelos estadísticos y coherentes de mercado. Además, el análisis de la participación de mercado y el análisis de tendencias clave son los principales factores de éxito en el informe de mercado. Para obtener más información, solicite una llamada de un analista o envíe su consulta.
La metodología de investigación clave utilizada por el equipo de investigación de DBMR es la triangulación de datos, que implica la extracción de datos, el análisis del impacto de las variables de datos en el mercado y la validación primaria (experto en la industria). Los modelos de datos incluyen cuadrícula de posicionamiento de proveedores, análisis de línea de tiempo de mercado, descripción general y guía del mercado, cuadrícula de posicionamiento de la empresa, análisis de patentes, análisis de precios, análisis de participación de mercado de la empresa, estándares de medición, análisis global versus regional y de participación de proveedores. Para obtener más información sobre la metodología de investigación, envíe una consulta para hablar con nuestros expertos de la industria.
Personalización disponible
Data Bridge Market Research es líder en investigación formativa avanzada. Nos enorgullecemos de brindar servicios a nuestros clientes existentes y nuevos con datos y análisis que coinciden y se adaptan a sus objetivos. El informe se puede personalizar para incluir análisis de tendencias de precios de marcas objetivo, comprensión del mercado de países adicionales (solicite la lista de países), datos de resultados de ensayos clínicos, revisión de literatura, análisis de mercado renovado y base de productos. El análisis de mercado de competidores objetivo se puede analizar desde análisis basados en tecnología hasta estrategias de cartera de mercado. Podemos agregar tantos competidores sobre los que necesite datos en el formato y estilo de datos que esté buscando. Nuestro equipo de analistas también puede proporcionarle datos en archivos de Excel sin procesar, tablas dinámicas (libro de datos) o puede ayudarlo a crear presentaciones a partir de los conjuntos de datos disponibles en el informe.

