
Global Mri Scanner Market
Tamaño del mercado en miles de millones de dólares
Tasa de crecimiento anual compuesta (CAGR) :
% 
 USD
6.88 Billion
USD
10.15 Billion
2024
2032
USD
6.88 Billion
USD
10.15 Billion
2024
2032
| 2025 –2032 | |
| USD 6.88 Billion | |
| USD 10.15 Billion | |
| % | |
|
Segmentación del mercado global de escáneres de resonancia magnética, por tipo (tipo portátil, tipo de escritorio), producto (sistemas de resonancia magnética cerrados y sistemas de resonancia magnética abiertos), aplicación (oncología, neurología, cardiología, aplicaciones pélvicas y abdominales, musculoesqueléticas y otras), usuario final (hospital, clínica, centros quirúrgicos ambulatorios, investigación científica y otros), canal de distribución (licitación directa, ventas minoristas): tendencias de la industria y pronóstico hasta 2032
Análisis del mercado de escáneres de resonancia magnética
La creciente población geriátrica y el aumento del ingreso per cápita son los principales impulsores que han impulsado la demanda del mercado de escáneres de resonancia magnética en el período de pronóstico.
Tamaño del mercado de escáneres de resonancia magnética
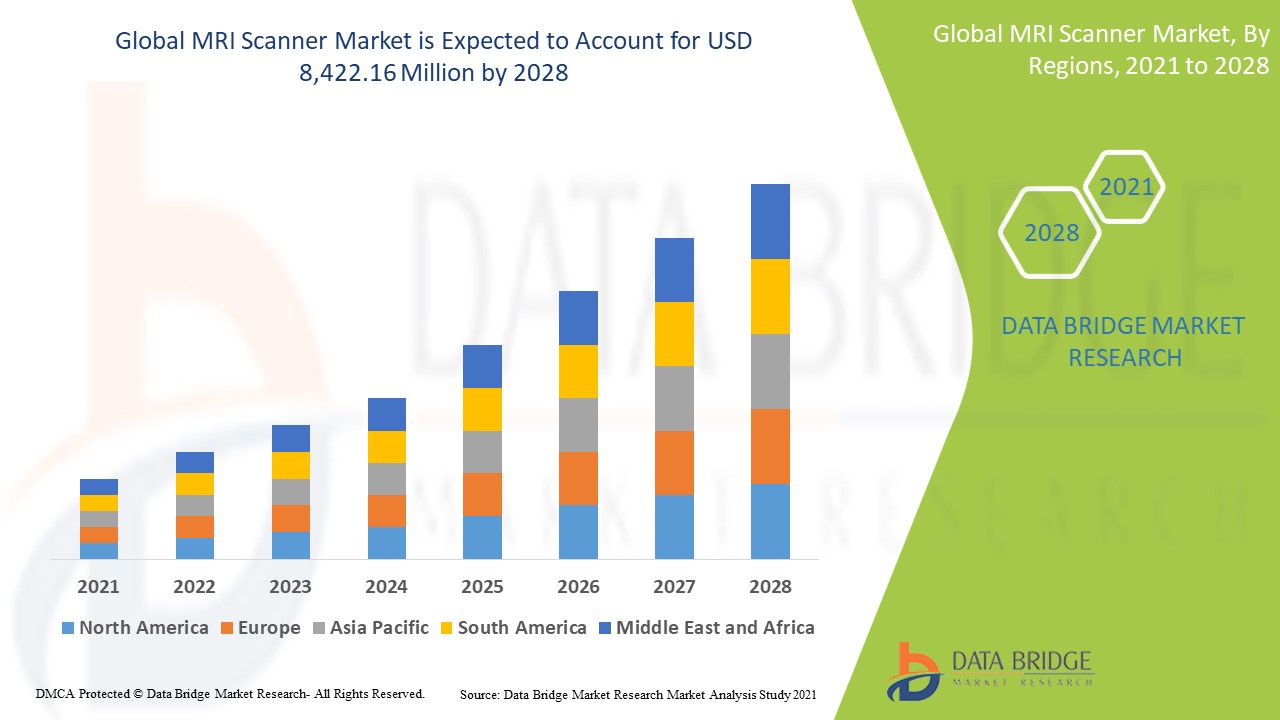
El tamaño del mercado global de escáneres de resonancia magnética se valoró en USD 6.88 mil millones en 2024 y se proyecta que alcance los USD 10.15 mil millones para 2032, con una CAGR del 4.98% durante el período de pronóstico de 2025 a 2032. Además de los conocimientos sobre escenarios de mercado como el valor de mercado, la tasa de crecimiento, la segmentación, la cobertura geográfica y los principales actores, los informes de mercado seleccionados por Data Bridge Market Research también incluyen un análisis profundo de expertos, epidemiología del paciente, análisis de la cartera, análisis de precios y marco regulatorio.
Alcance del informe y segmentación del mercado de escáneres de resonancia magnética
|
Atributos |
Información clave sobre el mercado de los escáneres de resonancia magnética |
|
Segmentos cubiertos |
|
|
Países cubiertos |
EE. UU., Canadá y México en América del Norte, Alemania, Francia, Reino Unido, Países Bajos, Suiza, Bélgica, Rusia, Italia, España, Turquía, Resto de Europa en Europa, China, Japón, India, Corea del Sur, Singapur, Malasia, Australia, Tailandia, Indonesia, Filipinas, Resto de Asia-Pacífico (APAC) en Asia-Pacífico (APAC), Arabia Saudita, Emiratos Árabes Unidos, Sudáfrica, Egipto, Israel, Resto de Medio Oriente y África (MEA) como parte de Medio Oriente y África (MEA), Brasil, Argentina y Resto de América del Sur como parte de América del Sur. |
|
Actores clave del mercado |
Aspect Imaging (Israel), CANON MEDICAL SYSTEMS CORPORATION (una subsidiaria de Canon Inc.) (Japón), Siemens Healthcare GmbH (Alemania), GE Healthcare (EE. UU.), Hitachi, Ltd. (Japón), Koninklijke Philips NV (Países Bajos), Neusoft Corporation (China), ESAOTE SPA (Italia), FONAR Corp. (EE. UU.), Synaptive Medical (Canadá), AllTech Medical Systems (China), Shanghai United Imaging Medical Technology Co., Ltd. (China), Medonica Co. LTD (Corea del Sur), IMRIS (EE. UU.), Promaxo (EE. UU.), Aurora Healthcare US Corp (EE. UU.), SG HealthCare (Corea del Sur), Elekta AB (Suecia), Beijing Wandong Medical Technology Co., Ltd. (China), ASG Superconductors spa (Italia), MinFound Medical Systems Co., Ltd. (China), Hyperfine (EE. UU.), SternMed GmbH (Alemania), Time Medical Holding (Hong Kong) |
|
Conjuntos de información de datos de valor añadido |
Además de la información sobre escenarios de mercado como valor de mercado, tasa de crecimiento, segmentación, cobertura geográfica y actores principales, los informes de mercado seleccionados por Data Bridge Market Research también incluyen análisis profundo de expertos, epidemiología de pacientes, análisis de canalización, análisis de precios y marco regulatorio. |
Definición del mercado de escáneres de resonancia magnética
El escáner de resonancia magnética es un tipo de técnica avanzada de obtención de imágenes médicas que utiliza campos magnéticos, gradientes de campos magnéticos y ondas de radio para capturar imágenes del interior del cuerpo del paciente. El escáner de resonancia magnética tiene varias ventajas en comparación con otras modalidades de obtención de imágenes. El escáner de resonancia magnética incluye un campo electromagnético y un gran campo magnético estático para producir imágenes detalladas.
Dinámica del mercado de escáneres de resonancia magnética
Conductores
La creciente prevalencia de enfermedades crónicas está actuando como un factor impulsor del crecimiento del mercado de escáneres de resonancia magnética. El aumento en el uso de productos de resonancia magnética reacondicionados y reutilizados está actuando como un freno para el mercado de escáneres de resonancia magnética.
Oportunidades
El aumento del gasto y la infraestructura sanitaria en todo el mundo está actuando como una oportunidad para el mercado de escáneres de resonancia magnética.
Restricciones/Desafíos
Las estrictas regulaciones y estándares para la aprobación y comercialización de dispositivos de resonancia magnética representan un desafío para el mercado de escáneres de resonancia magnética.
Este informe de mercado proporciona detalles de los nuevos desarrollos recientes, regulaciones comerciales, análisis de importación y exportación, análisis de producción, optimización de la cadena de valor, participación de mercado, impacto de los actores del mercado nacional y localizado, analiza las oportunidades en términos de bolsillos de ingresos emergentes, cambios en las regulaciones del mercado, análisis estratégico del crecimiento del mercado, tamaño del mercado, crecimientos del mercado de categorías, nichos de aplicación y dominio, aprobaciones de productos, lanzamientos de productos, expansiones geográficas, innovaciones tecnológicas en el mercado. Para obtener más información sobre el mercado, comuníquese con Data Bridge Market Research para obtener un informe de analista, nuestro equipo lo ayudará a tomar una decisión de mercado informada para lograr el crecimiento del mercado.
Alcance del mercado de los escáneres de resonancia magnética
El mercado está segmentado en función del tipo, producto, aplicación, usuario final y canal de distribución. El crecimiento entre estos segmentos le ayudará a analizar los segmentos de crecimiento reducido de las industrias y brindará a los usuarios una valiosa descripción general del mercado y conocimientos del mercado para ayudarlos a tomar decisiones estratégicas para identificar las principales aplicaciones del mercado.
Tipo
- Tipo portátil
- Tipo de escritorio
Producto
- Sistemas de resonancia magnética cerrados
- Sistemas de resonancia magnética abiertos
Solicitud
- Oncología
- Neurología
- Cardiología
- Pélvico y abdominal
- Músculoesquelético
- Otras aplicaciones
Usuario final
- Hospital
- Clínica
- Centros de cirugía ambulatoria
- Investigación científica
- Otro
Canal de distribución
- Licitación directa
- Ventas al por menor
Análisis regional del mercado de escáneres de resonancia magnética
Se analiza el mercado y se proporcionan información y tendencias del tamaño del mercado por país, tipo, producto, aplicación, usuario final y canal de distribución como se menciona anteriormente.
Los países cubiertos en el informe de mercado son EE. UU., Canadá y México en América del Norte, Alemania, Francia, Reino Unido, Países Bajos, Suiza, Bélgica, Rusia, Italia, España, Turquía, Resto de Europa en Europa, China, Japón, India, Corea del Sur, Singapur, Malasia, Australia, Tailandia, Indonesia, Filipinas, Resto de Asia-Pacífico (APAC) en Asia-Pacífico (APAC), Arabia Saudita, Emiratos Árabes Unidos, Sudáfrica, Egipto, Israel, Resto de Medio Oriente y África (MEA) como parte de Medio Oriente y África (MEA), Brasil, Argentina y Resto de América del Sur como parte de América del Sur.
Estados Unidos domina el mercado de escáneres de resonancia magnética en América del Norte, ya que se espera que el segmento de tipo de escritorio en la región de América del Norte crezca con la tasa de crecimiento más alta en el período de pronóstico de 2025 a 2032 debido al creciente uso de escáneres de resonancia magnética durante el diagnóstico. Japón es el país líder en el crecimiento del mercado de escáneres de resonancia magnética de Asia y el Pacífico debido al crecimiento de la población geriátrica, así como a los avances tecnológicos en el sector de la salud. El Reino Unido domina el mercado de escáneres de resonancia magnética de Europa debido al aumento del gasto en atención médica en la región.
La sección de países del informe también proporciona factores de impacto de mercado individuales y cambios en la regulación en el mercado a nivel nacional que afectan las tendencias actuales y futuras del mercado. Los puntos de datos como el análisis de la cadena de valor aguas arriba y aguas abajo, las tendencias técnicas y el análisis de las cinco fuerzas de Porter, los estudios de casos son algunos de los indicadores utilizados para pronosticar el escenario del mercado para países individuales. Además, la presencia y disponibilidad de marcas globales y sus desafíos enfrentados debido a la competencia grande o escasa de las marcas locales y nacionales, el impacto de los aranceles nacionales y las rutas comerciales se consideran al proporcionar un análisis de pronóstico de los datos del país.
Cuota de mercado de los escáneres de resonancia magnética
El panorama competitivo del mercado proporciona detalles por competidor. Los detalles incluidos son una descripción general de la empresa, las finanzas de la empresa, los ingresos generados, el potencial de mercado, la inversión en investigación y desarrollo, las nuevas iniciativas de mercado, la presencia global, los sitios e instalaciones de producción, las capacidades de producción, las fortalezas y debilidades de la empresa, el lanzamiento de productos, la amplitud y variedad de productos, y el dominio de las aplicaciones. Los puntos de datos anteriores proporcionados solo están relacionados con el enfoque de las empresas en relación con el mercado.
Los líderes del mercado de escáneres de resonancia magnética que operan en el mercado son:
- Imágenes de aspecto (Israel)
- CANON MEDICAL SYSTEMS CORPORATION (una subsidiaria de Canon Inc.) (Japón)
- Siemens Healthcare GmbH (Alemania)
- GE Healthcare (Estados Unidos)
- Hitachi, Ltd. (Japón)
- Koninklijke Philips NV (Países Bajos)
- Corporación Neusoft (China)
- ESAOTE SPA (Italia)
- FONAR Corp. (Estados Unidos)
- Synaptive Medical (Canadá)
- Sistemas médicos AllTech (China)
- Shanghai United Imaging Medical Technology Co., Ltd. (China)
- Medonica Co. LTD (Corea del Sur)
- IMRIS (Estados Unidos)
- Promaxo (Estados Unidos)
- Aurora Healthcare US Corp (Estados Unidos)
- SG HealthCare (Corea del Sur)
- Elekta AB (Suecia)
- Beijing Wandong Medical Technology Co., Ltd. (China)
- ASG Superconductors spa (Italia)
- MinFound Medical Systems Co., Ltd. (China)
- Hiperfina (EE.UU.)
- SternMed GmbH (Alemania)
- Time Medical Holding (Hong Kong)
Últimos avances en el mercado de escáneres de resonancia magnética
- En diciembre de 2019, Siemens Healthcare GmbH anunció el lanzamiento de varios asistentes de software basados en inteligencia artificial (IA) diseñados especialmente para liberar a los radiólogos de la carga de realizar actividades rutinarias durante los exámenes de resonancia magnética (IRM). Tras el lanzamiento de este tipo de software innovador para la resonancia magnética (IRM), la empresa mejoró la credibilidad de su cartera de productos.
SKU-
Obtenga acceso en línea al informe sobre la primera nube de inteligencia de mercado del mundo

- Panel de análisis de datos interactivo
- Panel de análisis de empresas para oportunidades con alto potencial de crecimiento
- Acceso de analista de investigación para personalización y consultas
- Análisis de la competencia con panel interactivo
- Últimas noticias, actualizaciones y análisis de tendencias
- Aproveche el poder del análisis de referencia para un seguimiento integral de la competencia
Metodología de investigación
La recopilación de datos y el análisis del año base se realizan utilizando módulos de recopilación de datos con muestras de gran tamaño. La etapa incluye la obtención de información de mercado o datos relacionados a través de varias fuentes y estrategias. Incluye el examen y la planificación de todos los datos adquiridos del pasado con antelación. Asimismo, abarca el examen de las inconsistencias de información observadas en diferentes fuentes de información. Los datos de mercado se analizan y estiman utilizando modelos estadísticos y coherentes de mercado. Además, el análisis de la participación de mercado y el análisis de tendencias clave son los principales factores de éxito en el informe de mercado. Para obtener más información, solicite una llamada de un analista o envíe su consulta.
La metodología de investigación clave utilizada por el equipo de investigación de DBMR es la triangulación de datos, que implica la extracción de datos, el análisis del impacto de las variables de datos en el mercado y la validación primaria (experto en la industria). Los modelos de datos incluyen cuadrícula de posicionamiento de proveedores, análisis de línea de tiempo de mercado, descripción general y guía del mercado, cuadrícula de posicionamiento de la empresa, análisis de patentes, análisis de precios, análisis de participación de mercado de la empresa, estándares de medición, análisis global versus regional y de participación de proveedores. Para obtener más información sobre la metodología de investigación, envíe una consulta para hablar con nuestros expertos de la industria.
Personalización disponible
Data Bridge Market Research es líder en investigación formativa avanzada. Nos enorgullecemos de brindar servicios a nuestros clientes existentes y nuevos con datos y análisis que coinciden y se adaptan a sus objetivos. El informe se puede personalizar para incluir análisis de tendencias de precios de marcas objetivo, comprensión del mercado de países adicionales (solicite la lista de países), datos de resultados de ensayos clínicos, revisión de literatura, análisis de mercado renovado y base de productos. El análisis de mercado de competidores objetivo se puede analizar desde análisis basados en tecnología hasta estrategias de cartera de mercado. Podemos agregar tantos competidores sobre los que necesite datos en el formato y estilo de datos que esté buscando. Nuestro equipo de analistas también puede proporcionarle datos en archivos de Excel sin procesar, tablas dinámicas (libro de datos) o puede ayudarlo a crear presentaciones a partir de los conjuntos de datos disponibles en el informe.

