
Global Mobile C Arm Equipment Market
Tamaño del mercado en miles de millones de dólares
Tasa de crecimiento anual compuesta (CAGR) :
% 
 USD
2.02 Billion
USD
3.08 Billion
2021
2029
USD
2.02 Billion
USD
3.08 Billion
2021
2029
| 2022 –2029 | |
| USD 2.02 Billion | |
| USD 3.08 Billion | |
| % | |
|
Mercado mundial de equipos de arco en C móviles, por tipo (arcos en C mini, arcos en C de tamaño completo, arcos en C móviles 2D, 3D, arcos en C móviles), tecnología (intensificadores de imagen, panel plano), aplicación (ortopedia y traumatología, cirugías, cirugías cardiovasculares, neurocirugías, cirugías gastrointestinales, manejo del dolor, cirugía general, urología, otras), usuario final (hospital, centros de diagnóstico, clínicas especializadas, otras), canal de distribución (licitación directa, ventas minoristas): tendencias de la industria y pronóstico hasta 2029
Análisis y tamaño del mercado
Un arco en C móvil es un tipo de dispositivo de imágenes médicas que utiliza tecnología de rayos X para capturar imágenes de los órganos internos humanos. El dispositivo tiene forma de C y está conectado a la fuente y al detector de rayos X. El dispositivo se utiliza en una variedad de aplicaciones médicas que utilizan arcos en C para imágenes intraoperatorias, incluidas cirugía, ortopedia, traumatología, cirugía vascular y cardiología.
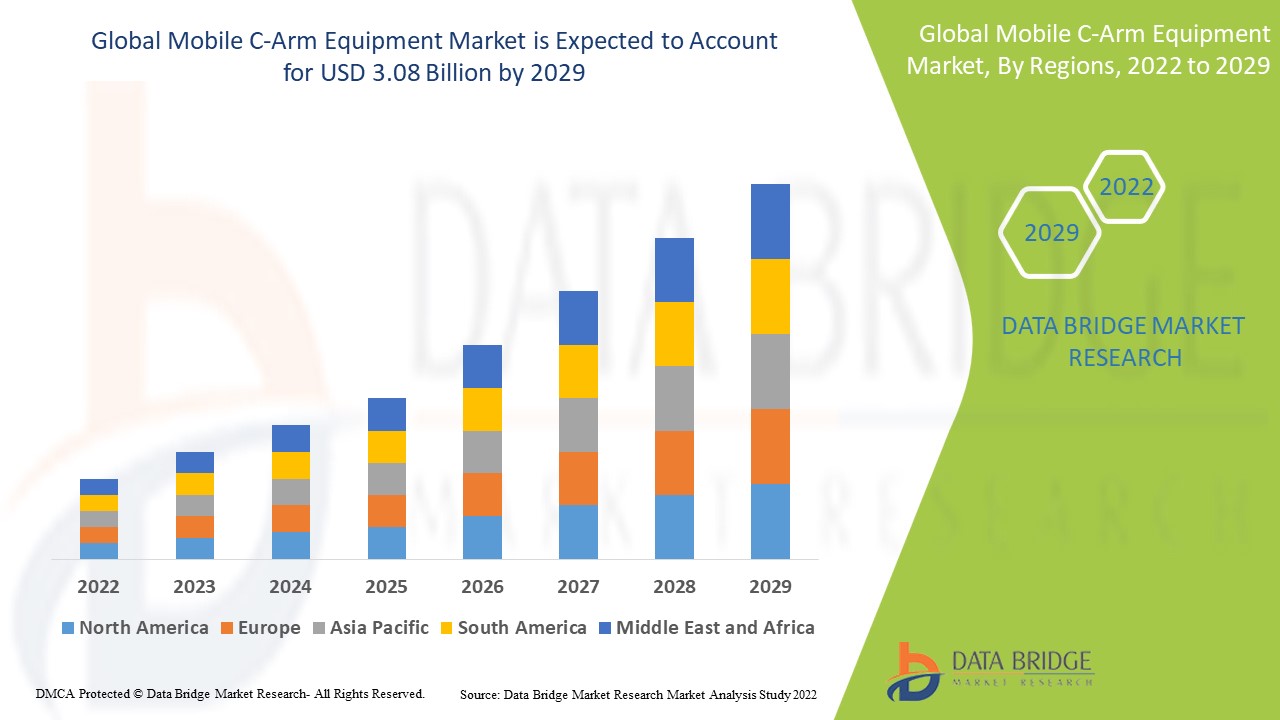
Data Bridge Market Research analiza que el mercado de equipos de arco en C móviles, que fue de USD 2.02 mil millones en 2021, se disparará hasta USD 3.08 mil millones para 2029, y se espera que experimente una CAGR del 5,40% durante el período de pronóstico de 2022 a 2029. Además de los conocimientos del mercado, como el valor de mercado, la tasa de crecimiento, los segmentos del mercado, la cobertura geográfica, los actores del mercado y el escenario del mercado, el informe de mercado curado por el equipo de Data Bridge Market Research también incluye un análisis de expertos en profundidad, epidemiología del paciente, análisis de la cartera, análisis de precios y marco regulatorio.
Alcance del informe y segmentación del mercado
|
Métrica del informe |
Detalles |
|
Período de pronóstico |
2022 a 2029 |
|
Año base |
2021 |
|
Años históricos |
2020 (Personalizable para 2014 - 2019) |
|
Unidades cuantitativas |
Ingresos en miles de millones de USD, volúmenes en unidades, precios en USD |
|
Segmentos cubiertos |
Tipo (Arcos en C mini, Arcos en C de tamaño completo, Arcos en C móviles 2D, Arcos en C móviles 3D), Tecnología (Intensificadores de imagen, Panel plano), Aplicación (Ortopedia y traumatología, Cirugías, Cirugías cardiovasculares, Neurocirugías, Cirugías gastrointestinales, Manejo del dolor, Cirugía general, Urología, Otras), Usuario final (Hospital, Centros de diagnóstico, Clínicas especializadas, Otras), Canal de distribución (Licitación directa, Ventas minoristas) |
|
Países cubiertos |
EE. UU., Canadá y México en América del Norte, Alemania, Francia, Reino Unido, Países Bajos, Suiza, Bélgica, Rusia, Italia, España, Turquía, Resto de Europa en Europa, China, Japón, India, Corea del Sur, Singapur, Malasia, Australia, Tailandia, Indonesia, Filipinas, Resto de Asia-Pacífico (APAC) en Asia-Pacífico (APAC), Arabia Saudita, Emiratos Árabes Unidos, Sudáfrica, Egipto, Israel, Resto de Medio Oriente y África (MEA) como parte de Medio Oriente y África (MEA), Brasil, Argentina y Resto de América del Sur como parte de América del Sur |
|
Actores del mercado cubiertos |
|
|
Oportunidades de mercado |
|
Definición de mercado
El arco C móvil es un módulo de imágenes basado en tecnología avanzada que proporciona imágenes de rayos X de alta resolución en tiempo real, lo que permite al médico monitorear la enfermedad o su progreso en cualquier momento durante la cirugía y realizar las modificaciones necesarias.
Dinámica del mercado de equipos de arco en C móviles
Conductores
- Aumento de la necesidad de arcos C móviles
La creciente necesidad de arcos en C móviles en operaciones ortopédicas y traumatológicas, así como los avances en la tecnología de diagnóstico por imagen, han hecho que la demanda de arcos en C móviles haya aumentado en comparación con el año anterior. Además, con el aumento de los gastos y la infraestructura de atención sanitaria en todo el mundo, la demanda de arcos en C transportables ha aumentado drásticamente.
- Uso de sistemas de imágenes
Los sistemas de diagnóstico por imagen se han convertido en un equipamiento necesario en prácticamente todos los hospitales bien equipados. Los arcos en C se utilizan para la obtención de imágenes intraoperatorias por especialistas como cirugía, ortopedia, traumatología, cirugía vascular y cardiología. Los aparatos proporcionan imágenes de rayos X de alta resolución en tiempo real, lo que permite a los médicos controlar el progreso en cualquier momento durante el procedimiento. Como resultado, se mejoran los resultados de la terapia y se reduce el tiempo de recuperación del paciente.
- Uso del arco C en el campo médico
En la actualidad, los arcos en C se emplean en diversos campos médicos y se prevé que su uso se amplíe en el futuro. El mercado de los arcos en C está impulsado por estos factores y por la creciente demanda de infraestructura sanitaria en los países en desarrollo.
Oportunidades
Una economía de mercado emergente está en proceso de pasar de ser una economía de bajos ingresos, subdesarrollada y típicamente preindustrial a una economía industrial moderna con una mejor calidad de vida. Los principales impulsores de la mayor demanda de arcos en C en esta región incluyen el aumento de los costos de la atención médica, los avances de los productos y el aumento de las operaciones quirúrgicas. En estos países en desarrollo, las empresas se expanden continuamente y lanzan nuevos productos. Por ejemplo, Trivitron Healthcare, con sede en la India, lanzó el arco en C digital de panel plano Elite con movimientos motorizados en enero de 2020.
Restricciones/Desafíos
Esto se debe al alto costo de varias máquinas de arco en C digitales portátiles y avanzadas de reciente creación que actualmente están disponibles en el mercado mundial, así como a la asequibilidad de los mercados regionales. Debido al mayor costo de los arcos en C contemporáneos, los mercados menos desarrollados de Asia Pacífico y Sudamérica aún dependen de una variedad de sistemas fijos tradicionales y arcos en C renovados. Se espera que esto limite el mercado global de arcos en C móviles.
Este informe de mercado de equipos de arco en C móviles proporciona detalles de nuevos desarrollos recientes, regulaciones comerciales, análisis de importación y exportación, análisis de producción, optimización de la cadena de valor, participación de mercado, impacto de los actores del mercado nacional y localizado, analiza oportunidades en términos de bolsillos de ingresos emergentes, cambios en las regulaciones del mercado, análisis estratégico del crecimiento del mercado, tamaño del mercado, crecimientos del mercado de categorías, nichos de aplicación y dominio, aprobaciones de productos, lanzamientos de productos, expansiones geográficas, innovaciones tecnológicas en el mercado. Para obtener más información sobre el mercado de equipos de arco en C móviles, comuníquese con Data Bridge Market Research para obtener un informe de analista, nuestro equipo lo ayudará a tomar una decisión de mercado informada para lograr el crecimiento del mercado.
Impacto de COVID-19 en el mercado de equipos de arco en C móviles
Se prevé que el negocio de los arcos en C móviles se vea afectado por la pandemia de COVID-19. Las cirugías guiadas por imágenes, que generalmente son electivas y se pospusieron debido a la COVID-19, se realizan utilizando arcos en C móviles. Esto puede haber llevado a los hospitales a evitar compras de equipos de capital de alto costo durante la epidemia actual, centrándose en cambio en respiradores y otros equipos de apoyo al tratamiento de COVID-19. Según un estudio publicado en el British Journal of Surgery, se predijo que alrededor de 28,4 millones de procedimientos electivos en todo el mundo se cancelarían o pospondrían en mayo de 2020, sobre la base de 12 semanas de interrupción máxima del servicio hospitalario debido a COVID-19. Como resultado del brote de COVID-19, más de 580.000 cirugías en la India han sido canceladas o pospuestas. Sin embargo, según la directriz de la Asociación Europea de Urología, se requiere un quirófano específicamente preparado con un equipo de rayos X fluoroscópicos con arco en C móvil para el personal de radiología y atención médica para el manejo de pacientes positivos a COVID-19 que requieran cirugía. Como resultado, se espera que el mercado mantenga su tasa de crecimiento estable durante el período de pronóstico, debido al aumento de casos de COVID-19 y su importante impacto en los sistemas de salud en toda el área.
Desarrollo reciente
- En febrero de 2019, se lanzó Zenition, una nueva plataforma de imágenes con arco en C móvil de Koninklijke Philips NV, destinada a mejorar el rendimiento del quirófano y la eficiencia del flujo de trabajo. Tras el debut de un nuevo producto, la empresa amplió su cartera de productos.
Alcance del mercado mundial de equipos de arco en C móviles
El mercado de equipos de arco en C móviles está segmentado en función del tipo de producto, la tecnología, la aplicación, el canal de distribución y el usuario final. El crecimiento entre estos segmentos le ayudará a analizar los segmentos de crecimiento reducido de las industrias y brindará a los usuarios una valiosa descripción general del mercado y conocimientos del mercado para ayudarlos a tomar decisiones estratégicas para identificar las principales aplicaciones del mercado.
Tecnología
- Intensificadores de imagen
- Panel plano
Producto
- Arco en C de tamaño completo
- Mini arco en C
Solicitud
- Ortopedía
- Trauma
- Cardiovascular
- Manejo del dolor
- Urología
- Gastroenterología
- Neurología
- Otras aplicaciones
Usuario final
- Hospitales
- Clínicas de especialidades
- Centros de cirugía ambulatoria
Canal de distribución
- Licitación directa
- Ventas al por menor
Análisis y perspectivas regionales del mercado de equipos de arco en C móviles
Se analiza el mercado de equipos de arco en C móviles y se proporcionan información y tendencias del tamaño del mercado por país, tipo de producto, tecnología, aplicación, canal de distribución y usuario final como se menciona anteriormente.
Los países cubiertos en el informe de mercado de equipos de arco en C móviles son EE. UU., Canadá y México en América del Norte, Alemania, Francia, Reino Unido, Países Bajos, Suiza, Bélgica, Rusia, Italia, España, Turquía, Resto de Europa en Europa, China, Japón, India, Corea del Sur, Singapur, Malasia, Australia, Tailandia, Indonesia, Filipinas, Resto de Asia-Pacífico (APAC) en Asia-Pacífico (APAC), Arabia Saudita, Emiratos Árabes Unidos, Sudáfrica, Egipto, Israel, Resto de Medio Oriente y África (MEA) como parte de Medio Oriente y África (MEA), Brasil, Argentina y Resto de Sudamérica como parte de Sudamérica.
Se espera que América del Norte domine el mercado de equipos de arco C móviles, ya que la cantidad de equipos de arco C móviles ha aumentado en los últimos años, debido a la creciente adopción de equipos de arco C móviles para cirugías ortopédicas y traumatológicas, cirugías cardiovasculares, neurocirugías y cirugía general en la región.
Se espera que Asia-Pacífico crezca con la CAGR más alta en el período de pronóstico debido al aumento de la población geriátrica en la región.
La sección de países del informe también proporciona factores de impacto de mercado individuales y cambios en la regulación en el mercado a nivel nacional que afectan las tendencias actuales y futuras del mercado. Puntos de datos como análisis de la cadena de valor aguas abajo y aguas arriba, tendencias técnicas y análisis de las cinco fuerzas de Porter, estudios de casos son algunos de los indicadores utilizados para pronosticar el escenario del mercado para países individuales. Además, la presencia y disponibilidad de marcas globales y sus desafíos enfrentados debido a la competencia grande o escasa de las marcas locales y nacionales, el impacto de los aranceles nacionales y las rutas comerciales se consideran al proporcionar un análisis de pronóstico de los datos del país.
Análisis del panorama competitivo y de la cuota de mercado de equipos de arco en C móviles
El panorama competitivo del mercado de equipos de arco en C móviles proporciona detalles por competidor. Los detalles incluidos son una descripción general de la empresa, las finanzas de la empresa, los ingresos generados, el potencial de mercado, la inversión en investigación y desarrollo, las nuevas iniciativas de mercado, la presencia global, los sitios e instalaciones de producción, las capacidades de producción, las fortalezas y debilidades de la empresa, el lanzamiento de productos, la amplitud y variedad de productos, el dominio de las aplicaciones. Los puntos de datos anteriores proporcionados solo están relacionados con el enfoque de las empresas en relación con el mercado de equipos de arco en C móviles.
Algunos de los principales actores que operan en el mercado de equipos de arco C móviles son:
- General Electric (Estados Unidos)
- Hologic, Inc. (Estados Unidos)
- Koninklijke Philips NV (Países Bajos)
- Siemens (Alemania)
- CORPORACIÓN CANON MEDICAL SYSTEMS (Japón)
- NOVAmedtek (Turquía)
- EcoRay (India)
- Assing SpA (Italia)
- BMI Biomedical International srl (Italia)
- Eurocolumbus srl. (Italia)
- ITALRAY (Italia)
- MS WESTFALIA GMBH (Alemania)
- Corporación Shimadzu (Japón)
- GENORAY CO.LTD (Corea del Sur)
- Spa Villa Systemi Medicali. (Italia)
- Ziehm Imaging GmbH (Alemania)
- INTERMEDICAL Srl Grupo IMD (Italia)
SKU-
Obtenga acceso en línea al informe sobre la primera nube de inteligencia de mercado del mundo

- Panel de análisis de datos interactivo
- Panel de análisis de empresas para oportunidades con alto potencial de crecimiento
- Acceso de analista de investigación para personalización y consultas
- Análisis de la competencia con panel interactivo
- Últimas noticias, actualizaciones y análisis de tendencias
- Aproveche el poder del análisis de referencia para un seguimiento integral de la competencia
Tabla de contenido
1 INTRODUCTION
1.1 OBJECTIVES OF THE STUDY
1.2 MARKET DEFINITION
1.3 OVERVIEW OF GLOBAL MOBILE C-ARM EQUIPMENT MARKET
1.4 LIMITATION
1.5 MARKETS COVERED
2 MARKET SEGMENTATION
2.1 MARKETS COVERED
2.2 GEOGRAPHICAL SCOPE
2.3 YEARS CONSIDERED FOR THE STUDY
2.4 CURRENCY AND PRICING
2.5 DBMR TRIPOD DATA VALIDATION MODEL
2.6 MULTIVARIATE MODELLING
2.7 MARKET APPLICATION COVERAGE GRID
2.8 TYPE LIFELINE CURVE
2.9 PRIMARY INTERVIEWS WITH KEY OPINION LEADERS
2.1 DBMR MARKET POSITION GRID
2.11 VENDOR SHARE ANALYSIS
2.12 SECONDARY SOURCES
2.13 ASSUMPTIONS
3 EXECUTIVE SUMMARY
4 PREMIUM INSIGHTS
5 IMPACT OF COVID-19 ON GLOBAL MOBILE C-ARM EQUIPMENT MARKET
5.1 SUPPLY CHAIN IMPACT ANALYSIS
5.2 DEMAND IMPACT ANALYSIS
5.3 PRICE IMPACT
6 MARKET OVERVIEW
6.1 DRIVERS
6.1.1 RISING GERIATRIC POPULATION
6.1.2 RISING NUMBER OF CHRONIC DISEASES
6.1.3 GROWING EARLY DIAGNOSIS RATE
6.1.4 INCREASING HEALTHCARE EXPENDITURE AND INFRASTRUCTURE ACROSS THE WORLD
6.1.5 ADVANCEMENTS IN IMAGING TECHNOLOGIES
6.2 RESTRAINTS
6.2.1 INCREASING USE OF REFURBISHED AND REUSED PRODUCTS
6.2.2 STRINGENT REGULATIONS FOR COMMERCIALIZATION
6.2.3 PRODUCT RECALLS
6.3 OPPORTUNITIES
6.3.1 RISING AWARENESS OF INTERVENTIONAL SURGERIES
6.3.2 TECHNOLOGICAL ADVANCEMENTS IN C-ARMS
6.4 CHALLENGES
6.4.1 ALTERNATIVE IMAGING MODALITIES POSING THREATS TO C-ARM DEVICES
6.4.2 HIGH COSTS OF THE DEVICES
6.4.3 SIDE EFFECTS OF RADIATIONS
7 GLOBAL MOBILE C-ARM EQUIPMENT MARKET, BY TYPE
7.1 OVERVIEW
7.2 MINI C-ARMS
7.2.1 MINI C-ARMS WITH CONTINUOUS FLUOROSCOPY
7.2.2 MINI C-ARMS WITH CONTINUOUS FLUOROSCOPY
7.3 FULL SIZE C-ARM
7.4 3D MOBILE C-ARMS
7.5 2D MOBILE C-ARMS
8 GLOBAL MOBILE C-ARM EQUIPMENT MARKET, BY TECHNOLOGY
8.1 OVERVIEW
8.2 IMAGE INTENSIFIERS
8.3 FLAT PANEL
9 GLOBAL MOBILE C-ARM EQUIPMENT MARKET, BY APPLICATION
9.1 OVERVIEW
9.2 ORTHOPEDIC AND TRAUMA SURGERIES
9.3 CARDIOVASCULAR SURGERIES
9.4 NEURO SURGERIES
9.5 GASTROINTESTINAL SURGERIES
9.6 PAIN MANAGEMENT
9.7 GENERAL SURGERY
9.8 UROLOGY
9.9 OTHERS
10 GLOBAL MOBILE C-ARM EQUIPMENT MARKET, BY END USER
10.1 OVERVIEW
10.2 HOSPITAL
10.3 DIAGNOSTIC CENTERS
10.4 SPECIALITY CLINICS
10.5 OTHERS
11 GLOBAL MOBILE C-ARM EQUIPMENT MARKET, BY DISTRIBUTION CHANNEL
11.1 OVERVIEW
11.2 DIRECT TENDER
11.3 RETAIL SALES
12 GLOBAL MOBILE C-ARM EQUIPMENT MARKET, BY GEOGRAPHY
12.1 OVERVIEW
12.2 NORTH AMERICA
12.2.1 U.S.
12.2.2 CANADA
12.2.3 MEXICO
12.3 EUROPE
12.3.1 GERMANY
12.3.2 U.K.
12.3.3 FRANCE
12.3.4 ITALY
12.3.5 SPAIN
12.3.6 SWITZERLAND
12.3.7 NETHERLANDS
12.3.8 BELGIUM
12.3.9 RUSSIA
12.3.10 TURKEY
12.3.11 REST OF EUROPE
12.4 ASIA-PACIFIC
12.4.1 CHINA
12.4.2 JAPAN
12.4.3 INDIA
12.4.4 SOUTH KOREA
12.4.5 AUSTRALIA
12.4.6 SINGAPORE
12.4.7 THAILAND
12.4.8 MALAYSIA
12.4.9 INDONESIA
12.4.10 PHILIPPINES
12.4.11 REST OF ASIA-PACIFIC
12.5 SOUTH AMERICA
12.5.1 BRAZIL
12.5.2 ARGENTINA
12.5.3 REST OF SOUTH AMERICA
12.6 MIDDLE EAST AND AFRICA
12.6.1 SOUTH AFRICA
12.6.2 SAUDI ARABIA
12.6.3 UAE
12.6.4 ISRAEL
12.6.5 EGYPT
12.6.6 REST OF MIDDLE EAST AND AFRICA
13 GLOBAL MOBILE C-ARM EQUIPMENT MARKET, COMPANY LANDSCAPE
13.1 COMPANY SHARE ANALYSIS: GLOBAL
13.2 COMPANY SHARE ANALYSIS: NORTH AMERICA
13.3 COMPANY SHARE ANALYSIS: EUROPE
13.4 COMPANY SHARE ANALYSIS: ASIA-PACIFIC
14 SWOT ANALYSIS
15 COMPANY PROFILES
15.1 GE HEALTHCARE (A SUBSIDIARY OF GENERAL ELECTRIC)
15.1.1 COMPANY SNAPSHOT
15.1.2 REVENUE ANALYSIS
15.1.3 COMPANY SHARE ANALYSIS
15.1.4 PRODUCT PORTFOLIO
15.1.5 RECENT DEVELOPMENTS
15.2 KONINKLIJKE PHILIPS N.V.
15.2.1 COMPANY SNAPSHOT
15.2.2 REVENUE ANALYSIS
15.2.3 COMPANY SHARE ANALYSIS
15.2.4 PRODUCT PORTFOLIO
15.2.5 RECENT DEVELOPMENT
15.3 CANON MEDICAL SYSTEMS CORPORATION (A SUBSIDIARY OF CANON INC.)
15.3.1 COMPANY SNAPSHOT
15.3.2 REVENUE ANALYSIS
15.3.3 COMPANY SHARE ANALYSIS
15.3.4 PRODUCT PORTFOLIO
15.3.5 RECENT DEVELOPMENT
15.4 ALLENGERS
15.4.1 COMPANY SNAPSHOT
15.4.2 PRODUCT PORTFOLIO
15.4.3 RECENT DEVELOPMENT
15.5 ASSING S.P.A.
15.5.1 COMPANY SNAPSHOT
15.5.2 PRODUCT PORTFOLIO
15.5.3 RECENT DEVELOPMENT
15.6 BMI BIOMEDICAL INTERNATIONAL S.R.L.
15.6.1 COMPANY SNAPSHOT
15.6.2 PRODUCT PORTFOLIO
15.6.3 RECENT DEVELOPMENT
15.7 DMS IMAGING
15.7.1 COMPANY SNAPSHOT
15.7.2 PRODUCT PORTFOLIO
15.7.3 RECENT DEVELOPMENT
15.8 ECORAY
15.8.1 COMPANY SNAPSHOT
15.8.2 PRODUCT PORTFOLIO
15.8.3 RECENT DEVELOPMENT
15.9 EUROCOLUMBUS SRL
15.9.1 COMPANY SNAPSHOT
15.9.2 PRODUCT PORTFOLIO
15.9.3 RECENT DEVELOPMENT
15.1 GENORAY CO., LTD.
15.10.1 COMPANY SNAPSHOT
15.10.2 REVENUE ANALYSIS
15.10.3 PRODUCT PORTFOLIO
15.10.4 RECENT DEVELOPMENT
15.11 HOLOGIC, INC.
15.11.1 COMPANY SNAPSHOT
15.11.2 REVENUE ANALYSIS
15.11.3 PRODUCT PORTFOLIO
15.11.4 RECENT DEVELOPMENT
15.12 INTERMEDICAL S.R.L. IMD GROUP
15.12.1 COMPANY SNAPSHOT
15.12.2 PRODUCT PORTFOLIO
15.12.3 RECENT DEVELOPMENT
15.13 ITALRAY
15.13.1 COMPANY SNAPSHOT
15.13.2 PRODUCT PORTFOLIO
15.13.3 RECENT DEVELOPMENT
15.14 MS WESTFALIA GMBH
15.14.1 COMPANY SNAPSHOT
15.14.2 PRODUCT PORTFOLIO
15.14.3 RECENT DEVELOPMENT
15.15 NOVAMEDTEK
15.15.1 COMPANY SNAPSHOT
15.15.2 PRODUCT PORTFOLIO
15.15.3 RECENT DEVELOPMENT
15.16 SHIMADZU CORPORATION
15.16.1 COMPANY SNAPSHOT
15.16.2 REVENUE ANALYSIS
15.16.3 PRODUCT PORTFOLIO
15.16.4 RECENT DEVELOPMENTS
15.17 SIEMENS HEALTHINEERS AG
15.17.1 COMPANY SNAPSHOT
15.17.2 REVENUE ANALYSIS
15.17.3 PRODUCT PORTFOLIO
15.17.4 RECENT DEVELOPMENTS
15.18 SIMAD S.R.L
15.18.1 COMPANY SNAPSHOT
15.18.2 PRODUCT PORTFOLIO
15.18.3 RECENT DEVELOPMENT
15.19 VILLA SISTEMI MEDICALI SPA.
15.19.1 COMPANY SNAPSHOT
15.19.2 PRODUCT PORTFOLIO
15.19.3 RECENT DEVELOPMENT
15.2 ZIEHM IMAGING GMBH
15.20.1 COMPANY SNAPSHOT
15.20.2 PRODUCT PORTFOLIO
15.20.3 RECENT DEVELOPMENT
16 QUESTIONNAIRE
17 RELATED REPORTS
Lista de Tablas
LIST OF TABLES
TABLE 1 HEALTHCARE EXPENDITURE IN ASIA-PACIFIC
TABLE 2 FEDERAL SPENDING AND TAX EXPENDITURE FOR HEALTHCARE IN 2018
TABLE 3 COMPOSITION OF FEDERAL SPENDING ON HEALTHCARE IN THE U.S.
TABLE 4 REFURBISHED C-ARM PRODUCTS
TABLE 5 FDA RECALL PRODUCT
TABLE 6 ALTERNATIVE OF C-ARM DEVICES
TABLE 7 COST OF MOBILE C-ARMS OF DIFFERENT MODELS
TABLE 8 GLOBAL MOBILE C-ARM EQUIPMENT MARKET, BY TYPE, 2018-2027 (USD MILLION)
TABLE 9 GLOBAL MOBILE C-ARM EQUIPMENT MARKET, BY TYPE, 2018-2027 (UNITS)
TABLE 10 GLOBAL MINI C-ARMS IN MOBILE C-ARM EQUIPMENT MARKET, BY REGION, 2018-2027 (USD MILLION)
TABLE 11 GLOBAL MINI C-ARMS IN MOBILE C-ARM EQUIPMENT MARKET, BY TYPE, 2018-2027 (USD MILLION)
TABLE 12 GLOBAL FULL SIZE C-ARM IN MOBILE C-ARM EQUIPMENT MARKET, BY REGION, 2018-2027 (USD MILLION)
TABLE 13 GLOBAL 3D MOBILE C-ARMS IN MOBILE C-ARM EQUIPMENT MARKET, BY REGION, 2018-2027 (USD MILLION)
TABLE 14 GLOBAL 2D MOBILE C-ARMS IN MOBILE C-ARM EQUIPMENT MARKET, BY REGION, 2018-2027 (USD MILLION)
TABLE 15 GLOBAL MOBILE C-ARM EQUIPMENT MARKET, BY TECHNOLOGY, 2018-2027 (USD MILLION)
TABLE 16 GLOBAL IMAGE INTENSIFIERS IN MOBILE C-ARM EQUIPMENT MARKET, BY REGION, 2018-2027 (USD MILLION)
TABLE 17 GLOBAL FLAT PANEL IN MOBILE C-ARM EQUIPMENT MARKET, BY REGION, 2018-2027 (USD MILLION)
TABLE 18 GLOBAL MOBILE C-ARM EQUIPMENT MARKET, BY APPLICATION, 2018-2027 (USD MILLION)
TABLE 19 GLOBAL ORTHOPEDIC AND TRAUMA SURGERIES IN MOBILE C-ARM EQUIPMENT MARKET, BY REGION, 2018-2027 (USD MILLION)
TABLE 20 GLOBAL CARDIOVASCULAR SURGERIES IN MOBILE C-ARM EQUIPMENT MARKET, BY REGION, 2018-2027 (USD MILLION)
TABLE 21 GLOBAL NEURO SURGERIES IN MOBILE C-ARM EQUIPMENT MARKET, BY REGION, 2018-2027 (USD MILLION)
TABLE 22 GLOBAL GASTROINTESTINAL SURGERIES IN MOBILE C-ARM EQUIPMENT MARKET, BY REGION, 2018-2027 (USD MILLION)
TABLE 23 GLOBAL PAIN MANAGEMENT IN MOBILE C-ARM EQUIPMENT MARKET, BY REGION, 2018-2027 (USD MILLION)
TABLE 24 GLOBAL GENERAL SURGERY IN MOBILE C-ARM EQUIPMENT MARKET, BY REGION, 2018-2027 (USD MILLION)
TABLE 25 GLOBAL UROLOGY IN MOBILE C-ARM EQUIPMENT MARKET, BY REGION, 2018-2027 (USD MILLION)
TABLE 26 GLOBAL OTHERS IN MOBILE C-ARM EQUIPMENT MARKET, BY REGION, 2018-2027 (USD MILLION)
TABLE 27 GLOBAL MOBILE C-ARM EQUIPMENT MARKET, BY END USER, 2018-2027 (USD MILLION)
TABLE 28 GLOBAL HOSPITAL IN MOBILE C-ARM EQUIPMENT MARKET, BY REGION, 2018-2027 (USD MILLION)
TABLE 29 GLOBAL DIAGNOSTIC CENTERS IN MOBILE C-ARM EQUIPMENT MARKET, BY REGION, 2018-2027 (USD MILLION)
TABLE 30 GLOBAL SPECIALITY CLINICS IN MOBILE C-ARM EQUIPMENT MARKET, BY REGION, 2018-2027 (USD MILLION)
TABLE 31 GLOBAL OTHERS IN MOBILE C-ARM EQUIPMENT MARKET, BY REGION, 2018-2027 (USD MILLION)
TABLE 32 GLOBAL MOBILE C-ARM EQUIPMENT MARKET, BY DISTRIBUTION CHANNEL, 2018-2027 (USD MILLION)
TABLE 33 GLOBAL DIRECT TENDER IN MOBILE C-ARM EQUIPMENT MARKET, BY REGION, 2018-2027 (USD MILLION)
TABLE 34 GLOBAL RETAIL SALES IN MOBILE C-ARM EQUIPMENT MARKET, BY REGION, 2018-2027 (USD MILLION)
TABLE 35 GLOBAL MOBILE C-ARM EQUIPMENT MARKET, BY GEOGRAPHY, 2018 – 2027 (USD MILLION)
TABLE 36 NORTH AMERICA MOBILE C-ARM EQUIPMENT MARKET, BY COUNTRY, 2018-2027 (USD MILLION)
TABLE 37 NORTH AMERICA MOBILE C-ARM EQUIPMENT MARKET, BY TYPE, 2018-2027 (USD MILLION)
TABLE 38 NORTH AMERICA MOBILE C-ARM EQUIPMENT MARKET, BY TYPE, 2018-2027 (UNITS)
TABLE 39 NORTH AMERICA MINI C-ARMS IN MOBILE C-ARM EQUIPMENT MARKET, BY TYPE, 2018-2027 (USD MILLION)
TABLE 40 NORTH AMERICA MOBILE C-ARM EQUIPMENT MARKET, BY TECHNOLOGY, 2018-2027 (USD MILLION)
TABLE 41 NORTH AMERICA MOBILE C-ARM EQUIPMENT MARKET, BY APPLICATION, 2018-2027 (USD MILLION)
TABLE 42 NORTH AMERICA MOBILE C-ARM EQUIPMENT MARKET, BY END USER, 2018-2027 (USD MILLION)
TABLE 43 NORTH AMERICA MOBILE C-ARM EQUIPMENT MARKET, BY DISTRIBUTION CHANNEL, 2018-2027 (USD MILLION)
TABLE 44 U.S. MOBILE C-ARM EQUIPMENT MARKET, BY TYPE, 2018-2027 (USD MILLION)
TABLE 45 U.S. MOBILE C-ARM EQUIPMENT MARKET, BY TYPE, 2018-2027 (UNITS)
TABLE 46 U.S. MINI C-ARMS IN MOBILE C-ARM EQUIPMENT MARKET, BY TYPE, 2018-2027 (USD MILLION)
TABLE 47 U.S. MOBILE C-ARM EQUIPMENT MARKET, BY TECHNOLOGY, 2018-2027 (USD MILLION)
TABLE 48 U.S. MOBILE C-ARM EQUIPMENT MARKET, BY APPLICATION, 2018-2027 (USD MILLION)
TABLE 49 U.S. MOBILE C-ARM EQUIPMENT MARKET, BY END USER, 2018-2027 (USD MILLION)
TABLE 50 U.S. MOBILE C-ARM EQUIPMENT MARKET, BY DISTRIBUTION CHANNEL, 2018-2027 (USD MILLION)
TABLE 51 CANADA MOBILE C-ARM EQUIPMENT MARKET, BY TYPE, 2018-2027 (USD MILLION)
TABLE 52 CANADA MOBILE C-ARM EQUIPMENT MARKET, BY TYPE, 2018-2027 (UNITS)
TABLE 53 CANADA MINI C-ARMS IN MOBILE C-ARM EQUIPMENT MARKET, BY TYPE, 2018-2027 (USD MILLION)
TABLE 54 CANADA MOBILE C-ARM EQUIPMENT MARKET, BY TECHNOLOGY, 2018-2027 (USD MILLION)
TABLE 55 CANADA MOBILE C-ARM EQUIPMENT MARKET, BY APPLICATION, 2018-2027 (USD MILLION)
TABLE 56 CANADA MOBILE C-ARM EQUIPMENT MARKET, BY END USER, 2018-2027 (USD MILLION)
TABLE 57 CANADA MOBILE C-ARM EQUIPMENT MARKET, BY DISTRIBUTION CHANNEL, 2018-2027 (USD MILLION)
TABLE 58 MEXICO MOBILE C-ARM EQUIPMENT MARKET, BY TYPE, 2018-2027 (USD MILLION)
TABLE 59 MEXICO MOBILE C-ARM EQUIPMENT MARKET, BY TYPE, 2018-2027 (UNITS)
TABLE 60 MEXICO MINI C-ARMS IN MOBILE C-ARM EQUIPMENT MARKET, BY TYPE, 2018-2027 (USD MILLION)
TABLE 61 MEXICO MOBILE C-ARM EQUIPMENT MARKET, BY TECHNOLOGY, 2018-2027 (USD MILLION)
TABLE 62 MEXICO MOBILE C-ARM EQUIPMENT MARKET, BY APPLICATION, 2018-2027 (USD MILLION)
TABLE 63 MEXICO MOBILE C-ARM EQUIPMENT MARKET, BY END USER, 2018-2027 (USD MILLION)
TABLE 64 MEXICO MOBILE C-ARM EQUIPMENT MARKET, BY DISTRIBUTION CHANNEL, 2018-2027 (USD MILLION)
TABLE 65 EUROPE MOBILE C-ARM EQUIPMENT MARKET, BY COUNTRY, 2018-2027 (USD MILLION)
TABLE 66 EUROPE MOBILE C-ARM EQUIPMENT MARKET, BY TYPE, 2018-2027 (USD MILLION)
TABLE 67 EUROPE MOBILE C-ARM EQUIPMENT MARKET, BY TYPE, 2018-2027 (UNITS)
TABLE 68 EUROPE MINI C-ARMS IN MOBILE C-ARM EQUIPMENT MARKET, BY TYPE, 2018-2027 (USD MILLION)
TABLE 69 EUROPE MOBILE C-ARM EQUIPMENT MARKET, BY TECHNOLOGY, 2018-2027 (USD MILLION)
TABLE 70 EUROPE MOBILE C-ARM EQUIPMENT MARKET, BY APPLICATION, 2018-2027 (USD MILLION)
TABLE 71 EUROPE MOBILE C-ARM EQUIPMENT MARKET, BY END USER, 2018-2027 (USD MILLION)
TABLE 72 EUROPE MOBILE C-ARM EQUIPMENT MARKET, BY DISTRIBUTION CHANNEL, 2018-2027 (USD MILLION)
TABLE 73 GERMANY MOBILE C-ARM EQUIPMENT MARKET, BY TYPE, 2018-2027 (USD MILLION)
TABLE 74 GERMANY MOBILE C-ARM EQUIPMENT MARKET, BY TYPE, 2018-2027 (UNITS)
TABLE 75 GERMANY MINI C-ARMS IN MOBILE C-ARM EQUIPMENT MARKET, BY TYPE, 2018-2027 (USD MILLION)
TABLE 76 GERMANY MOBILE C-ARM EQUIPMENT MARKET, BY TECHNOLOGY, 2018-2027 (USD MILLION)
TABLE 77 GERMANY MOBILE C-ARM EQUIPMENT MARKET, BY APPLICATION, 2018-2027 (USD MILLION)
TABLE 78 GERMANY MOBILE C-ARM EQUIPMENT MARKET, BY END USER, 2018-2027 (USD MILLION)
TABLE 79 GERMANY MOBILE C-ARM EQUIPMENT MARKET, BY DISTRIBUTION CHANNEL, 2018-2027 (USD MILLION)
TABLE 80 U.K. MOBILE C-ARM EQUIPMENT MARKET, BY TYPE, 2018-2027 (USD MILLION)
TABLE 81 U.K. MOBILE C-ARM EQUIPMENT MARKET, BY TYPE, 2018-2027 (UNITS)
TABLE 82 U.K. MINI C-ARMS IN MOBILE C-ARM EQUIPMENT MARKET, BY TYPE, 2018-2027 (USD MILLION)
TABLE 83 U.K. MOBILE C-ARM EQUIPMENT MARKET, BY TECHNOLOGY, 2018-2027 (USD MILLION)
TABLE 84 U.K. MOBILE C-ARM EQUIPMENT MARKET, BY APPLICATION, 2018-2027 (USD MILLION)
TABLE 85 U.K. MOBILE C-ARM EQUIPMENT MARKET, BY END USER, 2018-2027 (USD MILLION)
TABLE 86 U.K. MOBILE C-ARM EQUIPMENT MARKET, BY DISTRIBUTION CHANNEL, 2018-2027 (USD MILLION)
TABLE 87 FRANCE MOBILE C-ARM EQUIPMENT MARKET, BY TYPE, 2018-2027 (USD MILLION)
TABLE 88 FRANCE MOBILE C-ARM EQUIPMENT MARKET, BY TYPE, 2018-2027 (UNITS)
TABLE 89 FRANCE MINI C-ARMS IN MOBILE C-ARM EQUIPMENT MARKET, BY TYPE, 2018-2027 (USD MILLION)
TABLE 90 FRANCE MOBILE C-ARM EQUIPMENT MARKET, BY TECHNOLOGY, 2018-2027 (USD MILLION)
TABLE 91 FRANCE MOBILE C-ARM EQUIPMENT MARKET, BY APPLICATION, 2018-2027 (USD MILLION)
TABLE 92 FRANCE MOBILE C-ARM EQUIPMENT MARKET, BY END USER, 2018-2027 (USD MILLION)
TABLE 93 FRANCE MOBILE C-ARM EQUIPMENT MARKET, BY DISTRIBUTION CHANNEL, 2018-2027 (USD MILLION)
TABLE 94 ITALY MOBILE C-ARM EQUIPMENT MARKET, BY TYPE, 2018-2027 (USD MILLION)
TABLE 95 ITALY MOBILE C-ARM EQUIPMENT MARKET, BY TYPE, 2018-2027 (UNITS)
TABLE 96 ITALY MINI C-ARMS IN MOBILE C-ARM EQUIPMENT MARKET, BY TYPE, 2018-2027 (USD MILLION)
TABLE 97 ITALY MOBILE C-ARM EQUIPMENT MARKET, BY TECHNOLOGY, 2018-2027 (USD MILLION)
TABLE 98 ITALY MOBILE C-ARM EQUIPMENT MARKET, BY APPLICATION, 2018-2027 (USD MILLION)
TABLE 99 ITALY MOBILE C-ARM EQUIPMENT MARKET, BY END USER, 2018-2027 (USD MILLION)
TABLE 100 ITALY MOBILE C-ARM EQUIPMENT MARKET, BY DISTRIBUTION CHANNEL, 2018-2027 (USD MILLION)
TABLE 101 SPAIN MOBILE C-ARM EQUIPMENT MARKET, BY TYPE, 2018-2027 (USD MILLION)
TABLE 102 SPAIN MOBILE C-ARM EQUIPMENT MARKET, BY TYPE, 2018-2027 (UNITS)
TABLE 103 SPAIN MINI C-ARMS IN MOBILE C-ARM EQUIPMENT MARKET, BY TYPE, 2018-2027 (USD MILLION)
TABLE 104 SPAIN MOBILE C-ARM EQUIPMENT MARKET, BY TECHNOLOGY, 2018-2027 (USD MILLION)
TABLE 105 SPAIN MOBILE C-ARM EQUIPMENT MARKET, BY APPLICATION, 2018-2027 (USD MILLION)
TABLE 106 SPAIN MOBILE C-ARM EQUIPMENT MARKET, BY END USER, 2018-2027 (USD MILLION)
TABLE 107 SPAIN MOBILE C-ARM EQUIPMENT MARKET, BY DISTRIBUTION CHANNEL, 2018-2027 (USD MILLION)
TABLE 108 SWITZERLAND MOBILE C-ARM EQUIPMENT MARKET, BY TYPE, 2018-2027 (USD MILLION)
TABLE 109 SWITZERLAND MOBILE C-ARM EQUIPMENT MARKET, BY TYPE, 2018-2027 (UNITS)
TABLE 110 SWITZERLAND MINI C-ARMS IN MOBILE C-ARM EQUIPMENT MARKET, BY TYPE, 2018-2027 (USD MILLION)
TABLE 111 SWITZERLAND MOBILE C-ARM EQUIPMENT MARKET, BY TECHNOLOGY, 2018-2027 (USD MILLION)
TABLE 112 SWITZERLAND MOBILE C-ARM EQUIPMENT MARKET, BY APPLICATION, 2018-2027 (USD MILLION)
TABLE 113 SWITZERLAND MOBILE C-ARM EQUIPMENT MARKET, BY END USER, 2018-2027 (USD MILLION)
TABLE 114 SWITZERLAND MOBILE C-ARM EQUIPMENT MARKET, BY DISTRIBUTION CHANNEL, 2018-2027 (USD MILLION)
TABLE 115 NETHERLANDS MOBILE C-ARM EQUIPMENT MARKET, BY TYPE, 2018-2027 (USD MILLION)
TABLE 116 NETHERLANDS MOBILE C-ARM EQUIPMENT MARKET, BY TYPE, 2018-2027 (UNITS)
TABLE 117 NETHERLANDS MINI C-ARMS IN MOBILE C-ARM EQUIPMENT MARKET, BY TYPE, 2018-2027 (USD MILLION)
TABLE 118 NETHERLANDS MOBILE C-ARM EQUIPMENT MARKET, BY TECHNOLOGY, 2018-2027 (USD MILLION)
TABLE 119 NETHERLANDS MOBILE C-ARM EQUIPMENT MARKET, BY APPLICATION, 2018-2027 (USD MILLION)
TABLE 120 NETHERLANDS MOBILE C-ARM EQUIPMENT MARKET, BY END USER, 2018-2027 (USD MILLION)
TABLE 121 NETHERLANDS MOBILE C-ARM EQUIPMENT MARKET, BY DISTRIBUTION CHANNEL, 2018-2027 (USD MILLION)
TABLE 122 BELGIUM MOBILE C-ARM EQUIPMENT MARKET, BY TYPE, 2018-2027 (USD MILLION)
TABLE 123 BELGIUM MOBILE C-ARM EQUIPMENT MARKET, BY TYPE, 2018-2027 (UNITS)
TABLE 124 BELGIUM MINI C-ARMS IN MOBILE C-ARM EQUIPMENT MARKET, BY TYPE, 2018-2027 (USD MILLION)
TABLE 125 BELGIUM MOBILE C-ARM EQUIPMENT MARKET, BY TECHNOLOGY, 2018-2027 (USD MILLION)
TABLE 126 BELGIUM MOBILE C-ARM EQUIPMENT MARKET, BY APPLICATION, 2018-2027 (USD MILLION)
TABLE 127 BELGIUM MOBILE C-ARM EQUIPMENT MARKET, BY END USER, 2018-2027 (USD MILLION)
TABLE 128 BELGIUM MOBILE C-ARM EQUIPMENT MARKET, BY DISTRIBUTION CHANNEL, 2018-2027 (USD MILLION)
TABLE 129 RUSSIA MOBILE C-ARM EQUIPMENT MARKET, BY TYPE, 2018-2027 (USD MILLION)
TABLE 130 RUSSIA MOBILE C-ARM EQUIPMENT MARKET, BY TYPE, 2018-2027 (UNITS)
TABLE 131 RUSSIA MINI C-ARMS IN MOBILE C-ARM EQUIPMENT MARKET, BY TYPE, 2018-2027 (USD MILLION)
TABLE 132 RUSSIA MOBILE C-ARM EQUIPMENT MARKET, BY TECHNOLOGY, 2018-2027 (USD MILLION)
TABLE 133 RUSSIA MOBILE C-ARM EQUIPMENT MARKET, BY APPLICATION, 2018-2027 (USD MILLION)
TABLE 134 RUSSIA MOBILE C-ARM EQUIPMENT MARKET, BY END USER, 2018-2027 (USD MILLION)
TABLE 135 RUSSIA MOBILE C-ARM EQUIPMENT MARKET, BY DISTRIBUTION CHANNEL, 2018-2027 (USD MILLION)
TABLE 136 TURKEY MOBILE C-ARM EQUIPMENT MARKET, BY TYPE, 2018-2027 (USD MILLION)
TABLE 137 TURKEY MOBILE C-ARM EQUIPMENT MARKET, BY TYPE, 2018-2027 (UNITS)
TABLE 138 TURKEY MINI C-ARMS IN MOBILE C-ARM EQUIPMENT MARKET, BY TYPE, 2018-2027 (USD MILLION)
TABLE 139 TURKEY MOBILE C-ARM EQUIPMENT MARKET, BY TECHNOLOGY, 2018-2027 (USD MILLION)
TABLE 140 TURKEY MOBILE C-ARM EQUIPMENT MARKET, BY APPLICATION, 2018-2027 (USD MILLION)
TABLE 141 TURKEY MOBILE C-ARM EQUIPMENT MARKET, BY END USER, 2018-2027 (USD MILLION)
TABLE 142 TURKEY MOBILE C-ARM EQUIPMENT MARKET, BY DISTRIBUTION CHANNEL, 2018-2027 (USD MILLION)
TABLE 143 REST OF EUROPE MOBILE C-ARM EQUIPMENT MARKET, BY TYPE, 2018-2027 (USD MILLION)
TABLE 144 ASIA-PACIFIC MOBILE C-ARM EQUIPMENT MARKET, BY COUNTRY, 2018-2027 (USD MILLION)
TABLE 145 ASIA-PACIFIC MOBILE C-ARM EQUIPMENT MARKET, BY TYPE, 2018-2027 (USD MILLION)
TABLE 146 ASIA-PACIFIC MOBILE C-ARM EQUIPMENT MARKET, BY TYPE, 2018-2027 (UNITS)
TABLE 147 ASIA-PACIFIC MINI C-ARMS IN MOBILE C-ARM EQUIPMENT MARKET, BY TYPE, 2018-2027 (USD MILLION)
TABLE 148 ASIA-PACIFIC MOBILE C-ARM EQUIPMENT MARKET, BY TECHNOLOGY, 2018-2027 (USD MILLION)
TABLE 149 ASIA-PACIFIC MOBILE C-ARM EQUIPMENT MARKET, BY APPLICATION, 2018-2027 (USD MILLION)
TABLE 150 ASIA-PACIFIC MOBILE C-ARM EQUIPMENT MARKET, BY END USER, 2018-2027 (USD MILLION)
TABLE 151 ASIA-PACIFIC MOBILE C-ARM EQUIPMENT MARKET, BY DISTRIBUTION CHANNEL, 2018-2027 (USD MILLION)
TABLE 152 CHINA MOBILE C-ARM EQUIPMENT MARKET, BY TYPE, 2018-2027 (USD MILLION)
TABLE 153 CHINA MOBILE C-ARM EQUIPMENT MARKET, BY TYPE, 2018-2027 (UNITS)
TABLE 154 CHINA MINI C-ARMS IN MOBILE C-ARM EQUIPMENT MARKET, BY TYPE, 2018-2027 (USD MILLION)
TABLE 155 CHINA MOBILE C-ARM EQUIPMENT MARKET, BY TECHNOLOGY, 2018-2027 (USD MILLION)
TABLE 156 CHINA MOBILE C-ARM EQUIPMENT MARKET, BY APPLICATION, 2018-2027 (USD MILLION)
TABLE 157 CHINA MOBILE C-ARM EQUIPMENT MARKET, BY END USER, 2018-2027 (USD MILLION)
TABLE 158 CHINA MOBILE C-ARM EQUIPMENT MARKET, BY DISTRIBUTION CHANNEL, 2018-2027 (USD MILLION)
TABLE 159 JAPAN MOBILE C-ARM EQUIPMENT MARKET, BY TYPE, 2018-2027 (USD MILLION)
TABLE 160 JAPAN MOBILE C-ARM EQUIPMENT MARKET, BY TYPE, 2018-2027 (UNITS)
TABLE 161 JAPAN MINI C-ARMS IN MOBILE C-ARM EQUIPMENT MARKET, BY TYPE, 2018-2027 (USD MILLION)
TABLE 162 JAPAN MOBILE C-ARM EQUIPMENT MARKET, BY TECHNOLOGY, 2018-2027 (USD MILLION)
TABLE 163 JAPAN MOBILE C-ARM EQUIPMENT MARKET, BY APPLICATION, 2018-2027 (USD MILLION)
TABLE 164 JAPAN MOBILE C-ARM EQUIPMENT MARKET, BY END USER, 2018-2027 (USD MILLION)
TABLE 165 JAPAN MOBILE C-ARM EQUIPMENT MARKET, BY DISTRIBUTION CHANNEL, 2018-2027 (USD MILLION)
TABLE 166 INDIA MOBILE C-ARM EQUIPMENT MARKET, BY TYPE, 2018-2027 (USD MILLION)
TABLE 167 INDIA MOBILE C-ARM EQUIPMENT MARKET, BY TYPE, 2018-2027 (UNITS)
TABLE 168 INDIA MINI C-ARMS IN MOBILE C-ARM EQUIPMENT MARKET, BY TYPE, 2018-2027 (USD MILLION)
TABLE 169 INDIA MOBILE C-ARM EQUIPMENT MARKET, BY TECHNOLOGY, 2018-2027 (USD MILLION)
TABLE 170 INDIA MOBILE C-ARM EQUIPMENT MARKET, BY APPLICATION, 2018-2027 (USD MILLION)
TABLE 171 INDIA MOBILE C-ARM EQUIPMENT MARKET, BY END USER, 2018-2027 (USD MILLION)
TABLE 172 INDIA MOBILE C-ARM EQUIPMENT MARKET, BY DISTRIBUTION CHANNEL, 2018-2027 (USD MILLION)
TABLE 173 SOUTH KOREA MOBILE C-ARM EQUIPMENT MARKET, BY TYPE, 2018-2027 (USD MILLION)
TABLE 174 SOUTH KOREA MOBILE C-ARM EQUIPMENT MARKET, BY TYPE, 2018-2027 (UNITS)
TABLE 175 SOUTH KOREA MINI C-ARMS IN MOBILE C-ARM EQUIPMENT MARKET, BY TYPE, 2018-2027 (USD MILLION)
TABLE 176 SOUTH KOREA MOBILE C-ARM EQUIPMENT MARKET, BY TECHNOLOGY, 2018-2027 (USD MILLION)
TABLE 177 SOUTH KOREA MOBILE C-ARM EQUIPMENT MARKET, BY APPLICATION, 2018-2027 (USD MILLION)
TABLE 178 SOUTH KOREA MOBILE C-ARM EQUIPMENT MARKET, BY END USER, 2018-2027 (USD MILLION)
TABLE 179 SOUTH KOREA MOBILE C-ARM EQUIPMENT MARKET, BY DISTRIBUTION CHANNEL, 2018-2027 (USD MILLION)
TABLE 180 AUSTRALIA MOBILE C-ARM EQUIPMENT MARKET, BY TYPE, 2018-2027 (USD MILLION)
TABLE 181 AUSTRALIA MOBILE C-ARM EQUIPMENT MARKET, BY TYPE, 2018-2027 (UNITS)
TABLE 182 AUSTRALIA MINI C-ARMS IN MOBILE C-ARM EQUIPMENT MARKET, BY TYPE, 2018-2027 (USD MILLION)
TABLE 183 AUSTRALIA MOBILE C-ARM EQUIPMENT MARKET, BY TECHNOLOGY, 2018-2027 (USD MILLION)
TABLE 184 AUSTRALIA MOBILE C-ARM EQUIPMENT MARKET, BY APPLICATION, 2018-2027 (USD MILLION)
TABLE 185 AUSTRALIA MOBILE C-ARM EQUIPMENT MARKET, BY END USER, 2018-2027 (USD MILLION)
TABLE 186 AUSTRALIA MOBILE C-ARM EQUIPMENT MARKET, BY DISTRIBUTION CHANNEL, 2018-2027 (USD MILLION)
TABLE 187 SINGAPORE MOBILE C-ARM EQUIPMENT MARKET, BY TYPE, 2018-2027 (USD MILLION)
TABLE 188 SINGAPORE MOBILE C-ARM EQUIPMENT MARKET, BY TYPE, 2018-2027 (UNITS)
TABLE 189 SINGAPORE MINI C-ARMS IN MOBILE C-ARM EQUIPMENT MARKET, BY TYPE, 2018-2027 (USD MILLION)
TABLE 190 SINGAPORE MOBILE C-ARM EQUIPMENT MARKET, BY TECHNOLOGY, 2018-2027 (USD MILLION)
TABLE 191 SINGAPORE MOBILE C-ARM EQUIPMENT MARKET, BY APPLICATION, 2018-2027 (USD MILLION)
TABLE 192 SINGAPORE MOBILE C-ARM EQUIPMENT MARKET, BY END USER, 2018-2027 (USD MILLION)
TABLE 193 SINGAPORE MOBILE C-ARM EQUIPMENT MARKET, BY DISTRIBUTION CHANNEL, 2018-2027 (USD MILLION)
TABLE 194 THAILAND MOBILE C-ARM EQUIPMENT MARKET, BY TYPE, 2018-2027 (USD MILLION)
TABLE 195 THAILAND MOBILE C-ARM EQUIPMENT MARKET, BY TYPE, 2018-2027 (UNITS)
TABLE 196 THAILAND MINI C-ARMS IN MOBILE C-ARM EQUIPMENT MARKET, BY TYPE, 2018-2027 (USD MILLION)
TABLE 197 THAILAND MOBILE C-ARM EQUIPMENT MARKET, BY TECHNOLOGY, 2018-2027 (USD MILLION)
TABLE 198 THAILAND MOBILE C-ARM EQUIPMENT MARKET, BY APPLICATION, 2018-2027 (USD MILLION)
TABLE 199 THAILAND MOBILE C-ARM EQUIPMENT MARKET, BY END USER, 2018-2027 (USD MILLION)
TABLE 200 THAILAND MOBILE C-ARM EQUIPMENT MARKET, BY DISTRIBUTION CHANNEL, 2018-2027 (USD MILLION)
TABLE 201 MALAYSIA MOBILE C-ARM EQUIPMENT MARKET, BY TYPE, 2018-2027 (USD MILLION)
TABLE 202 MALAYSIA MOBILE C-ARM EQUIPMENT MARKET, BY TYPE, 2018-2027 (UNITS)
TABLE 203 MALAYSIA MINI C-ARMS IN MOBILE C-ARM EQUIPMENT MARKET, BY TYPE, 2018-2027 (USD MILLION)
TABLE 204 MALAYSIA MOBILE C-ARM EQUIPMENT MARKET, BY TECHNOLOGY, 2018-2027 (USD MILLION)
TABLE 205 MALAYSIA MOBILE C-ARM EQUIPMENT MARKET, BY APPLICATION, 2018-2027 (USD MILLION)
TABLE 206 MALAYSIA MOBILE C-ARM EQUIPMENT MARKET, BY END USER, 2018-2027 (USD MILLION)
TABLE 207 MALAYSIA MOBILE C-ARM EQUIPMENT MARKET, BY DISTRIBUTION CHANNEL, 2018-2027 (USD MILLION)
TABLE 208 INDONESIA MOBILE C-ARM EQUIPMENT MARKET, BY TYPE, 2018-2027 (USD MILLION)
TABLE 209 INDONESIA MOBILE C-ARM EQUIPMENT MARKET, BY TYPE, 2018-2027 (UNITS)
TABLE 210 INDONESIA MINI C-ARMS IN MOBILE C-ARM EQUIPMENT MARKET, BY TYPE, 2018-2027 (USD MILLION)
TABLE 211 INDONESIA MOBILE C-ARM EQUIPMENT MARKET, BY TECHNOLOGY, 2018-2027 (USD MILLION)
TABLE 212 INDONESIA MOBILE C-ARM EQUIPMENT MARKET, BY APPLICATION, 2018-2027 (USD MILLION)
TABLE 213 INDONESIA MOBILE C-ARM EQUIPMENT MARKET, BY END USER, 2018-2027 (USD MILLION)
TABLE 214 INDONESIA MOBILE C-ARM EQUIPMENT MARKET, BY DISTRIBUTION CHANNEL, 2018-2027 (USD MILLION)
TABLE 215 PHILIPPINES MOBILE C-ARM EQUIPMENT MARKET, BY TYPE, 2018-2027 (USD MILLION)
TABLE 216 PHILIPPINES MOBILE C-ARM EQUIPMENT MARKET, BY TYPE, 2018-2027 (UNITS)
TABLE 217 PHILIPPINES MINI C-ARMS IN MOBILE C-ARM EQUIPMENT MARKET, BY TYPE, 2018-2027 (USD MILLION)
TABLE 218 PHILIPPINES MOBILE C-ARM EQUIPMENT MARKET, BY TECHNOLOGY, 2018-2027 (USD MILLION)
TABLE 219 PHILIPPINES MOBILE C-ARM EQUIPMENT MARKET, BY APPLICATION, 2018-2027 (USD MILLION)
TABLE 220 PHILIPPINES MOBILE C-ARM EQUIPMENT MARKET, BY END USER, 2018-2027 (USD MILLION)
TABLE 221 PHILIPPINES MOBILE C-ARM EQUIPMENT MARKET, BY DISTRIBUTION CHANNEL, 2018-2027 (USD MILLION)
TABLE 222 REST OF ASIA-PACIFIC MOBILE C-ARM EQUIPMENT MARKET, BY TYPE, 2018-2027 (USD MILLION)
TABLE 223 SOUTH AMERICA MOBILE C-ARM EQUIPMENT MARKET, BY COUNTRY, 2018-2027 (USD MILLION)
TABLE 224 SOUTH AMERICA MOBILE C-ARM EQUIPMENT MARKET, BY TYPE, 2018-2027 (USD MILLION)
TABLE 225 SOUTH AMERICA MOBILE C-ARM EQUIPMENT MARKET, BY TYPE, 2018-2027 (UNITS)
TABLE 226 SOUTH AMERICA MINI C-ARMS IN MOBILE C-ARM EQUIPMENT MARKET, BY TYPE, 2018-2027 (USD MILLION)
TABLE 227 SOUTH AMERICA MOBILE C-ARM EQUIPMENT MARKET, BY TECHNOLOGY, 2018-2027 (USD MILLION)
TABLE 228 SOUTH AMERICA MOBILE C-ARM EQUIPMENT MARKET, BY APPLICATION, 2018-2027 (USD MILLION)
TABLE 229 SOUTH AMERICA MOBILE C-ARM EQUIPMENT MARKET, BY END USER, 2018-2027 (USD MILLION)
TABLE 230 SOUTH AMERICA MOBILE C-ARM EQUIPMENT MARKET, BY DISTRIBUTION CHANNEL, 2018-2027 (USD MILLION)
TABLE 231 BRAZIL MOBILE C-ARM EQUIPMENT MARKET, BY TYPE, 2018-2027 (USD MILLION)
TABLE 232 BRAZIL MOBILE C-ARM EQUIPMENT MARKET, BY TYPE, 2018-2027 (UNITS)
TABLE 233 BRAZIL MINI C-ARMS IN MOBILE C-ARM EQUIPMENT MARKET, BY TYPE, 2018-2027 (USD MILLION)
TABLE 234 BRAZIL MOBILE C-ARM EQUIPMENT MARKET, BY TECHNOLOGY, 2018-2027 (USD MILLION)
TABLE 235 BRAZIL MOBILE C-ARM EQUIPMENT MARKET, BY APPLICATION, 2018-2027 (USD MILLION)
TABLE 236 BRAZIL MOBILE C-ARM EQUIPMENT MARKET, BY END USER, 2018-2027 (USD MILLION)
TABLE 237 BRAZIL MOBILE C-ARM EQUIPMENT MARKET, BY DISTRIBUTION CHANNEL, 2018-2027 (USD MILLION)
TABLE 238 ARGENTINA MOBILE C-ARM EQUIPMENT MARKET, BY TYPE, 2018-2027 (USD MILLION)
TABLE 239 ARGENTINA MOBILE C-ARM EQUIPMENT MARKET, BY TYPE, 2018-2027 (UNITS)
TABLE 240 ARGENTINA MINI C-ARMS IN MOBILE C-ARM EQUIPMENT MARKET, BY TYPE, 2018-2027 (USD MILLION)
TABLE 241 ARGENTINA MOBILE C-ARM EQUIPMENT MARKET, BY TECHNOLOGY, 2018-2027 (USD MILLION)
TABLE 242 ARGENTINA MOBILE C-ARM EQUIPMENT MARKET, BY APPLICATION, 2018-2027 (USD MILLION)
TABLE 243 ARGENTINA MOBILE C-ARM EQUIPMENT MARKET, BY END USER, 2018-2027 (USD MILLION)
TABLE 244 ARGENTINA MOBILE C-ARM EQUIPMENT MARKET, BY DISTRIBUTION CHANNEL, 2018-2027 (USD MILLION)
TABLE 245 MEXICO MOBILE C-ARM EQUIPMENT MARKET, BY TYPE, 2018-2027 (USD MILLION)
TABLE 246 MIDDLE EAST AND AFRICA MOBILE C-ARM EQUIPMENT MARKET, BY COUNTRY, 2018-2027 (USD MILLION)
TABLE 247 MIDDLE EAST AND AFRICA MOBILE C-ARM EQUIPMENT MARKET, BY TYPE, 2018-2027 (USD MILLION)
TABLE 248 MIDDLE EAST AND AFRICA MOBILE C-ARM EQUIPMENT MARKET, BY TYPE, 2018-2027 (UNITS)
TABLE 249 MIDDLE EAST AND AFRICA MINI C-ARMS IN MOBILE C-ARM EQUIPMENT MARKET, BY TYPE, 2018-2027 (USD MILLION)
TABLE 250 MIDDLE EAST AND AFRICA MOBILE C-ARM EQUIPMENT MARKET, BY TECHNOLOGY, 2018-2027 (USD MILLION)
TABLE 251 MIDDLE EAST AND AFRICA MOBILE C-ARM EQUIPMENT MARKET, BY APPLICATION, 2018-2027 (USD MILLION)
TABLE 252 MIDDLE EAST AND AFRICA MOBILE C-ARM EQUIPMENT MARKET, BY END USER, 2018-2027 (USD MILLION)
TABLE 253 MIDDLE EAST AND AFRICA MOBILE C-ARM EQUIPMENT MARKET, BY DISTRIBUTION CHANNEL, 2018-2027 (USD MILLION)
TABLE 254 SOUTH AFRICA MOBILE C-ARM EQUIPMENT MARKET, BY TYPE, 2018-2027 (USD MILLION)
TABLE 255 SOUTH AFRICA MOBILE C-ARM EQUIPMENT MARKET, BY TYPE, 2018-2027 (UNITS)
TABLE 256 SOUTH AFRICA MINI C-ARMS IN MOBILE C-ARM EQUIPMENT MARKET, BY TYPE, 2018-2027 (USD MILLION)
TABLE 257 SOUTH AFRICA MOBILE C-ARM EQUIPMENT MARKET, BY TECHNOLOGY, 2018-2027 (USD MILLION)
TABLE 258 SOUTH AFRICA MOBILE C-ARM EQUIPMENT MARKET, BY APPLICATION, 2018-2027 (USD MILLION)
TABLE 259 SOUTH AFRICA MOBILE C-ARM EQUIPMENT MARKET, BY END USER, 2018-2027 (USD MILLION)
TABLE 260 SOUTH AFRICA MOBILE C-ARM EQUIPMENT MARKET, BY DISTRIBUTION CHANNEL, 2018-2027 (USD MILLION)
TABLE 261 SAUDI ARABIA MOBILE C-ARM EQUIPMENT MARKET, BY TYPE, 2018-2027 (USD MILLION)
TABLE 262 SAUDI ARABIA MOBILE C-ARM EQUIPMENT MARKET, BY TYPE, 2018-2027 (UNITS)
TABLE 263 SAUDI ARABIA MINI C-ARMS IN MOBILE C-ARM EQUIPMENT MARKET, BY TYPE, 2018-2027 (USD MILLION)
TABLE 264 SAUDI ARABIA MOBILE C-ARM EQUIPMENT MARKET, BY TECHNOLOGY, 2018-2027 (USD MILLION)
TABLE 265 SAUDI ARABIA MOBILE C-ARM EQUIPMENT MARKET, BY APPLICATION, 2018-2027 (USD MILLION)
TABLE 266 SAUDI ARABIA MOBILE C-ARM EQUIPMENT MARKET, BY END USER, 2018-2027 (USD MILLION)
TABLE 267 SAUDI ARABIA MOBILE C-ARM EQUIPMENT MARKET, BY DISTRIBUTION CHANNEL, 2018-2027 (USD MILLION)
TABLE 268 UAE MOBILE C-ARM EQUIPMENT MARKET, BY TYPE, 2018-2027 (USD MILLION)
TABLE 269 UAE MOBILE C-ARM EQUIPMENT MARKET, BY TYPE, 2018-2027 (UNITS)
TABLE 270 UAE MINI C-ARMS IN MOBILE C-ARM EQUIPMENT MARKET, BY TYPE, 2018-2027 (USD MILLION)
TABLE 271 UAE MOBILE C-ARM EQUIPMENT MARKET, BY TECHNOLOGY, 2018-2027 (USD MILLION)
TABLE 272 UAE MOBILE C-ARM EQUIPMENT MARKET, BY APPLICATION, 2018-2027 (USD MILLION)
TABLE 273 UAE MOBILE C-ARM EQUIPMENT MARKET, BY END USER, 2018-2027 (USD MILLION)
TABLE 274 UAE MOBILE C-ARM EQUIPMENT MARKET, BY DISTRIBUTION CHANNEL, 2018-2027 (USD MILLION)
TABLE 275 ISRAEL MOBILE C-ARM EQUIPMENT MARKET, BY TYPE, 2018-2027 (USD MILLION)
TABLE 276 ISRAEL MOBILE C-ARM EQUIPMENT MARKET, BY TYPE, 2018-2027 (UNITS)
TABLE 277 ISRAEL MINI C-ARMS IN MOBILE C-ARM EQUIPMENT MARKET, BY TYPE, 2018-2027 (USD MILLION)
TABLE 278 ISRAEL MOBILE C-ARM EQUIPMENT MARKET, BY TECHNOLOGY, 2018-2027 (USD MILLION)
TABLE 279 ISRAEL MOBILE C-ARM EQUIPMENT MARKET, BY APPLICATION, 2018-2027 (USD MILLION)
TABLE 280 ISRAEL MOBILE C-ARM EQUIPMENT MARKET, BY END USER, 2018-2027 (USD MILLION)
TABLE 281 ISRAEL MOBILE C-ARM EQUIPMENT MARKET, BY DISTRIBUTION CHANNEL, 2018-2027 (USD MILLION)
TABLE 282 EGYPT MOBILE C-ARM EQUIPMENT MARKET, BY TYPE, 2018-2027 (USD MILLION)
TABLE 283 EGYPT MOBILE C-ARM EQUIPMENT MARKET, BY TYPE, 2018-2027 (UNITS)
TABLE 284 EGYPT MINI C-ARMS IN MOBILE C-ARM EQUIPMENT MARKET, BY TYPE, 2018-2027 (USD MILLION)
TABLE 285 EGYPT MOBILE C-ARM EQUIPMENT MARKET, BY TECHNOLOGY, 2018-2027 (USD MILLION)
TABLE 286 EGYPT MOBILE C-ARM EQUIPMENT MARKET, BY APPLICATION, 2018-2027 (USD MILLION)
TABLE 287 EGYPT MOBILE C-ARM EQUIPMENT MARKET, BY END USER, 2018-2027 (USD MILLION)
TABLE 288 EGYPT MOBILE C-ARM EQUIPMENT MARKET, BY DISTRIBUTION CHANNEL, 2018-2027 (USD MILLION)
TABLE 289 REST OF MIDDLE EAST AND AFRICA MOBILE C-ARM EQUIPMENT MARKET, BY TYPE, 2018-2027 (USD MILLION)
Lista de figuras
LIST OF FIGURES
FIGURE 1 GLOBAL MOBILE C-ARM EQUIPMENT MARKET: SEGMENTATION
FIGURE 2 GLOBAL MOBILE C-ARM EQUIPMENT MARKET: DATA TRIANGULATION
FIGURE 3 GLOBAL MOBILE C-ARM EQUIPMENT MARKET: DROC ANALYSIS
FIGURE 4 GLOBAL MOBILE C-ARM EQUIPMENT MARKET : GLOBAL VS REGIONAL MARKET ANALYSIS
FIGURE 5 GLOBAL MOBILE C-ARM EQUIPMENT MARKET : COMPANY RESEARCH ANALYSIS
FIGURE 6 GLOBAL MOBILE C-ARM EQUIPMENT MARKET: MARKET APPLICATION COVERAGE GRID
FIGURE 7 GLOBAL MOBILE C-ARM EQUIPMENT MARKET: INTERVIEW DEMOGRAPHICS
FIGURE 8 GLOBAL MOBILE C-ARM EQUIPMENT MARKET: DBMR MARKET POSITION GRID
FIGURE 9 GLOBAL MOBILE C-ARM EQUIPMENT MARKET: VENDOR SHARE ANALYSIS
FIGURE 10 GLOBAL MOBILE C-ARM EQUIPMENT MARKET: SEGMENTATION
FIGURE 11 NORTH AMERICA IS EXPECTED TO DOMINATE THE GLOBAL MOBILE C-ARM EQUIPMENT MARKET AND ASIA-PACIFIC IS EXPECTED TO GROW WITH THE HIGHEST CAGR IN THE FORECAST PERIOD OF 2020 TO 2027
FIGURE 12 ADVANCEMENTS IN IMAGING TECHNOLOGIES AND GROWING EARLY DIAGNOSIS RATE ARE EXPECTED TO DRIVE THE GLOBAL MOBILE C-ARM EQUIPMENT MARKET IN THE FORECAST PERIOD OF 2020 TO 2027
FIGURE 13 MINI C-ARMS SEGMENT IS EXPECTED TO ACCOUNT FOR THE LARGEST SHARE OF THE GLOBAL MOBILE C-ARM EQUIPMENT MARKET IN 2020 & 2027
FIGURE 14 ASIA-PACIFIC IS THE FASTEST GROWING MARKET FOR MOBILE C-ARM EQUIPMENT DEVELOPERS IN THE FORECAST PERIOD OF 2020 TO 2027
FIGURE 15 DRIVERS, RESTRAINTS, OPPORTUNITIES AND CHALLENGES OF GLOBAL MOBILE C-ARM EQUIPMENT MARKET
FIGURE 16 GERIATRIC POPULATIONS OF KEY COUNTRIES, BY COUNTRY (PERCENTAGE) (2014-2016)
FIGURE 17 GLOBAL AGEING POPULATION, BY REGIONS (MILLIONS) (2017 & 2050)
FIGURE 18 NORTH AMERICA AGEING POPULATION, BY COUNTRY (MILLION) (2017 & 2050)
FIGURE 19 EUROPE AGEING POPULATION, BY COUNTRY (MILLION) (2017 & 2050)
FIGURE 20 ASIA-PACIFIC AGEING POPULATION, BY COUNTRY (MILLION) (2017 & 2050)
FIGURE 21 PREVALENCE OF CHRONIC DISEASES
FIGURE 22 PERCENTAGE OF DEATHS WORLDWIDE
FIGURE 23 PERCENTAGE OF DEATHS IN EUROPEAN REGION
FIGURE 24 HEALTH SPENDING BY MAJOR SOURCES OF FUNDS
FIGURE 25 GLOBAL MOBILE C-ARM EQUIPMENT MARKET: BY TYPE, 2019
FIGURE 26 GLOBAL MOBILE C-ARM EQUIPMENT MARKET: BY TYPE, 2019-2027 (USD MILLION)
FIGURE 27 GLOBAL MOBILE C-ARM EQUIPMENT MARKET: BY TYPE, CAGR (2020-2027)
FIGURE 28 GLOBAL MOBILE C-ARM EQUIPMENT MARKET: BY TYPE, LIFELINE CURVE
FIGURE 29 GLOBAL MOBILE C-ARM EQUIPMENT MARKET: BY TECHNOLOGY, 2019
FIGURE 30 GLOBAL MOBILE C-ARM EQUIPMENT MARKET: BY TECHNOLOGY, 2019-2027 (USD MILLION)
FIGURE 31 GLOBAL MOBILE C-ARM EQUIPMENT MARKET: BY TECHNOLOGY, CAGR (2020-2027)
FIGURE 32 GLOBAL MOBILE C-ARM EQUIPMENT MARKET: BY TECHNOLOGY, LIFELINE CURVE
FIGURE 33 GLOBAL MOBILE C-ARM EQUIPMENT MARKET: BY APPLICATION, 2019
FIGURE 34 GLOBAL MOBILE C-ARM EQUIPMENT MARKET: BY APPLICATION, 2019-2027 (USD MILLION)
FIGURE 35 GLOBAL MOBILE C-ARM EQUIPMENT MARKET: BY APPLICATION, CAGR (2020-2027)
FIGURE 36 GLOBAL MOBILE C-ARM EQUIPMENT MARKET: BY APPLICATION, LIFELINE CURVE
FIGURE 37 GLOBAL MOBILE C-ARM EQUIPMENT MARKET: BY END USER , 2019
FIGURE 38 GLOBAL MOBILE C-ARM EQUIPMENT MARKET: BY END USER, 2019-2027 (USD MILLION)
FIGURE 39 GLOBAL MOBILE C-ARM EQUIPMENT MARKET: BY END USER, CAGR (2020-2027)
FIGURE 40 GLOBAL MOBILE C-ARM EQUIPMENT MARKET: BY END USER, LIFELINE CURVE
FIGURE 41 GLOBAL MOBILE C-ARM EQUIPMENT MARKET: BY DISTRIBUTION CHANNEL, 2019
FIGURE 42 GLOBAL MOBILE C-ARM EQUIPMENT MARKET: BY DISTRIBUTION CHANNEL, 2019-2027 (USD MILLION)
FIGURE 43 GLOBAL MOBILE C-ARM EQUIPMENT MARKET: BY DISTRIBUTION CHANNEL, CAGR (2020-2027)
FIGURE 44 GLOBAL MOBILE C-ARM EQUIPMENT MARKET: BY DISTRIBUTION CHANNEL, LIFELINE CURVE
FIGURE 45 GLOBAL MOBILE C-ARM EQUIPMENT MARKET: SNAPSHOT (2019)
FIGURE 46 GLOBAL MOBILE C-ARM EQUIPMENT MARKET: BY COUNTRY (2019)
FIGURE 47 GLOBAL MOBILE C-ARM EQUIPMENT MARKET: BY COUNTRY (2020 & 2027)
FIGURE 48 GLOBAL MOBILE C-ARM EQUIPMENT MARKET: BY COUNTRY (2019 & 2027)
FIGURE 49 GLOBAL MOBILE C-ARM EQUIPMENT MARKET: BY TYPE (2020-2027)
FIGURE 50 NORTH AMERICA MOBILE C-ARM EQUIPMENT MARKET: SNAPSHOT (2019)
FIGURE 51 NORTH AMERICA MOBILE C-ARM EQUIPMENT MARKET: BY COUNTRY (2019)
FIGURE 52 NORTH AMERICA MOBILE C-ARM EQUIPMENT MARKET: BY COUNTRY (2020 & 2027)
FIGURE 53 NORTH AMERICA MOBILE C-ARM EQUIPMENT MARKET: BY COUNTRY (2020 & 2027)
FIGURE 54 NORTH AMERICA MOBILE C-ARM EQUIPMENT MARKET: BY TYPE (2018-2027)
FIGURE 55 EUROPE MOBILE C-ARM EQUIPMENT MARKET: SNAPSHOT (2019)
FIGURE 56 EUROPE MOBILE C-ARM EQUIPMENT MARKET: BY COUNTRY (2019)
FIGURE 57 EUROPE MOBILE C-ARM EQUIPMENT MARKET: BY COUNTRY (2020 & 2027)
FIGURE 58 EUROPE MOBILE C-ARM EQUIPMENT MARKET: BY COUNTRY (2020 & 2027)
FIGURE 59 EUROPE MOBILE C-ARM EQUIPMENT MARKET: BY TYPE (2018-2027)
FIGURE 60 ASIA-PACIFIC MOBILE C-ARM EQUIPMENT MARKET: SNAPSHOT (2019)
FIGURE 61 ASIA-PACIFIC MOBILE C-ARM EQUIPMENT MARKET: BY COUNTRY (2019)
FIGURE 62 ASIA-PACIFIC MOBILE C-ARM EQUIPMENT MARKET: BY COUNTRY (2020 & 2027)
FIGURE 63 ASIA-PACIFIC MOBILE C-ARM EQUIPMENT MARKET: BY COUNTRY (2020 & 2027)
FIGURE 64 ASIA-PACIFIC MOBILE C-ARM EQUIPMENT MARKET: BY TYPE (2018-2027)
FIGURE 65 SOUTH AMERICA MOBILE C-ARM EQUIPMENT MARKET: SNAPSHOT (2019)
FIGURE 66 SOUTH AMERICA MOBILE C-ARM EQUIPMENT MARKET: BY COUNTRY (2019)
FIGURE 67 SOUTH AMERICA MOBILE C-ARM EQUIPMENT MARKET: BY COUNTRY (2020 & 2027)
FIGURE 68 SOUTH AMERICA MOBILE C-ARM EQUIPMENT MARKET: BY COUNTRY (2020 & 2027)
FIGURE 69 SOUTH AMERICA MOBILE C-ARM EQUIPMENT MARKET: BY TYPE (2018-2027)
FIGURE 70 MIDDLE EAST AND AFRICA MOBILE C-ARM EQUIPMENT MARKET: SNAPSHOT (2019)
FIGURE 71 MIDDLE EAST AND AFRICA MOBILE C-ARM EQUIPMENT MARKET: BY COUNTRY (2019)
FIGURE 72 MIDDLE EAST AND AFRICA MOBILE C-ARM EQUIPMENT MARKET: BY COUNTRY (2020 & 2027)
FIGURE 73 MIDDLE EAST AND AFRICA MOBILE C-ARM EQUIPMENT MARKET: BY COUNTRY (2020 & 2027)
FIGURE 74 MIDDLE EAST AND AFRICA MOBILE C-ARM EQUIPMENT MARKET: BY TYPE (2018-2027)
FIGURE 75 GLOBAL MOBILE C-ARM EQUIPMENT MARKET: COMPANY SHARE 2019 (%)
FIGURE 76 NORTH AMERICA MOBILE C-ARM EQUIPMENT MARKET: COMPANY SHARE 2019 (%)
FIGURE 77 EUROPE MOBILE C-ARM EQUIPMENT MARKET: COMPANY SHARE 2019 (%)
FIGURE 78 ASIA-PACIFIC MOBILE C-ARM EQUIPMENT MARKET: COMPANY SHARE 2019 (%)
Metodología de investigación
La recopilación de datos y el análisis del año base se realizan utilizando módulos de recopilación de datos con muestras de gran tamaño. La etapa incluye la obtención de información de mercado o datos relacionados a través de varias fuentes y estrategias. Incluye el examen y la planificación de todos los datos adquiridos del pasado con antelación. Asimismo, abarca el examen de las inconsistencias de información observadas en diferentes fuentes de información. Los datos de mercado se analizan y estiman utilizando modelos estadísticos y coherentes de mercado. Además, el análisis de la participación de mercado y el análisis de tendencias clave son los principales factores de éxito en el informe de mercado. Para obtener más información, solicite una llamada de un analista o envíe su consulta.
La metodología de investigación clave utilizada por el equipo de investigación de DBMR es la triangulación de datos, que implica la extracción de datos, el análisis del impacto de las variables de datos en el mercado y la validación primaria (experto en la industria). Los modelos de datos incluyen cuadrícula de posicionamiento de proveedores, análisis de línea de tiempo de mercado, descripción general y guía del mercado, cuadrícula de posicionamiento de la empresa, análisis de patentes, análisis de precios, análisis de participación de mercado de la empresa, estándares de medición, análisis global versus regional y de participación de proveedores. Para obtener más información sobre la metodología de investigación, envíe una consulta para hablar con nuestros expertos de la industria.
Personalización disponible
Data Bridge Market Research es líder en investigación formativa avanzada. Nos enorgullecemos de brindar servicios a nuestros clientes existentes y nuevos con datos y análisis que coinciden y se adaptan a sus objetivos. El informe se puede personalizar para incluir análisis de tendencias de precios de marcas objetivo, comprensión del mercado de países adicionales (solicite la lista de países), datos de resultados de ensayos clínicos, revisión de literatura, análisis de mercado renovado y base de productos. El análisis de mercado de competidores objetivo se puede analizar desde análisis basados en tecnología hasta estrategias de cartera de mercado. Podemos agregar tantos competidores sobre los que necesite datos en el formato y estilo de datos que esté buscando. Nuestro equipo de analistas también puede proporcionarle datos en archivos de Excel sin procesar, tablas dinámicas (libro de datos) o puede ayudarlo a crear presentaciones a partir de los conjuntos de datos disponibles en el informe.

