

Global Mezcal Market
Tamaño del mercado en miles de millones de dólares
Tasa de crecimiento anual compuesta (CAGR) :
% 
 USD
681.51 Million
USD
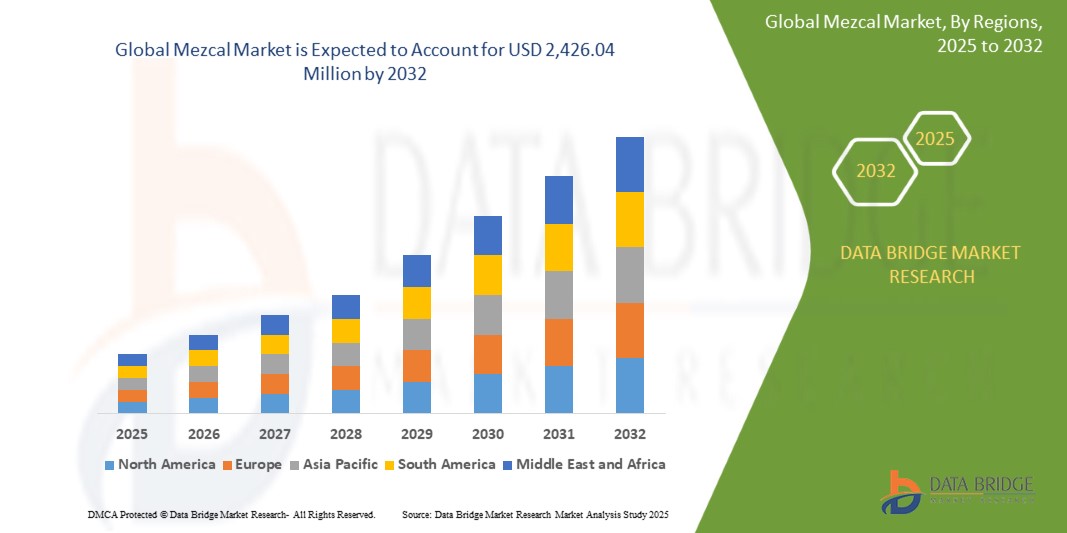
2,426.04 Million
2024
2032
USD
681.51 Million
USD
2,426.04 Million
2024
2032
| 2025 –2032 | |
| USD 681.51 Million | |
| USD 2,426.04 Million | |
| % | |
|
Segmentación del mercado global del mezcal, por tipo de producto (mezcal joven, mezcal reposado, mezcal añejo, mezcal espadín, mezcal tepztate, mezcal arroqueño, mezcal conjunto y otros), concentrado (tequila 100 % y tequila mixto), categoría de precio (premium, estándar y económico), contenido de alcohol por volumen (40 % o más y menos del 40 %), año (18-24 años, 25-44 años, 45-64 años y 65+ años), tipo de empaque (botella, latas y otros), tamaño (251-500 ml, 501-750 ml, 751-1000 ml y más de 100 ml), tipo de sabor (natural/original y saborizado), tipo de productor (microcervecería, destiladores, cervecerías artesanales, empresas cerveceras por contrato, cervecerías artesanales regionales, grandes cervecerías y Otros), Categoría de producto (Mezcan de destilería y Mezcan artesanal), Usuario final (Restaurantes, Hoteles y bares, Cafés, Catering, Aerolíneas, Hogar y otros), Canal de distribución (Comercio fuera de línea y Comercio en línea) - Tendencias de la industria y pronóstico hasta 2032
¿Cuál es el tamaño del mercado global del mezcal y su tasa de crecimiento?
- El tamaño del mercado mundial de mezcal se valoró en USD 681,51 millones en 2024 y se espera que alcance los USD 2.426,04 millones para 2032 , con una CAGR del 17,20% durante el período de pronóstico.
- El crecimiento del mercado está siendo impulsado por la creciente demanda mundial de bebidas espirituosas artesanales y premium, particularmente entre los consumidores más jóvenes y los profesionales de la coctelería que buscan bebidas auténticas y culturalmente ricas.
- Además, la creciente popularidad de la cocina y la cultura mexicanas, apoyada por eventos internacionales y el turismo, ha contribuido a aumentar la visibilidad y el potencial de exportación del mezcal, impulsando así la expansión del mercado global.
¿Cuáles son las principales conclusiones del mercado del mezcal?
- El mezcal, un licor tradicional mexicano elaborado a partir de agave, está ganando terreno a nivel mundial debido a su distintivo sabor ahumado, sus métodos de producción en lotes pequeños y su creciente atractivo en la cultura de los cócteles artesanales.
- El mercado está experimentando un rápido crecimiento, impulsado por la creciente premiumización de las bebidas alcohólicas, la expansión de los canales de distribución como el comercio electrónico y las tiendas especializadas, y un enfoque creciente en la sostenibilidad y las certificaciones orgánicas.
- Los consumidores se sienten cada vez más atraídos por productos artesanales ricos en patrimonio, lo que posiciona al mezcal como una alternativa de alto valor a las bebidas espirituosas convencionales como el tequila y el whisky.
- América del Norte dominó el mercado del mezcal con la mayor participación en los ingresos del 62,01 % en 2024, impulsada por el creciente interés de los consumidores en los licores premium, la producción artesanal y las auténticas experiencias culturales mexicanas.
- Se prevé que el mercado de mezcal de Asia-Pacífico crezca a la CAGR más rápida del 8,8 % entre 2025 y 2032, impulsado por la creciente influencia occidental, una creciente población de clase media y la expansión de la cultura de los bares en los centros urbanos.
- Mezcal Joven dominó el mercado del mezcal con la mayor participación en los ingresos del 78,5% en 2024, impulsado por su asequibilidad, su perfil de añejamiento más ligero y su sólida presencia en los mercados nacionales e internacionales.
Alcance del informe y segmentación del mercado del mezcal
|
Atributos |
Información clave del mercado del mezcal |
|
Segmentos cubiertos |
|
|
Países cubiertos |
Norteamérica
Europa
Asia-Pacífico
Oriente Medio y África
Sudamérica
|
|
Actores clave del mercado |
|
|
Oportunidades de mercado |
|
|
Conjuntos de datos de valor añadido |
Además de la información sobre escenarios de mercado como el valor de mercado, la tasa de crecimiento, la segmentación, la cobertura geográfica y los principales actores, los informes de mercado elaborados por Data Bridge Market Research también incluyen un análisis exhaustivo de expertos, análisis de precios, análisis de la cuota de marca, encuestas de consumidores, análisis demográfico, análisis de la cadena de suministro, análisis de la cadena de valor, descripción general de materias primas/consumibles, criterios de selección de proveedores, análisis PESTLE, análisis Porter y marco regulatorio |
¿Cuál es la tendencia clave en el mercado del mezcal?
“ La premiumización y el atractivo artesanal impulsan la preferencia del consumidor ”
- Una tendencia clave y en auge en el mercado global del mezcal es la creciente preferencia de los consumidores por bebidas espirituosas premium, de producción artesanal y de lotes pequeños, impulsada por el deseo de autenticidad, calidad y herencia cultural. Esto ha posicionado al mezcal como una opción destacada en el mercado general de bebidas alcohólicas.
- Por ejemplo, marcas como Del Maguey, Mezcal Vago e Ilegal Mezcal han ganado reconocimiento internacional al promover métodos tradicionales de destilación, variedades regionales de agave y perfiles de sabor únicos, atrayendo tanto a consumidores exigentes como a mixólogos.
- La tendencia de premiumización también está respaldada por el marketing basado en la narración, el abastecimiento transparente y las certificaciones como “100% agave” y el etiquetado orgánico, que ayudan a las marcas a generar confianza y distinguirse en entornos minoristas competitivos.
- Este cambio está transformando el mezcal de una bebida espirituosa de nicho a un producto de lujo convencional, particularmente entre los consumidores millennials y de la generación Z que priorizan la experiencia, la artesanía y la sostenibilidad en sus compras.
- Con la creciente demanda mundial, especialmente en EE. UU., Europa y Asia, los productores están expandiendo sus operaciones de exportación y desarrollando lotes de edición limitada para atender a mercados de alto nivel y programas de cócteles en lugares de hospitalidad de alta gama.
- Se espera que esta tendencia consolide aún más la posición de Mezcal en el segmento de bebidas espirituosas premium, apoyando el crecimiento sostenido del mercado y aumentando las valoraciones de la marca en todo el mundo.
¿Cuáles son los impulsores clave del mercado del mezcal?
- El creciente interés mundial en bebidas auténticas y con raíces culturales es un importante impulsor del mercado del mezcal, y los consumidores se sienten atraídos por la naturaleza artesanal y la identidad regional asociadas con el licor.
- Por ejemplo, en marzo de 2024, Pernod Ricard amplió su presencia en el mercado de bebidas espirituosas artesanales al adquirir una participación en Ojo de Tigre, una marca de mezcal de rápido crecimiento, lo que destaca la creciente confianza de los inversores en el potencial premium del mezcal.
- La creciente popularidad de la cocina mexicana y la cultura de la mixología en los mercados globales, junto con el creciente número de bares centrados en el mezcal y eventos educativos de degustación, está impulsando una mayor participación de los consumidores.
- Los consumidores preocupados por la salud también están contribuyendo al crecimiento, ya que muchos mezcales se producen con aditivos mínimos y métodos tradicionales, alineándose con la tendencia hacia productos naturales y orgánicos.
- La expansión de la presencia minorista, especialmente en tiendas libres de impuestos, licorerías especializadas y plataformas de comercio electrónico, está haciendo que el mezcal sea más accesible para el público internacional y mejorando la visibilidad del mercado.
¿Qué factor está desafiando el crecimiento del mercado del mezcal?
- Un desafío principal que enfrenta el mercado del mezcal es la disponibilidad limitada de plantas de agave, que requieren varios años para madurar y son esenciales para la producción auténtica de mezcal.
- Por ejemplo, la escasez de agave debido a la sobreexplotación y el aumento de la demanda han provocado limitaciones de suministro y un aumento de los costos de producción, lo que potencialmente limita la escalabilidad de los pequeños productores e infla los precios minoristas.
- Las preocupaciones ambientales y las prácticas agrícolas insostenibles están agravando el problema, ya que la deforestación y la plantación de monocultivos reducen la biodiversidad y tensionan los ecosistemas locales.
- Además, la proliferación de nuevas marcas no reguladas ha suscitado inquietudes sobre la dilución de la calidad y el etiquetado incorrecto, lo que podría confundir a los consumidores y dañar la reputación de la categoría.
- Para abordar estos desafíos, los líderes de la industria y las cooperativas locales abogan por el cultivo sostenible del agave, prácticas de comercio justo y protecciones regulatorias más sólidas en el marco de la Denominación de Origen.
- Resolver estos problemas es fundamental para mantener la integridad del producto y garantizar un crecimiento responsable a largo plazo de la industria del mezcal a escala global.
¿Cómo está segmentado el mercado del mezcal?
El mercado está segmentado según el tipo de producto, concentrado, categoría de precio, contenido de ABV, año, tipo de empaque, tamaño, tipo de sabor, tipo de productor, categoría de producto, usuario final y canal de distribución.
- Por tipo de producto
Según el tipo de producto, el mercado del mezcal se segmenta en Mezcal Joven, Mezcal Reposado, Mezcal Añejo, Mezcal Espadín, Mezcal Tepztate, Mezcal Arroqueño, Mezcal Ensamble y otros. El Mezcal Joven dominó el mercado con la mayor participación en ingresos del 78.5% en 2024. Este mezcal sin añejar o mínimamente añejado es el favorito por varias razones clave. Su asequibilidad lo convierte en un punto de entrada accesible para los nuevos consumidores que exploran la bebida espirituosa, mientras que su perfil de añejamiento más ligero permite que los sabores audaces, ahumados y puros del agave brillen con distinción. Este perfil de sabor puro hace del Joven una opción ideal para los mixólogos, que aprecian su versatilidad y su capacidad para agregar una profundidad ahumada característica a los cócteles sin las complejidades adicionales que introduce el añejamiento en barrica. Además, su fuerte presencia tanto en el mercado nacional (mexicano) como en el internacional subraya su amplio atractivo y su posición establecida como un producto básico en la categoría del mezcal
Se proyecta que el Mezcal Reposado experimentará la Tasa de Crecimiento Anual Compuesta (TCAC) más rápida entre 2025 y 2032. Este rápido crecimiento anticipado se debe principalmente al creciente interés de los consumidores por los destilados añejos y a la creciente tendencia a la premiumización dentro de la industria del alcohol. El Mezcal Reposado, que generalmente se añeja en barricas de roble durante un período que varía de dos meses a un año, desarrolla un perfil de sabor más suave y refinado en comparación con el Joven. El proceso de añejamiento imparte notas de vainilla, caramelo y una sutil influencia del roble, lo que atrae a los consumidores que aprecian una experiencia de bebida más suave y compleja. A medida que los consumidores buscan cada vez más destilados sofisticados y de mayor calidad y están dispuestos a pagar un precio superior por características únicas, el mezcal Reposado está bien posicionado para capitalizar esta tendencia, ofreciendo un puente entre la vibrante frescura del Joven y la profunda complejidad de las expresiones Añejo de mayor añejamiento.
- Por concentrado
En función del concentrado, el mercado del mezcal se segmenta en tequila 100 % y tequila mixto. El mezcal 100 % a base de tequila tuvo la mayor participación de mercado con un 61.4 % en 2024, impulsado por la preferencia de los consumidores por la pureza, la autenticidad y el contenido de agave de alta calidad
Se espera que el segmento de tequila mixto registre un crecimiento sostenido gracias a su asequibilidad y mayor alcance en mercados con presupuestos ajustados, así como para su uso en cócteles. Este aumento anticipado se debe a su asequibilidad y mayor accesibilidad, lo que lo hace especialmente atractivo para consumidores con presupuestos ajustados y sirve como una base versátil para cócteles.
- Por categoría de precio
Según la categoría de precio, el mercado se clasifica en Premium, Estándar y Económico. El segmento Premium lideró con una cuota de mercado del 45.6 % en 2024, respaldado por el aumento mundial de la demanda de licores artesanales y de alta gama. Los consumidores valoran cada vez más la producción en lotes pequeños y la herencia de la marca. Este dominio se debe en gran medida al creciente apetito mundial por los licores artesanales y de alta gama, ya que los consumidores demuestran una creciente apreciación por la producción en lotes pequeños y la rica herencia asociada a ciertas marcas
Se espera que el segmento Estándar crezca al ritmo más rápido, especialmente en las zonas urbanas y entre los consumidores de ingresos medios que buscan la premiumización a precios asequibles. Esta aceleración se espera particularmente en las zonas urbanas y entre los consumidores de ingresos medios que desean experimentar la premiumización sin un precio prohibitivo, buscando mezcal de calidad a un precio más accesible.
- Por contenido de alcohol por volumen
Categoría de precio: El mercado de alcohol por volumen (ABV) está segmentado en 40 % o más y menos del 40 %. El segmento de 40 % o más dominó el mercado con una participación del 68.2 % en 2024, atribuido a las formulaciones tradicionales de mezcal y a la fuerte preferencia de los consumidores por bebidas espirituosas de mayor graduación alcohólica con sabores intensos
Se proyecta que el segmento Menos del 40% gane terreno debido a la creciente conciencia sobre la salud y la creciente demanda de bebidas alcohólicas más ligeras y fáciles de beber.
- Por año
Por año, el mercado se segmenta en edades de 18 a 24 años, de 25 a 44 años, de 45 a 64 años y mayores de 65 años. El segmento de 25 a 44 años tuvo la mayor participación de mercado, con un 49,8 % en 2024, impulsado por los consumidores millennials y de la generación Z que exploran activamente las bebidas espirituosas artesanales y experiencias culturales únicas con alcohol.
También se espera que este grupo mantenga el mayor crecimiento debido a las preferencias de estilo de vida, el ingreso disponible y la participación activa en la cultura de bares y vida nocturna.
- Por tipo de embalaje
Según el tipo de embalaje, el mercado se segmenta en botellas, latas y otros. Los envases de botellas lideraron el mercado con una participación dominante del 84,1 % en 2024, debido a su tacto premium, atractivo visual e idoneidad para regalar y exhibir
Se prevé que las latas crezcan rápidamente debido a la portabilidad, las tendencias ecológicas y el creciente uso en cócteles premezclados a base de mezcal.
- Por tamaño
Según el tamaño, el mercado se segmenta en 251-500 ml, 501-750 ml, 751-1000 ml y más de 1000 ml. El segmento de tamaño de 501-750 ml dominó el mercado con una participación del 54.3 % en 2024, favorecido tanto por los consumidores locales como fuera de las instalaciones como el tamaño estándar para las bebidas espirituosas
Se espera que más de 1000 ml muestren un crecimiento sólido, especialmente en los canales mayoristas y de hostelería.
- Por tipo de sabor
Según el tipo de sabor, el mercado se segmenta en Natural/Original y Saborizado. El mezcal Natural/Original tuvo la mayor participación del 71.9% en 2024, respaldado por bebedores tradicionales y conocedores que prefieren la esencia de agave inalterada
Se prevé que el segmento de sabores, incluyendo variantes con infusiones frutales y especiadas, experimente un mayor crecimiento entre los bebedores nuevos y experimentales. Esta tendencia se debe a un mayor deseo del consumidor por experiencias de bebida novedosas y diversas, más allá de las bebidas tradicionales. Para quienes se inician en el mezcal, estas opciones saborizadas pueden ofrecer una entrada más accesible, introduciéndolos fácilmente al singular perfil ahumado del destilado con notas frutales o especiadas familiares. Además, la creciente cultura de los cócteles fomenta activamente la experimentación, con mixólogos y aficionados caseros que buscan ingredientes innovadores para crear bebidas únicas.
- Por tipo de productor
Según el tipo de productor, el mercado se segmenta en microcervecerías, destiladores, cervecerías artesanales, empresas cerveceras por contrato, cervecerías artesanales regionales, grandes cervecerías y otros. Los destiladores representaron la mayor cuota de mercado, con un 48,7 %, en 2024, beneficiándose de canales de distribución establecidos y una calidad constante
Las microcervecerías y las cervecerías artesanales regionales están cobrando impulso, impulsadas por el movimiento artesanal y las marcas regionales. Este crecimiento se ve impulsado por el floreciente movimiento artesanal, que prioriza productos únicos de producción pequeña, y por el atractivo de las marcas regionales que conectan a los consumidores con la producción local y sabores distintivos.
- Por categoría de producto
Según la categoría de productor, el mercado se segmenta en Mezcal de Destilería y Mezcal Artesanal. El Mezcal de Destilería mantuvo la participación dominante, representando el 59.6% del mercado. Este segmento comprende principalmente operaciones a gran escala enfocadas en una producción eficiente y de alto volumen, lo que les permite satisfacer eficazmente la amplia demanda. Su dominio se ve reforzado por un sólido reconocimiento de marca, a menudo respaldado por importantes esfuerzos de marketing y extensas redes de distribución, lo que garantiza que sus productos estén ampliamente disponibles y sean fácilmente identificables para una amplia base de consumidores. La consistencia en sabor y calidad que ofrecen estas destilerías más grandes también atrae a los consumidores que buscan una experiencia confiable y familiar.
Se prevé un rápido crecimiento del mezcal artesanal, ya que los consumidores buscan cada vez más experiencias auténticas, de producción en lotes pequeños y con trazabilidad. Este segmento abarca el mezcal elaborado con métodos tradicionales, a menudo ancestrales, por productores de lotes pequeños, muchos de los cuales son empresas familiares con profundas raíces en comunidades específicas. El auge previsto en esta categoría se debe al creciente deseo de autenticidad de los consumidores, quienes buscan cada vez más productos genuinos, con una rica cultura y un origen trazable. El atractivo de la producción en lotes pequeños implica exclusividad, una meticulosa atención al detalle y, a menudo, un perfil de sabor único que refleja directamente el terroir específico y la habilidad del artesano. Además, los consumidores modernos son cada vez más conscientes del impacto ético y ambiental de sus compras, lo que hace que la alta trazabilidad y las prácticas sostenibles que suelen asociarse con el mezcal artesanal sean particularmente atractivas.
- Por usuario final
En función del usuario final, el mercado se segmenta en restaurantes, hoteles y bares, cafeterías, catering, aerolíneas, hogares y otros. El segmento de hoteles y bares lideró el mercado con una participación del 34.5 % en 2024. Este dominio se atribuye principalmente a la demanda inherente de licores premium como el mezcal en entornos profesionales. En hoteles y bares, el mezcal es una opción popular para elaborar cócteles sofisticados, donde su perfil único de sabor ahumado y complejo añade profundidad y carácter a las bebidas mezcladas. Además, la tendencia de consumir mezcal "solo" (sin diluir) o como parte de una experiencia de degustación curada también contribuye significativamente a su presencia en estos establecimientos. Los consumidores a menudo buscan licores premium en dichos entornos para una experiencia de bebida social, preparada por expertos y, a menudo, exclusiva, que tal vez no puedan replicar en casa
Se prevé un crecimiento significativo del segmento Hogar debido al auge de la coctelería a domicilio y las plataformas de entrega de alcohol en línea. Este aumento anticipado se debe a dos factores clave: el auge de la coctelería a domicilio y la creciente prevalencia de las plataformas de entrega de alcohol en línea. La tendencia de la coctelería a domicilio, que cobró gran impulso durante los períodos de confinamiento y continúa prosperando debido a la evolución de las preferencias de estilo de vida y al deseo de entretenimiento económico, anima a los consumidores a invertir en licores y herramientas de coctelería para uso personal. Muchas personas ahora exploran la creación de cócteles en casa, y el mezcal, con su versatilidad, se adapta bien a esta creciente afición. Simultáneamente, la proliferación de plataformas de entrega de alcohol en línea ha revolucionado el acceso a una amplia gama de licores, incluido el mezcal. Estas plataformas ofrecen una comodidad inigualable, permitiendo a los consumidores explorar y comprar sus bebidas preferidas desde la comodidad de sus hogares y recibirlas directamente en su domicilio.
- Por canal de distribución
Según el canal de distribución, el mercado se segmenta en comercio físico y comercio en línea. El comercio físico tuvo la participación dominante del 76.2 % en 2024, incluyendo licorerías, supermercados y puntos de venta especializados donde los consumidores pueden examinar físicamente los productos. Este segmento abarca las vías minoristas tradicionales, como licorerías especializadas, grandes supermercados y puntos de venta especializados, todos los cuales brindan a los consumidores la invaluable oportunidad de examinar físicamente los productos antes de comprarlos. Esta interacción práctica es un factor crucial que contribuye a su posición dominante, ya que permite a los consumidores evaluar las botellas, leer las etiquetas y, cuando está permitido, participar en catas para discernir los perfiles de aroma y sabor, lo cual es particularmente importante para una bebida espirituosa con matices como el mezcal
Se prevé una rápida expansión del comercio electrónico debido a los cambios en los hábitos de compra, el crecimiento del comercio electrónico y las estrategias D2C (venta directa al consumidor) de las marcas de mezcal. El cambio fundamental en los hábitos de compra de los consumidores hacia las plataformas digitales en diversas categorías de productos es un catalizador fundamental, ya que los consumidores valoran cada vez más la comodidad, la mayor variedad y, a menudo, los precios competitivos que ofrece el comercio electrónico. Este crecimiento generalizado del comercio electrónico, respaldado por los avances en las plataformas en línea, los sistemas de pago seguros y una logística eficiente, sienta las bases para el crecimiento de las ventas de mezcal en línea. Fundamentalmente, la adopción de estrategias D2C (venta directa al consumidor) por parte de las marcas de mezcal es un importante acelerador para este segmento.
¿Qué región concentra la mayor participación del mercado del mezcal?
- América del Norte dominó el mercado del mezcal con la mayor participación en los ingresos del 62,01 % en 2024, impulsada por el creciente interés de los consumidores en los licores premium, la producción artesanal y las auténticas experiencias culturales mexicanas.
- La demanda de la región está fuertemente influenciada por la población millennial y la generación Z, quienes valoran los licores artesanales, sostenibles y únicos. La creciente presencia del mezcal en la coctelería y los bares de lujo impulsa aún más su consumo.
- La sólida red de distribución de América del Norte, que incluye licorerías especializadas, bares premium y canales de comercio electrónico, mejora la accesibilidad y la participación del consumidor con los productos de mezcal.
Perspectiva del mercado del mezcal en EE. UU.
El mercado estadounidense del mezcal dominó la cuota de mercado en Norteamérica en 2024, impulsado por la creciente tendencia de las bebidas artesanales y el cambio en las preferencias de los consumidores hacia los licores de agave. La creciente cultura de los cócteles y el posicionamiento premium del mezcal como bebida artesanal han acelerado su adopción. La innovación en la marca, el apoyo de celebridades y la disponibilidad en tiendas minoristas de alta gama están fortaleciendo aún más la presencia del mezcal en el panorama estadounidense de las bebidas espirituosas.
Perspectivas del mercado del mezcal en Europa
Se espera que el mercado europeo del mezcal crezca a una sólida tasa de crecimiento anual compuesta (TCAC) durante el período de pronóstico, impulsado por el creciente interés de los consumidores en bebidas exóticas y artesanales. Los consumidores de toda Europa, especialmente en las zonas urbanas, se sienten cada vez más atraídos por las bebidas espirituosas premium con un rico legado cultural, y prefieren el mezcal por su distintivo sabor ahumado y su proceso de producción tradicional. Este crecimiento se ve impulsado aún más por la expansión del consumo en hostelería, la creciente influencia de las cocinas internacionales y el aumento de las importaciones en Alemania, España y el Reino Unido.
Perspectivas del mercado del mezcal en el Reino Unido
Se proyecta un crecimiento significativo del mercado del mezcal en el Reino Unido debido al auge de las bebidas espirituosas de agave entre los consumidores más jóvenes y los aficionados a los cócteles. El segmento de bebidas espirituosas premium del país continúa expandiéndose, y el mezcal gana espacio tanto en el comercio minorista como en la hostelería. Eventos como las catas de mezcal y la inclusión en programas de mixología están promoviendo su conocimiento y adopción tanto en el mercado general como en el de lujo.
Perspectivas del mercado del mezcal en Alemania
Alemania se perfila como un mercado clave en crecimiento en Europa, con una demanda impulsada por el creciente interés de los consumidores en las bebidas espirituosas artesanales y las prácticas de producción sostenibles. Los alemanes buscan cada vez más experiencias con bebidas alcohólicas auténticas y especializadas, y la producción tradicional y las cualidades orgánicas del mezcal atraen a compradores con conciencia ambiental. Los bares y licorerías especializadas en las principales ciudades contribuyen a su visibilidad y al crecimiento del consumo.
¿Cuál es la región de mayor crecimiento en el mercado del mezcal?
Se prevé que el mercado del mezcal en Asia-Pacífico crezca a la tasa de crecimiento anual compuesta (TCAC) más rápida, del 8,8 %, entre 2025 y 2032, impulsada por la creciente influencia occidental, el aumento de la clase media y la expansión de la cultura de los bares en los centros urbanos. Países como Japón, China y Corea del Sur experimentan un creciente interés en las bebidas espirituosas internacionales premium, y los consumidores más jóvenes buscan opciones únicas y con una rica cultura como el mezcal. El apoyo gubernamental a las importaciones culturales, la creciente penetración del comercio electrónico y la exposición al mezcal impulsada por el turismo están impulsando la entrada y la expansión en el mercado.
Perspectivas del mercado del mezcal en Japón
El mercado japonés del mezcal está en expansión debido a la gran afinidad del país por los licores artesanales y de alta calidad. Los millennials urbanos y los profesionales de la hostelería muestran un creciente interés en los cócteles a base de mezcal, mientras que los importadores y distribuidores locales se centran en promover la cultura mexicana y los licores de agave. Las ediciones limitadas y los embotellados artesanales son especialmente populares en el segmento de licores premium de Japón.
Perspectivas del mercado del mezcal en China
China representó la mayor cuota de mercado en Asia-Pacífico en 2024, impulsada por el aumento de la renta disponible y la creciente demanda de bebidas alcohólicas premium importadas. El auge del consumo de lujo y la cultura nocturna urbana están posicionando al mezcal como un producto aspiracional entre los millennials adinerados. El marketing estratégico, las alianzas locales y la creciente visibilidad a través de plataformas de venta de bebidas alcohólicas en línea son factores clave para la expansión del mercado en China.
¿Cuáles son las principales empresas en el mercado del mezcal?
La industria del mezcal está liderada principalmente por empresas bien establecidas, entre ellas:
- Davide Campari-Milano NV (Italia)
- BACARDI (Bermudas)
- Destiladores Artesanales (EE. UU.)
- MADRE MEZCAL (EE. UU.)
- Familia Camarena (México)
- Brown-Forman (EE. UU.)
- Diageo (Reino Unido)
- Pernod Ricard (Francia)
- WILLIAM GRANT & SONS LTD (Escocia)
- Rey Campero (México)
- Tequila y Mezcal Marcas Privadas SA de CV (México)
- Destilería Tlacolula (México)
- (Estados Unidos)
- Compañía importadora de tequila Sauza (EE. UU.)
- Dos Hombres LLC (EE. UU.)
- Del Maguey (EE. UU.)
- Mezcal Wahaka (México)
- MEZCAL BOZAL Sombra (México)
- Mezcal Pensador (México)
- Mezcal ilegal (EE. UU.)
¿Cuáles son los desarrollos recientes en el mercado global del mezcal?
- En agosto de 2023, Nosotros Tequila y Mezcal anunciaron una alianza estratégica con Republic National Distributing Company (RNDC). Esta colaboración busca mejorar la distribución de bebidas espirituosas de agave en diversos mercados. Al ampliar la cartera de productos de agave de RNDC, la alianza busca satisfacer la creciente demanda de bebidas espirituosas de agave premium, impulsando el crecimiento de la marca y aumentando su presencia en el mercado.
- En junio de 2022, Madre Mezcal, una marca mexicana certificada de mezcal artesanal, presentó su cóctel enlatado listo para beber, "Agua del Desierto". Esta refrescante bebida combina mezcal Madre Espadín con agua con gas, fruta natural y una selección de hierbas y plantas. El lanzamiento de este cóctel refleja una tendencia creciente en la industria de las bebidas espirituosas, atrayendo a los consumidores que buscan opciones de cócteles prácticas y de alta calidad que conserven el auténtico sabor del mezcal.
- En marzo de 2022, Lobos 1707, de la Compañía Tequilera de Arandas SA de CV, marca de tequila y mezcal ultra premium, anunció con orgullo su expansión al mercado canadiense. El lanzamiento se celebró con un evento oficial en Toronto, lo que marca un hito importante para la marca. Esta estrategia fortalece la presencia internacional de Lobos 1707 y aprovecha la creciente demanda de bebidas espirituosas de agave de alta calidad entre los consumidores canadienses.
- En enero de 2022, Diageo PLC, líder mundial en bebidas alcohólicas, adquirió la marca premium de mezcal artesanal Mezcal Unión mediante la compra de Casa UM. Esta adquisición permite a Diageo ampliar significativamente su oferta de mezcal. Como uno de los principales productores de mezcal, la exclusiva gama de productos de Mezcal Unión complementará el extenso portafolio de Diageo, mejorando su competitividad en el creciente segmento del mezcal.
- En agosto de 2021, Diageo PLC anunció su intención de adquirir la marca de mezcal artesanal Mezcal Unión mediante la compra de Casa UM. Esta adquisición estratégica busca fortalecer la presencia de Diageo en el creciente mercado del mezcal. Al incorporar Mezcal Unión a su portafolio, Diageo busca aprovechar sus capacidades de marketing y red de distribución para mejorar la visibilidad y la accesibilidad de la marca en el competitivo mercado de las bebidas espirituosas.
SKU-
Obtenga acceso en línea al informe sobre la primera nube de inteligencia de mercado del mundo

- Panel de análisis de datos interactivo
- Panel de análisis de empresas para oportunidades con alto potencial de crecimiento
- Acceso de analista de investigación para personalización y consultas
- Análisis de la competencia con panel interactivo
- Últimas noticias, actualizaciones y análisis de tendencias
- Aproveche el poder del análisis de referencia para un seguimiento integral de la competencia
Metodología de investigación
La recopilación de datos y el análisis del año base se realizan utilizando módulos de recopilación de datos con muestras de gran tamaño. La etapa incluye la obtención de información de mercado o datos relacionados a través de varias fuentes y estrategias. Incluye el examen y la planificación de todos los datos adquiridos del pasado con antelación. Asimismo, abarca el examen de las inconsistencias de información observadas en diferentes fuentes de información. Los datos de mercado se analizan y estiman utilizando modelos estadísticos y coherentes de mercado. Además, el análisis de la participación de mercado y el análisis de tendencias clave son los principales factores de éxito en el informe de mercado. Para obtener más información, solicite una llamada de un analista o envíe su consulta.
La metodología de investigación clave utilizada por el equipo de investigación de DBMR es la triangulación de datos, que implica la extracción de datos, el análisis del impacto de las variables de datos en el mercado y la validación primaria (experto en la industria). Los modelos de datos incluyen cuadrícula de posicionamiento de proveedores, análisis de línea de tiempo de mercado, descripción general y guía del mercado, cuadrícula de posicionamiento de la empresa, análisis de patentes, análisis de precios, análisis de participación de mercado de la empresa, estándares de medición, análisis global versus regional y de participación de proveedores. Para obtener más información sobre la metodología de investigación, envíe una consulta para hablar con nuestros expertos de la industria.
Personalización disponible
Data Bridge Market Research es líder en investigación formativa avanzada. Nos enorgullecemos de brindar servicios a nuestros clientes existentes y nuevos con datos y análisis que coinciden y se adaptan a sus objetivos. El informe se puede personalizar para incluir análisis de tendencias de precios de marcas objetivo, comprensión del mercado de países adicionales (solicite la lista de países), datos de resultados de ensayos clínicos, revisión de literatura, análisis de mercado renovado y base de productos. El análisis de mercado de competidores objetivo se puede analizar desde análisis basados en tecnología hasta estrategias de cartera de mercado. Podemos agregar tantos competidores sobre los que necesite datos en el formato y estilo de datos que esté buscando. Nuestro equipo de analistas también puede proporcionarle datos en archivos de Excel sin procesar, tablas dinámicas (libro de datos) o puede ayudarlo a crear presentaciones a partir de los conjuntos de datos disponibles en el informe.

