

Global Mainframe Market
Tamaño del mercado en miles de millones de dólares
Tasa de crecimiento anual compuesta (CAGR) :
% 
 USD
30.01 Billion
USD
41.31 Billion
2024
2032
USD
30.01 Billion
USD
41.31 Billion
2024
2032
| 2025 –2032 | |
| USD 30.01 Billion | |
| USD 41.31 Billion | |
| % | |
|
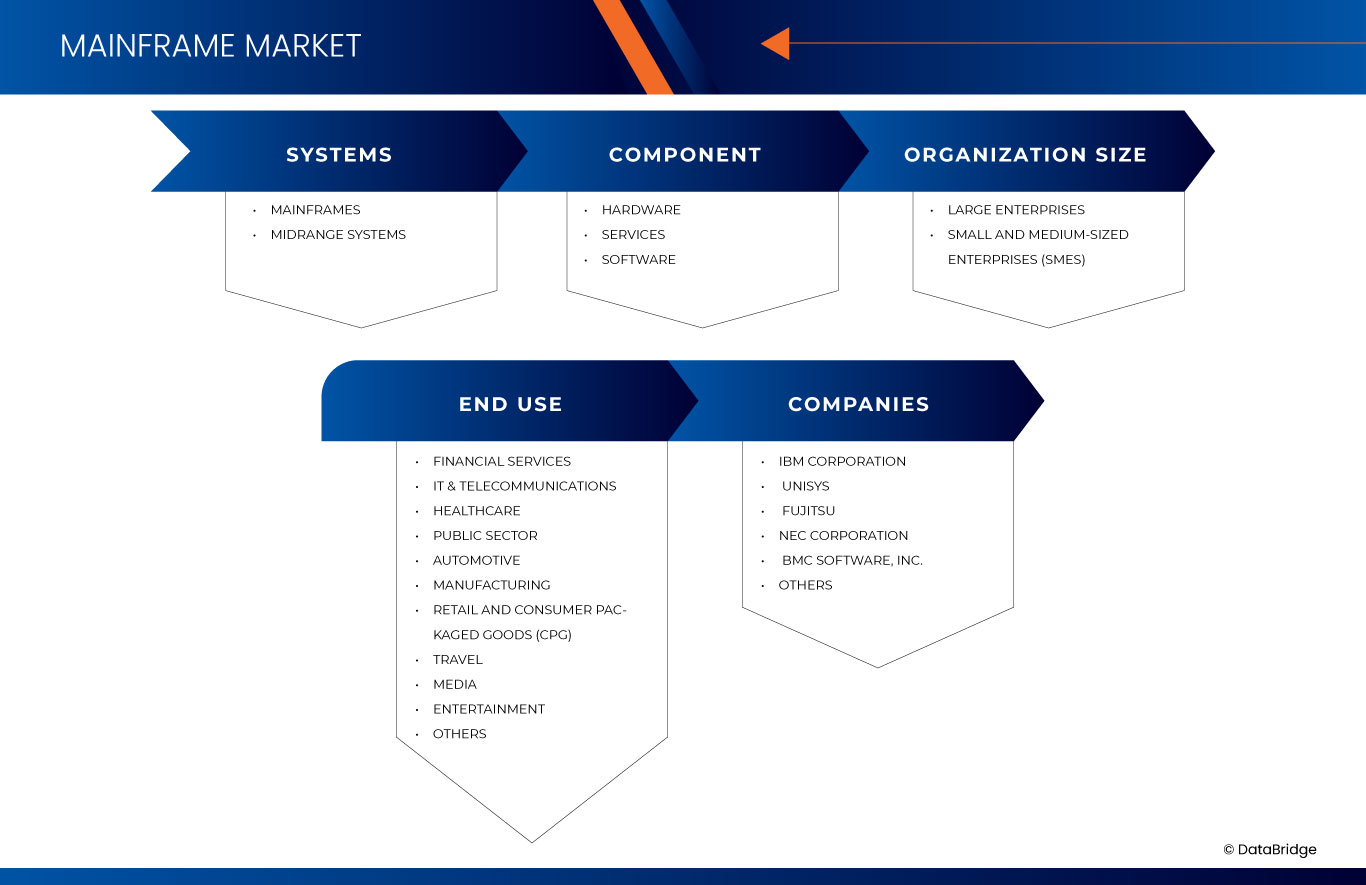
Segmentación del mercado global de mainframes por sistemas (mainframes y sistemas de gama media), componentes (hardware, servicios y software), tamaño de la organización (grandes empresas y pequeñas y medianas empresas [pymes]), uso final (servicios financieros, TI y telecomunicaciones, atención médica, sector público, automoción y manufactura, comercio minorista y bienes de consumo envasados [CPG], viajes, medios de comunicación y entretenimiento, entre otros): tendencias del sector y pronóstico hasta 2032.
Tamaño del mercado de mainframes
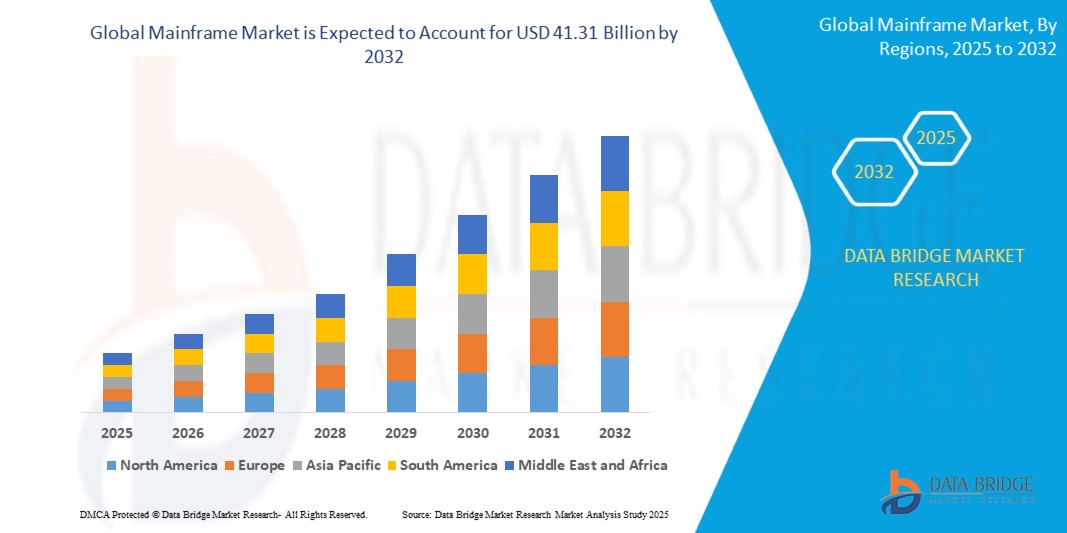
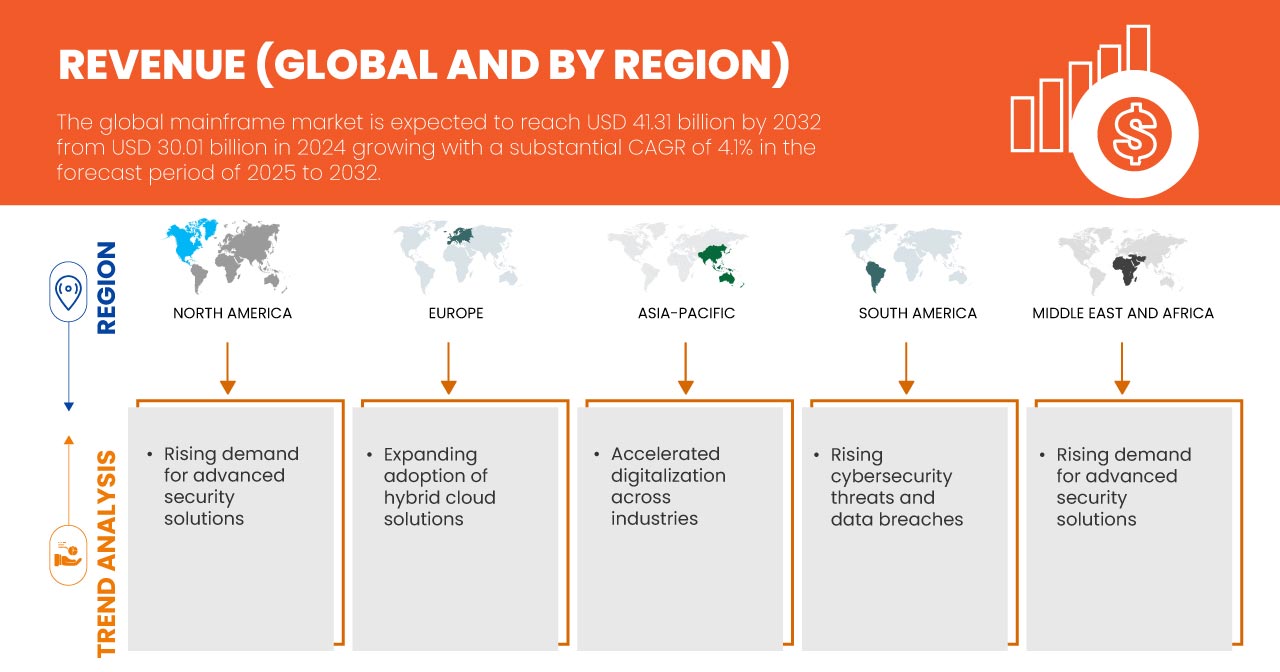
- El mercado global de mainframes se valoró en USD 30.010 millones en 2024 y se espera que alcance los USD 41.310 millones en 2032.
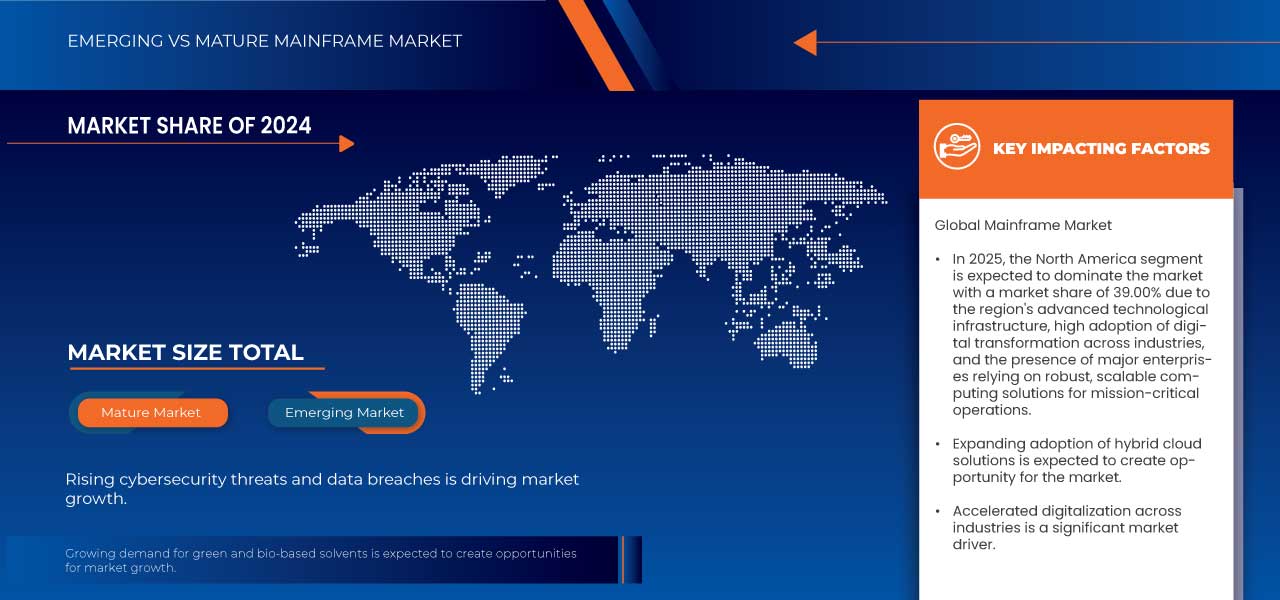
- Durante el período de pronóstico de 2025 a 2032, es probable que el mercado crezca a una CAGR del 4,1 %, impulsado principalmente por la digitalización acelerada en todas las industrias y las crecientes amenazas de ciberseguridad y violaciones de datos.
- Este crecimiento está impulsado por factores como las crecientes necesidades de procesamiento de datos, la integración de la nube, las demandas de ciberseguridad, la adopción de IA y la creciente transformación digital empresarial.
Análisis del mercado global de mainframes
- Los mainframes son sistemas informáticos críticos utilizados en diversas industrias, que proporcionan procesamiento de alto rendimiento, seguridad y fiabilidad para operaciones complejas. Se utilizan ampliamente en los sectores de banca, servicios financieros y seguros (BFSI), salud y gobierno.
- La demanda de mainframes se ve impulsada significativamente por la creciente tendencia a la digitalización, las crecientes amenazas a la ciberseguridad y la necesidad de procesamiento de datos de alta velocidad. Industrias como BFSI dependen de mainframes para el procesamiento de transacciones, los sistemas bancarios centrales, la gestión de riesgos y el cumplimiento normativo.
- La región de América del Norte se destaca como uno de los mercados dominantes para mainframes, impulsado por una sólida infraestructura de TI empresarial, crecientes inversiones en ciberseguridad y una alta adopción en instituciones financieras y operaciones gubernamentales.
- Por ejemplo, los principales bancos y proveedores de atención médica de EE. UU. dependen en gran medida de los mainframes para el procesamiento de transacciones en tiempo real y el almacenamiento seguro de datos, lo que garantiza operaciones ininterrumpidas y cumplimiento normativo.
- A nivel mundial, los mainframes se encuentran entre los sistemas informáticos más esenciales, reconocidos por sus características de seguridad superiores, que incluyen cifrado, control de acceso, monitoreo de seguridad y alta disponibilidad, lo que los convierte en la opción preferida para aplicaciones de misión crítica en los sectores de finanzas, atención médica y gobierno.
Alcance del informe y segmentación del mercado
|
Atributos |
Perspectivas clave del mercado global de mainframes |
|
Segmentos cubiertos |
|
|
Países cubiertos |
América del norte
Europa
Asia-Pacífico
Oriente Medio y África
Sudamerica
|
|
Actores clave del mercado |
|
|
Oportunidades de mercado |
|
|
Conjuntos de información de datos de valor añadido |
Además de los conocimientos sobre escenarios de mercado, como valor de mercado, tasa de crecimiento, segmentación, cobertura geográfica y actores principales, los informes de mercado seleccionados por Data Bridge Market Research también incluyen análisis en profundidad de expertos, análisis de precios, análisis de participación de marca, encuesta de consumidores, análisis demográfico, análisis de la cadena de suministro, análisis de la cadena de valor, descripción general de materias primas/consumibles, criterios de selección de proveedores, análisis PESTLE, análisis de Porter y marco regulatorio. |
Tendencias del mercado global de mainframes
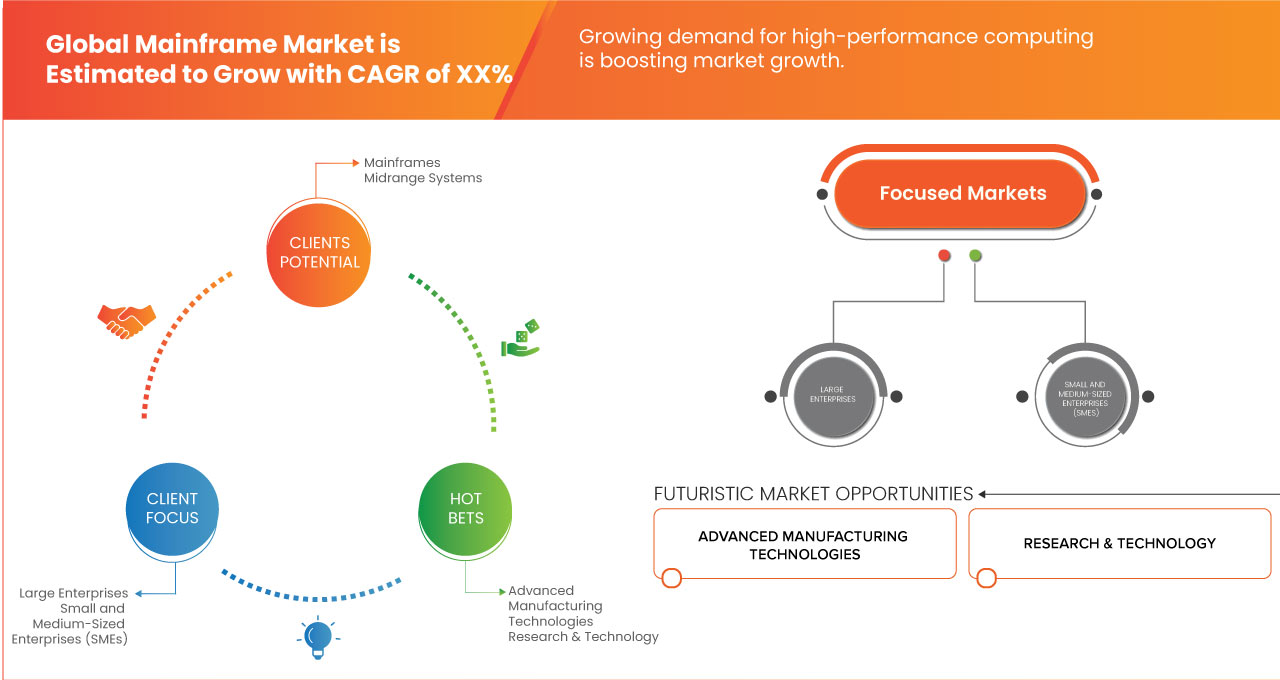
Creciente demanda de informática de alto rendimiento
- La creciente demanda de sistemas informáticos potentes está impulsada por la explosión de datos en la era digital, lo que requiere soluciones HPC capaces de procesar y analizar conjuntos de datos masivos y complejos.
- El auge de la inteligencia artificial (IA) y el aprendizaje automático (ML) ha contribuido significativamente a la creciente necesidad de HPC, ya que los algoritmos de IA y ML requieren una inmensa potencia computacional para entrenar y optimizar los modelos de manera eficiente.
- Por ejemplo, en abril de 2023, TechDay publicó un artículo que afirmaba que el gobierno de los Emiratos Árabes Unidos comenzó a impulsar los objetivos de transformación digital. Muchos de estos se conocen como Smart Dubai y Smart Abu Dhabi. Se espera que estas actividades aumenten la demanda de computación de alto rendimiento.
- Más allá de las aplicaciones científicas, HPC está revolucionando el análisis de negocios, permitiendo a las empresas procesar grandes cantidades de datos para optimizar las cadenas de suministro, predecir el comportamiento de los clientes e identificar tendencias del mercado, lo que conduce a una toma de decisiones más informada y a ventajas competitivas.
Dinámica del mercado global de mainframes
Conductores
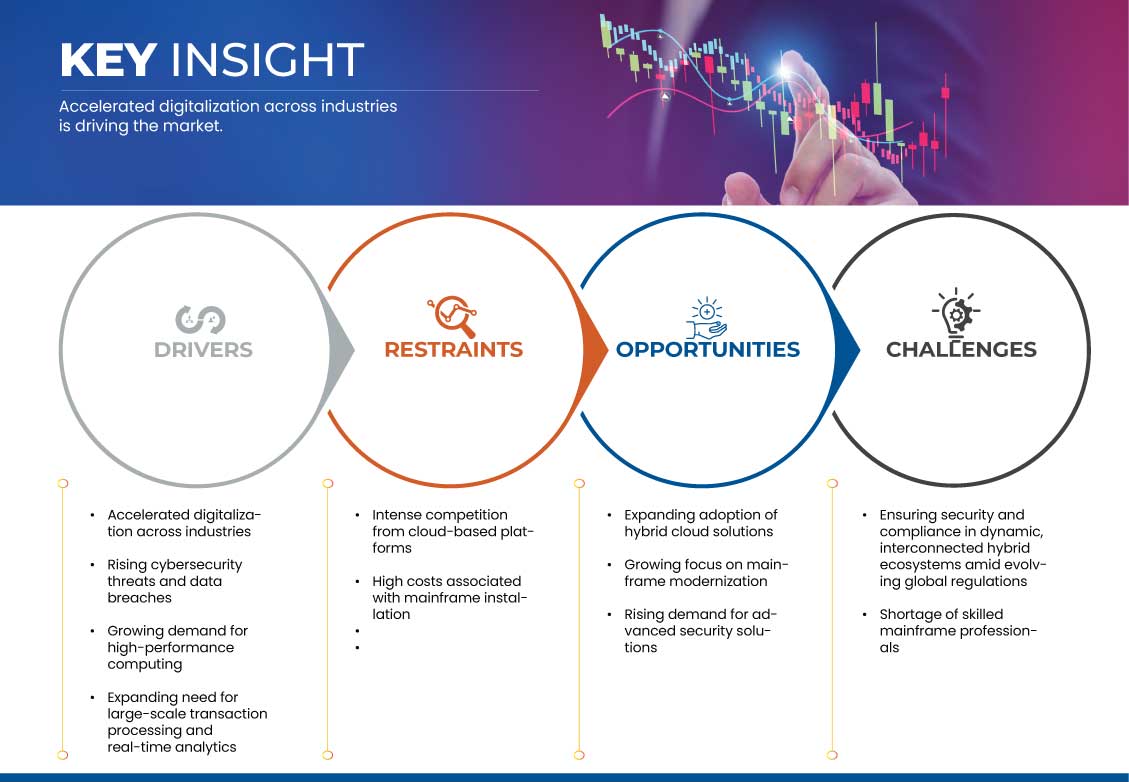
“ Digitalización acelerada en todas las industrias ”
- La creciente tendencia a la digitalización en los sectores bancario, de servicios financieros y seguros (BFSI) y de la salud está impulsando significativamente la demanda de mainframes, ya que las organizaciones requieren una infraestructura informática segura y confiable.
- Los mainframes desempeñan un papel fundamental en las aplicaciones de procesamiento de transacciones de gran volumen, incluidas las transacciones en cajeros automáticos, el procesamiento de tarjetas de crédito y la negociación de acciones, donde la escalabilidad, la confiabilidad y la seguridad son esenciales.
- En el sector bancario, los mainframes sirven como columna vertebral de los sistemas bancarios centrales y respaldan funciones clave como la gestión de cuentas de clientes, el procesamiento de préstamos y el procesamiento de pagos, lo que garantiza operaciones financieras fluidas.
- La industria de la salud depende cada vez más de mainframes para manejar registros médicos electrónicos (EMR), que proporcionan la potencia de procesamiento, la seguridad y la disponibilidad necesarias para gestionar grandes volúmenes de datos confidenciales de pacientes.
- A medida que las instituciones financieras y los proveedores de atención médica continúan adoptando soluciones digitales, crece la necesidad de sistemas informáticos de alto rendimiento, como mainframes, que garanticen operaciones seguras, eficientes e ininterrumpidas.
Por ejemplo,
- Según un informe de IBM, un mainframe se utiliza como cajero automático (ATM) para interactuar con la cuenta bancaria del cliente. Las empresas utilizan mainframes para aplicaciones que requieren escalabilidad y fiabilidad. Por ejemplo, una institución bancaria podría usar un mainframe para alojar la base de datos de las cuentas de sus clientes, cuyas transacciones pueden enviarse desde miles de cajeros automáticos en todo el mundo. El informe también menciona que en la banca, las finanzas, la sanidad, los seguros, los servicios públicos, la administración pública y muchas otras empresas públicas y privadas, el mainframe sigue siendo la base de los negocios modernos.
- En diciembre de 2020, Maintec Technologies publicó un artículo que afirmaba que el requisito de intercambiar los historiales clínicos de los pacientes entre las organizaciones ha generado una demanda de historiales clínicos electrónicos (HCE) estandarizados, lo que requiere un mayor almacenamiento similar al de un mainframe, así como estándares web similares a Linux. También se menciona que el mainframe ofrece altos estándares de seguridad y cumplimiento normativo. El sector sanitario necesita los sistemas más seguros disponibles para proteger estos datos. Los mainframes tienen la reputación de ser la plataforma más segura. Los servidores y el software de mainframe ahora cuentan con un cifrado de datos generalizado. Estas medidas de seguridad ayudan a las organizaciones sanitarias a proteger los datos y la privacidad de sus pacientes.
Oportunidades
“ Creciente enfoque en la modernización del mainframe ”
- La integración de la nube híbrida está transformando el mercado de mainframe, permitiendo a las empresas conectar sin problemas los sistemas locales con los entornos de nube manteniendo un alto rendimiento, seguridad y escalabilidad.
- Las organizaciones están adoptando cada vez más arquitecturas de nube híbrida para optimizar las cargas de trabajo, administrar grandes volúmenes de datos y respaldar aplicaciones de misión crítica, garantizando operaciones eficientes e ininterrumpidas.
- Los mainframes desempeñan un papel crucial en el procesamiento de datos en tiempo real y las transacciones seguras, lo que los hace esenciales para industrias como la banca, los seguros y el comercio minorista, donde la seguridad de los datos y la continuidad operativa son las principales prioridades.
- Las soluciones de nube híbrida permiten a las organizaciones conservar datos confidenciales en sus instalaciones y, al mismo tiempo, aprovechar la rentabilidad y la flexibilidad de la computación en la nube, mejorando la modernización de la infraestructura de TI.
Restricciones/Desafíos
“ Intensa competencia de las plataformas basadas en la nube ”
- A pesar del auge de la computación en la nube, los mainframes siguen siendo una parte esencial de la infraestructura de TI y ofrecen beneficios únicos que las soluciones en la nube no pueden reemplazar por completo.
- La computación en la nube proporciona una mayor flexibilidad que la tecnología mainframe, lo que permite a las organizaciones ampliar o reducir los recursos según la demanda, mejorando la eficiencia y reduciendo los costos.
- Para cargas de trabajo específicas, la computación en la nube puede ser una opción más rentable, ya que los modelos de precios de pago por uso permiten a las organizaciones pagar solo por los recursos que utilizan.
- La computación en la nube mejora la accesibilidad, permitiendo a las organizaciones con presencia global acceder a recursos informáticos desde cualquier parte del mundo, facilitando las operaciones remotas.
- Los proveedores de la nube gestionan el mantenimiento de la infraestructura, lo que reduce la carga de las organizaciones y libera tiempo y recursos para las funciones comerciales principales.
Por ejemplo,
- En septiembre de 2022, InfoWorld publicó un artículo que afirmaba que FedEx había anunciado que para 2024 cerraría sus centros de datos y los mainframes que los acompañaban para pasar "todo" a la nube (probablemente Microsoft Azure, si los hábitos de compra anteriores continúan).
- En marzo de 2022, Fujitsu publicó un artículo que afirmaba que la compañía dejaría de fabricar soluciones mainframe en los próximos nueve años. Recientemente, Fujitsu reveló que finalizaría la venta de sus mainframes en abril de 2031 y que suspendería el soporte cinco años después. La dirección de la compañía afirmó que Fujitsu mantiene un gran interés en el mercado de mainframes, con un nuevo modelo aún en su hoja de ruta para 2024 y un proceso en marcha para migrar sus mainframes y servidores UNIX a la nube, mejorando gradualmente sus sistemas empresariales existentes para optimizar la experiencia de sus usuarios finales. Este desarrollo explica que las organizaciones están perdiendo la confianza en las soluciones mainframe.
- En diciembre de 2021, Informa USA Inc. publicó un informe sobre mainframes. En este informe, se menciona que AWS anunció un nuevo servicio gestionado que permite a las empresas migrar cargas de trabajo de mainframes a la nube. Las empresas están logrando integrar mainframes en la nube.
Alcance del mercado de mainframes
El mercado está segmentado en función de los sistemas, los componentes, el tamaño de la organización y el uso final.
|
Segmentación |
Subsegmentación |
|
Por sistemas |
|
|
Por componente |
|
|
Por tamaño de la organización |
|
|
Por uso final
|
|
Análisis regional del mercado de mainframes
Norteamérica es la región dominante en el mercado de mainframes
- América del Norte lidera el mercado de mainframes, impulsada por una fuerte presencia de actores clave de la industria, la adopción temprana de infraestructura de TI avanzada e inversiones significativas en transformación digital.
- Estados Unidos tiene una participación importante, impulsada por la alta demanda de computación segura y de alto rendimiento, la creciente integración de la nube y la creciente adopción de aplicaciones de inteligencia artificial y aprendizaje automático.
- Las preocupaciones sobre el cumplimiento normativo y la ciberseguridad fortalecen aún más el mercado, ya que las organizaciones de los sectores bancario, financiero y gubernamental priorizan soluciones informáticas seguras y confiables.
- Además, las crecientes inversiones en la modernización de mainframes, junto con los continuos avances tecnológicos, contribuyen a la creciente adopción de mainframes en industrias críticas de la región.
Se proyecta que América del Norte registre la mayor tasa de crecimiento.
- Se espera que América del Norte sea testigo de un crecimiento significativo en el mercado de mainframes, impulsado por la adopción temprana de infraestructura de TI avanzada, el aumento de las inversiones en transformación digital y una fuerte demanda de soluciones informáticas seguras.
- Países como Estados Unidos y Canadá son mercados clave, con industrias como la banca, las finanzas y el gobierno que dependen de mainframes para aplicaciones de misión crítica, cumplimiento normativo y ciberseguridad.
- Estados Unidos, con su sólida presencia de empresas líderes de TI y sus continuos avances en IA e integración en la nube, sigue siendo un mercado dominante para mainframes. El país continúa impulsando la innovación en informática de alto rendimiento y seguridad de datos.
- Canadá también está experimentando una mayor adopción de mainframes, particularmente en instituciones financieras y sectores gubernamentales, a medida que las organizaciones priorizan los esfuerzos de modernización y la integración de la nube híbrida para mejorar la eficiencia operativa y la escalabilidad.
Cuota de mercado de mainframes
El panorama competitivo del mercado ofrece detalles por competidor. Se incluye información general de la empresa, sus estados financieros, ingresos generados, potencial de mercado, inversión en investigación y desarrollo, nuevas iniciativas de mercado, presencia global, plantas de producción, capacidad de producción, fortalezas y debilidades de la empresa, lanzamiento de productos, alcance y variedad de productos, y dominio de las aplicaciones. Los datos anteriores se refieren únicamente al enfoque de mercado de las empresas.
Los principales líderes del mercado que operan en el mercado son:
- IBM Corporation (EE. UU.)
- Unisys (EE. UU.)
- Fujitsu (Japón)
- Corporación NEC (Japón)
- BMC Software, Inc. (EE. UU.)
- Hitachi Vantara LLC (EE. UU.)
- Dell Inc. (EE. UU.)
- Broadcom (EE. UU.)
- Atos SE (Francia)
- Cognizant (EE. UU.)
- Compañía de tecnología DXC (EE. UU.)
- HCL Technologies Limited (India)
- Tieotoevry (Finlandia)
- Infosys Limited (India)
- Hewlett Packard Enterprise Development LP (EE. UU.)
Últimos avances en el mercado global de mainframes
- En septiembre de 2024, IBM lanzó su nuevo IBM DS8000, diseñado para mejorar el almacenamiento de clase empresarial para arquitecturas mainframe IBM Z. Ofrece alta confiabilidad, alcanzando una disponibilidad de hasta el 99,999999% y protegiendo datos críticos de ciberataques con funciones de seguridad integradas. El DS8000 admite cargas de trabajo de última generación, mejorando el rendimiento al reducir la latencia y aumentar la capacidad de procesamiento para transacciones de alto volumen. También mejora la eficiencia del centro de datos, duplicando la capacidad de almacenamiento con módulos FlashCore avanzados. Esta innovación garantiza que las empresas puedan escalar eficazmente, manteniendo la resiliencia de los datos y proporcionando una infraestructura ágil y segura para cargas de trabajo críticas.
- En agosto de 2024, IBM anunció el desarrollo del procesador Telum II y el acelerador Spyre, diseñados para mejorar las capacidades de IA en los mainframes IBM Z. Estas innovaciones buscan acelerar las cargas de trabajo de IA, en particular la compatibilidad con modelos de lenguaje grandes (LLM) e IA generativa. Mejorarán la gestión de la memoria, el manejo de datos y la potencia de procesamiento, lo que permitirá a las empresas procesar eficientemente tareas complejas como la detección de fraudes y la gestión de riesgos financieros. Los beneficios incluyen soluciones de IA escalables, seguras y de alto rendimiento que ayudan a las empresas a afrontar los retos de uso intensivo de datos, optimizar la toma de decisiones y fomentar la innovación, manteniendo al mismo tiempo la robusta seguridad del mainframe.
- En agosto de 2023, IBM presentó Watsonx Code Assistant para Z, una herramienta de IA generativa diseñada para acelerar la modernización de aplicaciones mainframe. Este desarrollo está diseñado para ayudar a las organizaciones a refactorizar y transformar código COBOL a Java, impulsando así la productividad de los desarrolladores. Al aprovechar un modelo de lenguaje de 20 mil millones de parámetros, la herramienta automatiza y optimiza la traducción de código, lo que permite a las empresas modernizar aplicaciones críticas con mayor rapidez, manteniendo el rendimiento, la seguridad y la resiliencia. Además, mejora las habilidades de los desarrolladores y acelera la incorporación, solucionando la brecha de habilidades. Se espera que la solución reduzca significativamente el tiempo de modernización y mejore la calidad del código en todos los sistemas empresariales.
- En febrero de 2025, Unisys se asoció con el Chicago Quantum Exchange (CQE) para impulsar las aplicaciones de la tecnología cuántica. Esta colaboración permite a Unisys interactuar con talentos líderes, participar en eventos de innovación cuántica, formar alianzas estratégicas para el desarrollo conjunto de soluciones cuánticas específicas para cada sector y compartir experiencia dentro de la red del CQE.
- En enero de 2025, Unisys amplió su red global al incorporar Finnair Cargo a su plataforma Cargo Portal Services (CPS). Esta colaboración fortalece la presencia digital de Finnair Cargo, optimiza las operaciones y brinda acceso a una base de clientes más amplia. CPS ofrece a las aerolíneas globales un portal confiable de reservas de carga aérea para múltiples aerolíneas, lo que aumenta la eficiencia operativa.
SKU-
Obtenga acceso en línea al informe sobre la primera nube de inteligencia de mercado del mundo

- Panel de análisis de datos interactivo
- Panel de análisis de empresas para oportunidades con alto potencial de crecimiento
- Acceso de analista de investigación para personalización y consultas
- Análisis de la competencia con panel interactivo
- Últimas noticias, actualizaciones y análisis de tendencias
- Aproveche el poder del análisis de referencia para un seguimiento integral de la competencia
Tabla de contenido
1 INTRODUCTION
1.1 OBJECTIVES OF THE STUDY
1.2 MARKET DEFINITION
1.3 OVERVIEW
1.4 LIMITATIONS
1.5 MARKETS COVERED
2 MARKET SEGMENTATION
2.1 MARKETS COVERED
2.2 GEOGRAPHICAL SCOPE
2.3 YEARS CONSIDERED FOR THE STUDY
2.4 CURRENCY AND PRICING
2.5 DBMR TRIPOD DATA VALIDATION MODEL
2.6 MULTIVARIATE MODELING
2.7 PRIMARY INTERVIEWS WITH KEY OPINION LEADERS
2.8 DBMR MARKET POSITION GRID
2.9 DBMR VENDOR SHARE ANALYSIS
2.1 MARKET APPLICATION COVERAGE GRID
2.11 SECONDARY SOURCES
2.12 ASSUMPTIONS
3 EXECUTIVE SUMMARY
4 PREMIUM INSIGHTS
4.1 PESTEL ANALYSIS
4.1.1 POLITICAL FACTORS
4.1.2 ECONOMIC FACTORS
4.1.3 SOCIAL FACTORS
4.1.4 TECHNOLOGICAL FACTORS
4.1.5 ENVIRONMENTAL FACTORS
4.1.6 LEGAL FACTORS
4.2 PORTER’S FIVE FORCES
4.2.1 THREAT OF NEW ENTRANTS
4.2.2 BARGAINING POWER OF SUPPLIERS
4.2.3 BARGAINING POWER OF BUYERS
4.2.4 THREAT OF SUBSTITUTE PRODUCTS
4.2.5 INDUSTRY RIVALRY
4.2.6 CONCLUSION
4.3 COMPANY COMPARATIVE ANALYSIS
4.3.1 IBM CORPORATION
4.3.2 FUJITSU
4.3.3 NEC CORPORATION
4.3.4 UNISYS
4.3.5 BMC SOFTWARE, INC.
4.3.6 CONCLUSION
4.4 INDUSTRY ANALYSIS & FUTURISTIC SCENARIO
4.4.1 INDUSTRY OVERVIEW
4.4.2 MARKET TRENDS & DYNAMICS
4.4.3 FUTURISTIC SCENARIO
4.4.4 CONCLUSION
4.5 KEY PRIMARY INSIGHTS: BY MAJOR COUNTRIES
4.5.1 NORTH AMERICA AND SOUTH AMERICA
4.5.1.1 U.S.
4.5.1.2 CANADA
4.5.1.3 MEXICO, BRAZIL, AND ARGENTINA
4.5.2 EUROPE
4.5.2.1 U.K.
4.5.2.2 GERMANY
4.5.2.3 FRANCE & ITALY
4.5.3 ASIA-PACIFIC
4.5.3.1 CHINA
4.5.3.2 JAPAN
4.5.3.3 INDIA
4.5.3.4 SOUTH KOREA & AUSTRALIA
4.5.4 MIDDLE EAST & AFRICA
4.5.4.1 SAUDI ARABIA & U.A.E.
4.5.4.2 ISRAEL
4.5.4.3 SOUTH AFRICA & EGYPT
4.6 TECHNOLOGY ANALYSIS
4.6.1 MARKET GROWTH AND PROJECTIONS
4.6.1.1 KEY DRIVERS OF MAINFRAME MODERNIZATION
4.6.1.1.1 Cost Efficiency
4.6.1.1.2 Scalability and Performance
4.6.1.1.3 Security and Compliance
4.6.1.1.4 Integration with Emerging Technologies
4.6.1.1.5 Digital Transformation Initiatives
4.6.1.2 INDUSTRY TRENDS
4.6.1.2.1 Cloud Adoption
4.6.1.2.2 Hybrid Environments
4.6.1.2.3 AI and ML Integration
4.6.2 KEY BUSINESS OUTCOMES AND INDUSTRY USE CASES
4.6.2.1 FINANCIAL SERVICES
4.6.2.2 HEALTHCARE
4.6.2.3 RETAIL
4.6.2.4 MANUFACTURING
4.6.2.5 GOVERNMENT
4.6.3 CHALLENGES AND CONSIDERATIONS
4.6.3.1 SKILLS SHORTAGE
4.6.3.2 INTEGRATION COMPLEXITY
4.6.3.3 DOWNTIME RISKS
4.6.3.4 SECURITY CONCERNS
4.6.4 CONCLUSION
5 REGULATORY COVERAGE
6 MARKET OVERVIEW
6.1 DRIVERS
6.1.1 ACCELERATED DIGITALIZATION ACROSS INDUSTRIES
6.1.2 RISING CYBERSECURITY THREATS AND DATA BREACHES
6.1.3 GROWING DEMAND FOR HIGH-PERFORMANCE COMPUTING
6.1.4 EXPANDING NEED FOR LARGE-SCALE TRANSACTION PROCESSING AND REAL-TIME ANALYTICS
6.2 RESTRAINS
6.2.1 INTENSE COMPETITION FROM CLOUD-BASED PLATFORMS
6.2.2 HIGH COSTS ASSOCIATED WITH MAINFRAME INSTALLATION
6.3 OPPORTUNITIES
6.3.1 GROWING FOCUS ON MAINFRAME MODERNIZATION
6.3.2 EXPANDING ADOPTION OF HYBRID CLOUD SOLUTIONS
6.3.3 RISING DEMAND FOR ADVANCED SECURITY SOLUTIONS
6.4 CHALLENGES
6.4.1 ENSURING SECURITY AND COMPLIANCE IN DYNAMIC, INTERCONNECTED HYBRID ECOSYSTEMS AMID EVOLVING GLOBAL REGULATIONS
6.4.2 SHORTAGE OF SKILLED MAINFRAME PROFESSIONALS
7 GLOBAL MAINFRAME MARKET, BY SYSTEMS
7.1 OVERVIEW
7.2 MAINFRAMES
7.3 MIDRANGE SYSTEMS
8 GLOBAL MAINFRAME MARKET, BY COMPONENT
8.1 OVERVIEW
8.2 HARDWARE
8.3 SERVICES
8.4 SOFTWARE
9 GLOBAL MAINFRAME MARKET, BY ORGANIZATION SIZE
9.1 OVERVIEW
9.2 LARGE ENTERPRISES
9.3 SMALL AND MEDIUM-SIZED ENTERPRISES (SMES)
10 GLOBAL MAINFRAME MARKET, BY END USE
10.1 OVERVIEW
10.2 FINANCIAL SERVICES
10.3 IT & TELECOMMUNICATIONS
10.4 HEALTHCARE
10.5 PUBLIC SECTOR
10.6 AUTOMOTIVE AND MANUFACTURING
10.7 RETAIL AND CONSUMER PACKAGED GOODS (CPG)
10.8 TRAVEL, MEDIA, AND ENTERTAINMENT
10.9 OTHERS
11 GLOBAL MAINFRAME MARKET, BY REGION
11.1 OVERVIEW
11.2 NORTH AMERICA
11.2.1 U.S.
11.2.2 CANADA
11.2.3 MEXICO
11.2.4 GUATEMALA
11.2.5 COSTA RICA
11.2.6 PANAMA
11.2.7 HONDURAS
11.2.8 CARIBBEAN
11.2.9 NICARAGUA
11.2.10 EL SALVADOR
11.2.11 BELIZE
11.2.12 REST OF NORTH AMERICA
11.3 EUROPE
11.3.1 U.K.
11.3.2 GERMANY
11.3.3 FRANCE
11.3.4 SPAIN
11.3.5 RUSSIA
11.3.6 NETHERLANDS
11.3.7 SWITZERLAND
11.3.8 TURKEY
11.3.9 BELGIUM
11.3.10 REST OF EUROPE
11.4 ASIA-PACIFIC
11.4.1 CHINA
11.4.2 JAPAN
11.4.3 INDIA
11.4.4 SOUTH KOREA
11.4.5 AUSTRALIA
11.4.6 SINGAPORE
11.4.7 MALAYSIA
11.4.8 THAILAND
11.4.9 INDONESIA
11.4.10 PHILIPPINES
11.4.11 REST OF ASIA-PACIFIC
11.5 SOUTH AMERICA
11.5.1 BRAZIL
11.5.2 ARGENTINA
11.5.3 CHILE
11.5.4 PERU
11.5.5 COLUMBIA
11.5.6 ECUADOR
11.5.7 GUYANA
11.5.8 PARAGUAY
11.5.9 BOLIVIA
11.5.10 SURINAME
11.5.11 URUGUAY
11.5.12 VENEZUELA
11.5.13 REST OF SOUTH AMERICA
11.6 MIDDLE EAST AND AFRICA
11.6.1 SAUDI ARABIA
11.6.2 U.A.E.
11.6.3 ISRAEL
11.6.4 SOUTH AFRICA
11.6.5 EGYPT
11.6.6 REST OF MIDDLE EAST AND AFRICA
12 GLOBAL MAINFRAME MARKET: COMPANY LANDSCAPE
12.1 COMPANY SHARE ANALYSIS: GLOBAL
12.2 COMPANY SHARE ANALYSIS: ASIA-PACIFIC
12.3 COMPANY SHARE ANALYSIS: EUROPE
12.4 COMPANY SHARE ANALYSIS: NORTH AMERICA
13 SWOT ANALYSIS
14 COMPANY PROFILES
14.1 IBM CORPORATION
14.1.1 COMPANY PROFILES
14.1.2 REVENUE ANALYSIS
14.1.3 COMPANY SHARE ANALYSIS
14.1.4 PRODUCT PORTFOLIO
14.1.5 RECENT DEVELOPMENT/NEWS
14.2 UNISYS
14.2.1 COMPANY SNAPSHOT
14.2.2 REVENUE ANALYSIS
14.2.3 COMPANY SHARE ANALYSIS
14.2.4 PRODUCT PORTFOLIO
14.2.5 RECENT DEVELOPMENT
14.3 BMC SOFTWARE, INC.
14.3.1 COMPANY SNAPSHOT
14.3.2 COMPANY SHARE ANALYSIS
14.3.3 PRODUCT PORTFOLIO
14.3.4 RECENT DEVELOPMENT
14.4 COGNIZANT
14.4.1 COMPANY SNAPSHOT
14.4.2 REVENUE ANALYSIS
14.4.3 COMPANY SHARE ANALYSIS
14.4.4 PRODUCT PORTFOLIO
14.4.5 RECENT DEVELOPMENT/NEWS
14.5 NEC CORPORATION
14.5.1 COMPANY SNAPSHOTS
14.5.2 REVENUE ANALYSIS
14.5.3 COMPANY SHARE ANALYSIS
14.5.4 PRODUCT PORTFOLIO
14.5.5 RECENT DEVELOPMENT
14.6 ATOS SE
14.6.1 COMPANY SNAPSHOT
14.6.2 REVENUE ANALYSIS
14.6.3 PRODUCT PORTFOLIO
14.6.4 RECENT DEVELOPMENT/NEWS
14.7 BROADCOM
14.7.1 COMPANY PROFILES
14.7.2 REVENUE ANALYSIS
14.7.3 PRODUCT PORTFOLIO
14.7.4 RECENT DEVELOPMENT/NEWS
14.8 DELL INC
14.8.1 COMPANY SNAPSHOT
14.8.2 REVENUE ANALYSIS
14.8.3 PRODUCT PORTFOLIO
14.8.4 RECENT DEVELOPMENT
14.9 DXC TECHNOLOGY COMPANY
14.9.1 COMPANY SNAPSHOT
14.9.2 REVENUE ANALYSIS
14.9.3 PRODUCT PORTFOLIO
14.9.4 RECENT DEVELOPMENT/NEWS
14.1 FUJITSU
14.10.1 COMPANY SNAPSHOT
14.10.2 REVENUE ANALYSIS
14.10.3 PRODUCT PORTFOLIO
14.10.4 RECENT DEVELOPMENT/NEWS
14.11 HCL TECHNOLOGIES LIMITED
14.11.1 COMPANY SNAPSHOT
14.11.2 REVENUE ANALYSIS
14.11.3 PRODUCT PORTFOLIO
14.11.4 RECENT DEVELOPMENT/NEWS
14.12 HEWLETT PACKARD ENTERPRISE DEVELOPMENT LP
14.12.1 COMPANY SNAPSHOT
14.12.2 REVENUE ANALYSIS
14.12.3 PRODUCT PORTFOLIO
14.12.4 RECENT DEVELOPMENT/NEWS
14.13 HITACHI VANTARA LLC
14.13.1 COMPANY SNAPSHOT
14.13.2 PRODUCT PORTFOLIO
14.13.3 RECENT DEVELOPMENT/NEWS
14.14 INFOSYS LIMITED
14.14.1 COMPANY SNAPSHOTS
14.14.2 REVENUE ANALYSIS
14.14.3 PRODUCT PORTFOLIO
14.14.4 RECENT DEVELOPMENT
14.15 TIEOTOEVRY
14.15.1 COMPANY SNAPSHOTS
14.15.2 REVENUE ANALYSIS
14.15.3 PRODUCT PORTFOLIO
14.15.4 RECENT DEVELOPMENT
15 QUESTIONNAIRE
16 RELATED REPORTS
Lista de Tablas
TABLE 1 COMPANY COMPARATIVE ANALYSIS
TABLE 2 REGULATORY COVERAGE
TABLE 3 IMPACT ON UNPLANNED DOWNTIME AND SECURITY
TABLE 4 GLOBAL MAINFRAME MARKET, BY SYSTEMS, 2018-2032 (USD MILLION)
TABLE 5 GLOBAL MAINFRAMES IN MAINFRAME MARKET, BY REGION, 2018-2032 (USD MILLION)
TABLE 6 GLOBAL MAINFRAMES IN MAINFRAME MARKET, BY TYPE, 2018-2032 (USD MILLION)
TABLE 7 GLOBAL IBM Z SYSTEMS IN MAINFRAME MARKET, BY TYPE, 2018-2032 (USD MILLION)
TABLE 8 GLOBAL FUJITSU GS SERIES IN MAINFRAME MARKET, BY TYPE, 2018-2032 (USD MILLION)
TABLE 9 GLOBAL OTHER MAINFRAMES IN MAINFRAME MARKET, BY TYPE, 2018-2032 (USD MILLION)
TABLE 10 GLOBAL MIDRANGE SYSTEMS IN MAINFRAME MARKET, BY REGION, 2018-2032 (USD MILLION)
TABLE 11 GLOBAL MIDRANGE IN MAINFRAME MARKET, BY TYPE, 2018-2032 (USD MILLION)
TABLE 12 GLOBAL IBM POWER SYSTEMS (AIX, AS/400) IN MAINFRAME MARKET, BY TYPE, 2018-2032 (USD MILLION)
TABLE 13 GLOBAL HPE SERVERS IN MAINFRAME MARKET, BY TYPE, 2018-2032 (USD MILLION)
TABLE 14 GLOBAL ORACLE SUN SERVERS (SOLARIS) IN MAINFRAME MARKET, BY TYPE, 2018-2032 (USD MILLION)
TABLE 15 GLOBAL MAINFRAME MARKET, BY COMPONENT, 2018-2032 (USD MILLION)
TABLE 16 GLOBAL HARDWARE IN MAINFRAME MARKET, BY REGION, 2018-2032 (USD MILLION)
TABLE 17 GLOBAL HARDWARE IN MAINFRAME MARKET, BY CATEGORY, 2018-2032 (USD MILLION)
TABLE 18 GLOBAL SERVICES IN MAINFRAME MARKET, BY REGION, 2018-2032 (USD MILLION)
TABLE 19 GLOBAL SERVICES IN MAINFRAME MARKET, BY CATEGORY, 2018-2032 (USD MILLION)
TABLE 20 GLOBAL SOFTWARE IN MAINFRAME MARKET, BY REGION, 2018-2032 (USD MILLION)
TABLE 21 GLOBAL SOFTWARE IN MAINFRAME MARKET, BY CATEGORY, 2018-2032 (USD MILLION)
TABLE 22 GLOBAL MAINFRAME MARKET, BY ORGANIZATION SIZE, 2018-2032 (USD MILLION)
TABLE 23 GLOBAL LARGE ENTERPRISES IN MAINFRAME MARKET, BY REGION, 2018-2032 (USD MILLION)
TABLE 24 GLOBAL SMALL AND MEDIUM-SIZED ENTERPRISES (SMES) IN MAINFRAME MARKET, BY REGION, 2018-2032 (USD MILLION)
TABLE 25 GLOBAL MAINFRAME MARKET, BY END USE, 2018-2032 (USD MILLION)
TABLE 26 GLOBAL FINANCIAL SERVICES IN MAINFRAME MARKET, BY REGION, 2018-2032 (USD MILLION)
TABLE 27 GLOBAL FINANCIAL SERVICES IN MAINFRAME MARKET, BY TYPE, 2018-2032 (USD MILLION)
TABLE 28 GLOBAL BANKING AND CAPITAL MARKETS IN MAINFRAME MARKET, BY COMPONENT, 2018-2032 (USD MILLION)
TABLE 29 GLOBAL INSURANCE IN MAINFRAME MARKET, BY COMPONENT, 2018-2032 (USD MILLION)
TABLE 30 GLOBAL PAYMENTS IN MAINFRAME MARKET, BY COMPONENT, 2018-2032 (USD MILLION)
TABLE 31 GLOBAL FINANCIAL SERVICES IN MAINFRAME MARKET, BY COMPONENT, 2018-2032 (USD MILLION)
TABLE 32 GLOBAL IT & TELECOMMUNICATIONS IN MAINFRAME MARKET, BY REGION, 2018-2032 (USD MILLION)
TABLE 33 GLOBAL IT & TELECOMMUNICATIONS IN MAINFRAME MARKET, BY COMPONENT, 2018-2032 (USD MILLION)
TABLE 34 GLOBAL HEALTHCARE IN MAINFRAME MARKET, BY REGION, 2018-2032 (USD MILLION)
TABLE 35 GLOBAL HEALTHCARE IN MAINFRAME MARKET, BY COMPONENT, 2018-2032 (USD MILLION)
TABLE 36 GLOBAL PUBLIC SECTOR IN MAINFRAME MARKET, BY REGION, 2018-2032 (USD MILLION)
TABLE 37 GLOBAL PUBLIC SECTOR IN MAINFRAME MARKET, BY COMPONENT, 2018-2032 (USD MILLION)
TABLE 38 GLOBAL AUTOMOTIVE AND MANUFACTURING IN MAINFRAME MARKET, BY REGION, 2018-2032 (USD MILLION)
TABLE 39 GLOBAL AUTOMOTIVE AND MANUFACTURING IN MAINFRAME MARKET, BY COMPONENT, 2018-2032 (USD MILLION)
TABLE 40 GLOBAL RETAIL AND CONSUMER PACKAGED GOODS (CPG) IN MAINFRAME MARKET, BY REGION, 2018-2032 (USD MILLION)
TABLE 41 GLOBAL RETAIL AND CONSUMER PACKAGED GOODS (CPG) IN MAINFRAME MARKET, BY COMPONENT, 2018-2032 (USD MILLION)
TABLE 42 GLOBAL TRAVEL, MEDIA, AND ENTERTAINMENT IN MAINFRAME MARKET, BY REGION, 2018-2032 (USD MILLION)
TABLE 43 GLOBAL TRAVEL, MEDIA, AND ENTERTAINMENT IN MAINFRAME MARKET, BY COMPONENT, 2018-2032 (USD MILLION)
TABLE 44 GLOBAL OTHERS IN MAINFRAME MARKET, BY REGION, 2018-2032 (USD MILLION)
TABLE 45 GLOBAL OTHERS IN MAINFRAME MARKET, BY COMPONENT, 2018-2032 (USD MILLION)
TABLE 46 GLOBAL MAINFRAME MARKET, BY REGION, 2018-2032 (USD MILLION)
TABLE 47 NORTH AMERICA MAINFRAME MARKET, BY COUNTRY, 2018-2032 (USD MILLION)
TABLE 48 NORTH AMERICA MAINFRAME MARKET, BY SYSTEMS, 2018-2032 (USD MILLION)
TABLE 49 NORTH AMERICA MAINFRAMES IN MAINFRAME MARKET, BY TYPE, 2018-2032 (USD MILLION)
TABLE 50 NORTH AMERICA IBM Z SYSTEMS IN MAINFRAME MARKET, BY TYPE, 2018-2032 (USD MILLION)
TABLE 51 NORTH AMERICA FUJITSU GS SERIES IN MAINFRAME MARKET, BY TYPE, 2018-2032 (USD MILLION)
TABLE 52 NORTH AMERICA OTHER MAINFRAMES IN MAINFRAME MARKET, BY TYPE, 2018-2032 (USD MILLION)
TABLE 53 NORTH AMERICA MIDRANGE SYSTEMS IN MAINFRAME MARKET, BY TYPE, 2018-2032 (USD MILLION)
TABLE 54 NORTH AMERICA IBM POWER SYSTEMS (AIX, AS/400) IN MAINFRAME MARKET, BY TYPE, 2018-2032 (USD MILLION)
TABLE 55 NORTH AMERICA HPE SERVERS IN MAINFRAME MARKET, BY TYPE, 2018-2032 (USD MILLION)
TABLE 56 NORTH AMERICA ORACLE SUN SERVERS (SOLARIS) IN MAINFRAME MARKET, BY TYPE, 2018-2032 (USD MILLION)
TABLE 57 NORTH AMERICA MAINFRAME MARKET, BY COMPONENT, 2018-2032 (USD MILLION)
TABLE 58 NORTH AMERICA HARDWARE IN MAINFRAME MARKET, BY CATEGORY, 2018-2032 (USD MILLION)
TABLE 59 NORTH AMERICA SERVICES IN MAINFRAME MARKET, BY CATEGORY, 2018-2032 (USD MILLION)
TABLE 60 NORTH AMERICA SOFTWARE IN MAINFRAME MARKET, BY CATEGORY, 2018-2032 (USD MILLION)
TABLE 61 NORTH AMERICA MAINFRAME MARKET, BY ORGANIZATION SIZE, 2018-2032 (USD MILLION)
TABLE 62 NORTH AMERICA MAINFRAME MARKET, BY END USE, 2018-2032 (USD MILLION)
TABLE 63 NORTH AMERICA FINANCIAL SERVICES IN MAINFRAME MARKET, BY TYPE, 2018-2032 (USD MILLION)
TABLE 64 NORTH AMERICA BANKING AND CAPITAL MARKETS IN MAINFRAME MARKET, BY COMPONENT, 2018-2032 (USD MILLION)
TABLE 65 NORTH AMERICA INSURANCE IN MAINFRAME MARKET, BY COMPONENT, 2018-2032 (USD MILLION)
TABLE 66 NORTH AMERICA PAYMENTS IN MAINFRAME MARKET, BY COMPONENT, 2018-2032 (USD MILLION)
TABLE 67 NORTH AMERICA FINANCIAL SERVICES IN MAINFRAME MARKET, BY COMPONENT, 2018-2032 (USD MILLION)
TABLE 68 NORTH AMERICA IT & TELECOMMUNICATIONS IN MAINFRAME MARKET, BY COMPONENT, 2018-2032 (USD MILLION)
TABLE 69 NORTH AMERICA HEALTHCARE IN MAINFRAME MARKET, BY COMPONENT, 2018-2032 (USD MILLION)
TABLE 70 NORTH AMERICA PUBLIC SECTOR IN MAINFRAME MARKET, BY COMPONENT, 2018-2032 (USD MILLION)
TABLE 71 NORTH AMERICA AUTOMOTIVE AND MANUFACTURING IN MAINFRAME MARKET, BY COMPONENT, 2018-2032 (USD MILLION)
TABLE 72 NORTH AMERICA RETAIL AND CONSUMER PACKAGED GOODS (CPG) IN MAINFRAME MARKET, BY COMPONENT, 2018-2032 (USD MILLION)
TABLE 73 NORTH AMERICA TRAVEL, MEDIA, AND ENTERTAINMENT IN MAINFRAME MARKET, BY COMPONENT, 2018-2032 (USD MILLION)
TABLE 74 NORTH AMERICA OTHERS IN MAINFRAME MARKET, BY COMPONENT, 2018-2032 (USD MILLION)
TABLE 75 U.S. MAINFRAME MARKET, BY SYSTEMS, 2018-2032 (USD MILLION)
TABLE 76 U.S. MAINFRAMES IN MAINFRAME MARKET, BY TYPE, 2018-2032 (USD MILLION)
TABLE 77 U.S. IBM Z SYSTEMS IN MAINFRAME MARKET, BY TYPE, 2018-2032 (USD MILLION)
TABLE 78 U.S. FUJITSU GS SERIES IN MAINFRAME MARKET, BY TYPE, 2018-2032 (USD MILLION)
TABLE 79 U.S. OTHER MAINFRAMES IN MAINFRAME MARKET, BY TYPE, 2018-2032 (USD MILLION)
TABLE 80 U.S. MIDRANGE SYSTEMS IN MAINFRAME MARKET, BY TYPE, 2018-2032 (USD MILLION)
TABLE 81 U.S. IBM POWER SYSTEMS (AIX, AS/400) IN MAINFRAME MARKET, BY TYPE, 2018-2032 (USD MILLION)
TABLE 82 U.S. HPE SERVERS IN MAINFRAME MARKET, BY TYPE, 2018-2032 (USD MILLION)
TABLE 83 U.S. ORACLE SUN SERVERS (SOLARIS) IN MAINFRAME MARKET, BY TYPE, 2018-2032 (USD MILLION)
TABLE 84 U.S. MAINFRAME MARKET, BY COMPONENT, 2018-2032 (USD MILLION)
TABLE 85 U.S. HARDWARE IN MAINFRAME MARKET, BY CATEGORY, 2018-2032 (USD MILLION)
TABLE 86 U.S. SERVICES IN MAINFRAME MARKET, BY CATEGORY, 2018-2032 (USD MILLION)
TABLE 87 U.S. SOFTWARE IN MAINFRAME MARKET, BY CATEGORY, 2018-2032 (USD MILLION)
TABLE 88 U.S. MAINFRAME MARKET, BY ORGANIZATION SIZE, 2018-2032 (USD MILLION)
TABLE 89 U.S. MAINFRAME MARKET, BY END USE, 2018-2032 (USD MILLION)
TABLE 90 U.S. FINANCIAL SERVICES IN MAINFRAME MARKET, BY TYPE, 2018-2032 (USD MILLION)
TABLE 91 U.S. BANKING AND CAPITAL MARKETS IN MAINFRAME MARKET, BY COMPONENT, 2018-2032 (USD MILLION)
TABLE 92 U.S. INSURANCE IN MAINFRAME MARKET, BY COMPONENT, 2018-2032 (USD MILLION)
TABLE 93 U.S. PAYMENTS IN MAINFRAME MARKET, BY COMPONENT, 2018-2032 (USD MILLION)
TABLE 94 U.S. FINANCIAL SERVICES IN MAINFRAME MARKET, BY COMPONENT, 2018-2032 (USD MILLION)
TABLE 95 U.S. IT & TELECOMMUNICATIONS IN MAINFRAME MARKET, BY COMPONENT, 2018-2032 (USD MILLION)
TABLE 96 U.S. HEALTHCARE IN MAINFRAME MARKET, BY COMPONENT, 2018-2032 (USD MILLION)
TABLE 97 U.S. PUBLIC SECTOR IN MAINFRAME MARKET, BY COMPONENT, 2018-2032 (USD MILLION)
TABLE 98 U.S. AUTOMOTIVE AND MANUFACTURING IN MAINFRAME MARKET, BY COMPONENT, 2018-2032 (USD MILLION)
TABLE 99 U.S. RETAIL AND CONSUMER PACKAGED GOODS (CPG) IN MAINFRAME MARKET, BY COMPONENT, 2018-2032 (USD MILLION)
TABLE 100 U.S. TRAVEL, MEDIA, AND ENTERTAINMENT IN MAINFRAME MARKET, BY COMPONENT, 2018-2032 (USD MILLION)
TABLE 101 U.S. OTHERS IN MAINFRAME MARKET, BY COMPONENT, 2018-2032 (USD MILLION)
TABLE 102 CANADA MAINFRAME MARKET, BY SYSTEMS, 2018-2032 (USD MILLION)
TABLE 103 CANADA MAINFRAMES IN MAINFRAME MARKET, BY TYPE, 2018-2032 (USD MILLION)
TABLE 104 CANADA IBM Z SYSTEMS IN MAINFRAME MARKET, BY TYPE, 2018-2032 (USD MILLION)
TABLE 105 CANADA FUJITSU GS SERIES IN MAINFRAME MARKET, BY TYPE, 2018-2032 (USD MILLION)
TABLE 106 CANADA OTHER MAINFRAMES IN MAINFRAME MARKET, BY TYPE, 2018-2032 (USD MILLION)
TABLE 107 CANADA MIDRANGE SYSTEMS IN MAINFRAME MARKET, BY TYPE, 2018-2032 (USD MILLION)
TABLE 108 CANADA IBM POWER SYSTEMS (AIX, AS/400) IN MAINFRAME MARKET, BY TYPE, 2018-2032 (USD MILLION)
TABLE 109 CANADA HPE SERVERS IN MAINFRAME MARKET, BY TYPE, 2018-2032 (USD MILLION)
TABLE 110 CANADA ORACLE SUN SERVERS (SOLARIS) IN MAINFRAME MARKET, BY TYPE, 2018-2032 (USD MILLION)
TABLE 111 CANADA MAINFRAME MARKET, BY COMPONENT, 2018-2032 (USD MILLION)
TABLE 112 CANADA HARDWARE IN MAINFRAME MARKET, BY CATEGORY, 2018-2032 (USD MILLION)
TABLE 113 CANADA SERVICES IN MAINFRAME MARKET, BY CATEGORY, 2018-2032 (USD MILLION)
TABLE 114 CANADA SOFTWARE IN MAINFRAME MARKET, BY CATEGORY, 2018-2032 (USD MILLION)
TABLE 115 CANADA MAINFRAME MARKET, BY ORGANIZATION SIZE, 2018-2032 (USD MILLION)
TABLE 116 CANADA MAINFRAME MARKET, BY END USE, 2018-2032 (USD MILLION)
TABLE 117 CANADA FINANCIAL SERVICES IN MAINFRAME MARKET, BY TYPE, 2018-2032 (USD MILLION)
TABLE 118 CANADA BANKING AND CAPITAL MARKETS IN MAINFRAME MARKET, BY COMPONENT, 2018-2032 (USD MILLION)
TABLE 119 CANADA INSURANCE IN MAINFRAME MARKET, BY COMPONENT, 2018-2032 (USD MILLION)
TABLE 120 CANADA PAYMENTS IN MAINFRAME MARKET, BY COMPONENT, 2018-2032 (USD MILLION)
TABLE 121 CANADA FINANCIAL SERVICES IN MAINFRAME MARKET, BY COMPONENT, 2018-2032 (USD MILLION)
TABLE 122 CANADA IT & TELECOMMUNICATIONS IN MAINFRAME MARKET, BY COMPONENT, 2018-2032 (USD MILLION)
TABLE 123 CANADA HEALTHCARE IN MAINFRAME MARKET, BY COMPONENT, 2018-2032 (USD MILLION)
TABLE 124 CANADA PUBLIC SECTOR IN MAINFRAME MARKET, BY COMPONENT, 2018-2032 (USD MILLION)
TABLE 125 CANADA AUTOMOTIVE AND MANUFACTURING IN MAINFRAME MARKET, BY COMPONENT, 2018-2032 (USD MILLION)
TABLE 126 CANADA RETAIL AND CONSUMER PACKAGED GOODS (CPG) IN MAINFRAME MARKET, BY COMPONENT, 2018-2032 (USD MILLION)
TABLE 127 CANADA TRAVEL, MEDIA, AND ENTERTAINMENT IN MAINFRAME MARKET, BY COMPONENT, 2018-2032 (USD MILLION)
TABLE 128 CANADA OTHERS IN MAINFRAME MARKET, BY COMPONENT, 2018-2032 (USD MILLION)
TABLE 129 MEXICO MAINFRAME MARKET, BY SYSTEMS, 2018-2032 (USD MILLION)
TABLE 130 MEXICO MAINFRAMES IN MAINFRAME MARKET, BY TYPE, 2018-2032 (USD MILLION)
TABLE 131 MEXICO IBM Z SYSTEMS IN MAINFRAME MARKET, BY TYPE, 2018-2032 (USD MILLION)
TABLE 132 MEXICO FUJITSU GS SERIES IN MAINFRAME MARKET, BY TYPE, 2018-2032 (USD MILLION)
TABLE 133 MEXICO OTHER MAINFRAMES IN MAINFRAME MARKET, BY TYPE, 2018-2032 (USD MILLION)
TABLE 134 MEXICO MIDRANGE SYSTEMS IN MAINFRAME MARKET, BY TYPE, 2018-2032 (USD MILLION)
TABLE 135 MEXICO IBM POWER SYSTEMS (AIX, AS/400) IN MAINFRAME MARKET, BY TYPE, 2018-2032 (USD MILLION)
TABLE 136 MEXICO HPE SERVERS IN MAINFRAME MARKET, BY TYPE, 2018-2032 (USD MILLION)
TABLE 137 MEXICO ORACLE SUN SERVERS (SOLARIS) IN MAINFRAME MARKET, BY TYPE, 2018-2032 (USD MILLION)
TABLE 138 MEXICO MAINFRAME MARKET, BY COMPONENT, 2018-2032 (USD MILLION)
TABLE 139 MEXICO HARDWARE IN MAINFRAME MARKET, BY CATEGORY, 2018-2032 (USD MILLION)
TABLE 140 MEXICO SERVICES IN MAINFRAME MARKET, BY CATEGORY, 2018-2032 (USD MILLION)
TABLE 141 MEXICO SOFTWARE IN MAINFRAME MARKET, BY CATEGORY, 2018-2032 (USD MILLION)
TABLE 142 MEXICO MAINFRAME MARKET, BY ORGANIZATION SIZE, 2018-2032 (USD MILLION)
TABLE 143 MEXICO MAINFRAME MARKET, BY END USE, 2018-2032 (USD MILLION)
TABLE 144 MEXICO FINANCIAL SERVICES IN MAINFRAME MARKET, BY TYPE, 2018-2032 (USD MILLION)
TABLE 145 MEXICO BANKING AND CAPITAL MARKETS IN MAINFRAME MARKET, BY COMPONENT, 2018-2032 (USD MILLION)
TABLE 146 MEXICO INSURANCE IN MAINFRAME MARKET, BY COMPONENT, 2018-2032 (USD MILLION)
TABLE 147 MEXICO PAYMENTS IN MAINFRAME MARKET, BY COMPONENT, 2018-2032 (USD MILLION)
TABLE 148 MEXICO FINANCIAL SERVICES IN MAINFRAME MARKET, BY COMPONENT, 2018-2032 (USD MILLION)
TABLE 149 MEXICO IT & TELECOMMUNICATIONS IN MAINFRAME MARKET, BY COMPONENT, 2018-2032 (USD MILLION)
TABLE 150 MEXICO HEALTHCARE IN MAINFRAME MARKET, BY COMPONENT, 2018-2032 (USD MILLION)
TABLE 151 MEXICO PUBLIC SECTOR IN MAINFRAME MARKET, BY COMPONENT, 2018-2032 (USD MILLION)
TABLE 152 MEXICO AUTOMOTIVE AND MANUFACTURING IN MAINFRAME MARKET, BY COMPONENT, 2018-2032 (USD MILLION)
TABLE 153 MEXICO RETAIL AND CONSUMER PACKAGED GOODS (CPG) IN MAINFRAME MARKET, BY COMPONENT, 2018-2032 (USD MILLION)
TABLE 154 MEXICO TRAVEL, MEDIA, AND ENTERTAINMENT IN MAINFRAME MARKET, BY COMPONENT, 2018-2032 (USD MILLION)
TABLE 155 MEXICO OTHERS IN MAINFRAME MARKET, BY COMPONENT, 2018-2032 (USD MILLION)
TABLE 156 GUATEMALA MAINFRAME MARKET, BY SYSTEMS, 2018-2032 (USD MILLION)
TABLE 157 GUATEMALA MAINFRAMES IN MAINFRAME MARKET, BY TYPE, 2018-2032 (USD MILLION)
TABLE 158 GUATEMALA IBM Z SYSTEMS IN MAINFRAME MARKET, BY TYPE, 2018-2032 (USD MILLION)
TABLE 159 GUATEMALA FUJITSU GS SERIES IN MAINFRAME MARKET, BY TYPE, 2018-2032 (USD MILLION)
TABLE 160 GUATEMALA OTHER MAINFRAMES IN MAINFRAME MARKET, BY TYPE, 2018-2032 (USD MILLION)
TABLE 161 GUATEMALA MIDRANGE SYSTEMS IN MAINFRAME MARKET, BY TYPE, 2018-2032 (USD MILLION)
TABLE 162 GUATEMALA IBM POWER SYSTEMS (AIX, AS/400) IN MAINFRAME MARKET, BY TYPE, 2018-2032 (USD MILLION)
TABLE 163 GUATEMALA HPE SERVERS IN MAINFRAME MARKET, BY TYPE, 2018-2032 (USD MILLION)
TABLE 164 GUATEMALA ORACLE SUN SERVERS (SOLARIS) IN MAINFRAME MARKET, BY TYPE, 2018-2032 (USD MILLION)
TABLE 165 GUATEMALA MAINFRAME MARKET, BY COMPONENT, 2018-2032 (USD MILLION)
TABLE 166 GUATEMALA HARDWARE IN MAINFRAME MARKET, BY CATEGORY, 2018-2032 (USD MILLION)
TABLE 167 GUATEMALA SERVICES IN MAINFRAME MARKET, BY CATEGORY, 2018-2032 (USD MILLION)
TABLE 168 GUATEMALA SOFTWARE IN MAINFRAME MARKET, BY CATEGORY, 2018-2032 (USD MILLION)
TABLE 169 GUATEMALA MAINFRAME MARKET, BY ORGANIZATION SIZE, 2018-2032 (USD MILLION)
TABLE 170 GUATEMALA MAINFRAME MARKET, BY END USE, 2018-2032 (USD MILLION)
TABLE 171 GUATEMALA FINANCIAL SERVICES IN MAINFRAME MARKET, BY TYPE, 2018-2032 (USD MILLION)
TABLE 172 GUATEMALA BANKING AND CAPITAL MARKETS IN MAINFRAME MARKET, BY COMPONENT, 2018-2032 (USD MILLION)
TABLE 173 GUATEMALA INSURANCE IN MAINFRAME MARKET, BY COMPONENT, 2018-2032 (USD MILLION)
TABLE 174 GUATEMALA PAYMENTS IN MAINFRAME MARKET, BY COMPONENT, 2018-2032 (USD MILLION)
TABLE 175 GUATEMALA FINANCIAL SERVICES IN MAINFRAME MARKET, BY COMPONENT, 2018-2032 (USD MILLION)
TABLE 176 GUATEMALA IT & TELECOMMUNICATIONS IN MAINFRAME MARKET, BY COMPONENT, 2018-2032 (USD MILLION)
TABLE 177 GUATEMALA HEALTHCARE IN MAINFRAME MARKET, BY COMPONENT, 2018-2032 (USD MILLION)
TABLE 178 GUATEMALA PUBLIC SECTOR IN MAINFRAME MARKET, BY COMPONENT, 2018-2032 (USD MILLION)
TABLE 179 GUATEMALA AUTOMOTIVE AND MANUFACTURING IN MAINFRAME MARKET, BY COMPONENT, 2018-2032 (USD MILLION)
TABLE 180 GUATEMALA RETAIL AND CONSUMER PACKAGED GOODS (CPG) IN MAINFRAME MARKET, BY COMPONENT, 2018-2032 (USD MILLION)
TABLE 181 GUATEMALA TRAVEL, MEDIA, AND ENTERTAINMENT IN MAINFRAME MARKET, BY COMPONENT, 2018-2032 (USD MILLION)
TABLE 182 GUATEMALA OTHERS IN MAINFRAME MARKET, BY COMPONENT, 2018-2032 (USD MILLION)
TABLE 183 COSTA RICA MAINFRAME MARKET, BY SYSTEMS, 2018-2032 (USD MILLION)
TABLE 184 COSTA RICA MAINFRAMES IN MAINFRAME MARKET, BY TYPE, 2018-2032 (USD MILLION)
TABLE 185 COSTA RICA IBM Z SYSTEMS IN MAINFRAME MARKET, BY TYPE, 2018-2032 (USD MILLION)
TABLE 186 COSTA RICA FUJITSU GS SERIES IN MAINFRAME MARKET, BY TYPE, 2018-2032 (USD MILLION)
TABLE 187 COSTA RICA OTHER MAINFRAMES IN MAINFRAME MARKET, BY TYPE, 2018-2032 (USD MILLION)
TABLE 188 COSTA RICA MIDRANGE SYSTEMS IN MAINFRAME MARKET, BY TYPE, 2018-2032 (USD MILLION)
TABLE 189 COSTA RICA IBM POWER SYSTEMS (AIX, AS/400) IN MAINFRAME MARKET, BY TYPE, 2018-2032 (USD MILLION)
TABLE 190 COSTA RICA HPE SERVERS IN MAINFRAME MARKET, BY TYPE, 2018-2032 (USD MILLION)
TABLE 191 COSTA RICA ORACLE SUN SERVERS (SOLARIS) IN MAINFRAME MARKET, BY TYPE, 2018-2032 (USD MILLION)
TABLE 192 COSTA RICA MAINFRAME MARKET, BY COMPONENT, 2018-2032 (USD MILLION)
TABLE 193 COSTA RICA HARDWARE IN MAINFRAME MARKET, BY CATEGORY, 2018-2032 (USD MILLION)
TABLE 194 COSTA RICA SERVICES IN MAINFRAME MARKET, BY CATEGORY, 2018-2032 (USD MILLION)
TABLE 195 COSTA RICA SOFTWARE IN MAINFRAME MARKET, BY CATEGORY, 2018-2032 (USD MILLION)
TABLE 196 COSTA RICA MAINFRAME MARKET, BY ORGANIZATION SIZE, 2018-2032 (USD MILLION)
TABLE 197 COSTA RICA MAINFRAME MARKET, BY END USE, 2018-2032 (USD MILLION)
TABLE 198 COSTA RICA FINANCIAL SERVICES IN MAINFRAME MARKET, BY TYPE, 2018-2032 (USD MILLION)
TABLE 199 COSTA RICA BANKING AND CAPITAL MARKETS IN MAINFRAME MARKET, BY COMPONENT, 2018-2032 (USD MILLION)
TABLE 200 COSTA RICA INSURANCE IN MAINFRAME MARKET, BY COMPONENT, 2018-2032 (USD MILLION)
TABLE 201 COSTA RICA PAYMENTS IN MAINFRAME MARKET, BY COMPONENT, 2018-2032 (USD MILLION)
TABLE 202 COSTA RICA FINANCIAL SERVICES IN MAINFRAME MARKET, BY COMPONENT, 2018-2032 (USD MILLION)
TABLE 203 COSTA RICA IT & TELECOMMUNICATIONS IN MAINFRAME MARKET, BY COMPONENT, 2018-2032 (USD MILLION)
TABLE 204 COSTA RICA HEALTHCARE IN MAINFRAME MARKET, BY COMPONENT, 2018-2032 (USD MILLION)
TABLE 205 COSTA RICA PUBLIC SECTOR IN MAINFRAME MARKET, BY COMPONENT, 2018-2032 (USD MILLION)
TABLE 206 COSTA RICA AUTOMOTIVE AND MANUFACTURING IN MAINFRAME MARKET, BY COMPONENT, 2018-2032 (USD MILLION)
TABLE 207 COSTA RICA RETAIL AND CONSUMER PACKAGED GOODS (CPG) IN MAINFRAME MARKET, BY COMPONENT, 2018-2032 (USD MILLION)
TABLE 208 COSTA RICA TRAVEL, MEDIA, AND ENTERTAINMENT IN MAINFRAME MARKET, BY COMPONENT, 2018-2032 (USD MILLION)
TABLE 209 COSTA RICA OTHERS IN MAINFRAME MARKET, BY COMPONENT, 2018-2032 (USD MILLION)
TABLE 210 PANAMA MAINFRAME MARKET, BY SYSTEMS, 2018-2032 (USD MILLION)
TABLE 211 PANAMA MAINFRAMES IN MAINFRAME MARKET, BY TYPE, 2018-2032 (USD MILLION)
TABLE 212 PANAMA IBM Z SYSTEMS IN MAINFRAME MARKET, BY TYPE, 2018-2032 (USD MILLION)
TABLE 213 PANAMA FUJITSU GS SERIES IN MAINFRAME MARKET, BY TYPE, 2018-2032 (USD MILLION)
TABLE 214 PANAMA OTHER MAINFRAMES IN MAINFRAME MARKET, BY TYPE, 2018-2032 (USD MILLION)
TABLE 215 PANAMA MIDRANGE SYSTEMS IN MAINFRAME MARKET, BY TYPE, 2018-2032 (USD MILLION)
TABLE 216 PANAMA IBM POWER SYSTEMS (AIX, AS/400) IN MAINFRAME MARKET, BY TYPE, 2018-2032 (USD MILLION)
TABLE 217 PANAMA HPE SERVERS IN MAINFRAME MARKET, BY TYPE, 2018-2032 (USD MILLION)
TABLE 218 PANAMA ORACLE SUN SERVERS (SOLARIS) IN MAINFRAME MARKET, BY TYPE, 2018-2032 (USD MILLION)
TABLE 219 PANAMA MAINFRAME MARKET, BY COMPONENT, 2018-2032 (USD MILLION)
TABLE 220 PANAMA HARDWARE IN MAINFRAME MARKET, BY CATEGORY, 2018-2032 (USD MILLION)
TABLE 221 PANAMA SERVICES IN MAINFRAME MARKET, BY CATEGORY, 2018-2032 (USD MILLION)
TABLE 222 PANAMA SOFTWARE IN MAINFRAME MARKET, BY CATEGORY, 2018-2032 (USD MILLION)
TABLE 223 PANAMA MAINFRAME MARKET, BY ORGANIZATION SIZE, 2018-2032 (USD MILLION)
TABLE 224 PANAMA MAINFRAME MARKET, BY END USE, 2018-2032 (USD MILLION)
TABLE 225 PANAMA FINANCIAL SERVICES IN MAINFRAME MARKET, BY TYPE, 2018-2032 (USD MILLION)
TABLE 226 PANAMA BANKING AND CAPITAL MARKETS IN MAINFRAME MARKET, BY COMPONENT, 2018-2032 (USD MILLION)
TABLE 227 PANAMA INSURANCE IN MAINFRAME MARKET, BY COMPONENT, 2018-2032 (USD MILLION)
TABLE 228 PANAMA PAYMENTS IN MAINFRAME MARKET, BY COMPONENT, 2018-2032 (USD MILLION)
TABLE 229 PANAMA FINANCIAL SERVICES IN MAINFRAME MARKET, BY COMPONENT, 2018-2032 (USD MILLION)
TABLE 230 PANAMA IT & TELECOMMUNICATIONS IN MAINFRAME MARKET, BY COMPONENT, 2018-2032 (USD MILLION)
TABLE 231 PANAMA HEALTHCARE IN MAINFRAME MARKET, BY COMPONENT, 2018-2032 (USD MILLION)
TABLE 232 PANAMA PUBLIC SECTOR IN MAINFRAME MARKET, BY COMPONENT, 2018-2032 (USD MILLION)
TABLE 233 PANAMA AUTOMOTIVE AND MANUFACTURING IN MAINFRAME MARKET, BY COMPONENT, 2018-2032 (USD MILLION)
TABLE 234 PANAMA RETAIL AND CONSUMER PACKAGED GOODS (CPG) IN MAINFRAME MARKET, BY COMPONENT, 2018-2032 (USD MILLION)
TABLE 235 PANAMA TRAVEL, MEDIA, AND ENTERTAINMENT IN MAINFRAME MARKET, BY COMPONENT, 2018-2032 (USD MILLION)
TABLE 236 PANAMA OTHERS IN MAINFRAME MARKET, BY COMPONENT, 2018-2032 (USD MILLION)
TABLE 237 HONDURAS MAINFRAME MARKET, BY SYSTEMS, 2018-2032 (USD MILLION)
TABLE 238 HONDURAS MAINFRAMES IN MAINFRAME MARKET, BY TYPE, 2018-2032 (USD MILLION)
TABLE 239 HONDURAS IBM Z SYSTEMS IN MAINFRAME MARKET, BY TYPE, 2018-2032 (USD MILLION)
TABLE 240 HONDURAS FUJITSU GS SERIES IN MAINFRAME MARKET, BY TYPE, 2018-2032 (USD MILLION)
TABLE 241 HONDURAS OTHER MAINFRAMES IN MAINFRAME MARKET, BY TYPE, 2018-2032 (USD MILLION)
TABLE 242 HONDURAS MIDRANGE SYSTEMS IN MAINFRAME MARKET, BY TYPE, 2018-2032 (USD MILLION)
TABLE 243 HONDURAS IBM POWER SYSTEMS (AIX, AS/400) IN MAINFRAME MARKET, BY TYPE, 2018-2032 (USD MILLION)
TABLE 244 HONDURAS HPE SERVERS IN MAINFRAME MARKET, BY TYPE, 2018-2032 (USD MILLION)
TABLE 245 HONDURAS ORACLE SUN SERVERS (SOLARIS) IN MAINFRAME MARKET, BY TYPE, 2018-2032 (USD MILLION)
TABLE 246 HONDURAS MAINFRAME MARKET, BY COMPONENT, 2018-2032 (USD MILLION)
TABLE 247 HONDURAS HARDWARE IN MAINFRAME MARKET, BY CATEGORY, 2018-2032 (USD MILLION)
TABLE 248 HONDURAS SERVICES IN MAINFRAME MARKET, BY CATEGORY, 2018-2032 (USD MILLION)
TABLE 249 HONDURAS SOFTWARE IN MAINFRAME MARKET, BY CATEGORY, 2018-2032 (USD MILLION)
TABLE 250 HONDURAS MAINFRAME MARKET, BY ORGANIZATION SIZE, 2018-2032 (USD MILLION)
TABLE 251 HONDURAS MAINFRAME MARKET, BY END USE, 2018-2032 (USD MILLION)
TABLE 252 HONDURAS FINANCIAL SERVICES IN MAINFRAME MARKET, BY TYPE, 2018-2032 (USD MILLION)
TABLE 253 HONDURAS BANKING AND CAPITAL MARKETS IN MAINFRAME MARKET, BY COMPONENT, 2018-2032 (USD MILLION)
TABLE 254 HONDURAS INSURANCE IN MAINFRAME MARKET, BY COMPONENT, 2018-2032 (USD MILLION)
TABLE 255 HONDURAS PAYMENTS IN MAINFRAME MARKET, BY COMPONENT, 2018-2032 (USD MILLION)
TABLE 256 HONDURAS FINANCIAL SERVICES IN MAINFRAME MARKET, BY COMPONENT, 2018-2032 (USD MILLION)
TABLE 257 HONDURAS IT & TELECOMMUNICATIONS IN MAINFRAME MARKET, BY COMPONENT, 2018-2032 (USD MILLION)
TABLE 258 HONDURAS HEALTHCARE IN MAINFRAME MARKET, BY COMPONENT, 2018-2032 (USD MILLION)
TABLE 259 HONDURAS PUBLIC SECTOR IN MAINFRAME MARKET, BY COMPONENT, 2018-2032 (USD MILLION)
TABLE 260 HONDURAS AUTOMOTIVE AND MANUFACTURING IN MAINFRAME MARKET, BY COMPONENT, 2018-2032 (USD MILLION)
TABLE 261 HONDURAS RETAIL AND CONSUMER PACKAGED GOODS (CPG) IN MAINFRAME MARKET, BY COMPONENT, 2018-2032 (USD MILLION)
TABLE 262 HONDURAS TRAVEL, MEDIA, AND ENTERTAINMENT IN MAINFRAME MARKET, BY COMPONENT, 2018-2032 (USD MILLION)
TABLE 263 HONDURAS OTHERS IN MAINFRAME MARKET, BY COMPONENT, 2018-2032 (USD MILLION)
TABLE 264 CARIBBEAN ISLANDS MAINFRAME MARKET, BY SYSTEMS, 2018-2032 (USD MILLION)
TABLE 265 CARIBBEAN ISLANDS MAINFRAMES IN MAINFRAME MARKET, BY TYPE, 2018-2032 (USD MILLION)
TABLE 266 CARIBBEAN ISLANDS IBM Z SYSTEMS IN MAINFRAME MARKET, BY TYPE, 2018-2032 (USD MILLION)
TABLE 267 CARIBBEAN ISLANDS FUJITSU GS SERIES IN MAINFRAME MARKET, BY TYPE, 2018-2032 (USD MILLION)
TABLE 268 CARIBBEAN ISLANDS OTHER MAINFRAMES IN MAINFRAME MARKET, BY TYPE, 2018-2032 (USD MILLION)
TABLE 269 CARIBBEAN ISLANDS MIDRANGE SYSTEMS IN MAINFRAME MARKET, BY TYPE, 2018-2032 (USD MILLION)
TABLE 270 CARIBBEAN ISLANDS IBM POWER SYSTEMS (AIX, AS/400) IN MAINFRAME MARKET, BY TYPE, 2018-2032 (USD MILLION)
TABLE 271 CARIBBEAN ISLANDS HPE SERVERS IN MAINFRAME MARKET, BY TYPE, 2018-2032 (USD MILLION)
TABLE 272 CARIBBEAN ISLANDS ORACLE SUN SERVERS (SOLARIS) IN MAINFRAME MARKET, BY TYPE, 2018-2032 (USD MILLION)
TABLE 273 CARIBBEAN ISLANDS MAINFRAME MARKET, BY COMPONENT, 2018-2032 (USD MILLION)
TABLE 274 CARIBBEAN ISLANDS HARDWARE IN MAINFRAME MARKET, BY CATEGORY, 2018-2032 (USD MILLION)
TABLE 275 CARIBBEAN ISLANDS SERVICES IN MAINFRAME MARKET, BY CATEGORY, 2018-2032 (USD MILLION)
TABLE 276 CARIBBEAN ISLANDS SOFTWARE IN MAINFRAME MARKET, BY CATEGORY, 2018-2032 (USD MILLION)
TABLE 277 CARIBBEAN ISLANDS MAINFRAME MARKET, BY ORGANIZATION SIZE, 2018-2032 (USD MILLION)
TABLE 278 CARIBBEAN ISLANDS MAINFRAME MARKET, BY END USE, 2018-2032 (USD MILLION)
TABLE 279 CARIBBEAN ISLANDS FINANCIAL SERVICES IN MAINFRAME MARKET, BY TYPE, 2018-2032 (USD MILLION)
TABLE 280 CARIBBEAN ISLANDS BANKING AND CAPITAL MARKETS IN MAINFRAME MARKET, BY COMPONENT, 2018-2032 (USD MILLION)
TABLE 281 CARIBBEAN ISLANDS INSURANCE IN MAINFRAME MARKET, BY COMPONENT, 2018-2032 (USD MILLION)
TABLE 282 CARIBBEAN ISLANDS PAYMENTS IN MAINFRAME MARKET, BY COMPONENT, 2018-2032 (USD MILLION)
TABLE 283 CARIBBEAN ISLANDS FINANCIAL SERVICES IN MAINFRAME MARKET, BY COMPONENT, 2018-2032 (USD MILLION)
TABLE 284 CARIBBEAN ISLANDS IT & TELECOMMUNICATIONS IN MAINFRAME MARKET, BY COMPONENT, 2018-2032 (USD MILLION)
TABLE 285 CARIBBEAN ISLANDS HEALTHCARE IN MAINFRAME MARKET, BY COMPONENT, 2018-2032 (USD MILLION)
TABLE 286 CARIBBEAN ISLANDS PUBLIC SECTOR IN MAINFRAME MARKET, BY COMPONENT, 2018-2032 (USD MILLION)
TABLE 287 CARIBBEAN ISLANDS AUTOMOTIVE AND MANUFACTURING IN MAINFRAME MARKET, BY COMPONENT, 2018-2032 (USD MILLION)
TABLE 288 CARIBBEAN ISLANDS RETAIL AND CONSUMER PACKAGED GOODS (CPG) IN MAINFRAME MARKET, BY COMPONENT, 2018-2032 (USD MILLION)
TABLE 289 CARIBBEAN ISLANDS TRAVEL, MEDIA, AND ENTERTAINMENT IN MAINFRAME MARKET, BY COMPONENT, 2018-2032 (USD MILLION)
TABLE 290 CARIBBEAN ISLANDS OTHERS IN MAINFRAME MARKET, BY COMPONENT, 2018-2032 (USD MILLION)
TABLE 291 NICARAGUA MAINFRAME MARKET, BY SYSTEMS, 2018-2032 (USD MILLION)
TABLE 292 NICARAGUA MAINFRAMES IN MAINFRAME MARKET, BY TYPE, 2018-2032 (USD MILLION)
TABLE 293 NICARAGUA IBM Z SYSTEMS IN MAINFRAME MARKET, BY TYPE, 2018-2032 (USD MILLION)
TABLE 294 NICARAGUA FUJITSU GS SERIES IN MAINFRAME MARKET, BY TYPE, 2018-2032 (USD MILLION)
TABLE 295 NICARAGUA OTHER MAINFRAMES IN MAINFRAME MARKET, BY TYPE, 2018-2032 (USD MILLION)
TABLE 296 NICARAGUA MIDRANGE SYSTEMS IN MAINFRAME MARKET, BY TYPE, 2018-2032 (USD MILLION)
TABLE 297 NICARAGUA IBM POWER SYSTEMS (AIX, AS/400) IN MAINFRAME MARKET, BY TYPE, 2018-2032 (USD MILLION)
TABLE 298 NICARAGUA HPE SERVERS IN MAINFRAME MARKET, BY TYPE, 2018-2032 (USD MILLION)
TABLE 299 NICARAGUA ORACLE SUN SERVERS (SOLARIS) IN MAINFRAME MARKET, BY TYPE, 2018-2032 (USD MILLION)
TABLE 300 NICARAGUA MAINFRAME MARKET, BY COMPONENT, 2018-2032 (USD MILLION)
TABLE 301 NICARAGUA HARDWARE IN MAINFRAME MARKET, BY CATEGORY, 2018-2032 (USD MILLION)
TABLE 302 NICARAGUA SERVICES IN MAINFRAME MARKET, BY CATEGORY, 2018-2032 (USD MILLION)
TABLE 303 NICARAGUA SOFTWARE IN MAINFRAME MARKET, BY CATEGORY, 2018-2032 (USD MILLION)
TABLE 304 NICARAGUA MAINFRAME MARKET, BY ORGANIZATION SIZE, 2018-2032 (USD MILLION)
TABLE 305 NICARAGUA MAINFRAME MARKET, BY END USE, 2018-2032 (USD MILLION)
TABLE 306 NICARAGUA FINANCIAL SERVICES IN MAINFRAME MARKET, BY TYPE, 2018-2032 (USD MILLION)
TABLE 307 NICARAGUA BANKING AND CAPITAL MARKETS IN MAINFRAME MARKET, BY COMPONENT, 2018-2032 (USD MILLION)
TABLE 308 NICARAGUA INSURANCE IN MAINFRAME MARKET, BY COMPONENT, 2018-2032 (USD MILLION)
TABLE 309 NICARAGUA PAYMENTS IN MAINFRAME MARKET, BY COMPONENT, 2018-2032 (USD MILLION)
TABLE 310 NICARAGUA FINANCIAL SERVICES IN MAINFRAME MARKET, BY COMPONENT, 2018-2032 (USD MILLION)
TABLE 311 NICARAGUA IT & TELECOMMUNICATIONS IN MAINFRAME MARKET, BY COMPONENT, 2018-2032 (USD MILLION)
TABLE 312 NICARAGUA HEALTHCARE IN MAINFRAME MARKET, BY COMPONENT, 2018-2032 (USD MILLION)
TABLE 313 NICARAGUA PUBLIC SECTOR IN MAINFRAME MARKET, BY COMPONENT, 2018-2032 (USD MILLION)
TABLE 314 NICARAGUA AUTOMOTIVE AND MANUFACTURING IN MAINFRAME MARKET, BY COMPONENT, 2018-2032 (USD MILLION)
TABLE 315 NICARAGUA RETAIL AND CONSUMER PACKAGED GOODS (CPG) IN MAINFRAME MARKET, BY COMPONENT, 2018-2032 (USD MILLION)
TABLE 316 NICARAGUA TRAVEL, MEDIA, AND ENTERTAINMENT IN MAINFRAME MARKET, BY COMPONENT, 2018-2032 (USD MILLION)
TABLE 317 NICARAGUA OTHERS IN MAINFRAME MARKET, BY COMPONENT, 2018-2032 (USD MILLION)
TABLE 318 EL SALVADOR MAINFRAME MARKET, BY SYSTEMS, 2018-2032 (USD MILLION)
TABLE 319 EL SALVADOR MAINFRAMES IN MAINFRAME MARKET, BY TYPE, 2018-2032 (USD MILLION)
TABLE 320 EL SALVADOR IBM Z SYSTEMS IN MAINFRAME MARKET, BY TYPE, 2018-2032 (USD MILLION)
TABLE 321 EL SALVADOR FUJITSU GS SERIES IN MAINFRAME MARKET, BY TYPE, 2018-2032 (USD MILLION)
TABLE 322 EL SALVADOR OTHER MAINFRAMES IN MAINFRAME MARKET, BY TYPE, 2018-2032 (USD MILLION)
TABLE 323 EL SALVADOR MIDRANGE SYSTEMS IN MAINFRAME MARKET, BY TYPE, 2018-2032 (USD MILLION)
TABLE 324 EL SALVADOR IBM POWER SYSTEMS (AIX, AS/400) IN MAINFRAME MARKET, BY TYPE, 2018-2032 (USD MILLION)
TABLE 325 EL SALVADOR HPE SERVERS IN MAINFRAME MARKET, BY TYPE, 2018-2032 (USD MILLION)
TABLE 326 EL SALVADOR ORACLE SUN SERVERS (SOLARIS) IN MAINFRAME MARKET, BY TYPE, 2018-2032 (USD MILLION)
TABLE 327 EL SALVADOR MAINFRAME MARKET, BY COMPONENT, 2018-2032 (USD MILLION)
TABLE 328 EL SALVADOR HARDWARE IN MAINFRAME MARKET, BY CATEGORY, 2018-2032 (USD MILLION)
TABLE 329 EL SALVADOR SERVICES IN MAINFRAME MARKET, BY CATEGORY, 2018-2032 (USD MILLION)
TABLE 330 EL SALVADOR SOFTWARE IN MAINFRAME MARKET, BY CATEGORY, 2018-2032 (USD MILLION)
TABLE 331 EL SALVADOR MAINFRAME MARKET, BY ORGANIZATION SIZE, 2018-2032 (USD MILLION)
TABLE 332 EL SALVADOR MAINFRAME MARKET, BY END USE, 2018-2032 (USD MILLION)
TABLE 333 EL SALVADOR FINANCIAL SERVICES IN MAINFRAME MARKET, BY TYPE, 2018-2032 (USD MILLION)
TABLE 334 EL SALVADOR BANKING AND CAPITAL MARKETS IN MAINFRAME MARKET, BY COMPONENT, 2018-2032 (USD MILLION)
TABLE 335 EL SALVADOR INSURANCE IN MAINFRAME MARKET, BY COMPONENT, 2018-2032 (USD MILLION)
TABLE 336 EL SALVADOR PAYMENTS IN MAINFRAME MARKET, BY COMPONENT, 2018-2032 (USD MILLION)
TABLE 337 EL SALVADOR FINANCIAL SERVICES IN MAINFRAME MARKET, BY COMPONENT, 2018-2032 (USD MILLION)
TABLE 338 EL SALVADOR IT & TELECOMMUNICATIONS IN MAINFRAME MARKET, BY COMPONENT, 2018-2032 (USD MILLION)
TABLE 339 EL SALVADOR HEALTHCARE IN MAINFRAME MARKET, BY COMPONENT, 2018-2032 (USD MILLION)
TABLE 340 EL SALVADOR PUBLIC SECTOR IN MAINFRAME MARKET, BY COMPONENT, 2018-2032 (USD MILLION)
TABLE 341 EL SALVADOR AUTOMOTIVE AND MANUFACTURING IN MAINFRAME MARKET, BY COMPONENT, 2018-2032 (USD MILLION)
TABLE 342 EL SALVADOR RETAIL AND CONSUMER PACKAGED GOODS (CPG) IN MAINFRAME MARKET, BY COMPONENT, 2018-2032 (USD MILLION)
TABLE 343 EL SALVADOR TRAVEL, MEDIA, AND ENTERTAINMENT IN MAINFRAME MARKET, BY COMPONENT, 2018-2032 (USD MILLION)
TABLE 344 EL SALVADOR OTHERS IN MAINFRAME MARKET, BY COMPONENT, 2018-2032 (USD MILLION)
TABLE 345 BELIZE MAINFRAME MARKET, BY SYSTEMS, 2018-2032 (USD MILLION)
TABLE 346 BELIZE MAINFRAMES IN MAINFRAME MARKET, BY TYPE, 2018-2032 (USD MILLION)
TABLE 347 BELIZE IBM Z SYSTEMS IN MAINFRAME MARKET, BY TYPE, 2018-2032 (USD MILLION)
TABLE 348 BELIZE FUJITSU GS SERIES IN MAINFRAME MARKET, BY TYPE, 2018-2032 (USD MILLION)
TABLE 349 BELIZE OTHER MAINFRAMES IN MAINFRAME MARKET, BY TYPE, 2018-2032 (USD MILLION)
TABLE 350 BELIZE MIDRANGE SYSTEMS IN MAINFRAME MARKET, BY TYPE, 2018-2032 (USD MILLION)
TABLE 351 BELIZE IBM POWER SYSTEMS (AIX, AS/400) IN MAINFRAME MARKET, BY TYPE, 2018-2032 (USD MILLION)
TABLE 352 BELIZE HPE SERVERS IN MAINFRAME MARKET, BY TYPE, 2018-2032 (USD MILLION)
TABLE 353 BELIZE ORACLE SUN SERVERS (SOLARIS) IN MAINFRAME MARKET, BY TYPE, 2018-2032 (USD MILLION)
TABLE 354 BELIZE MAINFRAME MARKET, BY COMPONENT, 2018-2032 (USD MILLION)
TABLE 355 BELIZE HARDWARE IN MAINFRAME MARKET, BY CATEGORY, 2018-2032 (USD MILLION)
TABLE 356 BELIZE SERVICES IN MAINFRAME MARKET, BY CATEGORY, 2018-2032 (USD MILLION)
TABLE 357 BELIZE SOFTWARE IN MAINFRAME MARKET, BY CATEGORY, 2018-2032 (USD MILLION)
TABLE 358 BELIZE MAINFRAME MARKET, BY ORGANIZATION SIZE, 2018-2032 (USD MILLION)
TABLE 359 BELIZE MAINFRAME MARKET, BY END USE, 2018-2032 (USD MILLION)
TABLE 360 BELIZE FINANCIAL SERVICES IN MAINFRAME MARKET, BY TYPE, 2018-2032 (USD MILLION)
TABLE 361 BELIZE BANKING AND CAPITAL MARKETS IN MAINFRAME MARKET, BY COMPONENT, 2018-2032 (USD MILLION)
TABLE 362 BELIZE INSURANCE IN MAINFRAME MARKET, BY COMPONENT, 2018-2032 (USD MILLION)
TABLE 363 BELIZE PAYMENTS IN MAINFRAME MARKET, BY COMPONENT, 2018-2032 (USD MILLION)
TABLE 364 BELIZE FINANCIAL SERVICES IN MAINFRAME MARKET, BY COMPONENT, 2018-2032 (USD MILLION)
TABLE 365 BELIZE IT & TELECOMMUNICATIONS IN MAINFRAME MARKET, BY COMPONENT, 2018-2032 (USD MILLION)
TABLE 366 BELIZE HEALTHCARE IN MAINFRAME MARKET, BY COMPONENT, 2018-2032 (USD MILLION)
TABLE 367 BELIZE PUBLIC SECTOR IN MAINFRAME MARKET, BY COMPONENT, 2018-2032 (USD MILLION)
TABLE 368 BELIZE AUTOMOTIVE AND MANUFACTURING IN MAINFRAME MARKET, BY COMPONENT, 2018-2032 (USD MILLION)
TABLE 369 BELIZE RETAIL AND CONSUMER PACKAGED GOODS (CPG) IN MAINFRAME MARKET, BY COMPONENT, 2018-2032 (USD MILLION)
TABLE 370 BELIZE TRAVEL, MEDIA, AND ENTERTAINMENT IN MAINFRAME MARKET, BY COMPONENT, 2018-2032 (USD MILLION)
TABLE 371 BELIZE OTHERS IN MAINFRAME MARKET, BY COMPONENT, 2018-2032 (USD MILLION)
TABLE 372 REST OF NORTH AMERICA MAINFRAME MARKET, BY SYSTEMS, 2018-2032 (USD MILLION)
TABLE 373 EUROPE MAINFRAME MARKET, BY COUNTRY, 2018-2032 (USD MILLION)
TABLE 374 EUROPE MAINFRAME MARKET, BY SYSTEMS, 2018-2032 (USD MILLION)
TABLE 375 EUROPE MAINFRAMES IN MAINFRAME MARKET, BY TYPE, 2018-2032 (USD MILLION)
TABLE 376 EUROPE IBM Z SYSTEMS IN MAINFRAME MARKET, BY TYPE, 2018-2032 (USD MILLION)
TABLE 377 EUROPE FUJITSU GS SERIES IN MAINFRAME MARKET, BY TYPE, 2018-2032 (USD MILLION)
TABLE 378 EUROPE OTHER MAINFRAMES IN MAINFRAME MARKET, BY TYPE, 2018-2032 (USD MILLION)
TABLE 379 EUROPE MIDRANGE SYSTEMS IN MAINFRAME MARKET, BY TYPE, 2018-2032 (USD MILLION)
TABLE 380 EUROPE IBM POWER SYSTEMS (AIX, AS/400) IN MAINFRAME MARKET, BY TYPE, 2018-2032 (USD MILLION)
TABLE 381 EUROPE HPE SERVERS IN MAINFRAME MARKET, BY TYPE, 2018-2032 (USD MILLION)
TABLE 382 EUROPE ORACLE SUN SERVERS (SOLARIS) IN MAINFRAME MARKET, BY TYPE, 2018-2032 (USD MILLION)
TABLE 383 EUROPE MAINFRAME MARKET, BY COMPONENT, 2018-2032 (USD MILLION)
TABLE 384 EUROPE HARDWARE IN MAINFRAME MARKET, BY CATEGORY, 2018-2032 (USD MILLION)
TABLE 385 EUROPE SERVICES IN MAINFRAME MARKET, BY CATEGORY, 2018-2032 (USD MILLION)
TABLE 386 EUROPE SOFTWARE IN MAINFRAME MARKET, BY CATEGORY, 2018-2032 (USD MILLION)
TABLE 387 EUROPE MAINFRAME MARKET, BY ORGANIZATION SIZE, 2018-2032 (USD MILLION)
TABLE 388 EUROPE MAINFRAME MARKET, BY END USE, 2018-2032 (USD MILLION)
TABLE 389 EUROPE FINANCIAL SERVICES IN MAINFRAME MARKET, BY TYPE, 2018-2032 (USD MILLION)
TABLE 390 EUROPE BANKING AND CAPITAL MARKETS IN MAINFRAME MARKET, BY COMPONENT, 2018-2032 (USD MILLION)
TABLE 391 EUROPE INSURANCE IN MAINFRAME MARKET, BY COMPONENT, 2018-2032 (USD MILLION)
TABLE 392 EUROPE PAYMENTS IN MAINFRAME MARKET, BY COMPONENT, 2018-2032 (USD MILLION)
TABLE 393 EUROPE FINANCIAL SERVICES IN MAINFRAME MARKET, BY COMPONENT, 2018-2032 (USD MILLION)
TABLE 394 EUROPE IT & TELECOMMUNICATIONS IN MAINFRAME MARKET, BY COMPONENT, 2018-2032 (USD MILLION)
TABLE 395 EUROPE HEALTHCARE IN MAINFRAME MARKET, BY COMPONENT, 2018-2032 (USD MILLION)
TABLE 396 EUROPE PUBLIC SECTOR IN MAINFRAME MARKET, BY COMPONENT, 2018-2032 (USD MILLION)
TABLE 397 EUROPE AUTOMOTIVE AND MANUFACTURING IN MAINFRAME MARKET, BY COMPONENT, 2018-2032 (USD MILLION)
TABLE 398 EUROPE RETAIL AND CONSUMER PACKAGED GOODS (CPG) IN MAINFRAME MARKET, BY COMPONENT, 2018-2032 (USD MILLION)
TABLE 399 EUROPE TRAVEL, MEDIA, AND ENTERTAINMENT IN MAINFRAME MARKET, BY COMPONENT, 2018-2032 (USD MILLION)
TABLE 400 EUROPE OTHERS IN MAINFRAME MARKET, BY COMPONENT, 2018-2032 (USD MILLION)
TABLE 401 U.K. MAINFRAME MARKET, BY SYSTEMS, 2018-2032 (USD MILLION)
TABLE 402 U.K. MAINFRAMES IN MAINFRAME MARKET, BY TYPE, 2018-2032 (USD MILLION)
TABLE 403 U.K. IBM Z SYSTEMS IN MAINFRAME MARKET, BY TYPE, 2018-2032 (USD MILLION)
TABLE 404 U.K. FUJITSU GS SERIES IN MAINFRAME MARKET, BY TYPE, 2018-2032 (USD MILLION)
TABLE 405 U.K. OTHER MAINFRAMES IN MAINFRAME MARKET, BY TYPE, 2018-2032 (USD MILLION)
TABLE 406 U.K. MIDRANGE SYSTEMS IN MAINFRAME MARKET, BY TYPE, 2018-2032 (USD MILLION)
TABLE 407 U.K. IBM POWER SYSTEMS (AIX, AS/400) IN MAINFRAME MARKET, BY TYPE, 2018-2032 (USD MILLION)
TABLE 408 U.K. HPE SERVERS IN MAINFRAME MARKET, BY TYPE, 2018-2032 (USD MILLION)
TABLE 409 U.K. ORACLE SUN SERVERS (SOLARIS) IN MAINFRAME MARKET, BY TYPE, 2018-2032 (USD MILLION)
TABLE 410 U.K. MAINFRAME MARKET, BY COMPONENT, 2018-2032 (USD MILLION)
TABLE 411 U.K. HARDWARE IN MAINFRAME MARKET, BY CATEGORY, 2018-2032 (USD MILLION)
TABLE 412 U.K. SERVICES IN MAINFRAME MARKET, BY CATEGORY, 2018-2032 (USD MILLION)
TABLE 413 U.K. SOFTWARE IN MAINFRAME MARKET, BY CATEGORY, 2018-2032 (USD MILLION)
TABLE 414 U.K. MAINFRAME MARKET, BY ORGANIZATION SIZE, 2018-2032 (USD MILLION)
TABLE 415 U.K. MAINFRAME MARKET, BY END USE, 2018-2032 (USD MILLION)
TABLE 416 U.K. FINANCIAL SERVICES IN MAINFRAME MARKET, BY TYPE, 2018-2032 (USD MILLION)
TABLE 417 U.K. BANKING AND CAPITAL MARKETS IN MAINFRAME MARKET, BY COMPONENT, 2018-2032 (USD MILLION)
TABLE 418 U.K. INSURANCE IN MAINFRAME MARKET, BY COMPONENT, 2018-2032 (USD MILLION)
TABLE 419 U.K. PAYMENTS IN MAINFRAME MARKET, BY COMPONENT, 2018-2032 (USD MILLION)
TABLE 420 U.K. FINANCIAL SERVICES IN MAINFRAME MARKET, BY COMPONENT, 2018-2032 (USD MILLION)
TABLE 421 U.K. IT & TELECOMMUNICATIONS IN MAINFRAME MARKET, BY COMPONENT, 2018-2032 (USD MILLION)
TABLE 422 U.K. HEALTHCARE IN MAINFRAME MARKET, BY COMPONENT, 2018-2032 (USD MILLION)
TABLE 423 U.K. PUBLIC SECTOR IN MAINFRAME MARKET, BY COMPONENT, 2018-2032 (USD MILLION)
TABLE 424 U.K. AUTOMOTIVE AND MANUFACTURING IN MAINFRAME MARKET, BY COMPONENT, 2018-2032 (USD MILLION)
TABLE 425 U.K. RETAIL AND CONSUMER PACKAGED GOODS (CPG) IN MAINFRAME MARKET, BY COMPONENT, 2018-2032 (USD MILLION)
TABLE 426 U.K. TRAVEL, MEDIA, AND ENTERTAINMENT IN MAINFRAME MARKET, BY COMPONENT, 2018-2032 (USD MILLION)
TABLE 427 U.K. OTHERS IN MAINFRAME MARKET, BY COMPONENT, 2018-2032 (USD MILLION)
TABLE 428 GERMANY MAINFRAME MARKET, BY SYSTEMS, 2018-2032 (USD MILLION)
TABLE 429 GERMANY MAINFRAMES IN MAINFRAME MARKET, BY TYPE, 2018-2032 (USD MILLION)
TABLE 430 GERMANY IBM Z SYSTEMS IN MAINFRAME MARKET, BY TYPE, 2018-2032 (USD MILLION)
TABLE 431 GERMANY FUJITSU GS SERIES IN MAINFRAME MARKET, BY TYPE, 2018-2032 (USD MILLION)
TABLE 432 GERMANY OTHER MAINFRAMES IN MAINFRAME MARKET, BY TYPE, 2018-2032 (USD MILLION)
TABLE 433 GERMANY MIDRANGE SYSTEMS IN MAINFRAME MARKET, BY TYPE, 2018-2032 (USD MILLION)
TABLE 434 GERMANY IBM POWER SYSTEMS (AIX, AS/400) IN MAINFRAME MARKET, BY TYPE, 2018-2032 (USD MILLION)
TABLE 435 GERMANY HPE SERVERS IN MAINFRAME MARKET, BY TYPE, 2018-2032 (USD MILLION)
TABLE 436 GERMANY ORACLE SUN SERVERS (SOLARIS) IN MAINFRAME MARKET, BY TYPE, 2018-2032 (USD MILLION)
TABLE 437 GERMANY MAINFRAME MARKET, BY COMPONENT, 2018-2032 (USD MILLION)
TABLE 438 GERMANY HARDWARE IN MAINFRAME MARKET, BY CATEGORY, 2018-2032 (USD MILLION)
TABLE 439 GERMANY SERVICES IN MAINFRAME MARKET, BY CATEGORY, 2018-2032 (USD MILLION)
TABLE 440 GERMANY SOFTWARE IN MAINFRAME MARKET, BY CATEGORY, 2018-2032 (USD MILLION)
TABLE 441 GERMANY MAINFRAME MARKET, BY ORGANIZATION SIZE, 2018-2032 (USD MILLION)
TABLE 442 GERMANY MAINFRAME MARKET, BY END USE, 2018-2032 (USD MILLION)
TABLE 443 GERMANY FINANCIAL SERVICES IN MAINFRAME MARKET, BY TYPE, 2018-2032 (USD MILLION)
TABLE 444 GERMANY BANKING AND CAPITAL MARKETS IN MAINFRAME MARKET, BY COMPONENT, 2018-2032 (USD MILLION)
TABLE 445 GERMANY INSURANCE IN MAINFRAME MARKET, BY COMPONENT, 2018-2032 (USD MILLION)
TABLE 446 GERMANY PAYMENTS IN MAINFRAME MARKET, BY COMPONENT, 2018-2032 (USD MILLION)
TABLE 447 GERMANY FINANCIAL SERVICES IN MAINFRAME MARKET, BY COMPONENT, 2018-2032 (USD MILLION)
TABLE 448 GERMANY IT & TELECOMMUNICATIONS IN MAINFRAME MARKET, BY COMPONENT, 2018-2032 (USD MILLION)
TABLE 449 GERMANY HEALTHCARE IN MAINFRAME MARKET, BY COMPONENT, 2018-2032 (USD MILLION)
TABLE 450 GERMANY PUBLIC SECTOR IN MAINFRAME MARKET, BY COMPONENT, 2018-2032 (USD MILLION)
TABLE 451 GERMANY AUTOMOTIVE AND MANUFACTURING IN MAINFRAME MARKET, BY COMPONENT, 2018-2032 (USD MILLION)
TABLE 452 GERMANY RETAIL AND CONSUMER PACKAGED GOODS (CPG) IN MAINFRAME MARKET, BY COMPONENT, 2018-2032 (USD MILLION)
TABLE 453 GERMANY TRAVEL, MEDIA, AND ENTERTAINMENT IN MAINFRAME MARKET, BY COMPONENT, 2018-2032 (USD MILLION)
TABLE 454 GERMANY OTHERS IN MAINFRAME MARKET, BY COMPONENT, 2018-2032 (USD MILLION)
TABLE 455 FRANCE MAINFRAME MARKET, BY SYSTEMS, 2018-2032 (USD MILLION)
TABLE 456 FRANCE MAINFRAMES IN MAINFRAME MARKET, BY TYPE, 2018-2032 (USD MILLION)
TABLE 457 FRANCE IBM Z SYSTEMS IN MAINFRAME MARKET, BY TYPE, 2018-2032 (USD MILLION)
TABLE 458 FRANCE FUJITSU GS SERIES IN MAINFRAME MARKET, BY TYPE, 2018-2032 (USD MILLION)
TABLE 459 FRANCE OTHER MAINFRAMES IN MAINFRAME MARKET, BY TYPE, 2018-2032 (USD MILLION)
TABLE 460 FRANCE MIDRANGE SYSTEMS IN MAINFRAME MARKET, BY TYPE, 2018-2032 (USD MILLION)
TABLE 461 FRANCE IBM POWER SYSTEMS (AIX, AS/400) IN MAINFRAME MARKET, BY TYPE, 2018-2032 (USD MILLION)
TABLE 462 FRANCE HPE SERVERS IN MAINFRAME MARKET, BY TYPE, 2018-2032 (USD MILLION)
TABLE 463 FRANCE ORACLE SUN SERVERS (SOLARIS) IN MAINFRAME MARKET, BY TYPE, 2018-2032 (USD MILLION)
TABLE 464 FRANCE MAINFRAME MARKET, BY COMPONENT, 2018-2032 (USD MILLION)
TABLE 465 FRANCE HARDWARE IN MAINFRAME MARKET, BY CATEGORY, 2018-2032 (USD MILLION)
TABLE 466 FRANCE SERVICES IN MAINFRAME MARKET, BY CATEGORY, 2018-2032 (USD MILLION)
TABLE 467 FRANCE SOFTWARE IN MAINFRAME MARKET, BY CATEGORY, 2018-2032 (USD MILLION)
TABLE 468 FRANCE MAINFRAME MARKET, BY ORGANIZATION SIZE, 2018-2032 (USD MILLION)
TABLE 469 FRANCE MAINFRAME MARKET, BY END USE, 2018-2032 (USD MILLION)
TABLE 470 FRANCE FINANCIAL SERVICES IN MAINFRAME MARKET, BY TYPE, 2018-2032 (USD MILLION)
TABLE 471 FRANCE BANKING AND CAPITAL MARKETS IN MAINFRAME MARKET, BY COMPONENT, 2018-2032 (USD MILLION)
TABLE 472 FRANCE INSURANCE IN MAINFRAME MARKET, BY COMPONENT, 2018-2032 (USD MILLION)
TABLE 473 FRANCE PAYMENTS IN MAINFRAME MARKET, BY COMPONENT, 2018-2032 (USD MILLION)
TABLE 474 FRANCE FINANCIAL SERVICES IN MAINFRAME MARKET, BY COMPONENT, 2018-2032 (USD MILLION)
TABLE 475 FRANCE IT & TELECOMMUNICATIONS IN MAINFRAME MARKET, BY COMPONENT, 2018-2032 (USD MILLION)
TABLE 476 FRANCE HEALTHCARE IN MAINFRAME MARKET, BY COMPONENT, 2018-2032 (USD MILLION)
TABLE 477 FRANCE PUBLIC SECTOR IN MAINFRAME MARKET, BY COMPONENT, 2018-2032 (USD MILLION)
TABLE 478 FRANCE AUTOMOTIVE AND MANUFACTURING IN MAINFRAME MARKET, BY COMPONENT, 2018-2032 (USD MILLION)
TABLE 479 FRANCE RETAIL AND CONSUMER PACKAGED GOODS (CPG) IN MAINFRAME MARKET, BY COMPONENT, 2018-2032 (USD MILLION)
TABLE 480 FRANCE TRAVEL, MEDIA, AND ENTERTAINMENT IN MAINFRAME MARKET, BY COMPONENT, 2018-2032 (USD MILLION)
TABLE 481 FRANCE OTHERS IN MAINFRAME MARKET, BY COMPONENT, 2018-2032 (USD MILLION)
TABLE 482 ITALY
TABLE 483 ITALY MAINFRAME MARKET, BY SYSTEMS, 2018-2032 (USD MILLION)
TABLE 484 ITALY MAINFRAMES IN MAINFRAME MARKET, BY TYPE, 2018-2032 (USD MILLION)
TABLE 485 ITALY IBM Z SYSTEMS IN MAINFRAME MARKET, BY TYPE, 2018-2032 (USD MILLION)
TABLE 486 ITALY FUJITSU GS SERIES IN MAINFRAME MARKET, BY TYPE, 2018-2032 (USD MILLION)
TABLE 487 ITALY OTHER MAINFRAMES IN MAINFRAME MARKET, BY TYPE, 2018-2032 (USD MILLION)
TABLE 488 ITALY MIDRANGE SYSTEMS IN MAINFRAME MARKET, BY TYPE, 2018-2032 (USD MILLION)
TABLE 489 ITALY IBM POWER SYSTEMS (AIX, AS/400) IN MAINFRAME MARKET, BY TYPE, 2018-2032 (USD MILLION)
TABLE 490 ITALY HPE SERVERS IN MAINFRAME MARKET, BY TYPE, 2018-2032 (USD MILLION)
TABLE 491 ITALY ORACLE SUN SERVERS (SOLARIS) IN MAINFRAME MARKET, BY TYPE, 2018-2032 (USD MILLION)
TABLE 492 ITALY MAINFRAME MARKET, BY COMPONENT, 2018-2032 (USD MILLION)
TABLE 493 ITALY HARDWARE IN MAINFRAME MARKET, BY CATEGORY, 2018-2032 (USD MILLION)
TABLE 494 ITALY SERVICES IN MAINFRAME MARKET, BY CATEGORY, 2018-2032 (USD MILLION)
TABLE 495 ITALY SOFTWARE IN MAINFRAME MARKET, BY CATEGORY, 2018-2032 (USD MILLION)
TABLE 496 ITALY MAINFRAME MARKET, BY ORGANIZATION SIZE, 2018-2032 (USD MILLION)
TABLE 497 ITALY MAINFRAME MARKET, BY END USE, 2018-2032 (USD MILLION)
TABLE 498 ITALY FINANCIAL SERVICES IN MAINFRAME MARKET, BY TYPE, 2018-2032 (USD MILLION)
TABLE 499 ITALY BANKING AND CAPITAL MARKETS IN MAINFRAME MARKET, BY COMPONENT, 2018-2032 (USD MILLION)
TABLE 500 ITALY INSURANCE IN MAINFRAME MARKET, BY COMPONENT, 2018-2032 (USD MILLION)
TABLE 501 ITALY PAYMENTS IN MAINFRAME MARKET, BY COMPONENT, 2018-2032 (USD MILLION)
TABLE 502 ITALY FINANCIAL SERVICES IN MAINFRAME MARKET, BY COMPONENT, 2018-2032 (USD MILLION)
TABLE 503 ITALY IT & TELECOMMUNICATIONS IN MAINFRAME MARKET, BY COMPONENT, 2018-2032 (USD MILLION)
TABLE 504 ITALY HEALTHCARE IN MAINFRAME MARKET, BY COMPONENT, 2018-2032 (USD MILLION)
TABLE 505 ITALY PUBLIC SECTOR IN MAINFRAME MARKET, BY COMPONENT, 2018-2032 (USD MILLION)
TABLE 506 ITALY AUTOMOTIVE AND MANUFACTURING IN MAINFRAME MARKET, BY COMPONENT, 2018-2032 (USD MILLION)
TABLE 507 ITALY RETAIL AND CONSUMER PACKAGED GOODS (CPG) IN MAINFRAME MARKET, BY COMPONENT, 2018-2032 (USD MILLION)
TABLE 508 ITALY TRAVEL, MEDIA, AND ENTERTAINMENT IN MAINFRAME MARKET, BY COMPONENT, 2018-2032 (USD MILLION)
TABLE 509 ITALY OTHERS IN MAINFRAME MARKET, BY COMPONENT, 2018-2032 (USD MILLION)
TABLE 510 SPAIN MAINFRAME MARKET, BY SYSTEMS, 2018-2032 (USD MILLION)
TABLE 511 SPAIN MAINFRAMES IN MAINFRAME MARKET, BY TYPE, 2018-2032 (USD MILLION)
TABLE 512 SPAIN IBM Z SYSTEMS IN MAINFRAME MARKET, BY TYPE, 2018-2032 (USD MILLION)
TABLE 513 SPAIN FUJITSU GS SERIES IN MAINFRAME MARKET, BY TYPE, 2018-2032 (USD MILLION)
TABLE 514 SPAIN OTHER MAINFRAMES IN MAINFRAME MARKET, BY TYPE, 2018-2032 (USD MILLION)
TABLE 515 SPAIN MIDRANGE SYSTEMS IN MAINFRAME MARKET, BY TYPE, 2018-2032 (USD MILLION)
TABLE 516 SPAIN IBM POWER SYSTEMS (AIX, AS/400) IN MAINFRAME MARKET, BY TYPE, 2018-2032 (USD MILLION)
TABLE 517 SPAIN HPE SERVERS IN MAINFRAME MARKET, BY TYPE, 2018-2032 (USD MILLION)
TABLE 518 SPAIN ORACLE SUN SERVERS (SOLARIS) IN MAINFRAME MARKET, BY TYPE, 2018-2032 (USD MILLION)
TABLE 519 312
TABLE 520 SPAIN HARDWARE IN MAINFRAME MARKET, BY CATEGORY, 2018-2032 (USD MILLION)
TABLE 521 SPAIN SERVICES IN MAINFRAME MARKET, BY CATEGORY, 2018-2032 (USD MILLION)
TABLE 522 SPAIN SOFTWARE IN MAINFRAME MARKET, BY CATEGORY, 2018-2032 (USD MILLION)
TABLE 523 SPAIN MAINFRAME MARKET, BY ORGANIZATION SIZE, 2018-2032 (USD MILLION)
TABLE 524 SPAIN MAINFRAME MARKET, BY END USE, 2018-2032 (USD MILLION)
TABLE 525 SPAIN FINANCIAL SERVICES IN MAINFRAME MARKET, BY TYPE, 2018-2032 (USD MILLION)
TABLE 526 SPAIN BANKING AND CAPITAL MARKETS IN MAINFRAME MARKET, BY COMPONENT, 2018-2032 (USD MILLION)
TABLE 527 SPAIN INSURANCE IN MAINFRAME MARKET, BY COMPONENT, 2018-2032 (USD MILLION)
TABLE 528 SPAIN PAYMENTS IN MAINFRAME MARKET, BY COMPONENT, 2018-2032 (USD MILLION)
TABLE 529 315
TABLE 530 SPAIN IT & TELECOMMUNICATIONS IN MAINFRAME MARKET, BY COMPONENT, 2018-2032 (USD MILLION)
TABLE 531 SPAIN HEALTHCARE IN MAINFRAME MARKET, BY COMPONENT, 2018-2032 (USD MILLION)
TABLE 532 SPAIN AUTOMOTIVE AND MANUFACTURING IN MAINFRAME MARKET, BY COMPONENT, 2018-2032 (USD MILLION)
TABLE 533 SPAIN RETAIL AND CONSUMER PACKAGED GOODS (CPG) IN MAINFRAME MARKET, BY COMPONENT, 2018-2032 (USD MILLION)
TABLE 534 SPAIN TRAVEL, MEDIA, AND ENTERTAINMENT IN MAINFRAME MARKET, BY COMPONENT, 2018-2032 (USD MILLION)
TABLE 535 SPAIN OTHERS IN MAINFRAME MARKET, BY COMPONENT, 2018-2032 (USD MILLION)
TABLE 536 RUSSIA MAINFRAME MARKET, BY SYSTEMS, 2018-2032 (USD MILLION)
TABLE 537 RUSSIA MAINFRAMES IN MAINFRAME MARKET, BY TYPE, 2018-2032 (USD MILLION)
TABLE 538 RUSSIA IBM Z SYSTEMS IN MAINFRAME MARKET, BY TYPE, 2018-2032 (USD MILLION)
TABLE 539 RUSSIA FUJITSU GS SERIES IN MAINFRAME MARKET, BY TYPE, 2018-2032 (USD MILLION)
TABLE 540 RUSSIA OTHER MAINFRAMES IN MAINFRAME MARKET, BY TYPE, 2018-2032 (USD MILLION)
TABLE 541 RUSSIA MIDRANGE SYSTEMS IN MAINFRAME MARKET, BY TYPE, 2018-2032 (USD MILLION)
TABLE 542 RUSSIA IBM POWER SYSTEMS (AIX, AS/400) IN MAINFRAME MARKET, BY TYPE, 2018-2032 (USD MILLION)
TABLE 543 RUSSIA HPE SERVERS IN MAINFRAME MARKET, BY TYPE, 2018-2032 (USD MILLION)
TABLE 544 RUSSIA ORACLE SUN SERVERS (SOLARIS) IN MAINFRAME MARKET, BY TYPE, 2018-2032 (USD MILLION)
TABLE 545 RUSSIA MAINFRAME MARKET, BY COMPONENT, 2018-2032 (USD MILLION)
TABLE 546 RUSSIA HARDWARE IN MAINFRAME MARKET, BY CATEGORY, 2018-2032 (USD MILLION)
TABLE 547 RUSSIA SERVICES IN MAINFRAME MARKET, BY CATEGORY, 2018-2032 (USD MILLION)
TABLE 548 RUSSIA SOFTWARE IN MAINFRAME MARKET, BY CATEGORY, 2018-2032 (USD MILLION)
TABLE 549 RUSSIA MAINFRAME MARKET, BY ORGANIZATION SIZE, 2018-2032 (USD MILLION)
TABLE 550 RUSSIA MAINFRAME MARKET, BY END USE, 2018-2032 (USD MILLION)
TABLE 551 RUSSIA FINANCIAL SERVICES IN MAINFRAME MARKET, BY TYPE, 2018-2032 (USD MILLION)
TABLE 552 RUSSIA BANKING AND CAPITAL MARKETS IN MAINFRAME MARKET, BY COMPONENT, 2018-2032 (USD MILLION)
TABLE 553 RUSSIA INSURANCE IN MAINFRAME MARKET, BY COMPONENT, 2018-2032 (USD MILLION)
TABLE 554 RUSSIA PAYMENTS IN MAINFRAME MARKET, BY COMPONENT, 2018-2032 (USD MILLION)
TABLE 555 RUSSIA FINANCIAL SERVICES IN MAINFRAME MARKET, BY COMPONENT, 2018-2032 (USD MILLION)
TABLE 556 RUSSIA IT & TELECOMMUNICATIONS IN MAINFRAME MARKET, BY COMPONENT, 2018-2032 (USD MILLION)
TABLE 557 RUSSIA HEALTHCARE IN MAINFRAME MARKET, BY COMPONENT, 2018-2032 (USD MILLION)
TABLE 558 RUSSIA PUBLIC SECTOR IN MAINFRAME MARKET, BY COMPONENT, 2018-2032 (USD MILLION)
TABLE 559 RUSSIA AUTOMOTIVE AND MANUFACTURING IN MAINFRAME MARKET, BY COMPONENT, 2018-2032 (USD MILLION)
TABLE 560 RUSSIA RETAIL AND CONSUMER PACKAGED GOODS (CPG) IN MAINFRAME MARKET, BY COMPONENT, 2018-2032 (USD MILLION)
TABLE 561 RUSSIA TRAVEL, MEDIA, AND ENTERTAINMENT IN MAINFRAME MARKET, BY COMPONENT, 2018-2032 (USD MILLION)
TABLE 562 RUSSIA OTHERS IN MAINFRAME MARKET, BY COMPONENT, 2018-2032 (USD MILLION)
TABLE 563 NETHERLANDS MAINFRAME MARKET, BY SYSTEMS, 2018-2032 (USD MILLION)
TABLE 564 NETHERLANDS MAINFRAMES IN MAINFRAME MARKET, BY TYPE, 2018-2032 (USD MILLION)
TABLE 565 NETHERLANDS IBM Z SYSTEMS IN MAINFRAME MARKET, BY TYPE, 2018-2032 (USD MILLION)
TABLE 566 NETHERLANDS FUJITSU GS SERIES IN MAINFRAME MARKET, BY TYPE, 2018-2032 (USD MILLION)
TABLE 567 NETHERLANDS OTHER MAINFRAMES IN MAINFRAME MARKET, BY TYPE, 2018-2032 (USD MILLION)
TABLE 568 NETHERLANDS MIDRANGE SYSTEMS IN MAINFRAME MARKET, BY TYPE, 2018-2032 (USD MILLION)
TABLE 569 NETHERLANDS IBM POWER SYSTEMS (AIX, AS/400) IN MAINFRAME MARKET, BY TYPE, 2018-2032 (USD MILLION)
TABLE 570 NETHERLANDS HPE SERVERS IN MAINFRAME MARKET, BY TYPE, 2018-2032 (USD MILLION)
TABLE 571 NETHERLANDS ORACLE SUN SERVERS (SOLARIS) IN MAINFRAME MARKET, BY TYPE, 2018-2032 (USD MILLION)
TABLE 572 NETHERLANDS MAINFRAME MARKET, BY COMPONENT, 2018-2032 (USD MILLION)
TABLE 573 NETHERLANDS HARDWARE IN MAINFRAME MARKET, BY CATEGORY, 2018-2032 (USD MILLION)
TABLE 574 NETHERLANDS SERVICES IN MAINFRAME MARKET, BY CATEGORY, 2018-2032 (USD MILLION)
TABLE 575 NETHERLANDS SOFTWARE IN MAINFRAME MARKET, BY CATEGORY, 2018-2032 (USD MILLION)
TABLE 576 NETHERLANDS MAINFRAME MARKET, BY ORGANIZATION SIZE, 2018-2032 (USD MILLION)
TABLE 577 NETHERLANDS MAINFRAME MARKET, BY END USE, 2018-2032 (USD MILLION)
TABLE 578 NETHERLANDS FINANCIAL SERVICES IN MAINFRAME MARKET, BY TYPE, 2018-2032 (USD MILLION)
TABLE 579 NETHERLANDS BANKING AND CAPITAL MARKETS IN MAINFRAME MARKET, BY COMPONENT, 2018-2032 (USD MILLION)
TABLE 580 NETHERLANDS INSURANCE IN MAINFRAME MARKET, BY COMPONENT, 2018-2032 (USD MILLION)
TABLE 581 NETHERLANDS PAYMENTS IN MAINFRAME MARKET, BY COMPONENT, 2018-2032 (USD MILLION)
TABLE 582 NETHERLANDS FINANCIAL SERVICES IN MAINFRAME MARKET, BY COMPONENT, 2018-2032 (USD MILLION)
TABLE 583 NETHERLANDS IT & TELECOMMUNICATIONS IN MAINFRAME MARKET, BY COMPONENT, 2018-2032 (USD MILLION)
TABLE 584 NETHERLANDS HEALTHCARE IN MAINFRAME MARKET, BY COMPONENT, 2018-2032 (USD MILLION)
TABLE 585 NETHERLANDS PUBLIC SECTOR IN MAINFRAME MARKET, BY COMPONENT, 2018-2032 (USD MILLION)
TABLE 586 NETHERLANDS AUTOMOTIVE AND MANUFACTURING IN MAINFRAME MARKET, BY COMPONENT, 2018-2032 (USD MILLION)
TABLE 587 NETHERLANDS RETAIL AND CONSUMER PACKAGED GOODS (CPG) IN MAINFRAME MARKET, BY COMPONENT, 2018-2032 (USD MILLION)
TABLE 588 NETHERLANDS TRAVEL, MEDIA, AND ENTERTAINMENT IN MAINFRAME MARKET, BY COMPONENT, 2018-2032 (USD MILLION)
TABLE 589 NETHERLANDS OTHERS IN MAINFRAME MARKET, BY COMPONENT, 2018-2032 (USD MILLION)
TABLE 590 SWITZERLAND MAINFRAME MARKET, BY SYSTEMS, 2018-2032 (USD MILLION)
TABLE 591 SWITZERLAND MAINFRAMES IN MAINFRAME MARKET, BY TYPE, 2018-2032 (USD MILLION)
TABLE 592 SWITZERLAND IBM Z SYSTEMS IN MAINFRAME MARKET, BY TYPE, 2018-2032 (USD MILLION)
TABLE 593 SWITZERLAND FUJITSU GS SERIES IN MAINFRAME MARKET, BY TYPE, 2018-2032 (USD MILLION)
TABLE 594 SWITZERLAND OTHER MAINFRAMES IN MAINFRAME MARKET, BY TYPE, 2018-2032 (USD MILLION)
TABLE 595 SWITZERLAND MIDRANGE SYSTEMS IN MAINFRAME MARKET, BY TYPE, 2018-2032 (USD MILLION)
TABLE 596 SWITZERLAND IBM POWER SYSTEMS (AIX, AS/400) IN MAINFRAME MARKET, BY TYPE, 2018-2032 (USD MILLION)
TABLE 597 SWITZERLAND HPE SERVERS IN MAINFRAME MARKET, BY TYPE, 2018-2032 (USD MILLION)
TABLE 598 SWITZERLAND ORACLE SUN SERVERS (SOLARIS) IN MAINFRAME MARKET, BY TYPE, 2018-2032 (USD MILLION)
TABLE 599 SWITZERLAND MAINFRAME MARKET, BY COMPONENT, 2018-2032 (USD MILLION)
TABLE 600 SWITZERLAND HARDWARE IN MAINFRAME MARKET, BY CATEGORY, 2018-2032 (USD MILLION)
TABLE 601 SWITZERLAND SERVICES IN MAINFRAME MARKET, BY CATEGORY, 2018-2032 (USD MILLION)
TABLE 602 SWITZERLAND SOFTWARE IN MAINFRAME MARKET, BY CATEGORY, 2018-2032 (USD MILLION)
TABLE 603 SWITZERLAND MAINFRAME MARKET, BY ORGANIZATION SIZE, 2018-2032 (USD MILLION)
TABLE 604 SWITZERLAND MAINFRAME MARKET, BY END USE, 2018-2032 (USD MILLION)
TABLE 605 SWITZERLAND FINANCIAL SERVICES IN MAINFRAME MARKET, BY TYPE, 2018-2032 (USD MILLION)
TABLE 606 SWITZERLAND BANKING AND CAPITAL MARKETS IN MAINFRAME MARKET, BY COMPONENT, 2018-2032 (USD MILLION)
TABLE 607 SWITZERLAND INSURANCE IN MAINFRAME MARKET, BY COMPONENT, 2018-2032 (USD MILLION)
TABLE 608 SWITZERLAND PAYMENTS IN MAINFRAME MARKET, BY COMPONENT, 2018-2032 (USD MILLION)
TABLE 609 SWITZERLAND FINANCIAL SERVICES IN MAINFRAME MARKET, BY COMPONENT, 2018-2032 (USD MILLION)
TABLE 610 SWITZERLAND IT & TELECOMMUNICATIONS IN MAINFRAME MARKET, BY COMPONENT, 2018-2032 (USD MILLION)
TABLE 611 SWITZERLAND HEALTHCARE IN MAINFRAME MARKET, BY COMPONENT, 2018-2032 (USD MILLION)
TABLE 612 SWITZERLAND PUBLIC SECTOR IN MAINFRAME MARKET, BY COMPONENT, 2018-2032 (USD MILLION)
TABLE 613 SWITZERLAND AUTOMOTIVE AND MANUFACTURING IN MAINFRAME MARKET, BY COMPONENT, 2018-2032 (USD MILLION)
TABLE 614 SWITZERLAND RETAIL AND CONSUMER PACKAGED GOODS (CPG) IN MAINFRAME MARKET, BY COMPONENT, 2018-2032 (USD MILLION)
TABLE 615 SWITZERLAND TRAVEL, MEDIA, AND ENTERTAINMENT IN MAINFRAME MARKET, BY COMPONENT, 2018-2032 (USD MILLION)
TABLE 616 SWITZERLAND OTHERS IN MAINFRAME MARKET, BY COMPONENT, 2018-2032 (USD MILLION)
TABLE 617 TURKEY MAINFRAME MARKET, BY SYSTEMS, 2018-2032 (USD MILLION)
TABLE 618 TURKEY MAINFRAMES IN MAINFRAME MARKET, BY TYPE, 2018-2032 (USD MILLION)
TABLE 619 TURKEY IBM Z SYSTEMS IN MAINFRAME MARKET, BY TYPE, 2018-2032 (USD MILLION)
TABLE 620 TURKEY FUJITSU GS SERIES IN MAINFRAME MARKET, BY TYPE, 2018-2032 (USD MILLION)
TABLE 621 TURKEY OTHER MAINFRAMES IN MAINFRAME MARKET, BY TYPE, 2018-2032 (USD MILLION)
TABLE 622 TURKEY MIDRANGE SYSTEMS IN MAINFRAME MARKET, BY TYPE, 2018-2032 (USD MILLION)
TABLE 623 TURKEY IBM POWER SYSTEMS (AIX, AS/400) IN MAINFRAME MARKET, BY TYPE, 2018-2032 (USD MILLION)
TABLE 624 TURKEY HPE SERVERS IN MAINFRAME MARKET, BY TYPE, 2018-2032 (USD MILLION)
TABLE 625 TURKEY ORACLE SUN SERVERS (SOLARIS) IN MAINFRAME MARKET, BY TYPE, 2018-2032 (USD MILLION)
TABLE 626 TURKEY MAINFRAME MARKET, BY COMPONENT, 2018-2032 (USD MILLION)
TABLE 627 TURKEY HARDWARE IN MAINFRAME MARKET, BY CATEGORY, 2018-2032 (USD MILLION)
TABLE 628 TURKEY SERVICES IN MAINFRAME MARKET, BY CATEGORY, 2018-2032 (USD MILLION)
TABLE 629 TURKEY SOFTWARE IN MAINFRAME MARKET, BY CATEGORY, 2018-2032 (USD MILLION)
TABLE 630 TURKEY MAINFRAME MARKET, BY ORGANIZATION SIZE, 2018-2032 (USD MILLION)
TABLE 631 TURKEY MAINFRAME MARKET, BY END USE, 2018-2032 (USD MILLION)
TABLE 632 TURKEY FINANCIAL SERVICES IN MAINFRAME MARKET, BY TYPE, 2018-2032 (USD MILLION)
TABLE 633 TURKEY BANKING AND CAPITAL MARKETS IN MAINFRAME MARKET, BY COMPONENT, 2018-2032 (USD MILLION)
TABLE 634 TURKEY INSURANCE IN MAINFRAME MARKET, BY COMPONENT, 2018-2032 (USD MILLION)
TABLE 635 TURKEY PAYMENTS IN MAINFRAME MARKET, BY COMPONENT, 2018-2032 (USD MILLION)
TABLE 636 TURKEY FINANCIAL SERVICES IN MAINFRAME MARKET, BY COMPONENT, 2018-2032 (USD MILLION)
TABLE 637 TURKEY IT & TELECOMMUNICATIONS IN MAINFRAME MARKET, BY COMPONENT, 2018-2032 (USD MILLION)
TABLE 638 TURKEY HEALTHCARE IN MAINFRAME MARKET, BY COMPONENT, 2018-2032 (USD MILLION)
TABLE 639 TURKEY PUBLIC SECTOR IN MAINFRAME MARKET, BY COMPONENT, 2018-2032 (USD MILLION)
TABLE 640 TURKEY AUTOMOTIVE AND MANUFACTURING IN MAINFRAME MARKET, BY COMPONENT, 2018-2032 (USD MILLION)
TABLE 641 TURKEY RETAIL AND CONSUMER PACKAGED GOODS (CPG) IN MAINFRAME MARKET, BY COMPONENT, 2018-2032 (USD MILLION)
TABLE 642 TURKEY TRAVEL, MEDIA, AND ENTERTAINMENT IN MAINFRAME MARKET, BY COMPONENT, 2018-2032 (USD MILLION)
TABLE 643 TURKEY OTHERS IN MAINFRAME MARKET, BY COMPONENT, 2018-2032 (USD MILLION)
TABLE 644 BELGIUM MAINFRAME MARKET, BY SYSTEMS, 2018-2032 (USD MILLION)
TABLE 645 BELGIUM MAINFRAMES IN MAINFRAME MARKET, BY TYPE, 2018-2032 (USD MILLION)
TABLE 646 BELGIUM IBM Z SYSTEMS IN MAINFRAME MARKET, BY TYPE, 2018-2032 (USD MILLION)
TABLE 647 BELGIUM FUJITSU GS SERIES IN MAINFRAME MARKET, BY TYPE, 2018-2032 (USD MILLION)
TABLE 648 BELGIUM OTHER MAINFRAMES IN MAINFRAME MARKET, BY TYPE, 2018-2032 (USD MILLION)
TABLE 649 BELGIUM MIDRANGE SYSTEMS IN MAINFRAME MARKET, BY TYPE, 2018-2032 (USD MILLION)
TABLE 650 BELGIUM IBM POWER SYSTEMS (AIX, AS/400) IN MAINFRAME MARKET, BY TYPE, 2018-2032 (USD MILLION)
TABLE 651 BELGIUM HPE SERVERS IN MAINFRAME MARKET, BY TYPE, 2018-2032 (USD MILLION)
TABLE 652 BELGIUM ORACLE SUN SERVERS (SOLARIS) IN MAINFRAME MARKET, BY TYPE, 2018-2032 (USD MILLION)
TABLE 653 BELGIUM MAINFRAME MARKET, BY COMPONENT, 2018-2032 (USD MILLION)
TABLE 654 BELGIUM HARDWARE IN MAINFRAME MARKET, BY CATEGORY, 2018-2032 (USD MILLION)
TABLE 655 BELGIUM SERVICES IN MAINFRAME MARKET, BY CATEGORY, 2018-2032 (USD MILLION)
TABLE 656 BELGIUM SOFTWARE IN MAINFRAME MARKET, BY CATEGORY, 2018-2032 (USD MILLION)
TABLE 657 BELGIUM MAINFRAME MARKET, BY ORGANIZATION SIZE, 2018-2032 (USD MILLION)
TABLE 658 BELGIUM MAINFRAME MARKET, BY END USE, 2018-2032 (USD MILLION)
TABLE 659 BELGIUM FINANCIAL SERVICES IN MAINFRAME MARKET, BY TYPE, 2018-2032 (USD MILLION)
TABLE 660 BELGIUM BANKING AND CAPITAL MARKETS IN MAINFRAME MARKET, BY COMPONENT, 2018-2032 (USD MILLION)
TABLE 661 BELGIUM INSURANCE IN MAINFRAME MARKET, BY COMPONENT, 2018-2032 (USD MILLION)
TABLE 662 BELGIUM PAYMENTS IN MAINFRAME MARKET, BY COMPONENT, 2018-2032 (USD MILLION)
TABLE 663 BELGIUM FINANCIAL SERVICES IN MAINFRAME MARKET, BY COMPONENT, 2018-2032 (USD MILLION)
TABLE 664 BELGIUM IT & TELECOMMUNICATIONS IN MAINFRAME MARKET, BY COMPONENT, 2018-2032 (USD MILLION)
TABLE 665 BELGIUM HEALTHCARE IN MAINFRAME MARKET, BY COMPONENT, 2018-2032 (USD MILLION)
TABLE 666 BELGIUM PUBLIC SECTOR IN MAINFRAME MARKET, BY COMPONENT, 2018-2032 (USD MILLION)
TABLE 667 BELGIUM AUTOMOTIVE AND MANUFACTURING IN MAINFRAME MARKET, BY COMPONENT, 2018-2032 (USD MILLION)
TABLE 668 BELGIUM RETAIL AND CONSUMER PACKAGED GOODS (CPG) IN MAINFRAME MARKET, BY COMPONENT, 2018-2032 (USD MILLION)
TABLE 669 BELGIUM TRAVEL, MEDIA, AND ENTERTAINMENT IN MAINFRAME MARKET, BY COMPONENT, 2018-2032 (USD MILLION)
TABLE 670 BELGIUM OTHERS IN MAINFRAME MARKET, BY COMPONENT, 2018-2032 (USD MILLION)
TABLE 671 REST OF EUROPE MAINFRAME MARKET, BY SYSTEMS, 2018-2032 (USD MILLION)
TABLE 672 ASIA-PACIFIC MAINFRAME MARKET, BY COUNTRY, 2018-2032 (USD MILLION)
TABLE 673 ASIA-PACIFIC MAINFRAME MARKET, BY SYSTEMS, 2018-2032 (USD MILLION)
TABLE 674 ASIA-PACIFIC MAINFRAMES IN MAINFRAME MARKET, BY TYPE, 2018-2032 (USD MILLION)
TABLE 675 ASIA-PACIFIC IBM Z SYSTEMS IN MAINFRAME MARKET, BY TYPE, 2018-2032 (USD MILLION)
TABLE 676 ASIA-PACIFIC FUJITSU GS SERIES IN MAINFRAME MARKET, BY TYPE, 2018-2032 (USD MILLION)
TABLE 677 ASIA-PACIFIC OTHER MAINFRAMES IN MAINFRAME MARKET, BY TYPE, 2018-2032 (USD MILLION)
TABLE 678 ASIA-PACIFIC MIDRANGE SYSTEMS IN MAINFRAME MARKET, BY TYPE, 2018-2032 (USD MILLION)
TABLE 679 ASIA-PACIFIC IBM POWER SYSTEMS (AIX, AS/400) IN MAINFRAME MARKET, BY TYPE, 2018-2032 (USD MILLION)
TABLE 680 ASIA-PACIFIC HPE SERVERS IN MAINFRAME MARKET, BY TYPE, 2018-2032 (USD MILLION)
TABLE 681 ASIA-PACIFIC ORACLE SUN SERVERS (SOLARIS) IN MAINFRAME MARKET, BY TYPE, 2018-2032 (USD MILLION)
TABLE 682 ASIA-PACIFIC MAINFRAME MARKET, BY COMPONENT, 2018-2032 (USD MILLION)
TABLE 683 ASIA-PACIFIC HARDWARE IN MAINFRAME MARKET, BY CATEGORY, 2018-2032 (USD MILLION)
TABLE 684 ASIA-PACIFIC SERVICES IN MAINFRAME MARKET, BY CATEGORY, 2018-2032 (USD MILLION)
TABLE 685 ASIA-PACIFIC SOFTWARE IN MAINFRAME MARKET, BY CATEGORY, 2018-2032 (USD MILLION)
TABLE 686 ASIA-PACIFIC MAINFRAME MARKET, BY ORGANIZATION SIZE, 2018-2032 (USD MILLION)
TABLE 687 ASIA-PACIFIC MAINFRAME MARKET, BY END USE, 2018-2032 (USD MILLION)
TABLE 688 ASIA-PACIFIC FINANCIAL SERVICES IN MAINFRAME MARKET, BY TYPE, 2018-2032 (USD MILLION)
TABLE 689 ASIA-PACIFIC BANKING AND CAPITAL MARKETS IN MAINFRAME MARKET, BY COMPONENT, 2018-2032 (USD MILLION)
TABLE 690 ASIA-PACIFIC INSURANCE IN MAINFRAME MARKET, BY COMPONENT, 2018-2032 (USD MILLION)
TABLE 691 ASIA-PACIFIC PAYMENTS IN MAINFRAME MARKET, BY COMPONENT, 2018-2032 (USD MILLION)
TABLE 692 ASIA-PACIFIC FINANCIAL SERVICES IN MAINFRAME MARKET, BY COMPONENT, 2018-2032 (USD MILLION)
TABLE 693 ASIA-PACIFIC IT & TELECOMMUNICATIONS IN MAINFRAME MARKET, BY COMPONENT, 2018-2032 (USD MILLION)
TABLE 694 ASIA-PACIFIC HEALTHCARE IN MAINFRAME MARKET, BY COMPONENT, 2018-2032 (USD MILLION)
TABLE 695 ASIA-PACIFIC PUBLIC SECTOR IN MAINFRAME MARKET, BY COMPONENT, 2018-2032 (USD MILLION)
TABLE 696 ASIA-PACIFIC AUTOMOTIVE AND MANUFACTURING IN MAINFRAME MARKET, BY COMPONENT, 2018-2032 (USD MILLION)
TABLE 697 ASIA-PACIFIC RETAIL AND CONSUMER PACKAGED GOODS (CPG) IN MAINFRAME MARKET, BY COMPONENT, 2018-2032 (USD MILLION)
TABLE 698 ASIA-PACIFIC TRAVEL, MEDIA, AND ENTERTAINMENT IN MAINFRAME MARKET, BY COMPONENT, 2018-2032 (USD MILLION)
TABLE 699 ASIA-PACIFIC OTHERS IN MAINFRAME MARKET, BY COMPONENT, 2018-2032 (USD MILLION)
TABLE 700 CHINA MAINFRAME MARKET, BY SYSTEMS, 2018-2032 (USD MILLION)
TABLE 701 CHINA MAINFRAMES IN MAINFRAME MARKET, BY TYPE, 2018-2032 (USD MILLION)
TABLE 702 CHINA IBM Z SYSTEMS IN MAINFRAME MARKET, BY TYPE, 2018-2032 (USD MILLION)
TABLE 703 CHINA FUJITSU GS SERIES IN MAINFRAME MARKET, BY TYPE, 2018-2032 (USD MILLION)
TABLE 704 CHINA OTHER MAINFRAMES IN MAINFRAME MARKET, BY TYPE, 2018-2032 (USD MILLION)
TABLE 705 CHINA MIDRANGE SYSTEMS IN MAINFRAME MARKET, BY TYPE, 2018-2032 (USD MILLION)
TABLE 706 CHINA IBM POWER SYSTEMS (AIX, AS/400) IN MAINFRAME MARKET, BY TYPE, 2018-2032 (USD MILLION)
TABLE 707 CHINA HPE SERVERS IN MAINFRAME MARKET, BY TYPE, 2018-2032 (USD MILLION)
TABLE 708 CHINA ORACLE SUN SERVERS (SOLARIS) IN MAINFRAME MARKET, BY TYPE, 2018-2032 (USD MILLION)
TABLE 709 CHINA MAINFRAME MARKET, BY COMPONENT, 2018-2032 (USD MILLION)
TABLE 710 CHINA HARDWARE IN MAINFRAME MARKET, BY CATEGORY, 2018-2032 (USD MILLION)
TABLE 711 CHINA SERVICES IN MAINFRAME MARKET, BY CATEGORY, 2018-2032 (USD MILLION)
TABLE 712 CHINA SOFTWARE IN MAINFRAME MARKET, BY CATEGORY, 2018-2032 (USD MILLION)
TABLE 713 CHINA MAINFRAME MARKET, BY ORGANIZATION SIZE, 2018-2032 (USD MILLION)
TABLE 714 CHINA MAINFRAME MARKET, BY END USE, 2018-2032 (USD MILLION)
TABLE 715 CHINA FINANCIAL SERVICES IN MAINFRAME MARKET, BY TYPE, 2018-2032 (USD MILLION)
TABLE 716 CHINA BANKING AND CAPITAL MARKETS IN MAINFRAME MARKET, BY COMPONENT, 2018-2032 (USD MILLION)
TABLE 717 CHINA INSURANCE IN MAINFRAME MARKET, BY COMPONENT, 2018-2032 (USD MILLION)
TABLE 718 CHINA PAYMENTS IN MAINFRAME MARKET, BY COMPONENT, 2018-2032 (USD MILLION)
TABLE 719 CHINA FINANCIAL SERVICES IN MAINFRAME MARKET, BY COMPONENT, 2018-2032 (USD MILLION)
TABLE 720 CHINA IT & TELECOMMUNICATIONS IN MAINFRAME MARKET, BY COMPONENT, 2018-2032 (USD MILLION)
TABLE 721 CHINA HEALTHCARE IN MAINFRAME MARKET, BY COMPONENT, 2018-2032 (USD MILLION)
TABLE 722 CHINA PUBLIC SECTOR IN MAINFRAME MARKET, BY COMPONENT, 2018-2032 (USD MILLION)
TABLE 723 CHINA AUTOMOTIVE AND MANUFACTURING IN MAINFRAME MARKET, BY COMPONENT, 2018-2032 (USD MILLION)
TABLE 724 CHINA RETAIL AND CONSUMER PACKAGED GOODS (CPG) IN MAINFRAME MARKET, BY COMPONENT, 2018-2032 (USD MILLION)
TABLE 725 CHINA TRAVEL, MEDIA, AND ENTERTAINMENT IN MAINFRAME MARKET, BY COMPONENT, 2018-2032 (USD MILLION)
TABLE 726 CHINA OTHERS IN MAINFRAME MARKET, BY COMPONENT, 2018-2032 (USD MILLION)
TABLE 727 JAPAN MAINFRAME MARKET, BY SYSTEMS, 2018-2032 (USD MILLION)
TABLE 728 JAPAN MAINFRAMES IN MAINFRAME MARKET, BY TYPE, 2018-2032 (USD MILLION)
TABLE 729 JAPAN IBM Z SYSTEMS IN MAINFRAME MARKET, BY TYPE, 2018-2032 (USD MILLION)
TABLE 730 JAPAN FUJITSU GS SERIES IN MAINFRAME MARKET, BY TYPE, 2018-2032 (USD MILLION)
TABLE 731 JAPAN OTHER MAINFRAMES IN MAINFRAME MARKET, BY TYPE, 2018-2032 (USD MILLION)
TABLE 732 JAPAN MIDRANGE SYSTEMS IN MAINFRAME MARKET, BY TYPE, 2018-2032 (USD MILLION)
TABLE 733 JAPAN IBM POWER SYSTEMS (AIX, AS/400) IN MAINFRAME MARKET, BY TYPE, 2018-2032 (USD MILLION)
TABLE 734 JAPAN HPE SERVERS IN MAINFRAME MARKET, BY TYPE, 2018-2032 (USD MILLION)
TABLE 735 JAPAN ORACLE SUN SERVERS (SOLARIS) IN MAINFRAME MARKET, BY TYPE, 2018-2032 (USD MILLION)
TABLE 736 JAPAN MAINFRAME MARKET, BY COMPONENT, 2018-2032 (USD MILLION)
TABLE 737 JAPAN HARDWARE IN MAINFRAME MARKET, BY CATEGORY, 2018-2032 (USD MILLION)
TABLE 738 JAPAN SERVICES IN MAINFRAME MARKET, BY CATEGORY, 2018-2032 (USD MILLION)
TABLE 739 JAPAN SOFTWARE IN MAINFRAME MARKET, BY CATEGORY, 2018-2032 (USD MILLION)
TABLE 740 JAPAN MAINFRAME MARKET, BY ORGANIZATION SIZE, 2018-2032 (USD MILLION)
TABLE 741 JAPAN MAINFRAME MARKET, BY END USE, 2018-2032 (USD MILLION)
TABLE 742 JAPAN FINANCIAL SERVICES IN MAINFRAME MARKET, BY TYPE, 2018-2032 (USD MILLION)
TABLE 743 JAPAN BANKING AND CAPITAL MARKETS IN MAINFRAME MARKET, BY COMPONENT, 2018-2032 (USD MILLION)
TABLE 744 JAPAN INSURANCE IN MAINFRAME MARKET, BY COMPONENT, 2018-2032 (USD MILLION)
TABLE 745 JAPAN PAYMENTS IN MAINFRAME MARKET, BY COMPONENT, 2018-2032 (USD MILLION)
TABLE 746 JAPAN FINANCIAL SERVICES IN MAINFRAME MARKET, BY COMPONENT, 2018-2032 (USD MILLION)
TABLE 747 JAPAN IT & TELECOMMUNICATIONS IN MAINFRAME MARKET, BY COMPONENT, 2018-2032 (USD MILLION)
TABLE 748 JAPAN HEALTHCARE IN MAINFRAME MARKET, BY COMPONENT, 2018-2032 (USD MILLION)
TABLE 749 JAPAN PUBLIC SECTOR IN MAINFRAME MARKET, BY COMPONENT, 2018-2032 (USD MILLION)
TABLE 750 JAPAN AUTOMOTIVE AND MANUFACTURING IN MAINFRAME MARKET, BY COMPONENT, 2018-2032 (USD MILLION)
TABLE 751 JAPAN RETAIL AND CONSUMER PACKAGED GOODS (CPG) IN MAINFRAME MARKET, BY COMPONENT, 2018-2032 (USD MILLION)
TABLE 752 JAPAN TRAVEL, MEDIA, AND ENTERTAINMENT IN MAINFRAME MARKET, BY COMPONENT, 2018-2032 (USD MILLION)
TABLE 753 JAPAN OTHERS IN MAINFRAME MARKET, BY COMPONENT, 2018-2032 (USD MILLION)
TABLE 754 INDIA MAINFRAME MARKET, BY SYSTEMS, 2018-2032 (USD MILLION)
TABLE 755 INDIA MAINFRAMES IN MAINFRAME MARKET, BY TYPE, 2018-2032 (USD MILLION)
TABLE 756 INDIA IBM Z SYSTEMS IN MAINFRAME MARKET, BY TYPE, 2018-2032 (USD MILLION)
TABLE 757 INDIA FUJITSU GS SERIES IN MAINFRAME MARKET, BY TYPE, 2018-2032 (USD MILLION)
TABLE 758 INDIA OTHER MAINFRAMES IN MAINFRAME MARKET, BY TYPE, 2018-2032 (USD MILLION)
TABLE 759 INDIA MIDRANGE SYSTEMS IN MAINFRAME MARKET, BY TYPE, 2018-2032 (USD MILLION)
TABLE 760 INDIA IBM POWER SYSTEMS (AIX, AS/400) IN MAINFRAME MARKET, BY TYPE, 2018-2032 (USD MILLION)
TABLE 761 INDIA HPE SERVERS IN MAINFRAME MARKET, BY TYPE, 2018-2032 (USD MILLION)
TABLE 762 INDIA ORACLE SUN SERVERS (SOLARIS) IN MAINFRAME MARKET, BY TYPE, 2018-2032 (USD MILLION)
TABLE 763 INDIA MAINFRAME MARKET, BY COMPONENT, 2018-2032 (USD MILLION)
TABLE 764 INDIA HARDWARE IN MAINFRAME MARKET, BY CATEGORY, 2018-2032 (USD MILLION)
TABLE 765 INDIA SERVICES IN MAINFRAME MARKET, BY CATEGORY, 2018-2032 (USD MILLION)
TABLE 766 INDIA SOFTWARE IN MAINFRAME MARKET, BY CATEGORY, 2018-2032 (USD MILLION)
TABLE 767 INDIA MAINFRAME MARKET, BY ORGANIZATION SIZE, 2018-2032 (USD MILLION)
TABLE 768 INDIA MAINFRAME MARKET, BY END USE, 2018-2032 (USD MILLION)
TABLE 769 INDIA FINANCIAL SERVICES IN MAINFRAME MARKET, BY TYPE, 2018-2032 (USD MILLION)
TABLE 770 INDIA BANKING AND CAPITAL MARKETS IN MAINFRAME MARKET, BY COMPONENT, 2018-2032 (USD MILLION)
TABLE 771 INDIA INSURANCE IN MAINFRAME MARKET, BY COMPONENT, 2018-2032 (USD MILLION)
TABLE 772 INDIA PAYMENTS IN MAINFRAME MARKET, BY COMPONENT, 2018-2032 (USD MILLION)
TABLE 773 INDIA FINANCIAL SERVICES IN MAINFRAME MARKET, BY COMPONENT, 2018-2032 (USD MILLION)
TABLE 774 INDIA IT & TELECOMMUNICATIONS IN MAINFRAME MARKET, BY COMPONENT, 2018-2032 (USD MILLION)
TABLE 775 INDIA HEALTHCARE IN MAINFRAME MARKET, BY COMPONENT, 2018-2032 (USD MILLION)
TABLE 776 INDIA PUBLIC SECTOR IN MAINFRAME MARKET, BY COMPONENT, 2018-2032 (USD MILLION)
TABLE 777 INDIA AUTOMOTIVE AND MANUFACTURING IN MAINFRAME MARKET, BY COMPONENT, 2018-2032 (USD MILLION)
TABLE 778 INDIA RETAIL AND CONSUMER PACKAGED GOODS (CPG) IN MAINFRAME MARKET, BY COMPONENT, 2018-2032 (USD MILLION)
TABLE 779 INDIA TRAVEL, MEDIA, AND ENTERTAINMENT IN MAINFRAME MARKET, BY COMPONENT, 2018-2032 (USD MILLION)
TABLE 780 INDIA OTHERS IN MAINFRAME MARKET, BY COMPONENT, 2018-2032 (USD MILLION)
TABLE 781 SOUTH KOREA MAINFRAME MARKET, BY SYSTEMS, 2018-2032 (USD MILLION)
TABLE 782 SOUTH KOREA MAINFRAMES IN MAINFRAME MARKET, BY TYPE, 2018-2032 (USD MILLION)
TABLE 783 SOUTH KOREA IBM Z SYSTEMS IN MAINFRAME MARKET, BY TYPE, 2018-2032 (USD MILLION)
TABLE 784 SOUTH KOREA FUJITSU GS SERIES IN MAINFRAME MARKET, BY TYPE, 2018-2032 (USD MILLION)
TABLE 785 SOUTH KOREA OTHER MAINFRAMES IN MAINFRAME MARKET, BY TYPE, 2018-2032 (USD MILLION)
TABLE 786 SOUTH KOREA MIDRANGE SYSTEMS IN MAINFRAME MARKET, BY TYPE, 2018-2032 (USD MILLION)
TABLE 787 SOUTH KOREA IBM POWER SYSTEMS (AIX, AS/400) IN MAINFRAME MARKET, BY TYPE, 2018-2032 (USD MILLION)
TABLE 788 SOUTH KOREA HPE SERVERS IN MAINFRAME MARKET, BY TYPE, 2018-2032 (USD MILLION)
TABLE 789 SOUTH KOREA ORACLE SUN SERVERS (SOLARIS) IN MAINFRAME MARKET, BY TYPE, 2018-2032 (USD MILLION)
TABLE 790 SOUTH KOREA MAINFRAME MARKET, BY COMPONENT, 2018-2032 (USD MILLION)
TABLE 791 SOUTH KOREA HARDWARE IN MAINFRAME MARKET, BY CATEGORY, 2018-2032 (USD MILLION)
TABLE 792 SOUTH KOREA SERVICES IN MAINFRAME MARKET, BY CATEGORY, 2018-2032 (USD MILLION)
TABLE 793 SOUTH KOREA SOFTWARE IN MAINFRAME MARKET, BY CATEGORY, 2018-2032 (USD MILLION)
TABLE 794 SOUTH KOREA MAINFRAME MARKET, BY ORGANIZATION SIZE, 2018-2032 (USD MILLION)
TABLE 795 SOUTH KOREA MAINFRAME MARKET, BY END USE, 2018-2032 (USD MILLION)
TABLE 796 SOUTH KOREA FINANCIAL SERVICES IN MAINFRAME MARKET, BY TYPE, 2018-2032 (USD MILLION)
TABLE 797 SOUTH KOREA BANKING AND CAPITAL MARKETS IN MAINFRAME MARKET, BY COMPONENT, 2018-2032 (USD MILLION)
TABLE 798 SOUTH KOREA INSURANCE IN MAINFRAME MARKET, BY COMPONENT, 2018-2032 (USD MILLION)
TABLE 799 SOUTH KOREA PAYMENTS IN MAINFRAME MARKET, BY COMPONENT, 2018-2032 (USD MILLION)
TABLE 800 SOUTH KOREA FINANCIAL SERVICES IN MAINFRAME MARKET, BY COMPONENT, 2018-2032 (USD MILLION)
TABLE 801 SOUTH KOREA IT & TELECOMMUNICATIONS IN MAINFRAME MARKET, BY COMPONENT, 2018-2032 (USD MILLION)
TABLE 802 SOUTH KOREA HEALTHCARE IN MAINFRAME MARKET, BY COMPONENT, 2018-2032 (USD MILLION)
TABLE 803 SOUTH KOREA PUBLIC SECTOR IN MAINFRAME MARKET, BY COMPONENT, 2018-2032 (USD MILLION)
TABLE 804 SOUTH KOREA AUTOMOTIVE AND MANUFACTURING IN MAINFRAME MARKET, BY COMPONENT, 2018-2032 (USD MILLION)
TABLE 805 SOUTH KOREA RETAIL AND CONSUMER PACKAGED GOODS (CPG) IN MAINFRAME MARKET, BY COMPONENT, 2018-2032 (USD MILLION)
TABLE 806 SOUTH KOREA TRAVEL, MEDIA, AND ENTERTAINMENT IN MAINFRAME MARKET, BY COMPONENT, 2018-2032 (USD MILLION)
TABLE 807 SOUTH KOREA OTHERS IN MAINFRAME MARKET, BY COMPONENT, 2018-2032 (USD MILLION)
TABLE 808 AUSTRALIA MAINFRAME MARKET, BY SYSTEMS, 2018-2032 (USD MILLION)
TABLE 809 AUSTRALIA MAINFRAMES IN MAINFRAME MARKET, BY TYPE, 2018-2032 (USD MILLION)
TABLE 810 AUSTRALIA IBM Z SYSTEMS IN MAINFRAME MARKET, BY TYPE, 2018-2032 (USD MILLION)
TABLE 811 AUSTRALIA FUJITSU GS SERIES IN MAINFRAME MARKET, BY TYPE, 2018-2032 (USD MILLION)
TABLE 812 AUSTRALIA OTHER MAINFRAMES IN MAINFRAME MARKET, BY TYPE, 2018-2032 (USD MILLION)
TABLE 813 AUSTRALIA MIDRANGE SYSTEMS IN MAINFRAME MARKET, BY TYPE, 2018-2032 (USD MILLION)
TABLE 814 AUSTRALIA IBM POWER SYSTEMS (AIX, AS/400) IN MAINFRAME MARKET, BY TYPE, 2018-2032 (USD MILLION)
TABLE 815 AUSTRALIA HPE SERVERS IN MAINFRAME MARKET, BY TYPE, 2018-2032 (USD MILLION)
TABLE 816 AUSTRALIA ORACLE SUN SERVERS (SOLARIS) IN MAINFRAME MARKET, BY TYPE, 2018-2032 (USD MILLION)
TABLE 817 AUSTRALIA MAINFRAME MARKET, BY COMPONENT, 2018-2032 (USD MILLION)
TABLE 818 AUSTRALIA HARDWARE IN MAINFRAME MARKET, BY CATEGORY, 2018-2032 (USD MILLION)
TABLE 819 SINGAPORE MAINFRAME MARKET, BY SYSTEMS, 2018-2032 (USD MILLION)
TABLE 820 SINGAPORE MAINFRAMES IN MAINFRAME MARKET, BY TYPE, 2018-2032 (USD MILLION)
TABLE 821 SINGAPORE IBM Z SYSTEMS IN MAINFRAME MARKET, BY TYPE, 2018-2032 (USD MILLION)
TABLE 822 SINGAPORE FUJITSU GS SERIES IN MAINFRAME MARKET, BY TYPE, 2018-2032 (USD MILLION)
TABLE 823 SINGAPORE OTHER MAINFRAMES IN MAINFRAME MARKET, BY TYPE, 2018-2032 (USD MILLION)
TABLE 824 SINGAPORE MIDRANGE SYSTEMS IN MAINFRAME MARKET, BY TYPE, 2018-2032 (USD MILLION)
TABLE 825 SINGAPORE HPE SERVERS IN MAINFRAME MARKET, BY TYPE, 2018-2032 (USD MILLION)
TABLE 826 SINGAPORE ORACLE SUN SERVERS (SOLARIS) IN MAINFRAME MARKET, BY TYPE, 2018-2032 (USD MILLION)
TABLE 827 SINGAPORE MAINFRAME MARKET, BY COMPONENT, 2018-2032 (USD MILLION)
TABLE 828 SINGAPORE HARDWARE IN MAINFRAME MARKET, BY CATEGORY, 2018-2032 (USD MILLION)
TABLE 829 SINGAPORE SERVICES IN MAINFRAME MARKET, BY CATEGORY, 2018-2032 (USD MILLION)
TABLE 830 SINGAPORE SOFTWARE IN MAINFRAME MARKET, BY CATEGORY, 2018-2032 (USD MILLION)
TABLE 831 SINGAPORE MAINFRAME MARKET, BY ORGANIZATION SIZE, 2018-2032 (USD MILLION)
TABLE 832 SINGAPORE MAINFRAME MARKET, BY END USE, 2018-2032 (USD MILLION)
TABLE 833 SINGAPORE FINANCIAL SERVICES IN MAINFRAME MARKET, BY TYPE, 2018-2032 (USD MILLION)
TABLE 834 SINGAPORE BANKING AND CAPITAL MARKETS IN MAINFRAME MARKET, BY COMPONENT, 2018-2032 (USD MILLION)
TABLE 835 SINGAPORE INSURANCE IN MAINFRAME MARKET, BY COMPONENT, 2018-2032 (USD MILLION)
TABLE 836 SINGAPORE PAYMENTS IN MAINFRAME MARKET, BY COMPONENT, 2018-2032 (USD MILLION)
TABLE 837 SINGAPORE FINANCIAL SERVICES IN MAINFRAME MARKET, BY COMPONENT, 2018-2032 (USD MILLION)
TABLE 838 SINGAPORE IT & TELECOMMUNICATIONS IN MAINFRAME MARKET, BY COMPONENT, 2018-2032 (USD MILLION)
TABLE 839 SINGAPORE HEALTHCARE IN MAINFRAME MARKET, BY COMPONENT, 2018-2032 (USD MILLION)
TABLE 840 SINGAPORE PUBLIC SECTOR IN MAINFRAME MARKET, BY COMPONENT, 2018-2032 (USD MILLION)
TABLE 841 SINGAPORE AUTOMOTIVE AND MANUFACTURING IN MAINFRAME MARKET, BY COMPONENT, 2018-2032 (USD MILLION)
TABLE 842 SINGAPORE RETAIL AND CONSUMER PACKAGED GOODS (CPG) IN MAINFRAME MARKET, BY COMPONENT, 2018-2032 (USD MILLION)
TABLE 843 SINGAPORE TRAVEL, MEDIA, AND ENTERTAINMENT IN MAINFRAME MARKET, BY COMPONENT, 2018-2032 (USD MILLION)
TABLE 844 SINGAPORE OTHERS IN MAINFRAME MARKET, BY COMPONENT, 2018-2032 (USD MILLION)
TABLE 845 MALAYSIA MAINFRAME MARKET, BY SYSTEMS, 2018-2032 (USD MILLION)
TABLE 846 MALAYSIA MAINFRAMES IN MAINFRAME MARKET, BY TYPE, 2018-2032 (USD MILLION)
TABLE 847 MALAYSIA IBM Z SYSTEMS IN MAINFRAME MARKET, BY TYPE, 2018-2032 (USD MILLION)
TABLE 848 MALAYSIA FUJITSU GS SERIES IN MAINFRAME MARKET, BY TYPE, 2018-2032 (USD MILLION)
TABLE 849 MALAYSIA OTHER MAINFRAMES IN MAINFRAME MARKET, BY TYPE, 2018-2032 (USD MILLION)
TABLE 850 MALAYSIA MIDRANGE SYSTEMS IN MAINFRAME MARKET, BY TYPE, 2018-2032 (USD MILLION)
TABLE 851 MALAYSIA IBM POWER SYSTEMS (AIX, AS/400) IN MAINFRAME MARKET, BY TYPE, 2018-2032 (USD MILLION)
TABLE 852 MALAYSIA HPE SERVERS IN MAINFRAME MARKET, BY TYPE, 2018-2032 (USD MILLION)
TABLE 853 MALAYSIA ORACLE SUN SERVERS (SOLARIS) IN MAINFRAME MARKET, BY TYPE, 2018-2032 (USD MILLION)
TABLE 854 MALAYSIA MAINFRAME MARKET, BY COMPONENT, 2018-2032 (USD MILLION)
TABLE 855 MALAYSIA HARDWARE IN MAINFRAME MARKET, BY CATEGORY, 2018-2032 (USD MILLION)
TABLE 856 MALAYSIA SERVICES IN MAINFRAME MARKET, BY CATEGORY, 2018-2032 (USD MILLION)
TABLE 857 MALAYSIA SOFTWARE IN MAINFRAME MARKET, BY CATEGORY, 2018-2032 (USD MILLION)
TABLE 858 MALAYSIA MAINFRAME MARKET, BY ORGANIZATION SIZE, 2018-2032 (USD MILLION)
TABLE 859 MALAYSIA MAINFRAME MARKET, BY END USE, 2018-2032 (USD MILLION)
TABLE 860 MALAYSIA FINANCIAL SERVICES IN MAINFRAME MARKET, BY TYPE, 2018-2032 (USD MILLION)
TABLE 861 MALAYSIA BANKING AND CAPITAL MARKETS IN MAINFRAME MARKET, BY COMPONENT, 2018-2032 (USD MILLION)
TABLE 862 MALAYSIA INSURANCE IN MAINFRAME MARKET, BY COMPONENT, 2018-2032 (USD MILLION)
TABLE 863 MALAYSIA PAYMENTS IN MAINFRAME MARKET, BY COMPONENT, 2018-2032 (USD MILLION)
TABLE 864 MALAYSIA FINANCIAL SERVICES IN MAINFRAME MARKET, BY COMPONENT, 2018-2032 (USD MILLION)
TABLE 865 MALAYSIA IT & TELECOMMUNICATIONS IN MAINFRAME MARKET, BY COMPONENT, 2018-2032 (USD MILLION)
TABLE 866 MALAYSIA HEALTHCARE IN MAINFRAME MARKET, BY COMPONENT, 2018-2032 (USD MILLION)
TABLE 867 MALAYSIA PUBLIC SECTOR IN MAINFRAME MARKET, BY COMPONENT, 2018-2032 (USD MILLION)
TABLE 868 MALAYSIA AUTOMOTIVE AND MANUFACTURING IN MAINFRAME MARKET, BY COMPONENT, 2018-2032 (USD MILLION)
TABLE 869 MALAYSIA RETAIL AND CONSUMER PACKAGED GOODS (CPG) IN MAINFRAME MARKET, BY COMPONENT, 2018-2032 (USD MILLION)
TABLE 870 MALAYSIA TRAVEL, MEDIA, AND ENTERTAINMENT IN MAINFRAME MARKET, BY COMPONENT, 2018-2032 (USD MILLION)
TABLE 871 MALAYSIA OTHERS IN MAINFRAME MARKET, BY COMPONENT, 2018-2032 (USD MILLION)
TABLE 872 THAILAND MAINFRAME MARKET, BY SYSTEMS, 2018-2032 (USD MILLION)
TABLE 873 THAILAND MAINFRAMES IN MAINFRAME MARKET, BY TYPE, 2018-2032 (USD MILLION)
TABLE 874 THAILAND IBM Z SYSTEMS IN MAINFRAME MARKET, BY TYPE, 2018-2032 (USD MILLION)
TABLE 875 THAILAND FUJITSU GS SERIES IN MAINFRAME MARKET, BY TYPE, 2018-2032 (USD MILLION)
TABLE 876 THAILAND OTHER MAINFRAMES IN MAINFRAME MARKET, BY TYPE, 2018-2032 (USD MILLION)
TABLE 877 THAILAND MIDRANGE SYSTEMS IN MAINFRAME MARKET, BY TYPE, 2018-2032 (USD MILLION)
TABLE 878 THAILAND IBM POWER SYSTEMS (AIX, AS/400) IN MAINFRAME MARKET, BY TYPE, 2018-2032 (USD MILLION)
TABLE 879 THAILAND HPE SERVERS IN MAINFRAME MARKET, BY TYPE, 2018-2032 (USD MILLION)
TABLE 880 THAILAND ORACLE SUN SERVERS (SOLARIS) IN MAINFRAME MARKET, BY TYPE, 2018-2032 (USD MILLION)
TABLE 881 THAILAND MAINFRAME MARKET, BY COMPONENT, 2018-2032 (USD MILLION)
TABLE 882 THAILAND HARDWARE IN MAINFRAME MARKET, BY CATEGORY, 2018-2032 (USD MILLION)
TABLE 883 THAILAND SERVICES IN MAINFRAME MARKET, BY CATEGORY, 2018-2032 (USD MILLION)
TABLE 884 THAILAND SOFTWARE IN MAINFRAME MARKET, BY CATEGORY, 2018-2032 (USD MILLION)
TABLE 885 THAILAND MAINFRAME MARKET, BY ORGANIZATION SIZE, 2018-2032 (USD MILLION)
TABLE 886 THAILAND MAINFRAME MARKET, BY END USE, 2018-2032 (USD MILLION)
TABLE 887 THAILAND FINANCIAL SERVICES IN MAINFRAME MARKET, BY TYPE, 2018-2032 (USD MILLION)
TABLE 888 THAILAND BANKING AND CAPITAL MARKETS IN MAINFRAME MARKET, BY COMPONENT, 2018-2032 (USD MILLION)
TABLE 889 THAILAND INSURANCE IN MAINFRAME MARKET, BY COMPONENT, 2018-2032 (USD MILLION)
TABLE 890 THAILAND PAYMENTS IN MAINFRAME MARKET, BY COMPONENT, 2018-2032 (USD MILLION)
TABLE 891 THAILAND FINANCIAL SERVICES IN MAINFRAME MARKET, BY COMPONENT, 2018-2032 (USD MILLION)
TABLE 892 THAILAND IT & TELECOMMUNICATIONS IN MAINFRAME MARKET, BY COMPONENT, 2018-2032 (USD MILLION)
TABLE 893 THAILAND HEALTHCARE IN MAINFRAME MARKET, BY COMPONENT, 2018-2032 (USD MILLION)
TABLE 894 THAILAND PUBLIC SECTOR IN MAINFRAME MARKET, BY COMPONENT, 2018-2032 (USD MILLION)
TABLE 895 THAILAND AUTOMOTIVE AND MANUFACTURING IN MAINFRAME MARKET, BY COMPONENT, 2018-2032 (USD MILLION)
TABLE 896 THAILAND RETAIL AND CONSUMER PACKAGED GOODS (CPG) IN MAINFRAME MARKET, BY COMPONENT, 2018-2032 (USD MILLION)
TABLE 897 THAILAND OTHERS IN MAINFRAME MARKET, BY COMPONENT, 2018-2032 (USD MILLION)
TABLE 898 INDONESIA MAINFRAME MARKET, BY SYSTEMS, 2018-2032 (USD MILLION)
TABLE 899 INDONESIA MAINFRAMES IN MAINFRAME MARKET, BY TYPE, 2018-2032 (USD MILLION)
TABLE 900 INDONESIA IBM Z SYSTEMS IN MAINFRAME MARKET, BY TYPE, 2018-2032 (USD MILLION)
TABLE 901 INDONESIA FUJITSU GS SERIES IN MAINFRAME MARKET, BY TYPE, 2018-2032 (USD MILLION)
TABLE 902 INDONESIA OTHER MAINFRAMES IN MAINFRAME MARKET, BY TYPE, 2018-2032 (USD MILLION)
TABLE 903 INDONESIA MIDRANGE SYSTEMS IN MAINFRAME MARKET, BY TYPE, 2018-2032 (USD MILLION)
TABLE 904 INDONESIA IBM POWER SYSTEMS (AIX, AS/400) IN MAINFRAME MARKET, BY TYPE, 2018-2032 (USD MILLION)
TABLE 905 INDONESIA HPE SERVERS IN MAINFRAME MARKET, BY TYPE, 2018-2032 (USD MILLION)
TABLE 906 INDONESIA ORACLE SUN SERVERS (SOLARIS) IN MAINFRAME MARKET, BY TYPE, 2018-2032 (USD MILLION)
TABLE 907 INDONESIA MAINFRAME MARKET, BY COMPONENT, 2018-2032 (USD MILLION)
TABLE 908 INDONESIA HARDWARE IN MAINFRAME MARKET, BY CATEGORY, 2018-2032 (USD MILLION)
TABLE 909 INDONESIA SERVICES IN MAINFRAME MARKET, BY CATEGORY, 2018-2032 (USD MILLION)
TABLE 910 INDONESIA SOFTWARE IN MAINFRAME MARKET, BY CATEGORY, 2018-2032 (USD MILLION)
TABLE 911 INDONESIA MAINFRAME MARKET, BY ORGANIZATION SIZE, 2018-2032 (USD MILLION)
TABLE 912 INDONESIA MAINFRAME MARKET, BY END USE, 2018-2032 (USD MILLION)
TABLE 913 INDONESIA FINANCIAL SERVICES IN MAINFRAME MARKET, BY TYPE, 2018-2032 (USD MILLION)
TABLE 914 INDONESIA BANKING AND CAPITAL MARKETS IN MAINFRAME MARKET, BY COMPONENT, 2018-2032 (USD MILLION)
TABLE 915 INDONESIA INSURANCE IN MAINFRAME MARKET, BY COMPONENT, 2018-2032 (USD MILLION)
TABLE 916 INDONESIA PAYMENTS IN MAINFRAME MARKET, BY COMPONENT, 2018-2032 (USD MILLION)
TABLE 917 INDONESIA FINANCIAL SERVICES IN MAINFRAME MARKET, BY COMPONENT, 2018-2032 (USD MILLION)
TABLE 918 INDONESIA IT & TELECOMMUNICATIONS IN MAINFRAME MARKET, BY COMPONENT, 2018-2032 (USD MILLION)
TABLE 919 INDONESIA HEALTHCARE IN MAINFRAME MARKET, BY COMPONENT, 2018-2032 (USD MILLION)
TABLE 920 INDONESIA PUBLIC SECTOR IN MAINFRAME MARKET, BY COMPONENT, 2018-2032 (USD MILLION)
TABLE 921 INDONESIA AUTOMOTIVE AND MANUFACTURING IN MAINFRAME MARKET, BY COMPONENT, 2018-2032 (USD MILLION)
TABLE 922 INDONESIA RETAIL AND CONSUMER PACKAGED GOODS (CPG) IN MAINFRAME MARKET, BY COMPONENT, 2018-2032 (USD MILLION)
TABLE 923 INDONESIA TRAVEL, MEDIA, AND ENTERTAINMENT IN MAINFRAME MARKET, BY COMPONENT, 2018-2032 (USD MILLION)
TABLE 924 INDONESIA OTHERS IN MAINFRAME MARKET, BY COMPONENT, 2018-2032 (USD MILLION)
TABLE 925 PHILIPPINES MAINFRAME MARKET, BY SYSTEMS, 2018-2032 (USD MILLION)
TABLE 926 PHILIPPINES MAINFRAMES IN MAINFRAME MARKET, BY TYPE, 2018-2032 (USD MILLION)
TABLE 927 PHILIPPINES IBM Z SYSTEMS IN MAINFRAME MARKET, BY TYPE, 2018-2032 (USD MILLION)
TABLE 928 PHILIPPINES FUJITSU GS SERIES IN MAINFRAME MARKET, BY TYPE, 2018-2032 (USD MILLION)
TABLE 929 PHILIPPINES OTHER MAINFRAMES IN MAINFRAME MARKET, BY TYPE, 2018-2032 (USD MILLION)
TABLE 930 PHILIPPINES MIDRANGE SYSTEMS IN MAINFRAME MARKET, BY TYPE, 2018-2032 (USD MILLION)
TABLE 931 PHILIPPINES IBM POWER SYSTEMS (AIX, AS/400) IN MAINFRAME MARKET, BY TYPE, 2018-2032 (USD MILLION)
TABLE 932 PHILIPPINES HPE SERVERS IN MAINFRAME MARKET, BY TYPE, 2018-2032 (USD MILLION)
TABLE 933 PHILIPPINES ORACLE SUN SERVERS (SOLARIS) IN MAINFRAME MARKET, BY TYPE, 2018-2032 (USD MILLION)
TABLE 934 PHILIPPINES MAINFRAME MARKET, BY COMPONENT, 2018-2032 (USD MILLION)
TABLE 935 PHILIPPINES HARDWARE IN MAINFRAME MARKET, BY CATEGORY, 2018-2032 (USD MILLION)
TABLE 936 PHILIPPINES SERVICES IN MAINFRAME MARKET, BY CATEGORY, 2018-2032 (USD MILLION)
TABLE 937 PHILIPPINES SOFTWARE IN MAINFRAME MARKET, BY CATEGORY, 2018-2032 (USD MILLION)
TABLE 938 PHILIPPINES MAINFRAME MARKET, BY ORGANIZATION SIZE, 2018-2032 (USD MILLION)
TABLE 939 PHILIPPINES MAINFRAME MARKET, BY END USE, 2018-2032 (USD MILLION)
TABLE 940 PHILIPPINES FINANCIAL SERVICES IN MAINFRAME MARKET, BY TYPE, 2018-2032 (USD MILLION)
TABLE 941 PHILIPPINES BANKING AND CAPITAL MARKETS IN MAINFRAME MARKET, BY COMPONENT, 2018-2032 (USD MILLION)
TABLE 942 PHILIPPINES INSURANCE IN MAINFRAME MARKET, BY COMPONENT, 2018-2032 (USD MILLION)
TABLE 943 PHILIPPINES PAYMENTS IN MAINFRAME MARKET, BY COMPONENT, 2018-2032 (USD MILLION)
TABLE 944 PHILIPPINES FINANCIAL SERVICES IN MAINFRAME MARKET, BY COMPONENT, 2018-2032 (USD MILLION)
TABLE 945 PHILIPPINES IT & TELECOMMUNICATIONS IN MAINFRAME MARKET, BY COMPONENT, 2018-2032 (USD MILLION)
TABLE 946 PHILIPPINES HEALTHCARE IN MAINFRAME MARKET, BY COMPONENT, 2018-2032 (USD MILLION)
TABLE 947 PHILIPPINES PUBLIC SECTOR IN MAINFRAME MARKET, BY COMPONENT, 2018-2032 (USD MILLION)
TABLE 948 PHILIPPINES AUTOMOTIVE AND MANUFACTURING IN MAINFRAME MARKET, BY COMPONENT, 2018-2032 (USD MILLION)
TABLE 949 PHILIPPINES RETAIL AND CONSUMER PACKAGED GOODS (CPG) IN MAINFRAME MARKET, BY COMPONENT, 2018-2032 (USD MILLION)
TABLE 950 PHILIPPINES TRAVEL, MEDIA, AND ENTERTAINMENT IN MAINFRAME MARKET, BY COMPONENT, 2018-2032 (USD MILLION)
TABLE 951 PHILIPPINES OTHERS IN MAINFRAME MARKET, BY COMPONENT, 2018-2032 (USD MILLION)
TABLE 952 REST OF ASIA-PACIFIC MAINFRAME MARKET, BY SYSTEMS, 2018-2032 (USD MILLION)
TABLE 953 SOUTH AMERICA MAINFRAME MARKET, BY COUNTRY, 2018-2032 (USD MILLION)
TABLE 954 SOUTH AMERICA MAINFRAME MARKET, BY SYSTEMS, 2018-2032 (USD MILLION)
TABLE 955 SOUTH AMERICA MAINFRAMES IN MAINFRAME MARKET, BY TYPE, 2018-2032 (USD MILLION)
TABLE 956 SOUTH AMERICA IBM Z SYSTEMS IN MAINFRAME MARKET, BY TYPE, 2018-2032 (USD MILLION)
TABLE 957 SOUTH AMERICA FUJITSU GS SERIES IN MAINFRAME MARKET, BY TYPE, 2018-2032 (USD MILLION)
TABLE 958 SOUTH AMERICA OTHER MAINFRAMES IN MAINFRAME MARKET, BY TYPE, 2018-2032 (USD MILLION)
TABLE 959 SOUTH AMERICA MIDRANGE SYSTEMS IN MAINFRAME MARKET, BY TYPE, 2018-2032 (USD MILLION)
TABLE 960 SOUTH AMERICA IBM POWER SYSTEMS (AIX, AS/400) IN MAINFRAME MARKET, BY TYPE, 2018-2032 (USD MILLION)
TABLE 961 SOUTH AMERICA HPE SERVERS IN MAINFRAME MARKET, BY TYPE, 2018-2032 (USD MILLION)
TABLE 962 SOUTH AMERICA ORACLE SUN SERVERS (SOLARIS) IN MAINFRAME MARKET, BY TYPE, 2018-2032 (USD MILLION)
TABLE 963 SOUTH AMERICA MAINFRAME MARKET, BY COMPONENT, 2018-2032 (USD MILLION)
TABLE 964 SOUTH AMERICA HARDWARE IN MAINFRAME MARKET, BY CATEGORY, 2018-2032 (USD MILLION)
TABLE 965 SOUTH AMERICA SERVICES IN MAINFRAME MARKET, BY CATEGORY, 2018-2032 (USD MILLION)
TABLE 966 SOUTH AMERICA SOFTWARE IN MAINFRAME MARKET, BY CATEGORY, 2018-2032 (USD MILLION)
TABLE 967 SOUTH AMERICA MAINFRAME MARKET, BY ORGANIZATION SIZE, 2018-2032 (USD MILLION)
TABLE 968 SOUTH AMERICA MAINFRAME MARKET, BY END USE, 2018-2032 (USD MILLION)
TABLE 969 SOUTH AMERICA FINANCIAL SERVICES IN MAINFRAME MARKET, BY TYPE, 2018-2032 (USD MILLION)
TABLE 970 SOUTH AMERICA BANKING AND CAPITAL MARKETS IN MAINFRAME MARKET, BY COMPONENT, 2018-2032 (USD MILLION)
TABLE 971 SOUTH AMERICA INSURANCE IN MAINFRAME MARKET, BY COMPONENT, 2018-2032 (USD MILLION)
TABLE 972 SOUTH AMERICA PAYMENTS IN MAINFRAME MARKET, BY COMPONENT, 2018-2032 (USD MILLION)
TABLE 973 SOUTH AMERICA FINANCIAL SERVICES IN MAINFRAME MARKET, BY COMPONENT, 2018-2032 (USD MILLION)
TABLE 974 SOUTH AMERICA IT & TELECOMMUNICATIONS IN MAINFRAME MARKET, BY COMPONENT, 2018-2032 (USD MILLION)
TABLE 975 SOUTH AMERICA HEALTHCARE IN MAINFRAME MARKET, BY COMPONENT, 2018-2032 (USD MILLION)
TABLE 976 SOUTH AMERICA PUBLIC SECTOR IN MAINFRAME MARKET, BY COMPONENT, 2018-2032 (USD MILLION)
TABLE 977 SOUTH AMERICA AUTOMOTIVE AND MANUFACTURING IN MAINFRAME MARKET, BY COMPONENT, 2018-2032 (USD MILLION)
TABLE 978 SOUTH AMERICA RETAIL AND CONSUMER PACKAGED GOODS (CPG) IN MAINFRAME MARKET, BY COMPONENT, 2018-2032 (USD MILLION)
TABLE 979 SOUTH AMERICA TRAVEL, MEDIA, AND ENTERTAINMENT IN MAINFRAME MARKET, BY COMPONENT, 2018-2032 (USD MILLION)
TABLE 980 SOUTH AMERICA OTHERS IN MAINFRAME MARKET, BY COMPONENT, 2018-2032 (USD MILLION)
TABLE 981 BRAZIL MAINFRAME MARKET, BY SYSTEMS, 2018-2032 (USD MILLION)
TABLE 982 BRAZIL MAINFRAMES IN MAINFRAME MARKET, BY TYPE, 2018-2032 (USD MILLION)
TABLE 983 BRAZIL IBM Z SYSTEMS IN MAINFRAME MARKET, BY TYPE, 2018-2032 (USD MILLION)
TABLE 984 BRAZIL FUJITSU GS SERIES IN MAINFRAME MARKET, BY TYPE, 2018-2032 (USD MILLION)
TABLE 985 BRAZIL OTHER MAINFRAMES IN MAINFRAME MARKET, BY TYPE, 2018-2032 (USD MILLION)
TABLE 986 BRAZIL MIDRANGE SYSTEMS IN MAINFRAME MARKET, BY TYPE, 2018-2032 (USD MILLION)
TABLE 987 BRAZIL IBM POWER SYSTEMS (AIX, AS/400) IN MAINFRAME MARKET, BY TYPE, 2018-2032 (USD MILLION)
TABLE 988 BRAZIL HPE SERVERS IN MAINFRAME MARKET, BY TYPE, 2018-2032 (USD MILLION)
TABLE 989 BRAZIL ORACLE SUN SERVERS (SOLARIS) IN MAINFRAME MARKET, BY TYPE, 2018-2032 (USD MILLION)
TABLE 990 BRAZIL MAINFRAME MARKET, BY COMPONENT, 2018-2032 (USD MILLION)
TABLE 991 BRAZIL HARDWARE IN MAINFRAME MARKET, BY CATEGORY, 2018-2032 (USD MILLION)
TABLE 992 BRAZIL SERVICES IN MAINFRAME MARKET, BY CATEGORY, 2018-2032 (USD MILLION)
TABLE 993 BRAZIL SOFTWARE IN MAINFRAME MARKET, BY CATEGORY, 2018-2032 (USD MILLION)
TABLE 994 BRAZIL MAINFRAME MARKET, BY ORGANIZATION SIZE, 2018-2032 (USD MILLION)
TABLE 995 BRAZIL MAINFRAME MARKET, BY END USE, 2018-2032 (USD MILLION)
TABLE 996 BRAZIL FINANCIAL SERVICES IN MAINFRAME MARKET, BY TYPE, 2018-2032 (USD MILLION)
TABLE 997 BRAZIL BANKING AND CAPITAL MARKETS IN MAINFRAME MARKET, BY COMPONENT, 2018-2032 (USD MILLION)
TABLE 998 BRAZIL INSURANCE IN MAINFRAME MARKET, BY COMPONENT, 2018-2032 (USD MILLION)
TABLE 999 BRAZIL PAYMENTS IN MAINFRAME MARKET, BY COMPONENT, 2018-2032 (USD MILLION)
TABLE 1000 BRAZIL FINANCIAL SERVICES IN MAINFRAME MARKET, BY COMPONENT, 2018-2032 (USD MILLION)
TABLE 1001 BRAZIL IT & TELECOMMUNICATIONS IN MAINFRAME MARKET, BY COMPONENT, 2018-2032 (USD MILLION)
TABLE 1002 BRAZIL HEALTHCARE IN MAINFRAME MARKET, BY COMPONENT, 2018-2032 (USD MILLION)
TABLE 1003 BRAZIL PUBLIC SECTOR IN MAINFRAME MARKET, BY COMPONENT, 2018-2032 (USD MILLION)
TABLE 1004 BRAZIL AUTOMOTIVE AND MANUFACTURING IN MAINFRAME MARKET, BY COMPONENT, 2018-2032 (USD MILLION)
TABLE 1005 BRAZIL RETAIL AND CONSUMER PACKAGED GOODS (CPG) IN MAINFRAME MARKET, BY COMPONENT, 2018-2032 (USD MILLION)
TABLE 1006 BRAZIL TRAVEL, MEDIA, AND ENTERTAINMENT IN MAINFRAME MARKET, BY COMPONENT, 2018-2032 (USD MILLION)
TABLE 1007 BRAZIL OTHERS IN MAINFRAME MARKET, BY COMPONENT, 2018-2032 (USD MILLION)
TABLE 1008 ARGENTINA MAINFRAME MARKET, BY SYSTEMS, 2018-2032 (USD MILLION)
TABLE 1009 ARGENTINA MAINFRAMES IN MAINFRAME MARKET, BY TYPE, 2018-2032 (USD MILLION)
TABLE 1010 ARGENTINA IBM Z SYSTEMS IN MAINFRAME MARKET, BY TYPE, 2018-2032 (USD MILLION)
TABLE 1011 ARGENTINA FUJITSU GS SERIES IN MAINFRAME MARKET, BY TYPE, 2018-2032 (USD MILLION)
TABLE 1012 ARGENTINA OTHER MAINFRAMES IN MAINFRAME MARKET, BY TYPE, 2018-2032 (USD MILLION)
TABLE 1013 ARGENTINA MIDRANGE SYSTEMS IN MAINFRAME MARKET, BY TYPE, 2018-2032 (USD MILLION)
TABLE 1014 ARGENTINA IBM POWER SYSTEMS (AIX, AS/400) IN MAINFRAME MARKET, BY TYPE, 2018-2032 (USD MILLION)
TABLE 1015 ARGENTINA HPE SERVERS IN MAINFRAME MARKET, BY TYPE, 2018-2032 (USD MILLION)
TABLE 1016 ARGENTINA ORACLE SUN SERVERS (SOLARIS) IN MAINFRAME MARKET, BY TYPE, 2018-2032 (USD MILLION)
TABLE 1017 ARGENTINA MAINFRAME MARKET, BY COMPONENT, 2018-2032 (USD MILLION)
TABLE 1018 ARGENTINA HARDWARE IN MAINFRAME MARKET, BY CATEGORY, 2018-2032 (USD MILLION)
TABLE 1019 ARGENTINA SERVICES IN MAINFRAME MARKET, BY CATEGORY, 2018-2032 (USD MILLION)
TABLE 1020 ARGENTINA SOFTWARE IN MAINFRAME MARKET, BY CATEGORY, 2018-2032 (USD MILLION)
TABLE 1021 ARGENTINA MAINFRAME MARKET, BY ORGANIZATION SIZE, 2018-2032 (USD MILLION)
TABLE 1022 ARGENTINA MAINFRAME MARKET, BY END USE, 2018-2032 (USD MILLION)
TABLE 1023 ARGENTINA FINANCIAL SERVICES IN MAINFRAME MARKET, BY TYPE, 2018-2032 (USD MILLION)
TABLE 1024 ARGENTINA BANKING AND CAPITAL MARKETS IN MAINFRAME MARKET, BY COMPONENT, 2018-2032 (USD MILLION)
TABLE 1025 ARGENTINA INSURANCE IN MAINFRAME MARKET, BY COMPONENT, 2018-2032 (USD MILLION)
TABLE 1026 ARGENTINA PAYMENTS IN MAINFRAME MARKET, BY COMPONENT, 2018-2032 (USD MILLION)
TABLE 1027 ARGENTINA FINANCIAL SERVICES IN MAINFRAME MARKET, BY COMPONENT, 2018-2032 (USD MILLION)
TABLE 1028 ARGENTINA IT & TELECOMMUNICATIONS IN MAINFRAME MARKET, BY COMPONENT, 2018-2032 (USD MILLION)
TABLE 1029 ARGENTINA HEALTHCARE IN MAINFRAME MARKET, BY COMPONENT, 2018-2032 (USD MILLION)
TABLE 1030 ARGENTINA PUBLIC SECTOR IN MAINFRAME MARKET, BY COMPONENT, 2018-2032 (USD MILLION)
TABLE 1031 ARGENTINA AUTOMOTIVE AND MANUFACTURING IN MAINFRAME MARKET, BY COMPONENT, 2018-2032 (USD MILLION)
TABLE 1032 ARGENTINA RETAIL AND CONSUMER PACKAGED GOODS (CPG) IN MAINFRAME MARKET, BY COMPONENT, 2018-2032 (USD MILLION)
TABLE 1033 ARGENTINA TRAVEL, MEDIA, AND ENTERTAINMENT IN MAINFRAME MARKET, BY COMPONENT, 2018-2032 (USD MILLION)
TABLE 1034 ARGENTINA OTHERS IN MAINFRAME MARKET, BY COMPONENT, 2018-2032 (USD MILLION)
TABLE 1035 CHILE MAINFRAME MARKET, BY SYSTEMS, 2018-2032 (USD MILLION)
TABLE 1036 CHILE MAINFRAMES IN MAINFRAME MARKET, BY TYPE, 2018-2032 (USD MILLION)
TABLE 1037 CHILE IBM Z SYSTEMS IN MAINFRAME MARKET, BY TYPE, 2018-2032 (USD MILLION)
TABLE 1038 CHILE FUJITSU GS SERIES IN MAINFRAME MARKET, BY TYPE, 2018-2032 (USD MILLION)
TABLE 1039 CHILE OTHER MAINFRAMES IN MAINFRAME MARKET, BY TYPE, 2018-2032 (USD MILLION)
TABLE 1040 CHILE MIDRANGE SYSTEMS IN MAINFRAME MARKET, BY TYPE, 2018-2032 (USD MILLION)
TABLE 1041 CHILE IBM POWER SYSTEMS (AIX, AS/400) IN MAINFRAME MARKET, BY TYPE, 2018-2032 (USD MILLION)
TABLE 1042 CHILE HPE SERVERS IN MAINFRAME MARKET, BY TYPE, 2018-2032 (USD MILLION)
TABLE 1043 CHILE ORACLE SUN SERVERS (SOLARIS) IN MAINFRAME MARKET, BY TYPE, 2018-2032 (USD MILLION)
TABLE 1044 CHILE MAINFRAME MARKET, BY COMPONENT, 2018-2032 (USD MILLION)
TABLE 1045 CHILE HARDWARE IN MAINFRAME MARKET, BY CATEGORY, 2018-2032 (USD MILLION)
TABLE 1046 CHILE SERVICES IN MAINFRAME MARKET, BY CATEGORY, 2018-2032 (USD MILLION)
TABLE 1047 CHILE SOFTWARE IN MAINFRAME MARKET, BY CATEGORY, 2018-2032 (USD MILLION)
TABLE 1048 CHILE MAINFRAME MARKET, BY ORGANIZATION SIZE, 2018-2032 (USD MILLION)
TABLE 1049 CHILE MAINFRAME MARKET, BY END USE, 2018-2032 (USD MILLION)
TABLE 1050 CHILE FINANCIAL SERVICES IN MAINFRAME MARKET, BY TYPE, 2018-2032 (USD MILLION)
TABLE 1051 CHILE BANKING AND CAPITAL MARKETS IN MAINFRAME MARKET, BY COMPONENT, 2018-2032 (USD MILLION)
TABLE 1052 CHILE INSURANCE IN MAINFRAME MARKET, BY COMPONENT, 2018-2032 (USD MILLION)
TABLE 1053 CHILE PAYMENTS IN MAINFRAME MARKET, BY COMPONENT, 2018-2032 (USD MILLION)
TABLE 1054 CHILE FINANCIAL SERVICES IN MAINFRAME MARKET, BY COMPONENT, 2018-2032 (USD MILLION)
TABLE 1055 CHILE IT & TELECOMMUNICATIONS IN MAINFRAME MARKET, BY COMPONENT, 2018-2032 (USD MILLION)
TABLE 1056 CHILE HEALTHCARE IN MAINFRAME MARKET, BY COMPONENT, 2018-2032 (USD MILLION)
TABLE 1057 CHILE PUBLIC SECTOR IN MAINFRAME MARKET, BY COMPONENT, 2018-2032 (USD MILLION)
TABLE 1058 CHILE AUTOMOTIVE AND MANUFACTURING IN MAINFRAME MARKET, BY COMPONENT, 2018-2032 (USD MILLION)
TABLE 1059 CHILE RETAIL AND CONSUMER PACKAGED GOODS (CPG) IN MAINFRAME MARKET, BY COMPONENT, 2018-2032 (USD MILLION)
TABLE 1060 CHILE TRAVEL, MEDIA, AND ENTERTAINMENT IN MAINFRAME MARKET, BY COMPONENT, 2018-2032 (USD MILLION)
TABLE 1061 CHILE OTHERS IN MAINFRAME MARKET, BY COMPONENT, 2018-2032 (USD MILLION)
TABLE 1062 PERU MAINFRAME MARKET, BY SYSTEMS, 2018-2032 (USD MILLION)
TABLE 1063 PERU MAINFRAMES IN MAINFRAME MARKET, BY TYPE, 2018-2032 (USD MILLION)
TABLE 1064 PERU IBM Z SYSTEMS IN MAINFRAME MARKET, BY TYPE, 2018-2032 (USD MILLION)
TABLE 1065 PERU FUJITSU GS SERIES IN MAINFRAME MARKET, BY TYPE, 2018-2032 (USD MILLION)
TABLE 1066 PERU OTHER MAINFRAMES IN MAINFRAME MARKET, BY TYPE, 2018-2032 (USD MILLION)
TABLE 1067 PERU MIDRANGE SYSTEMS IN MAINFRAME MARKET, BY TYPE, 2018-2032 (USD MILLION)
TABLE 1068 PERU IBM POWER SYSTEMS (AIX, AS/400) IN MAINFRAME MARKET, BY TYPE, 2018-2032 (USD MILLION)
TABLE 1069 PERU HPE SERVERS IN MAINFRAME MARKET, BY TYPE, 2018-2032 (USD MILLION)
TABLE 1070 PERU ORACLE SUN SERVERS (SOLARIS) IN MAINFRAME MARKET, BY TYPE, 2018-2032 (USD MILLION)
TABLE 1071 PERU MAINFRAME MARKET, BY COMPONENT, 2018-2032 (USD MILLION)
TABLE 1072 PERU HARDWARE IN MAINFRAME MARKET, BY CATEGORY, 2018-2032 (USD MILLION)
TABLE 1073 PERU SERVICES IN MAINFRAME MARKET, BY CATEGORY, 2018-2032 (USD MILLION)
TABLE 1074 PERU SOFTWARE IN MAINFRAME MARKET, BY CATEGORY, 2018-2032 (USD MILLION)
TABLE 1075 PERU MAINFRAME MARKET, BY ORGANIZATION SIZE, 2018-2032 (USD MILLION)
TABLE 1076 PERU MAINFRAME MARKET, BY END USE, 2018-2032 (USD MILLION)
TABLE 1077 PERU FINANCIAL SERVICES IN MAINFRAME MARKET, BY TYPE, 2018-2032 (USD MILLION)
TABLE 1078 PERU BANKING AND CAPITAL MARKETS IN MAINFRAME MARKET, BY COMPONENT, 2018-2032 (USD MILLION)
TABLE 1079 PERU INSURANCE IN MAINFRAME MARKET, BY COMPONENT, 2018-2032 (USD MILLION)
TABLE 1080 PERU PAYMENTS IN MAINFRAME MARKET, BY COMPONENT, 2018-2032 (USD MILLION)
TABLE 1081 PERU FINANCIAL SERVICES IN MAINFRAME MARKET, BY COMPONENT, 2018-2032 (USD MILLION)
TABLE 1082 PERU IT & TELECOMMUNICATIONS IN MAINFRAME MARKET, BY COMPONENT, 2018-2032 (USD MILLION)
TABLE 1083 PERU HEALTHCARE IN MAINFRAME MARKET, BY COMPONENT, 2018-2032 (USD MILLION)
TABLE 1084 PERU PUBLIC SECTOR IN MAINFRAME MARKET, BY COMPONENT, 2018-2032 (USD MILLION)
TABLE 1085 PERU AUTOMOTIVE AND MANUFACTURING IN MAINFRAME MARKET, BY COMPONENT, 2018-2032 (USD MILLION)
TABLE 1086 PERU RETAIL AND CONSUMER PACKAGED GOODS (CPG) IN MAINFRAME MARKET, BY COMPONENT, 2018-2032 (USD MILLION)
TABLE 1087 PERU TRAVEL, MEDIA, AND ENTERTAINMENT IN MAINFRAME MARKET, BY COMPONENT, 2018-2032 (USD MILLION)
TABLE 1088 PERU OTHERS IN MAINFRAME MARKET, BY COMPONENT, 2018-2032 (USD MILLION)
TABLE 1089 COLUMBIA MAINFRAME MARKET, BY SYSTEMS, 2018-2032 (USD MILLION)
TABLE 1090 COLUMBIA MAINFRAMES IN MAINFRAME MARKET, BY TYPE, 2018-2032 (USD MILLION)
TABLE 1091 COLUMBIA IBM Z SYSTEMS IN MAINFRAME MARKET, BY TYPE, 2018-2032 (USD MILLION)
TABLE 1092 COLUMBIA FUJITSU GS SERIES IN MAINFRAME MARKET, BY TYPE, 2018-2032 (USD MILLION)
TABLE 1093 COLUMBIA OTHER MAINFRAMES IN MAINFRAME MARKET, BY TYPE, 2018-2032 (USD MILLION)
TABLE 1094 COLUMBIA MIDRANGE SYSTEMS IN MAINFRAME MARKET, BY TYPE, 2018-2032 (USD MILLION)
TABLE 1095 COLUMBIA IBM POWER SYSTEMS (AIX, AS/400) IN MAINFRAME MARKET, BY TYPE, 2018-2032 (USD MILLION)
TABLE 1096 COLUMBIA HPE SERVERS IN MAINFRAME MARKET, BY TYPE, 2018-2032 (USD MILLION)
TABLE 1097 COLUMBIA ORACLE SUN SERVERS (SOLARIS) IN MAINFRAME MARKET, BY TYPE, 2018-2032 (USD MILLION)
TABLE 1098 COLUMBIA MAINFRAME MARKET, BY COMPONENT, 2018-2032 (USD MILLION)
TABLE 1099 COLUMBIA HARDWARE IN MAINFRAME MARKET, BY CATEGORY, 2018-2032 (USD MILLION)
TABLE 1100 COLUMBIA SERVICES IN MAINFRAME MARKET, BY CATEGORY, 2018-2032 (USD MILLION)
TABLE 1101 COLUMBIA SOFTWARE IN MAINFRAME MARKET, BY CATEGORY, 2018-2032 (USD MILLION)
TABLE 1102 COLUMBIA MAINFRAME MARKET, BY ORGANIZATION SIZE, 2018-2032 (USD MILLION)
TABLE 1103 COLUMBIA MAINFRAME MARKET, BY END USE, 2018-2032 (USD MILLION)
TABLE 1104 COLUMBIA FINANCIAL SERVICES IN MAINFRAME MARKET, BY TYPE, 2018-2032 (USD MILLION)
TABLE 1105 COLUMBIA BANKING AND CAPITAL MARKETS IN MAINFRAME MARKET, BY COMPONENT, 2018-2032 (USD MILLION)
TABLE 1106 COLUMBIA INSURANCE IN MAINFRAME MARKET, BY COMPONENT, 2018-2032 (USD MILLION)
TABLE 1107 COLUMBIA PAYMENTS IN MAINFRAME MARKET, BY COMPONENT, 2018-2032 (USD MILLION)
TABLE 1108 COLUMBIA FINANCIAL SERVICES IN MAINFRAME MARKET, BY COMPONENT, 2018-2032 (USD MILLION)
TABLE 1109 COLUMBIA IT & TELECOMMUNICATIONS IN MAINFRAME MARKET, BY COMPONENT, 2018-2032 (USD MILLION)
TABLE 1110 COLUMBIA HEALTHCARE IN MAINFRAME MARKET, BY COMPONENT, 2018-2032 (USD MILLION)
TABLE 1111 COLUMBIA PUBLIC SECTOR IN MAINFRAME MARKET, BY COMPONENT, 2018-2032 (USD MILLION)
TABLE 1112 COLUMBIA AUTOMOTIVE AND MANUFACTURING IN MAINFRAME MARKET, BY COMPONENT, 2018-2032 (USD MILLION)
TABLE 1113 COLUMBIA RETAIL AND CONSUMER PACKAGED GOODS (CPG) IN MAINFRAME MARKET, BY COMPONENT, 2018-2032 (USD MILLION)
TABLE 1114 COLUMBIA TRAVEL, MEDIA, AND ENTERTAINMENT IN MAINFRAME MARKET, BY COMPONENT, 2018-2032 (USD MILLION)
TABLE 1115 COLUMBIA OTHERS IN MAINFRAME MARKET, BY COMPONENT, 2018-2032 (USD MILLION)
TABLE 1116 ECUADOR MAINFRAME MARKET, BY SYSTEMS, 2018-2032 (USD MILLION)
TABLE 1117 ECUADOR MAINFRAMES IN MAINFRAME MARKET, BY TYPE, 2018-2032 (USD MILLION)
TABLE 1118 ECUADOR IBM Z SYSTEMS IN MAINFRAME MARKET, BY TYPE, 2018-2032 (USD MILLION)
TABLE 1119 ECUADOR FUJITSU GS SERIES IN MAINFRAME MARKET, BY TYPE, 2018-2032 (USD MILLION)
TABLE 1120 ECUADOR OTHER MAINFRAMES IN MAINFRAME MARKET, BY TYPE, 2018-2032 (USD MILLION)
TABLE 1121 ECUADOR MIDRANGE SYSTEMS IN MAINFRAME MARKET, BY TYPE, 2018-2032 (USD MILLION)
TABLE 1122 ECUADOR IBM POWER SYSTEMS (AIX, AS/400) IN MAINFRAME MARKET, BY TYPE, 2018-2032 (USD MILLION)
TABLE 1123 ECUADOR HPE SERVERS IN MAINFRAME MARKET, BY TYPE, 2018-2032 (USD MILLION)
TABLE 1124 ECUADOR ORACLE SUN SERVERS (SOLARIS) IN MAINFRAME MARKET, BY TYPE, 2018-2032 (USD MILLION)
TABLE 1125 ECUADOR MAINFRAME MARKET, BY COMPONENT, 2018-2032 (USD MILLION)
TABLE 1126 ECUADOR HARDWARE IN MAINFRAME MARKET, BY CATEGORY, 2018-2032 (USD MILLION)
TABLE 1127 ECUADOR SERVICES IN MAINFRAME MARKET, BY CATEGORY, 2018-2032 (USD MILLION)
TABLE 1128 ECUADOR SOFTWARE IN MAINFRAME MARKET, BY CATEGORY, 2018-2032 (USD MILLION)
TABLE 1129 ECUADOR MAINFRAME MARKET, BY ORGANIZATION SIZE, 2018-2032 (USD MILLION)
TABLE 1130 ECUADOR MAINFRAME MARKET, BY END USE, 2018-2032 (USD MILLION)
TABLE 1131 ECUADOR FINANCIAL SERVICES IN MAINFRAME MARKET, BY TYPE, 2018-2032 (USD MILLION)
TABLE 1132 ECUADOR BANKING AND CAPITAL MARKETS IN MAINFRAME MARKET, BY COMPONENT, 2018-2032 (USD MILLION)
TABLE 1133 ECUADOR INSURANCE IN MAINFRAME MARKET, BY COMPONENT, 2018-2032 (USD MILLION)
TABLE 1134 ECUADOR PAYMENTS IN MAINFRAME MARKET, BY COMPONENT, 2018-2032 (USD MILLION)
TABLE 1135 ECUADOR FINANCIAL SERVICES IN MAINFRAME MARKET, BY COMPONENT, 2018-2032 (USD MILLION)
TABLE 1136 ECUADOR IT & TELECOMMUNICATIONS IN MAINFRAME MARKET, BY COMPONENT, 2018-2032 (USD MILLION)
TABLE 1137 ECUADOR HEALTHCARE IN MAINFRAME MARKET, BY COMPONENT, 2018-2032 (USD MILLION)
TABLE 1138 ECUADOR PUBLIC SECTOR IN MAINFRAME MARKET, BY COMPONENT, 2018-2032 (USD MILLION)
TABLE 1139 ECUADOR AUTOMOTIVE AND MANUFACTURING IN MAINFRAME MARKET, BY COMPONENT, 2018-2032 (USD MILLION)
TABLE 1140 ECUADOR RETAIL AND CONSUMER PACKAGED GOODS (CPG) IN MAINFRAME MARKET, BY COMPONENT, 2018-2032 (USD MILLION)
TABLE 1141 ECUADOR TRAVEL, MEDIA, AND ENTERTAINMENT IN MAINFRAME MARKET, BY COMPONENT, 2018-2032 (USD MILLION)
TABLE 1142 ECUADOR OTHERS IN MAINFRAME MARKET, BY COMPONENT, 2018-2032 (USD MILLION)
TABLE 1143 GUYANA MAINFRAME MARKET, BY SYSTEMS, 2018-2032 (USD MILLION)
TABLE 1144 GUYANA MAINFRAMES IN MAINFRAME MARKET, BY TYPE, 2018-2032 (USD MILLION)
TABLE 1145 GUYANA IBM Z SYSTEMS IN MAINFRAME MARKET, BY TYPE, 2018-2032 (USD MILLION)
TABLE 1146 GUYANA FUJITSU GS SERIES IN MAINFRAME MARKET, BY TYPE, 2018-2032 (USD MILLION)
TABLE 1147 GUYANA OTHER MAINFRAMES IN MAINFRAME MARKET, BY TYPE, 2018-2032 (USD MILLION)
TABLE 1148 GUYANA MIDRANGE SYSTEMS IN MAINFRAME MARKET, BY TYPE, 2018-2032 (USD MILLION)
TABLE 1149 GUYANA IBM POWER SYSTEMS (AIX, AS/400) IN MAINFRAME MARKET, BY TYPE, 2018-2032 (USD MILLION)
TABLE 1150 GUYANA HPE SERVERS IN MAINFRAME MARKET, BY TYPE, 2018-2032 (USD MILLION)
TABLE 1151 GUYANA ORACLE SUN SERVERS (SOLARIS) IN MAINFRAME MARKET, BY TYPE, 2018-2032 (USD MILLION)
TABLE 1152 GUYANA MAINFRAME MARKET, BY COMPONENT, 2018-2032 (USD MILLION)
TABLE 1153 GUYANA HARDWARE IN MAINFRAME MARKET, BY CATEGORY, 2018-2032 (USD MILLION)
TABLE 1154 GUYANA SERVICES IN MAINFRAME MARKET, BY CATEGORY, 2018-2032 (USD MILLION)
TABLE 1155 GUYANA SOFTWARE IN MAINFRAME MARKET, BY CATEGORY, 2018-2032 (USD MILLION)
TABLE 1156 GUYANA MAINFRAME MARKET, BY ORGANIZATION SIZE, 2018-2032 (USD MILLION)
TABLE 1157 GUYANA MAINFRAME MARKET, BY END USE, 2018-2032 (USD MILLION)
TABLE 1158 GUYANA FINANCIAL SERVICES IN MAINFRAME MARKET, BY TYPE, 2018-2032 (USD MILLION)
TABLE 1159 GUYANA BANKING AND CAPITAL MARKETS IN MAINFRAME MARKET, BY COMPONENT, 2018-2032 (USD MILLION)
TABLE 1160 GUYANA INSURANCE IN MAINFRAME MARKET, BY COMPONENT, 2018-2032 (USD MILLION)
TABLE 1161 GUYANA PAYMENTS IN MAINFRAME MARKET, BY COMPONENT, 2018-2032 (USD MILLION)
TABLE 1162 GUYANA FINANCIAL SERVICES IN MAINFRAME MARKET, BY COMPONENT, 2018-2032 (USD MILLION)
TABLE 1163 GUYANA IT & TELECOMMUNICATIONS IN MAINFRAME MARKET, BY COMPONENT, 2018-2032 (USD MILLION)
TABLE 1164 GUYANA HEALTHCARE IN MAINFRAME MARKET, BY COMPONENT, 2018-2032 (USD MILLION)
TABLE 1165 GUYANA PUBLIC SECTOR IN MAINFRAME MARKET, BY COMPONENT, 2018-2032 (USD MILLION)
TABLE 1166 GUYANA AUTOMOTIVE AND MANUFACTURING IN MAINFRAME MARKET, BY COMPONENT, 2018-2032 (USD MILLION)
TABLE 1167 GUYANA RETAIL AND CONSUMER PACKAGED GOODS (CPG) IN MAINFRAME MARKET, BY COMPONENT, 2018-2032 (USD MILLION)
TABLE 1168 GUYANA TRAVEL, MEDIA, AND ENTERTAINMENT IN MAINFRAME MARKET, BY COMPONENT, 2018-2032 (USD MILLION)
TABLE 1169 GUYANA OTHERS IN MAINFRAME MARKET, BY COMPONENT, 2018-2032 (USD MILLION)
TABLE 1170 PARAGUAY MAINFRAME MARKET, BY SYSTEMS, 2018-2032 (USD MILLION)
TABLE 1171 PARAGUAY MAINFRAMES IN MAINFRAME MARKET, BY TYPE, 2018-2032 (USD MILLION)
TABLE 1172 PARAGUAY IBM Z SYSTEMS IN MAINFRAME MARKET, BY TYPE, 2018-2032 (USD MILLION)
TABLE 1173 PARAGUAY FUJITSU GS SERIES IN MAINFRAME MARKET, BY TYPE, 2018-2032 (USD MILLION)
TABLE 1174 PARAGUAY OTHER MAINFRAMES IN MAINFRAME MARKET, BY TYPE, 2018-2032 (USD MILLION)
TABLE 1175 PARAGUAY MIDRANGE SYSTEMS IN MAINFRAME MARKET, BY TYPE, 2018-2032 (USD MILLION)
TABLE 1176 PARAGUAY IBM POWER SYSTEMS (AIX, AS/400) IN MAINFRAME MARKET, BY TYPE, 2018-2032 (USD MILLION)
TABLE 1177 PARAGUAY HPE SERVERS IN MAINFRAME MARKET, BY TYPE, 2018-2032 (USD MILLION)
TABLE 1178 PARAGUAY ORACLE SUN SERVERS (SOLARIS) IN MAINFRAME MARKET, BY TYPE, 2018-2032 (USD MILLION)
TABLE 1179 PARAGUAY MAINFRAME MARKET, BY COMPONENT, 2018-2032 (USD MILLION)
TABLE 1180 PARAGUAY HARDWARE IN MAINFRAME MARKET, BY CATEGORY, 2018-2032 (USD MILLION)
TABLE 1181 PARAGUAY SERVICES IN MAINFRAME MARKET, BY CATEGORY, 2018-2032 (USD MILLION)
TABLE 1182 PARAGUAY SOFTWARE IN MAINFRAME MARKET, BY CATEGORY, 2018-2032 (USD MILLION)
TABLE 1183 PARAGUAY MAINFRAME MARKET, BY ORGANIZATION SIZE, 2018-2032 (USD MILLION)
TABLE 1184 PARAGUAY MAINFRAME MARKET, BY END USE, 2018-2032 (USD MILLION)
TABLE 1185 PARAGUAY FINANCIAL SERVICES IN MAINFRAME MARKET, BY TYPE, 2018-2032 (USD MILLION)
TABLE 1186 PARAGUAY BANKING AND CAPITAL MARKETS IN MAINFRAME MARKET, BY COMPONENT, 2018-2032 (USD MILLION)
TABLE 1187 PARAGUAY INSURANCE IN MAINFRAME MARKET, BY COMPONENT, 2018-2032 (USD MILLION)
TABLE 1188 PARAGUAY PAYMENTS IN MAINFRAME MARKET, BY COMPONENT, 2018-2032 (USD MILLION)
TABLE 1189 PARAGUAY FINANCIAL SERVICES IN MAINFRAME MARKET, BY COMPONENT, 2018-2032 (USD MILLION)
TABLE 1190 PARAGUAY IT & TELECOMMUNICATIONS IN MAINFRAME MARKET, BY COMPONENT, 2018-2032 (USD MILLION)
TABLE 1191 PARAGUAY HEALTHCARE IN MAINFRAME MARKET, BY COMPONENT, 2018-2032 (USD MILLION)
TABLE 1192 PARAGUAY PUBLIC SECTOR IN MAINFRAME MARKET, BY COMPONENT, 2018-2032 (USD MILLION)
TABLE 1193 PARAGUAY AUTOMOTIVE AND MANUFACTURING IN MAINFRAME MARKET, BY COMPONENT, 2018-2032 (USD MILLION)
TABLE 1194 PARAGUAY RETAIL AND CONSUMER PACKAGED GOODS (CPG) IN MAINFRAME MARKET, BY COMPONENT, 2018-2032 (USD MILLION)
TABLE 1195 PARAGUAY TRAVEL, MEDIA, AND ENTERTAINMENT IN MAINFRAME MARKET, BY COMPONENT, 2018-2032 (USD MILLION)
TABLE 1196 PARAGUAY OTHERS IN MAINFRAME MARKET, BY COMPONENT, 2018-2032 (USD MILLION)
TABLE 1197 BOLIVIA MAINFRAME MARKET, BY SYSTEMS, 2018-2032 (USD MILLION)
TABLE 1198 BOLIVIA MAINFRAMES IN MAINFRAME MARKET, BY TYPE, 2018-2032 (USD MILLION)
TABLE 1199 BOLIVIA IBM Z SYSTEMS IN MAINFRAME MARKET, BY TYPE, 2018-2032 (USD MILLION)
TABLE 1200 BOLIVIA FUJITSU GS SERIES IN MAINFRAME MARKET, BY TYPE, 2018-2032 (USD MILLION)
TABLE 1201 BOLIVIA OTHER MAINFRAMES IN MAINFRAME MARKET, BY TYPE, 2018-2032 (USD MILLION)
TABLE 1202 BOLIVIA MIDRANGE SYSTEMS IN MAINFRAME MARKET, BY TYPE, 2018-2032 (USD MILLION)
TABLE 1203 BOLIVIA IBM POWER SYSTEMS (AIX, AS/400) IN MAINFRAME MARKET, BY TYPE, 2018-2032 (USD MILLION)
TABLE 1204 BOLIVIA HPE SERVERS IN MAINFRAME MARKET, BY TYPE, 2018-2032 (USD MILLION)
TABLE 1205 BOLIVIA ORACLE SUN SERVERS (SOLARIS) IN MAINFRAME MARKET, BY TYPE, 2018-2032 (USD MILLION)
TABLE 1206 BOLIVIA MAINFRAME MARKET, BY COMPONENT, 2018-2032 (USD MILLION)
TABLE 1207 BOLIVIA HARDWARE IN MAINFRAME MARKET, BY CATEGORY, 2018-2032 (USD MILLION)
TABLE 1208 BOLIVIA SERVICES IN MAINFRAME MARKET, BY CATEGORY, 2018-2032 (USD MILLION)
TABLE 1209 BOLIVIA SOFTWARE IN MAINFRAME MARKET, BY CATEGORY, 2018-2032 (USD MILLION)
TABLE 1210 BOLIVIA MAINFRAME MARKET, BY ORGANIZATION SIZE, 2018-2032 (USD MILLION)
TABLE 1211 BOLIVIA MAINFRAME MARKET, BY END USE, 2018-2032 (USD MILLION)
TABLE 1212 BOLIVIA FINANCIAL SERVICES IN MAINFRAME MARKET, BY TYPE, 2018-2032 (USD MILLION)
TABLE 1213 BOLIVIA BANKING AND CAPITAL MARKETS IN MAINFRAME MARKET, BY COMPONENT, 2018-2032 (USD MILLION)
TABLE 1214 BOLIVIA INSURANCE IN MAINFRAME MARKET, BY COMPONENT, 2018-2032 (USD MILLION)
TABLE 1215 BOLIVIA PAYMENTS IN MAINFRAME MARKET, BY COMPONENT, 2018-2032 (USD MILLION)
TABLE 1216 BOLIVIA FINANCIAL SERVICES IN MAINFRAME MARKET, BY COMPONENT, 2018-2032 (USD MILLION)
TABLE 1217 BOLIVIA IT & TELECOMMUNICATIONS IN MAINFRAME MARKET, BY COMPONENT, 2018-2032 (USD MILLION)
TABLE 1218 BOLIVIA HEALTHCARE IN MAINFRAME MARKET, BY COMPONENT, 2018-2032 (USD MILLION)
TABLE 1219 BOLIVIA PUBLIC SECTOR IN MAINFRAME MARKET, BY COMPONENT, 2018-2032 (USD MILLION)
TABLE 1220 BOLIVIA AUTOMOTIVE AND MANUFACTURING IN MAINFRAME MARKET, BY COMPONENT, 2018-2032 (USD MILLION)
TABLE 1221 BOLIVIA RETAIL AND CONSUMER PACKAGED GOODS (CPG) IN MAINFRAME MARKET, BY COMPONENT, 2018-2032 (USD MILLION)
TABLE 1222 BOLIVIA TRAVEL, MEDIA, AND ENTERTAINMENT IN MAINFRAME MARKET, BY COMPONENT, 2018-2032 (USD MILLION)
TABLE 1223 BOLIVIA OTHERS IN MAINFRAME MARKET, BY COMPONENT, 2018-2032 (USD MILLION)
TABLE 1224 SURINAME MAINFRAME MARKET, BY SYSTEMS, 2018-2032 (USD MILLION)
TABLE 1225 SURINAME MAINFRAMES IN MAINFRAME MARKET, BY TYPE, 2018-2032 (USD MILLION)
TABLE 1226 SURINAME IBM Z SYSTEMS IN MAINFRAME MARKET, BY TYPE, 2018-2032 (USD MILLION)
TABLE 1227 SURINAME FUJITSU GS SERIES IN MAINFRAME MARKET, BY TYPE, 2018-2032 (USD MILLION)
TABLE 1228 SURINAME OTHER MAINFRAMES IN MAINFRAME MARKET, BY TYPE, 2018-2032 (USD MILLION)
TABLE 1229 SURINAME MIDRANGE SYSTEMS IN MAINFRAME MARKET, BY TYPE, 2018-2032 (USD MILLION)
TABLE 1230 SURINAME IBM POWER SYSTEMS (AIX, AS/400) IN MAINFRAME MARKET, BY TYPE, 2018-2032 (USD MILLION)
TABLE 1231 SURINAME HPE SERVERS IN MAINFRAME MARKET, BY TYPE, 2018-2032 (USD MILLION)
TABLE 1232 SURINAME ORACLE SUN SERVERS (SOLARIS) IN MAINFRAME MARKET, BY TYPE, 2018-2032 (USD MILLION)
TABLE 1233 SURINAME MAINFRAME MARKET, BY COMPONENT, 2018-2032 (USD MILLION)
TABLE 1234 SURINAME HARDWARE IN MAINFRAME MARKET, BY CATEGORY, 2018-2032 (USD MILLION)
TABLE 1235 SURINAME SERVICES IN MAINFRAME MARKET, BY CATEGORY, 2018-2032 (USD MILLION)
TABLE 1236 SURINAME SOFTWARE IN MAINFRAME MARKET, BY CATEGORY, 2018-2032 (USD MILLION)
TABLE 1237 SURINAME MAINFRAME MARKET, BY ORGANIZATION SIZE, 2018-2032 (USD MILLION)
TABLE 1238 SURINAME MAINFRAME MARKET, BY END USE, 2018-2032 (USD MILLION)
TABLE 1239 SURINAME FINANCIAL SERVICES IN MAINFRAME MARKET, BY TYPE, 2018-2032 (USD MILLION)
TABLE 1240 SURINAME BANKING AND CAPITAL MARKETS IN MAINFRAME MARKET, BY COMPONENT, 2018-2032 (USD MILLION)
TABLE 1241 SURINAME INSURANCE IN MAINFRAME MARKET, BY COMPONENT, 2018-2032 (USD MILLION)
TABLE 1242 SURINAME PAYMENTS IN MAINFRAME MARKET, BY COMPONENT, 2018-2032 (USD MILLION)
TABLE 1243 SURINAME FINANCIAL SERVICES IN MAINFRAME MARKET, BY COMPONENT, 2018-2032 (USD MILLION)
TABLE 1244 SURINAME IT & TELECOMMUNICATIONS IN MAINFRAME MARKET, BY COMPONENT, 2018-2032 (USD MILLION)
TABLE 1245 SURINAME HEALTHCARE IN MAINFRAME MARKET, BY COMPONENT, 2018-2032 (USD MILLION)
TABLE 1246 SURINAME PUBLIC SECTOR IN MAINFRAME MARKET, BY COMPONENT, 2018-2032 (USD MILLION)
TABLE 1247 SURINAME AUTOMOTIVE AND MANUFACTURING IN MAINFRAME MARKET, BY COMPONENT, 2018-2032 (USD MILLION)
TABLE 1248 SURINAME RETAIL AND CONSUMER PACKAGED GOODS (CPG) IN MAINFRAME MARKET, BY COMPONENT, 2018-2032 (USD MILLION)
TABLE 1249 SURINAME TRAVEL, MEDIA, AND ENTERTAINMENT IN MAINFRAME MARKET, BY COMPONENT, 2018-2032 (USD MILLION)
TABLE 1250 SURINAME OTHERS IN MAINFRAME MARKET, BY COMPONENT, 2018-2032 (USD MILLION)
TABLE 1251 URUGUAY MAINFRAME MARKET, BY SYSTEMS, 2018-2032 (USD MILLION)
TABLE 1252 URUGUAY MAINFRAMES IN MAINFRAME MARKET, BY TYPE, 2018-2032 (USD MILLION)
TABLE 1253 URUGUAY IBM Z SYSTEMS IN MAINFRAME MARKET, BY TYPE, 2018-2032 (USD MILLION)
TABLE 1254 URUGUAY FUJITSU GS SERIES IN MAINFRAME MARKET, BY TYPE, 2018-2032 (USD MILLION)
TABLE 1255 URUGUAY OTHER MAINFRAMES IN MAINFRAME MARKET, BY TYPE, 2018-2032 (USD MILLION)
TABLE 1256 URUGUAY MIDRANGE SYSTEMS IN MAINFRAME MARKET, BY TYPE, 2018-2032 (USD MILLION)
TABLE 1257 URUGUAY IBM POWER SYSTEMS (AIX, AS/400) IN MAINFRAME MARKET, BY TYPE, 2018-2032 (USD MILLION)
TABLE 1258 URUGUAY HPE SERVERS IN MAINFRAME MARKET, BY TYPE, 2018-2032 (USD MILLION)
TABLE 1259 URUGUAY ORACLE SUN SERVERS (SOLARIS) IN MAINFRAME MARKET, BY TYPE, 2018-2032 (USD MILLION)
TABLE 1260 URUGUAY MAINFRAME MARKET, BY COMPONENT, 2018-2032 (USD MILLION)
TABLE 1261 URUGUAY HARDWARE IN MAINFRAME MARKET, BY CATEGORY, 2018-2032 (USD MILLION)
TABLE 1262 URUGUAY SERVICES IN MAINFRAME MARKET, BY CATEGORY, 2018-2032 (USD MILLION)
TABLE 1263 URUGUAY SOFTWARE IN MAINFRAME MARKET, BY CATEGORY, 2018-2032 (USD MILLION)
TABLE 1264 URUGUAY MAINFRAME MARKET, BY ORGANIZATION SIZE, 2018-2032 (USD MILLION)
TABLE 1265 URUGUAY MAINFRAME MARKET, BY END USE, 2018-2032 (USD MILLION)
TABLE 1266 URUGUAY FINANCIAL SERVICES IN MAINFRAME MARKET, BY TYPE, 2018-2032 (USD MILLION)
TABLE 1267 URUGUAY BANKING AND CAPITAL MARKETS IN MAINFRAME MARKET, BY COMPONENT, 2018-2032 (USD MILLION)
TABLE 1268 URUGUAY INSURANCE IN MAINFRAME MARKET, BY COMPONENT, 2018-2032 (USD MILLION)
TABLE 1269 URUGUAY PAYMENTS IN MAINFRAME MARKET, BY COMPONENT, 2018-2032 (USD MILLION)
TABLE 1270 URUGUAY FINANCIAL SERVICES IN MAINFRAME MARKET, BY COMPONENT, 2018-2032 (USD MILLION)
TABLE 1271 URUGUAY IT & TELECOMMUNICATIONS IN MAINFRAME MARKET, BY COMPONENT, 2018-2032 (USD MILLION)
TABLE 1272 URUGUAY HEALTHCARE IN MAINFRAME MARKET, BY COMPONENT, 2018-2032 (USD MILLION)
TABLE 1273 URUGUAY PUBLIC SECTOR IN MAINFRAME MARKET, BY COMPONENT, 2018-2032 (USD MILLION)
TABLE 1274 URUGUAY AUTOMOTIVE AND MANUFACTURING IN MAINFRAME MARKET, BY COMPONENT, 2018-2032 (USD MILLION)
TABLE 1275 URUGUAY RETAIL AND CONSUMER PACKAGED GOODS (CPG) IN MAINFRAME MARKET, BY COMPONENT, 2018-2032 (USD MILLION)
TABLE 1276 URUGUAY TRAVEL, MEDIA, AND ENTERTAINMENT IN MAINFRAME MARKET, BY COMPONENT, 2018-2032 (USD MILLION)
TABLE 1277 URUGUAY OTHERS IN MAINFRAME MARKET, BY COMPONENT, 2018-2032 (USD MILLION)
TABLE 1278 VENEZUELA MAINFRAME MARKET, BY SYSTEMS, 2018-2032 (USD MILLION)
TABLE 1279 VENEZUELA MAINFRAMES IN MAINFRAME MARKET, BY TYPE, 2018-2032 (USD MILLION)
TABLE 1280 VENEZUELA IBM Z SYSTEMS IN MAINFRAME MARKET, BY TYPE, 2018-2032 (USD MILLION)
TABLE 1281 VENEZUELA FUJITSU GS SERIES IN MAINFRAME MARKET, BY TYPE, 2018-2032 (USD MILLION)
TABLE 1282 VENEZUELA OTHER MAINFRAMES IN MAINFRAME MARKET, BY TYPE, 2018-2032 (USD MILLION)
TABLE 1283 VENEZUELA MIDRANGE SYSTEMS IN MAINFRAME MARKET, BY TYPE, 2018-2032 (USD MILLION)
TABLE 1284 VENEZUELA IBM POWER SYSTEMS (AIX, AS/400) IN MAINFRAME MARKET, BY TYPE, 2018-2032 (USD MILLION)
TABLE 1285 VENEZUELA HPE SERVERS IN MAINFRAME MARKET, BY TYPE, 2018-2032 (USD MILLION)
TABLE 1286 VENEZUELA ORACLE SUN SERVERS (SOLARIS) IN MAINFRAME MARKET, BY TYPE, 2018-2032 (USD MILLION)
TABLE 1287 VENEZUELA MAINFRAME MARKET, BY COMPONENT, 2018-2032 (USD MILLION)
TABLE 1288 VENEZUELA HARDWARE IN MAINFRAME MARKET, BY CATEGORY, 2018-2032 (USD MILLION)
TABLE 1289 VENEZUELA SERVICES IN MAINFRAME MARKET, BY CATEGORY, 2018-2032 (USD MILLION)
TABLE 1290 VENEZUELA SOFTWARE IN MAINFRAME MARKET, BY CATEGORY, 2018-2032 (USD MILLION)
TABLE 1291 VENEZUELA MAINFRAME MARKET, BY ORGANIZATION SIZE, 2018-2032 (USD MILLION)
TABLE 1292 VENEZUELA MAINFRAME MARKET, BY END USE, 2018-2032 (USD MILLION)
TABLE 1293 VENEZUELA FINANCIAL SERVICES IN MAINFRAME MARKET, BY TYPE, 2018-2032 (USD MILLION)
TABLE 1294 VENEZUELA BANKING AND CAPITAL MARKETS IN MAINFRAME MARKET, BY COMPONENT, 2018-2032 (USD MILLION)
TABLE 1295 VENEZUELA INSURANCE IN MAINFRAME MARKET, BY COMPONENT, 2018-2032 (USD MILLION)
TABLE 1296 VENEZUELA PAYMENTS IN MAINFRAME MARKET, BY COMPONENT, 2018-2032 (USD MILLION)
TABLE 1297 VENEZUELA FINANCIAL SERVICES IN MAINFRAME MARKET, BY COMPONENT, 2018-2032 (USD MILLION)
TABLE 1298 VENEZUELA IT & TELECOMMUNICATIONS IN MAINFRAME MARKET, BY COMPONENT, 2018-2032 (USD MILLION)
TABLE 1299 VENEZUELA HEALTHCARE IN MAINFRAME MARKET, BY COMPONENT, 2018-2032 (USD MILLION)
TABLE 1300 VENEZUELA PUBLIC SECTOR IN MAINFRAME MARKET, BY COMPONENT, 2018-2032 (USD MILLION)
TABLE 1301 VENEZUELA AUTOMOTIVE AND MANUFACTURING IN MAINFRAME MARKET, BY COMPONENT, 2018-2032 (USD MILLION)
TABLE 1302 VENEZUELA RETAIL AND CONSUMER PACKAGED GOODS (CPG) IN MAINFRAME MARKET, BY COMPONENT, 2018-2032 (USD MILLION)
TABLE 1303 VENEZUELA TRAVEL, MEDIA, AND ENTERTAINMENT IN MAINFRAME MARKET, BY COMPONENT, 2018-2032 (USD MILLION)
TABLE 1304 VENEZUELA OTHERS IN MAINFRAME MARKET, BY COMPONENT, 2018-2032 (USD MILLION)
TABLE 1305 REST OF SOUTH AMERICA MAINFRAME MARKET, BY SYSTEMS, 2018-2032 (USD MILLION)
TABLE 1306 MIDDLE EAST AND AFRICA MAINFRAME MARKET, BY COUNTRY, 2018-2032 (USD MILLION)
TABLE 1307 MIDDLE EAST AND AFRICA MAINFRAME MARKET, BY SYSTEMS, 2018-2032 (USD MILLION)
TABLE 1308 MIDDLE EAST AND AFRICA MAINFRAMES IN MAINFRAME MARKET, BY TYPE, 2018-2032 (USD MILLION)
TABLE 1309 MIDDLE EAST AND AFRICA IBM Z SYSTEMS IN MAINFRAME MARKET, BY TYPE, 2018-2032 (USD MILLION)
TABLE 1310 MIDDLE EAST AND AFRICA FUJITSU GS SERIES IN MAINFRAME MARKET, BY TYPE, 2018-2032 (USD MILLION)
TABLE 1311 MIDDLE EAST AND AFRICA OTHER MAINFRAMES IN MAINFRAME MARKET, BY TYPE, 2018-2032 (USD MILLION)
TABLE 1312 MIDDLE EAST AND AFRICA MIDRANGE SYSTEMS IN MAINFRAME MARKET, BY TYPE, 2018-2032 (USD MILLION)
TABLE 1313 MIDDLE EAST AND AFRICA IBM POWER SYSTEMS (AIX, AS/400) IN MAINFRAME MARKET, BY TYPE, 2018-2032 (USD MILLION)
TABLE 1314 MIDDLE EAST AND AFRICA HPE SERVERS IN MAINFRAME MARKET, BY TYPE, 2018-2032 (USD MILLION)
TABLE 1315 MIDDLE EAST AND AFRICA ORACLE SUN SERVERS (SOLARIS) IN MAINFRAME MARKET, BY TYPE, 2018-2032 (USD MILLION)
TABLE 1316 MIDDLE EAST AND AFRICA MAINFRAME MARKET, BY COMPONENT, 2018-2032 (USD MILLION)
TABLE 1317 MIDDLE EAST AND AFRICA HARDWARE IN MAINFRAME MARKET, BY CATEGORY, 2018-2032 (USD MILLION)
TABLE 1318 MIDDLE EAST AND AFRICA SERVICES IN MAINFRAME MARKET, BY CATEGORY, 2018-2032 (USD MILLION)
TABLE 1319 MIDDLE EAST AND AFRICA SOFTWARE IN MAINFRAME MARKET, BY CATEGORY, 2018-2032 (USD MILLION)
TABLE 1320 MIDDLE EAST AND AFRICA MAINFRAME MARKET, BY ORGANIZATION SIZE, 2018-2032 (USD MILLION)
TABLE 1321 MIDDLE EAST AND AFRICA MAINFRAME MARKET, BY END USE, 2018-2032 (USD MILLION)
TABLE 1322 MIDDLE EAST AND AFRICA FINANCIAL SERVICES IN MAINFRAME MARKET, BY TYPE, 2018-2032 (USD MILLION)
TABLE 1323 MIDDLE EAST AND AFRICA BANKING AND CAPITAL MARKETS IN MAINFRAME MARKET, BY COMPONENT, 2018-2032 (USD MILLION)
TABLE 1324 MIDDLE EAST AND AFRICA INSURANCE IN MAINFRAME MARKET, BY COMPONENT, 2018-2032 (USD MILLION)
TABLE 1325 MIDDLE EAST AND AFRICA PAYMENTS IN MAINFRAME MARKET, BY COMPONENT, 2018-2032 (USD MILLION)
TABLE 1326 MIDDLE EAST AND AFRICA FINANCIAL SERVICES IN MAINFRAME MARKET, BY COMPONENT, 2018-2032 (USD MILLION)
TABLE 1327 MIDDLE EAST AND AFRICA IT & TELECOMMUNICATIONS IN MAINFRAME MARKET, BY COMPONENT, 2018-2032 (USD MILLION)
TABLE 1328 MIDDLE EAST AND AFRICA HEALTHCARE IN MAINFRAME MARKET, BY COMPONENT, 2018-2032 (USD MILLION)
TABLE 1329 MIDDLE EAST AND AFRICA PUBLIC SECTOR IN MAINFRAME MARKET, BY COMPONENT, 2018-2032 (USD MILLION)
TABLE 1330 MIDDLE EAST AND AFRICA AUTOMOTIVE AND MANUFACTURING IN MAINFRAME MARKET, BY COMPONENT, 2018-2032 (USD MILLION)
TABLE 1331 MIDDLE EAST AND AFRICA RETAIL AND CONSUMER PACKAGED GOODS (CPG) IN MAINFRAME MARKET, BY COMPONENT, 2018-2032 (USD MILLION)
TABLE 1332 MIDDLE EAST AND AFRICA TRAVEL, MEDIA, AND ENTERTAINMENT IN MAINFRAME MARKET, BY COMPONENT, 2018-2032 (USD MILLION)
TABLE 1333 MIDDLE EAST AND AFRICA OTHERS IN MAINFRAME MARKET, BY COMPONENT, 2018-2032 (USD MILLION)
TABLE 1334 SAUDI ARABIA MAINFRAME MARKET, BY SYSTEMS, 2018-2032 (USD MILLION)
TABLE 1335 SAUDI ARABIA MAINFRAMES IN MAINFRAME MARKET, BY TYPE, 2018-2032 (USD MILLION)
TABLE 1336 SAUDI ARABIA IBM Z SYSTEMS IN MAINFRAME MARKET, BY TYPE, 2018-2032 (USD MILLION)
TABLE 1337 SAUDI ARABIA FUJITSU GS SERIES IN MAINFRAME MARKET, BY TYPE, 2018-2032 (USD MILLION)
TABLE 1338 SAUDI ARABIA OTHER MAINFRAMES IN MAINFRAME MARKET, BY TYPE, 2018-2032 (USD MILLION)
TABLE 1339 SAUDI ARABIA MIDRANGE SYSTEMS IN MAINFRAME MARKET, BY TYPE, 2018-2032 (USD MILLION)
TABLE 1340 SAUDI ARABIA IBM POWER SYSTEMS (AIX, AS/400) IN MAINFRAME MARKET, BY TYPE, 2018-2032 (USD MILLION)
TABLE 1341 SAUDI ARABIA HPE SERVERS IN MAINFRAME MARKET, BY TYPE, 2018-2032 (USD MILLION)
TABLE 1342 SAUDI ARABIA ORACLE SUN SERVERS (SOLARIS) IN MAINFRAME MARKET, BY TYPE, 2018-2032 (USD MILLION)
TABLE 1343 SAUDI ARABIA MAINFRAME MARKET, BY COMPONENT, 2018-2032 (USD MILLION)
TABLE 1344 SAUDI ARABIA HARDWARE IN MAINFRAME MARKET, BY CATEGORY, 2018-2032 (USD MILLION)
TABLE 1345 SAUDI ARABIA SERVICES IN MAINFRAME MARKET, BY CATEGORY, 2018-2032 (USD MILLION)
TABLE 1346 SAUDI ARABIA SOFTWARE IN MAINFRAME MARKET, BY CATEGORY, 2018-2032 (USD MILLION)
TABLE 1347 SAUDI ARABIA MAINFRAME MARKET, BY ORGANIZATION SIZE, 2018-2032 (USD MILLION)
TABLE 1348 SAUDI ARABIA MAINFRAME MARKET, BY END USE, 2018-2032 (USD MILLION)
TABLE 1349 SAUDI ARABIA FINANCIAL SERVICES IN MAINFRAME MARKET, BY TYPE, 2018-2032 (USD MILLION)
TABLE 1350 SAUDI ARABIA BANKING AND CAPITAL MARKETS IN MAINFRAME MARKET, BY COMPONENT, 2018-2032 (USD MILLION)
TABLE 1351 SAUDI ARABIA INSURANCE IN MAINFRAME MARKET, BY COMPONENT, 2018-2032 (USD MILLION)
TABLE 1352 SAUDI ARABIA PAYMENTS IN MAINFRAME MARKET, BY COMPONENT, 2018-2032 (USD MILLION)
TABLE 1353 SAUDI ARABIA FINANCIAL SERVICES IN MAINFRAME MARKET, BY COMPONENT, 2018-2032 (USD MILLION)
TABLE 1354 SAUDI ARABIA IT & TELECOMMUNICATIONS IN MAINFRAME MARKET, BY COMPONENT, 2018-2032 (USD MILLION)
TABLE 1355 SAUDI ARABIA HEALTHCARE IN MAINFRAME MARKET, BY COMPONENT, 2018-2032 (USD MILLION)
TABLE 1356 SAUDI ARABIA PUBLIC SECTOR IN MAINFRAME MARKET, BY COMPONENT, 2018-2032 (USD MILLION)
TABLE 1357 SAUDI ARABIA AUTOMOTIVE AND MANUFACTURING IN MAINFRAME MARKET, BY COMPONENT, 2018-2032 (USD MILLION)
TABLE 1358 SAUDI ARABIA RETAIL AND CONSUMER PACKAGED GOODS (CPG) IN MAINFRAME MARKET, BY COMPONENT, 2018-2032 (USD MILLION)
TABLE 1359 SAUDI ARABIA TRAVEL, MEDIA, AND ENTERTAINMENT IN MAINFRAME MARKET, BY COMPONENT, 2018-2032 (USD MILLION)
TABLE 1360 SAUDI ARABIA OTHERS IN MAINFRAME MARKET, BY COMPONENT, 2018-2032 (USD MILLION)
TABLE 1361 U.A.E. MAINFRAME MARKET, BY SYSTEMS, 2018-2032 (USD MILLION)
TABLE 1362 U.A.E. MAINFRAMES IN MAINFRAME MARKET, BY TYPE, 2018-2032 (USD MILLION)
TABLE 1363 U.A.E. IBM Z SYSTEMS IN MAINFRAME MARKET, BY TYPE, 2018-2032 (USD MILLION)
TABLE 1364 U.A.E. FUJITSU GS SERIES IN MAINFRAME MARKET, BY TYPE, 2018-2032 (USD MILLION)
TABLE 1365 U.A.E. OTHER MAINFRAMES IN MAINFRAME MARKET, BY TYPE, 2018-2032 (USD MILLION)
TABLE 1366 U.A.E. MIDRANGE SYSTEMS IN MAINFRAME MARKET, BY TYPE, 2018-2032 (USD MILLION)
TABLE 1367 U.A.E. IBM POWER SYSTEMS (AIX, AS/400) IN MAINFRAME MARKET, BY TYPE, 2018-2032 (USD MILLION)
TABLE 1368 U.A.E. HPE SERVERS IN MAINFRAME MARKET, BY TYPE, 2018-2032 (USD MILLION)
TABLE 1369 U.A.E. ORACLE SUN SERVERS (SOLARIS) IN MAINFRAME MARKET, BY TYPE, 2018-2032 (USD MILLION)
TABLE 1370 U.A.E. MAINFRAME MARKET, BY COMPONENT, 2018-2032 (USD MILLION)
TABLE 1371 U.A.E. HARDWARE IN MAINFRAME MARKET, BY CATEGORY, 2018-2032 (USD MILLION)
TABLE 1372 U.A.E. SERVICES IN MAINFRAME MARKET, BY CATEGORY, 2018-2032 (USD MILLION)
TABLE 1373 U.A.E. SOFTWARE IN MAINFRAME MARKET, BY CATEGORY, 2018-2032 (USD MILLION)
TABLE 1374 U.A.E. MAINFRAME MARKET, BY ORGANIZATION SIZE, 2018-2032 (USD MILLION)
TABLE 1375 U.A.E. MAINFRAME MARKET, BY END USE, 2018-2032 (USD MILLION)
TABLE 1376 U.A.E. FINANCIAL SERVICES IN MAINFRAME MARKET, BY TYPE, 2018-2032 (USD MILLION)
TABLE 1377 U.A.E. BANKING AND CAPITAL MARKETS IN MAINFRAME MARKET, BY COMPONENT, 2018-2032 (USD MILLION)
TABLE 1378 U.A.E. INSURANCE IN MAINFRAME MARKET, BY COMPONENT, 2018-2032 (USD MILLION)
TABLE 1379 U.A.E. PAYMENTS IN MAINFRAME MARKET, BY COMPONENT, 2018-2032 (USD MILLION)
TABLE 1380 U.A.E. FINANCIAL SERVICES IN MAINFRAME MARKET, BY COMPONENT, 2018-2032 (USD MILLION)
TABLE 1381 U.A.E. IT & TELECOMMUNICATIONS IN MAINFRAME MARKET, BY COMPONENT, 2018-2032 (USD MILLION)
TABLE 1382 U.A.E. HEALTHCARE IN MAINFRAME MARKET, BY COMPONENT, 2018-2032 (USD MILLION)
TABLE 1383 U.A.E. PUBLIC SECTOR IN MAINFRAME MARKET, BY COMPONENT, 2018-2032 (USD MILLION)
TABLE 1384 U.A.E. AUTOMOTIVE AND MANUFACTURING IN MAINFRAME MARKET, BY COMPONENT, 2018-2032 (USD MILLION)
TABLE 1385 U.A.E. RETAIL AND CONSUMER PACKAGED GOODS (CPG) IN MAINFRAME MARKET, BY COMPONENT, 2018-2032 (USD MILLION)
TABLE 1386 U.A.E. TRAVEL, MEDIA, AND ENTERTAINMENT IN MAINFRAME MARKET, BY COMPONENT, 2018-2032 (USD MILLION)
TABLE 1387 U.A.E. OTHERS IN MAINFRAME MARKET, BY COMPONENT, 2018-2032 (USD MILLION)
TABLE 1388 ISRAEL MAINFRAME MARKET, BY SYSTEMS, 2018-2032 (USD MILLION)
TABLE 1389 ISRAEL MAINFRAMES IN MAINFRAME MARKET, BY TYPE, 2018-2032 (USD MILLION)
TABLE 1390 ISRAEL IBM Z SYSTEMS IN MAINFRAME MARKET, BY TYPE, 2018-2032 (USD MILLION)
TABLE 1391 ISRAEL FUJITSU GS SERIES IN MAINFRAME MARKET, BY TYPE, 2018-2032 (USD MILLION)
TABLE 1392 ISRAEL OTHER MAINFRAMES IN MAINFRAME MARKET, BY TYPE, 2018-2032 (USD MILLION)
TABLE 1393 ISRAEL MIDRANGE SYSTEMS IN MAINFRAME MARKET, BY TYPE, 2018-2032 (USD MILLION)
TABLE 1394 ISRAEL IBM POWER SYSTEMS (AIX, AS/400) IN MAINFRAME MARKET, BY TYPE, 2018-2032 (USD MILLION)
TABLE 1395 ISRAEL HPE SERVERS IN MAINFRAME MARKET, BY TYPE, 2018-2032 (USD MILLION)
TABLE 1396 ISRAEL ORACLE SUN SERVERS (SOLARIS) IN MAINFRAME MARKET, BY TYPE, 2018-2032 (USD MILLION)
TABLE 1397 ISRAEL MAINFRAME MARKET, BY COMPONENT, 2018-2032 (USD MILLION)
TABLE 1398 ISRAEL HARDWARE IN MAINFRAME MARKET, BY CATEGORY, 2018-2032 (USD MILLION)
TABLE 1399 ISRAEL SERVICES IN MAINFRAME MARKET, BY CATEGORY, 2018-2032 (USD MILLION)
TABLE 1400 ISRAEL SOFTWARE IN MAINFRAME MARKET, BY CATEGORY, 2018-2032 (USD MILLION)
TABLE 1401 ISRAEL MAINFRAME MARKET, BY ORGANIZATION SIZE, 2018-2032 (USD MILLION)
TABLE 1402 ISRAEL MAINFRAME MARKET, BY END USE, 2018-2032 (USD MILLION)
TABLE 1403 ISRAEL FINANCIAL SERVICES IN MAINFRAME MARKET, BY TYPE, 2018-2032 (USD MILLION)
TABLE 1404 ISRAEL BANKING AND CAPITAL MARKETS IN MAINFRAME MARKET, BY COMPONENT, 2018-2032 (USD MILLION)
TABLE 1405 ISRAEL INSURANCE IN MAINFRAME MARKET, BY COMPONENT, 2018-2032 (USD MILLION)
TABLE 1406 ISRAEL PAYMENTS IN MAINFRAME MARKET, BY COMPONENT, 2018-2032 (USD MILLION)
TABLE 1407 ISRAEL FINANCIAL SERVICES IN MAINFRAME MARKET, BY COMPONENT, 2018-2032 (USD MILLION)
TABLE 1408 ISRAEL IT & TELECOMMUNICATIONS IN MAINFRAME MARKET, BY COMPONENT, 2018-2032 (USD MILLION)
TABLE 1409 ISRAEL HEALTHCARE IN MAINFRAME MARKET, BY COMPONENT, 2018-2032 (USD MILLION)
TABLE 1410 ISRAEL PUBLIC SECTOR IN MAINFRAME MARKET, BY COMPONENT, 2018-2032 (USD MILLION)
TABLE 1411 ISRAEL AUTOMOTIVE AND MANUFACTURING IN MAINFRAME MARKET, BY COMPONENT, 2018-2032 (USD MILLION)
TABLE 1412 ISRAEL RETAIL AND CONSUMER PACKAGED GOODS (CPG) IN MAINFRAME MARKET, BY COMPONENT, 2018-2032 (USD MILLION)
TABLE 1413 ISRAEL TRAVEL, MEDIA, AND ENTERTAINMENT IN MAINFRAME MARKET, BY COMPONENT, 2018-2032 (USD MILLION)
TABLE 1414 ISRAEL OTHERS IN MAINFRAME MARKET, BY COMPONENT, 2018-2032 (USD MILLION)
TABLE 1415 SOUTH AFRICA MAINFRAME MARKET, BY SYSTEMS, 2018-2032 (USD MILLION)
TABLE 1416 SOUTH AFRICA MAINFRAMES IN MAINFRAME MARKET, BY TYPE, 2018-2032 (USD MILLION)
TABLE 1417 SOUTH AFRICA IBM Z SYSTEMS IN MAINFRAME MARKET, BY TYPE, 2018-2032 (USD MILLION)
TABLE 1418 SOUTH AFRICA FUJITSU GS SERIES IN MAINFRAME MARKET, BY TYPE, 2018-2032 (USD MILLION)
TABLE 1419 SOUTH AFRICA OTHER MAINFRAMES IN MAINFRAME MARKET, BY TYPE, 2018-2032 (USD MILLION)
TABLE 1420 SOUTH AFRICA MIDRANGE SYSTEMS IN MAINFRAME MARKET, BY TYPE, 2018-2032 (USD MILLION)
TABLE 1421 SOUTH AFRICA IBM POWER SYSTEMS (AIX, AS/400) IN MAINFRAME MARKET, BY TYPE, 2018-2032 (USD MILLION)
TABLE 1422 SOUTH AFRICA HPE SERVERS IN MAINFRAME MARKET, BY TYPE, 2018-2032 (USD MILLION)
TABLE 1423 SOUTH AFRICA ORACLE SUN SERVERS (SOLARIS) IN MAINFRAME MARKET, BY TYPE, 2018-2032 (USD MILLION)
TABLE 1424 SOUTH AFRICA MAINFRAME MARKET, BY COMPONENT, 2018-2032 (USD MILLION)
TABLE 1425 SOUTH AFRICA HARDWARE IN MAINFRAME MARKET, BY CATEGORY, 2018-2032 (USD MILLION)
TABLE 1426 SOUTH AFRICA SERVICES IN MAINFRAME MARKET, BY CATEGORY, 2018-2032 (USD MILLION)
TABLE 1427 SOUTH AFRICA SOFTWARE IN MAINFRAME MARKET, BY CATEGORY, 2018-2032 (USD MILLION)
TABLE 1428 SOUTH AFRICA MAINFRAME MARKET, BY ORGANIZATION SIZE, 2018-2032 (USD MILLION)
TABLE 1429 SOUTH AFRICA MAINFRAME MARKET, BY END USE, 2018-2032 (USD MILLION)
TABLE 1430 SOUTH AFRICA FINANCIAL SERVICES IN MAINFRAME MARKET, BY TYPE, 2018-2032 (USD MILLION)
TABLE 1431 SOUTH AFRICA BANKING AND CAPITAL MARKETS IN MAINFRAME MARKET, BY COMPONENT, 2018-2032 (USD MILLION)
TABLE 1432 SOUTH AFRICA INSURANCE IN MAINFRAME MARKET, BY COMPONENT, 2018-2032 (USD MILLION)
TABLE 1433 SOUTH AFRICA PAYMENTS IN MAINFRAME MARKET, BY COMPONENT, 2018-2032 (USD MILLION)
TABLE 1434 SOUTH AFRICA FINANCIAL SERVICES IN MAINFRAME MARKET, BY COMPONENT, 2018-2032 (USD MILLION)
TABLE 1435 SOUTH AFRICA IT & TELECOMMUNICATIONS IN MAINFRAME MARKET, BY COMPONENT, 2018-2032 (USD MILLION)
TABLE 1436 SOUTH AFRICA HEALTHCARE IN MAINFRAME MARKET, BY COMPONENT, 2018-2032 (USD MILLION)
TABLE 1437 SOUTH AFRICA PUBLIC SECTOR IN MAINFRAME MARKET, BY COMPONENT, 2018-2032 (USD MILLION)
TABLE 1438 SOUTH AFRICA AUTOMOTIVE AND MANUFACTURING IN MAINFRAME MARKET, BY COMPONENT, 2018-2032 (USD MILLION)
TABLE 1439 SOUTH AFRICA RETAIL AND CONSUMER PACKAGED GOODS (CPG) IN MAINFRAME MARKET, BY COMPONENT, 2018-2032 (USD MILLION)
TABLE 1440 SOUTH AFRICA TRAVEL, MEDIA, AND ENTERTAINMENT IN MAINFRAME MARKET, BY COMPONENT, 2018-2032 (USD MILLION)
TABLE 1441 SOUTH AFRICA OTHERS IN MAINFRAME MARKET, BY COMPONENT, 2018-2032 (USD MILLION)
TABLE 1442 EGYPT MAINFRAME MARKET, BY SYSTEMS, 2018-2032 (USD MILLION)
TABLE 1443 EGYPT MAINFRAMES IN MAINFRAME MARKET, BY TYPE, 2018-2032 (USD MILLION)
TABLE 1444 EGYPT IBM Z SYSTEMS IN MAINFRAME MARKET, BY TYPE, 2018-2032 (USD MILLION)
TABLE 1445 EGYPT FUJITSU GS SERIES IN MAINFRAME MARKET, BY TYPE, 2018-2032 (USD MILLION)
TABLE 1446 EGYPT OTHER MAINFRAMES IN MAINFRAME MARKET, BY TYPE, 2018-2032 (USD MILLION)
TABLE 1447 EGYPT MIDRANGE SYSTEMS IN MAINFRAME MARKET, BY TYPE, 2018-2032 (USD MILLION)
TABLE 1448 EGYPT IBM POWER SYSTEMS (AIX, AS/400) IN MAINFRAME MARKET, BY TYPE, 2018-2032 (USD MILLION)
TABLE 1449 EGYPT HPE SERVERS IN MAINFRAME MARKET, BY TYPE, 2018-2032 (USD MILLION)
TABLE 1450 EGYPT ORACLE SUN SERVERS (SOLARIS) IN MAINFRAME MARKET, BY TYPE, 2018-2032 (USD MILLION)
TABLE 1451 EGYPT MAINFRAME MARKET, BY COMPONENT, 2018-2032 (USD MILLION)
TABLE 1452 EGYPT HARDWARE IN MAINFRAME MARKET, BY CATEGORY, 2018-2032 (USD MILLION)
TABLE 1453 EGYPT SERVICES IN MAINFRAME MARKET, BY CATEGORY, 2018-2032 (USD MILLION)
TABLE 1454 EGYPT SOFTWARE IN MAINFRAME MARKET, BY CATEGORY, 2018-2032 (USD MILLION)
TABLE 1455 EGYPT MAINFRAME MARKET, BY ORGANIZATION SIZE, 2018-2032 (USD MILLION)
TABLE 1456 EGYPT MAINFRAME MARKET, BY END USE, 2018-2032 (USD MILLION)
TABLE 1457 EGYPT FINANCIAL SERVICES IN MAINFRAME MARKET, BY TYPE, 2018-2032 (USD MILLION)
TABLE 1458 EGYPT BANKING AND CAPITAL MARKETS IN MAINFRAME MARKET, BY COMPONENT, 2018-2032 (USD MILLION)
TABLE 1459 EGYPT INSURANCE IN MAINFRAME MARKET, BY COMPONENT, 2018-2032 (USD MILLION)
TABLE 1460 EGYPT PAYMENTS IN MAINFRAME MARKET, BY COMPONENT, 2018-2032 (USD MILLION)
TABLE 1461 EGYPT FINANCIAL SERVICES IN MAINFRAME MARKET, BY COMPONENT, 2018-2032 (USD MILLION)
TABLE 1462 EGYPT IT & TELECOMMUNICATIONS IN MAINFRAME MARKET, BY COMPONENT, 2018-2032 (USD MILLION)
TABLE 1463 EGYPT HEALTHCARE IN MAINFRAME MARKET, BY COMPONENT, 2018-2032 (USD MILLION)
TABLE 1464 EGYPT PUBLIC SECTOR IN MAINFRAME MARKET, BY COMPONENT, 2018-2032 (USD MILLION)
TABLE 1465 EGYPT AUTOMOTIVE AND MANUFACTURING IN MAINFRAME MARKET, BY COMPONENT, 2018-2032 (USD MILLION)
TABLE 1466 EGYPT RETAIL AND CONSUMER PACKAGED GOODS (CPG) IN MAINFRAME MARKET, BY COMPONENT, 2018-2032 (USD MILLION)
TABLE 1467 EGYPT TRAVEL, MEDIA, AND ENTERTAINMENT IN MAINFRAME MARKET, BY COMPONENT, 2018-2032 (USD MILLION)
TABLE 1468 EGYPT OTHERS IN MAINFRAME MARKET, BY COMPONENT, 2018-2032 (USD MILLION)
TABLE 1469 REST OF MIDDLE EAST AND AFRICA MAINFRAME MARKET, BY SYSTEMS, 2018-2032 (USD MILLION)
Lista de figuras
FIGURE 1 GLOBAL MAINFRAME MARKET
FIGURE 2 GLOBAL MAINFRAME MARKET: DATA TRIANGULATION
FIGURE 3 GLOBAL MAINFRAME MARKET: DROC ANALYSIS
FIGURE 4 GLOBAL MAINFRAME MARKET: GLOBAL VS REGIONAL MARKET ANALYSIS
FIGURE 5 GLOBAL MAINFRAME MARKET: COMPANY RESEARCH ANALYSIS
FIGURE 6 GLOBAL MAINFRAME MARKET: MULTIVARIATE MODELL INC.ING
FIGURE 7 GLOBAL MAINFRAME MARKET: INTERVIEW DEMOGRAPHICS
FIGURE 8 GLOBAL MAINFRAME MARKET: DBMR MARKET POSITION GRID
FIGURE 9 GLOBAL MAINFRAME MARKET: VENDOR SHARE ANALYSIS
FIGURE 10 MARKET APPLICATION COVERAGE GRID
FIGURE 11 GLOBAL MAINFRAME MARKET: SEGMENTATION
FIGURE 12 GLOBAL MAINFRAME MARKET: EXECUTIVE SUMMARY
FIGURE 13 TWO SEGMENTS COMPRISE THE GLOBAL MAINFRAME MARKET, BY SYSTEMS (2024)
FIGURE 14 STRATEGIC DECISIONS
FIGURE 15 NORTH AMERICA IS EXPECTED TO DOMINATE THE GLOBAL MAINFRAME MARKET, AND IS EXPECTED TO GROW WITH THE HIGHEST CAGR IN THE FORECAST PERIOD
FIGURE 16 ACCELERATED DIGITALIZATION ACROSS INDUSTRIES IS EXPECTED TO DRIVE THE GLOBAL MAINFRAME MARKET IN THE FORECAST PERIOD OF 2025 TO 2032
FIGURE 17 THE MAINFRAMES SEGMENT IS EXPECTED TO ACCOUNT FOR THE LARGEST MARKET SHARE OF THE GLOBAL MAINFRAME MARKET IN 2025 AND 2032
FIGURE 18 NORTH AMERICA IS THE FASTEST GROWING MARKET FOR MAINFRAME IN THE FORECAST PERIOD
FIGURE 19 PESTEL ANALYSIS
FIGURE 20 PORTER’S FIVE FORCES
FIGURE 21 DRIVERS, RESTRAINTS, OPPORTUNITIES, AND CHALLENGES OF THE GLOBAL MAINFRAME MARKET
FIGURE 22 BENEFITS OF MAINFRAME MODERNIZATION
FIGURE 23 ADOPTION OF DIFFERENT MODERNIZATION PATH
FIGURE 24 ADOPTION OF DIFFERENT CLOUDS IN VARIOUS INDUSTRIES
FIGURE 25 GLOBAL MAINFRAME MARKET: BY SYSTEMS, 2024
FIGURE 26 GLOBAL MAINFRAME MARKET, BY COMPONENT, 2024
FIGURE 27 GLOBAL MAINFRAME MARKET: BY ORGANIZATION SIZE, 2024
FIGURE 28 GLOBAL MAINFRAME MARKET, BY END USE, 2024
FIGURE 29 GLOBAL MAINFRAME MARKET: SNAPSHOT (2024)
FIGURE 30 GLOBAL MAINFRAME MARKET: COMPANY SHARE 2024 (%)
FIGURE 31 ASIA-PACIFC MAINFRAME MARKET: COMPANY SHARE 2024 (%)
FIGURE 32 EUROPE MAINFRAME MARKET: COMPANY SHARE 2024 (%)
FIGURE 33 NORTH AMERICA MAINFRAME MARKET: COMPANY SHARE 2024 (%)
Metodología de investigación
La recopilación de datos y el análisis del año base se realizan utilizando módulos de recopilación de datos con muestras de gran tamaño. La etapa incluye la obtención de información de mercado o datos relacionados a través de varias fuentes y estrategias. Incluye el examen y la planificación de todos los datos adquiridos del pasado con antelación. Asimismo, abarca el examen de las inconsistencias de información observadas en diferentes fuentes de información. Los datos de mercado se analizan y estiman utilizando modelos estadísticos y coherentes de mercado. Además, el análisis de la participación de mercado y el análisis de tendencias clave son los principales factores de éxito en el informe de mercado. Para obtener más información, solicite una llamada de un analista o envíe su consulta.
La metodología de investigación clave utilizada por el equipo de investigación de DBMR es la triangulación de datos, que implica la extracción de datos, el análisis del impacto de las variables de datos en el mercado y la validación primaria (experto en la industria). Los modelos de datos incluyen cuadrícula de posicionamiento de proveedores, análisis de línea de tiempo de mercado, descripción general y guía del mercado, cuadrícula de posicionamiento de la empresa, análisis de patentes, análisis de precios, análisis de participación de mercado de la empresa, estándares de medición, análisis global versus regional y de participación de proveedores. Para obtener más información sobre la metodología de investigación, envíe una consulta para hablar con nuestros expertos de la industria.
Personalización disponible
Data Bridge Market Research es líder en investigación formativa avanzada. Nos enorgullecemos de brindar servicios a nuestros clientes existentes y nuevos con datos y análisis que coinciden y se adaptan a sus objetivos. El informe se puede personalizar para incluir análisis de tendencias de precios de marcas objetivo, comprensión del mercado de países adicionales (solicite la lista de países), datos de resultados de ensayos clínicos, revisión de literatura, análisis de mercado renovado y base de productos. El análisis de mercado de competidores objetivo se puede analizar desde análisis basados en tecnología hasta estrategias de cartera de mercado. Podemos agregar tantos competidores sobre los que necesite datos en el formato y estilo de datos que esté buscando. Nuestro equipo de analistas también puede proporcionarle datos en archivos de Excel sin procesar, tablas dinámicas (libro de datos) o puede ayudarlo a crear presentaciones a partir de los conjuntos de datos disponibles en el informe.

