

Global Magnetic Resonance Imaging Devices Market
Tamaño del mercado en miles de millones de dólares
Tasa de crecimiento anual compuesta (CAGR) :
% 
 USD
6.71 Billion
USD
9.18 Billion
2023
2031
USD
6.71 Billion
USD
9.18 Billion
2023
2031
| 2024 –2031 | |
| USD 6.71 Billion | |
| USD 9.18 Billion | |
| % | |
|
Segmentación del mercado global de dispositivos de imágenes por resonancia magnética, por intensidad de campo (sistemas de resonancia magnética de campo alto, sistemas de resonancia magnética de campo medio, sistemas de resonancia magnética de campo bajo, otros), tipo (sistemas de resonancia magnética cerrados, sistemas de resonancia magnética de diámetro amplio, sistemas de resonancia magnética abiertos), modalidad (sistema estacionario, sistema portátil/móvil, sistema de punto de atención (POC)), indicación (cerebro y neurológico, musculoesquelético, cardiología, mamografía, oncología, pélvico y abdominal, ginecología, urología, odontología, otros), usuario final (hospitales, centros de diagnóstico, centros de imágenes, clínicas especializadas, centros quirúrgicos ambulatorios, institutos académicos y de investigación), canal de distribución (licitación directa, ventas minoristas) - Tendencias de la industria y pronóstico hasta 2031.
Análisis del mercado de dispositivos de imágenes por resonancia magnética
Los dispositivos de imágenes por resonancia magnética se están utilizando para el diagnóstico, la detección y el tratamiento de diversas enfermedades crónicas . La tecnología ayuda a detectar los cambios que se producen en los protones que se encuentran en el líquido tisular. Estos dispositivos no utilizan rayos X cuando se requieren imágenes frecuentes para el diagnóstico.
Tamaño del mercado de dispositivos de imágenes por resonancia magnética
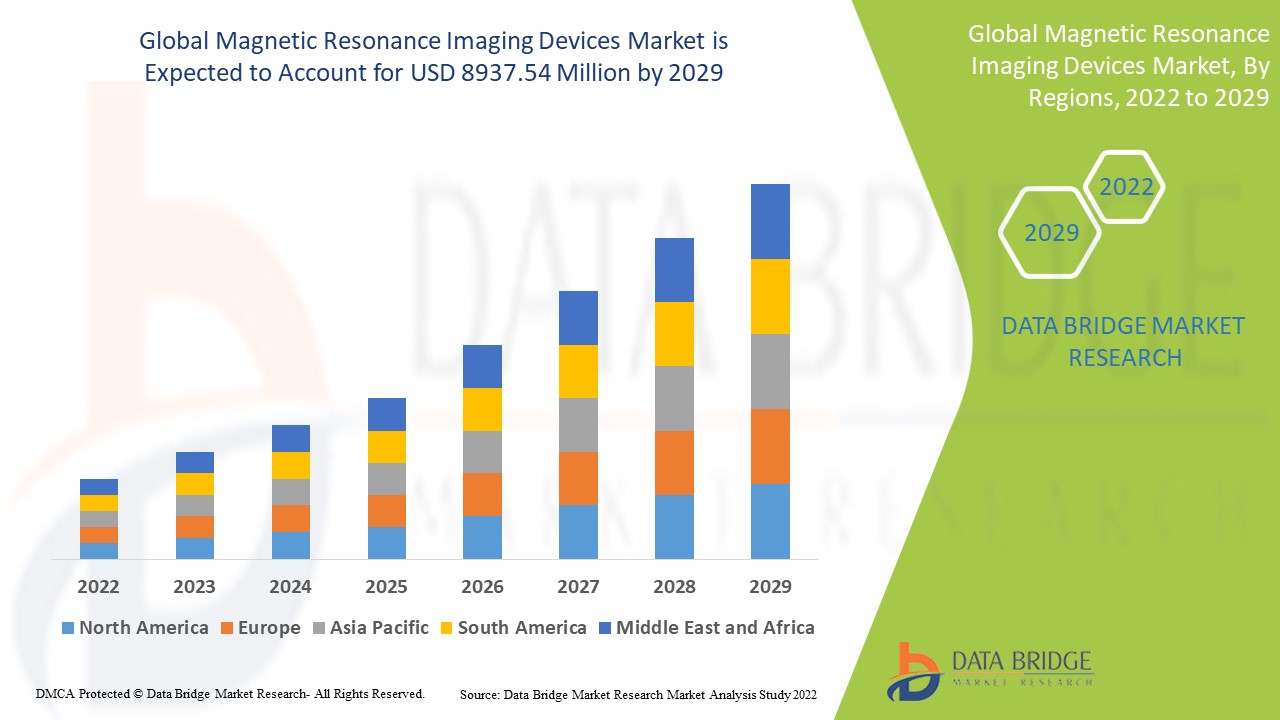
El tamaño del mercado global de dispositivos de imágenes por resonancia magnética se valoró en USD 6,71 mil millones en 2023 y se proyecta que alcance los USD 9,18 mil millones para 2031, con una CAGR del 4,00% durante el período de pronóstico de 2024 a 2031.
Alcance del informe y segmentación del mercado
|
Atributos |
Dispositivos de imágenes por resonancia magnética: información clave del mercado |
|
Segmentación |
|
|
Países cubiertos |
EE. UU., Canadá y México en América del Norte, Alemania, Francia, Reino Unido, Países Bajos, Suiza, Bélgica, Rusia, Italia, España, Turquía, Resto de Europa en Europa, China, Japón, India, Corea del Sur, Singapur, Malasia, Australia, Tailandia, Indonesia, Filipinas, Resto de Asia-Pacífico (APAC) en Asia-Pacífico (APAC), Arabia Saudita, Emiratos Árabes Unidos, Sudáfrica, Egipto, Israel, Resto de Medio Oriente y África (MEA) como parte de Medio Oriente y África (MEA), Brasil, Argentina y Resto de América del Sur como parte de América del Sur. |
|
Actores clave del mercado |
Aspect Imaging (Israel), CANON MEDICAL SYSTEMS CORPORATION (Japón), Siemens (Alemania), General Electric Company (EE. UU.), Hitachi, Ltd. (Japón), Koninklijke Philips NV (Países Bajos), Neusoft Corporation (China), ESAOTE SPA (Italia), FONAR (EE. UU.), Synaptive Medical (Canadá), AllTech Medical Systems (EE. UU.), United Imaging Intelligence (China), Medonica Co. LTD (Corea del Sur), IMRIS (Canadá), Promaxo (EE. UU.), AURORA HEALTHCARE US CORP (EE. UU.), SG HealthCare Pvt. Ltd. (India), HYPERFINE (EE. UU.), Elekta AB (Suecia), Beijing Wandong Medical Technology Co.,Ltd (China), ASG Superconductors spa (Italia), entre otros. |
|
Oportunidades de mercado |
|
Definición del mercado de dispositivos de imágenes por resonancia magnética
Las máquinas de resonancia magnética (MRI) utilizan procedimientos que se utilizan principalmente en radiología para tomar fotografías de la anatomía y los procesos fisiológicos del cuerpo del paciente. Los tumores cerebrales, la esclerosis múltiple, los accidentes cerebrovasculares, las lesiones cerebrales, las anomalías del desarrollo, la demencia , las infecciones y las causas del dolor de cabeza se diagnostican con imágenes de MRI. El método de exploración de MRI es una herramienta de diagnóstico no invasiva que se utiliza para diagnosticar una amplia variedad de trastornos médicos.
Dinámica del mercado de dispositivos de imágenes por resonancia magnética
En esta sección se aborda la comprensión de los factores impulsores del mercado, las ventajas, las oportunidades, las limitaciones y los desafíos. Todo esto se analiza en detalle a continuación:
Conductores
- Aumento del número de lanzamientos de productos
Una de las tendencias importantes que prevalecen en el mercado es el creciente número de lanzamientos de productos en el sector de alta resistencia, junto con la creciente aceptación de estos sistemas de alta resistencia.
- Aumento de la incidencia de enfermedades crónicas y graves
Debido a la creciente frecuencia de prácticamente todas las formas de trastornos graves y crónicos, ha habido una necesidad constante de imágenes médicas en la situación médica moderna actual. Para diagnosticar, tratar y controlar eficazmente las enfermedades crónicas, es esencial una tecnología de imágenes eficaz y tecnológicamente sofisticada.
- Avances tecnológicos
Las mejoras técnicas en los equipos de diagnóstico por imagen son un factor clave que se prevé que contribuirá significativamente al crecimiento del mercado mundial. La introducción de la resonancia magnética abierta, que ayuda a obtener imágenes médicas eficaces de pacientes claustrofóbicos y con sobrepeso, es uno de los logros tecnológicos. Las mejoras en la intensidad de campo y la capacidad de procesamiento de los equipos de diagnóstico por imagen también forman parte de los avances técnicos.
Oportunidades
Además, la introducción de técnicas de imágenes por resonancia magnética y la creciente conciencia del diagnóstico precoz amplían las oportunidades rentables para los actores del mercado.
Restricciones/Desafíos
Por otra parte, se espera que el aumento del coste de los sistemas de resonancia magnética siga obstaculizando el mercado de dispositivos de resonancia magnética. Sin embargo, el creciente uso de productos de resonancia magnética renovados y reciclados podría suponer un reto adicional para el crecimiento del mercado en el período de previsión.
Este informe de mercado de dispositivos de imágenes por resonancia magnética proporciona detalles de nuevos desarrollos recientes, regulaciones comerciales, análisis de importación y exportación, análisis de producción, optimización de la cadena de valor, participación de mercado, impacto de los actores del mercado nacional y localizado, analiza oportunidades en términos de bolsillos de ingresos emergentes, cambios en las regulaciones del mercado, análisis estratégico del crecimiento del mercado, tamaño del mercado, crecimientos del mercado de categorías, nichos de aplicación y dominio, aprobaciones de productos, lanzamientos de productos, expansiones geográficas, innovaciones tecnológicas en el mercado. Para obtener más información sobre el mercado de dispositivos de imágenes por resonancia magnética, comuníquese con Data Bridge Market Research para obtener un informe de analista, nuestro equipo lo ayudará a tomar una decisión de mercado informada para lograr el crecimiento del mercado.
Impacto de COVID-19 en el mercado de dispositivos de imágenes por resonancia magnética
El COVID-19 tuvo un impacto negativo en el mercado de dispositivos de resonancia magnética debido a las interrupciones de la cadena de suministro y las restricciones impuestas por el gobierno. La llegada del COVID-19 ha obstaculizado la demanda de MRI debido a una caída en la producción de equipos de MRI. Como resultado de la epidemia de COVID-19, los actores clave en el mercado vieron una gran caída en los ingresos. La venta de equipos de MRI se vio influenciada por la reasignación de recursos de atención médica, la caída de las visitas de pacientes, las interrupciones de la cadena de suministro y otros factores importantes. Sin embargo, el mercado reanudará su crecimiento en la pospandemia debido a la flexibilización de las restricciones que se impusieron anteriormente.
Alcance del mercado de dispositivos de imágenes por resonancia magnética
El mercado de dispositivos de resonancia magnética está segmentado en función de la intensidad del campo, el tipo, la modalidad, la indicación, el usuario final y el canal de distribución. El crecimiento entre estos segmentos le ayudará a analizar los segmentos de crecimiento reducido de las industrias y brindará a los usuarios una valiosa descripción general del mercado y conocimientos del mercado para ayudarlos a tomar decisiones estratégicas para identificar las principales aplicaciones del mercado.
Intensidad de campo
- Sistemas de resonancia magnética de alto campo
- Sistemas de resonancia magnética de campo medio
- Sistemas de resonancia magnética de campo bajo
- Otros
Tipo
- Sistemas de resonancia magnética cerrados
- Resonancia magnética de diámetro amplio
- Sistemas de resonancia magnética abiertos
Modalidad
- Sistema estacionario
- Sistema portátil/móvil
- Sistema de punto de atención (POC)
Indicación
- Cerebro y neurología
- Músculoesquelético
- Cardiología
- Mamografía
- Oncología
- Pélvico y abdominal
- Ginecología
- Urología
- Dental
- Otros
Usuario final
- Hospitales
- Centros de diagnóstico
- Centros de imágenes
- Clínicas de especialidades
- Centros de cirugía ambulatoria
- Institutos académicos y de investigación
Canal de distribución
- Licitación directa
- Ventas al por menor
Análisis regional del mercado de dispositivos de imágenes por resonancia magnética
The magnetic resonance imaging devices market is analysed and market size insights and trends are provided by country, field strength, type, modality, indication, end user and distribution channel as referenced above.
The countries covered in the magnetic resonance imaging devices market report are U.S., Canada and Mexico in North America, Germany, France, U.K., Netherlands, Switzerland, Belgium, Russia, Italy, Spain, Turkey, Rest of Europe in Europe, China, Japan, India, South Korea, Singapore, Malaysia, Australia, Thailand, Indonesia, Philippines, Rest of Asia-Pacific (APAC) in the Asia-Pacific (APAC), Saudi Arabia, U.A.E, South Africa, Egypt, Israel, Rest of Middle East and Africa (MEA) as a part of Middle East and Africa (MEA), Brazil, Argentina and Rest of South America as part of South America.
North America dominates the magnetic resonance imaging devices market because of the rise in the utilization of magnetic resonance imaging equipment to diagnose diseases within the region. Furthermore, the growing prevalence of chronic diseases will further accelerate the growth of the magnetic resonance imaging devices market.
Asia-Pacific is expected to show significant amount of growth in the forecast period of 2024 to 2031 because of growing demand of MRI equipment. Moreover, the rapidly increasing analysis frequency and growing government initiative to raise awareness of the importance of analysis is further anticipated to boost the market growth.
The country section of the report also provides individual market impacting factors and changes in regulation in the market domestically that impacts the current and future trends of the market. Data points like down-stream and upstream value chain analysis, technical trends and porter's five forces analysis, case studies are some of the pointers used to forecast the market scenario for individual countries. Also, the presence and availability of global brands and their challenges faced due to large or scarce competition from local and domestic brands, impact of domestic tariffs and trade routes are considered while providing forecast analysis of the country data.
Magnetic Resonance Imaging Devices Market Share
The magnetic resonance imaging devices market competitive landscape provides details by competitor. Details included are company overview, company financials, revenue generated, market potential, investment in research and development, new market initiatives, global presence, production sites and facilities, production capacities, company strengths and weaknesses, product launch, product width and breadth, application dominance. The above data points provided are only related to the companies' focus related to magnetic resonance imaging devices market.
Magnetic Resonance Imaging Devices Market Leaders Operating in the Market Are:
- Aspect Imaging (Israel)
- CANON MEDICAL SYSTEMS CORPORATION (Japan)
- Siemens (Germany)
- General Electric Company (US)
- Hitachi, Ltd. (Japan)
- Koninklijke Philips N.V. (Netherlands)
- Neusoft Corporation (China)
- ESAOTE SPA (Italy)
- FONAR (US)
- Synaptive Medical (Canada)
- AllTech Medical Systems (US)
- United Imaging Intelligence (China)
- Medonica Co. LTD (South Korea)
- IMRIS (Canada)
- Promaxo (US)
- AURORA HEALTHCARE US CORP (US)
- SG HealthCare Pvt. Ltd. (India)
- HYPERFINE (US)
- Elekta AB (Sweden)
- Beijing Wandong Medical Technology Co.,Ltd (China)
- ASG Superconductors spa (Italy)
Latest Developments in Magnetic Resonance Imaging Devices Market
- In January 2019, In India, Koninklijke Philips N.V. unveiled new imaging system solutions, including Next MR Wave (Ingenia Ambition, Ingenia Elition). These MR technologies will provide clinicians with extensive information, allowing them to make accurate diagnoses. This development improved the company's product portfolio, allowing it to produce more income
SKU-
Obtenga acceso en línea al informe sobre la primera nube de inteligencia de mercado del mundo

- Panel de análisis de datos interactivo
- Panel de análisis de empresas para oportunidades con alto potencial de crecimiento
- Acceso de analista de investigación para personalización y consultas
- Análisis de la competencia con panel interactivo
- Últimas noticias, actualizaciones y análisis de tendencias
- Aproveche el poder del análisis de referencia para un seguimiento integral de la competencia
Metodología de investigación
La recopilación de datos y el análisis del año base se realizan utilizando módulos de recopilación de datos con muestras de gran tamaño. La etapa incluye la obtención de información de mercado o datos relacionados a través de varias fuentes y estrategias. Incluye el examen y la planificación de todos los datos adquiridos del pasado con antelación. Asimismo, abarca el examen de las inconsistencias de información observadas en diferentes fuentes de información. Los datos de mercado se analizan y estiman utilizando modelos estadísticos y coherentes de mercado. Además, el análisis de la participación de mercado y el análisis de tendencias clave son los principales factores de éxito en el informe de mercado. Para obtener más información, solicite una llamada de un analista o envíe su consulta.
La metodología de investigación clave utilizada por el equipo de investigación de DBMR es la triangulación de datos, que implica la extracción de datos, el análisis del impacto de las variables de datos en el mercado y la validación primaria (experto en la industria). Los modelos de datos incluyen cuadrícula de posicionamiento de proveedores, análisis de línea de tiempo de mercado, descripción general y guía del mercado, cuadrícula de posicionamiento de la empresa, análisis de patentes, análisis de precios, análisis de participación de mercado de la empresa, estándares de medición, análisis global versus regional y de participación de proveedores. Para obtener más información sobre la metodología de investigación, envíe una consulta para hablar con nuestros expertos de la industria.
Personalización disponible
Data Bridge Market Research es líder en investigación formativa avanzada. Nos enorgullecemos de brindar servicios a nuestros clientes existentes y nuevos con datos y análisis que coinciden y se adaptan a sus objetivos. El informe se puede personalizar para incluir análisis de tendencias de precios de marcas objetivo, comprensión del mercado de países adicionales (solicite la lista de países), datos de resultados de ensayos clínicos, revisión de literatura, análisis de mercado renovado y base de productos. El análisis de mercado de competidores objetivo se puede analizar desde análisis basados en tecnología hasta estrategias de cartera de mercado. Podemos agregar tantos competidores sobre los que necesite datos en el formato y estilo de datos que esté buscando. Nuestro equipo de analistas también puede proporcionarle datos en archivos de Excel sin procesar, tablas dinámicas (libro de datos) o puede ayudarlo a crear presentaciones a partir de los conjuntos de datos disponibles en el informe.

